no more white gloves - blank...
TRANSCRIPT

NO MORE WHITE GLOVESCleaning Monitoring in Healthcare Today
© 3M 2011. All Rights Reserved.

NO MORE WHITE GLOVES
Cleaning Monitoring in Healthcare Today
• Mario Perella, CBSPD
• Field Technical Service Specialist
© 3M 2011. All Rights Reserved.2
• Field Technical Service Specialist
• Northeast US Region
Infection Prevention Division
3M Healthcare

Upon Completion of this program, the participant
will be able to:
• Describe how environmental pathogens are transmitted to patients and healthcare workers.
• Evaluate if an environmental surface is at risk for environmental contamination.
• Describe which MDRO’s are most often found on
© 3M 2011. All Rights Reserved.3
• Describe which MDRO’s are most often found on environmental surfaces.
• Describe the current methods used to monitor environmental cleaning.
• Evaluate if a cleaning monitoring program can be used to support an infection prevention program.

Hospital Acquired Infections (HAI) persist and are costly• 5%-10% of inpatients acquire infections during their hospital stay*• 2 million infected per year in the United States • 90,000 deaths attributed to HAI• $5 ~ $50 billion additional cost to HC system
Center for Medicaid & Medicare (CMS) is pushing to classify HAI conditions in order to not reimburse f or
Hospital Acquired Infections
Increased total cost per patient who survived approximately $40,000
© 3M 2011. All Rights Reserved.4
classify HAI conditions in order to not reimburse f or “preventable” hospital charges
New laws (state/federal) are requiring greater repo rting of HAI
Research is providing more insight into infections and the role of the environment
*Burke JP. Infection control – a problem for patient safety. NEJM 2003; 348: 651-656

Institute for Healthcare Improvement (IHI)Guidelines for Combating Multi-Drug Resistant Organisms (MDROs)
Recommended interventions useful in reducing transmission of organisms resistant to multiple dru gs
© 3M 2011. All Rights Reserved.5
Isolationof
Carriers
HandHygiene
Detection of
Carriers
Disinfection of the
Environment
http:www.ihi.org.ihi

Cleaning Cleaning –– Why?Why?MRSA, VRE,C DIFF, A .bauminii
nose, toes or remote control HCW or patient
© 3M 2011. All Rights Reserved.6
sneezing, coughing, mosquito bite, bodily fluids
Break the chain of transmission

US Historical Perspective on the Role of the Environment in Transmission of HAIs
• Routine culturing of surfaces and air in hospital environment was common prior to 1970’s
• US Center for Disease Control and Prevention (CDC) and American Hospital Assn (AHA) recommended
© 3M 2011. All Rights Reserved.7
American Hospital Assn (AHA) recommended discontinuation of routine environmental culturing.
• Labor Intensive, Lacked sensitivity
• Lack of reliable data for horizontal transmission from contaminated surfaces
• No standards
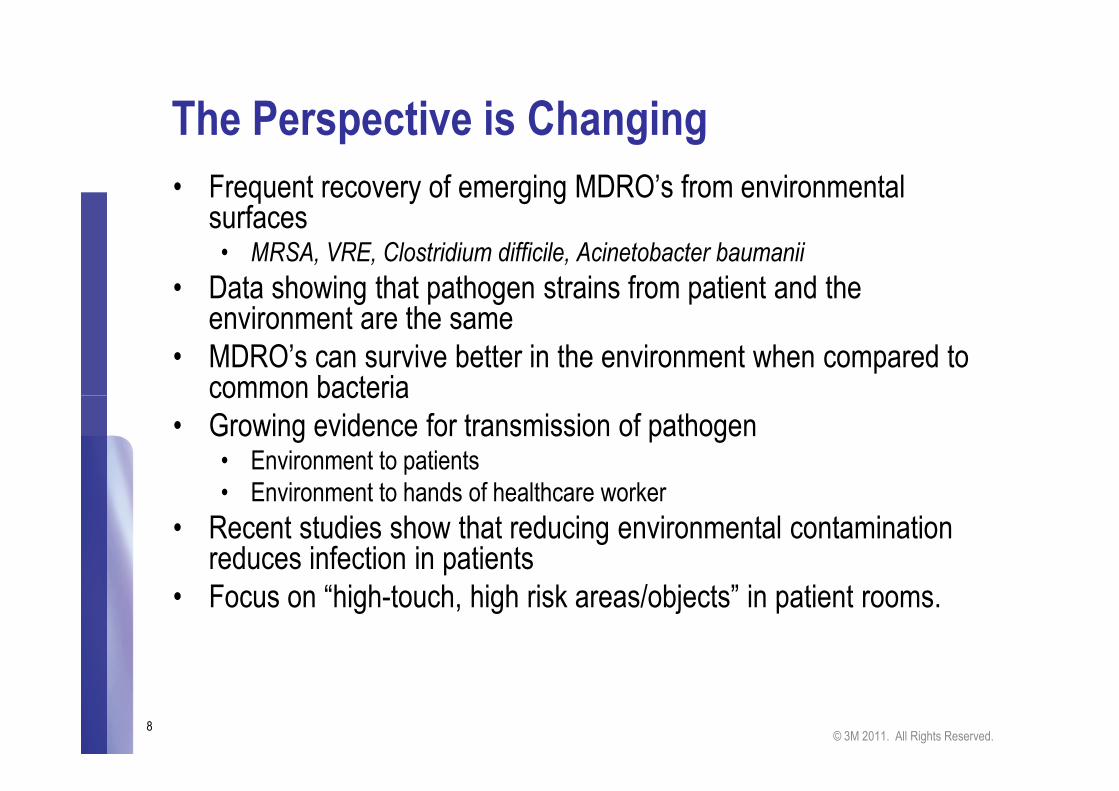
The Perspective is Changing
• Frequent recovery of emerging MDRO’s from environmental surfaces • MRSA, VRE, Clostridium difficile, Acinetobacter baumanii
• Data showing that pathogen strains from patient and the environment are the same
• MDRO’s can survive better in the environment when compared to common bacteria
© 3M 2011. All Rights Reserved.8
common bacteria• Growing evidence for transmission of pathogen
• Environment to patients• Environment to hands of healthcare worker
• Recent studies show that reducing environmental contamination reduces infection in patients
• Focus on “high-touch, high risk areas/objects” in patient rooms.

Where do you find MDRO’s?
A. baumanii
• Stretcher
• Sink
• Blood pressure cuffs
VRE
• Bedside rails
• Bedside tables
• Blood pressure cuffs
© 3M 2011. All Rights Reserved.9
• Blood pressure cuffs
• Door handle
• Mattress
• Curtains
• Respiratory care equipment
• Paper towel dispenser
• Shelving
• Hayden MK SHEA 2007
• Blood pressure cuffs
• Toilets, toilet rails
• TV remotes
• Floors
• Intravenous pumps
• Bed control buttons
• Nurse call buttons
• Duckro AN Arch Intern Med 2005; 165:304

Where do you find MDRO’s?
C. difficile • Bedside rails
• Beside Tables
• Bed sheets
• Call buttons
• Toilet Seat
• Bathroom Door Handle
MRSA• Bedside rails
• Bedside tables
• Blood pressure cuffs
• Patient gowns
• Bed linen
• Bathroom Door Handle
© 3M 2011. All Rights Reserved.10
• Bathroom Door Handle
• Window sill
• Commodes
• Room Floors
• Toilet Floors
Samore MH et al Am J Med 1996; 100:32
Fekety R et al Am J Med 1981; 70:906
McFarland L et al NEJM 1989; 320:204
Struelens MJ et al Am J Med 1991; 91 (S3B):138S
McFarland LJ ICHE 2002; 23:639
Dubberke ER et al AJIC 2007; 35:315
Verity P et al J Hosp Infect 2001; 49:204
• Bathroom Door Handle
Boyce JM et al ICHE 1997; 18:622
Sexton T et al J Hosp Infect 2006; 62:187
Boyce JM et al ICHE 2007; 28:1142
Bhalla A et al ICHE 2004; 25:164
Dancer SJ Lancet Infect Dis 2008; 8:101
Boyce JM et al J Hosp Infect 2007; 65(S2):50
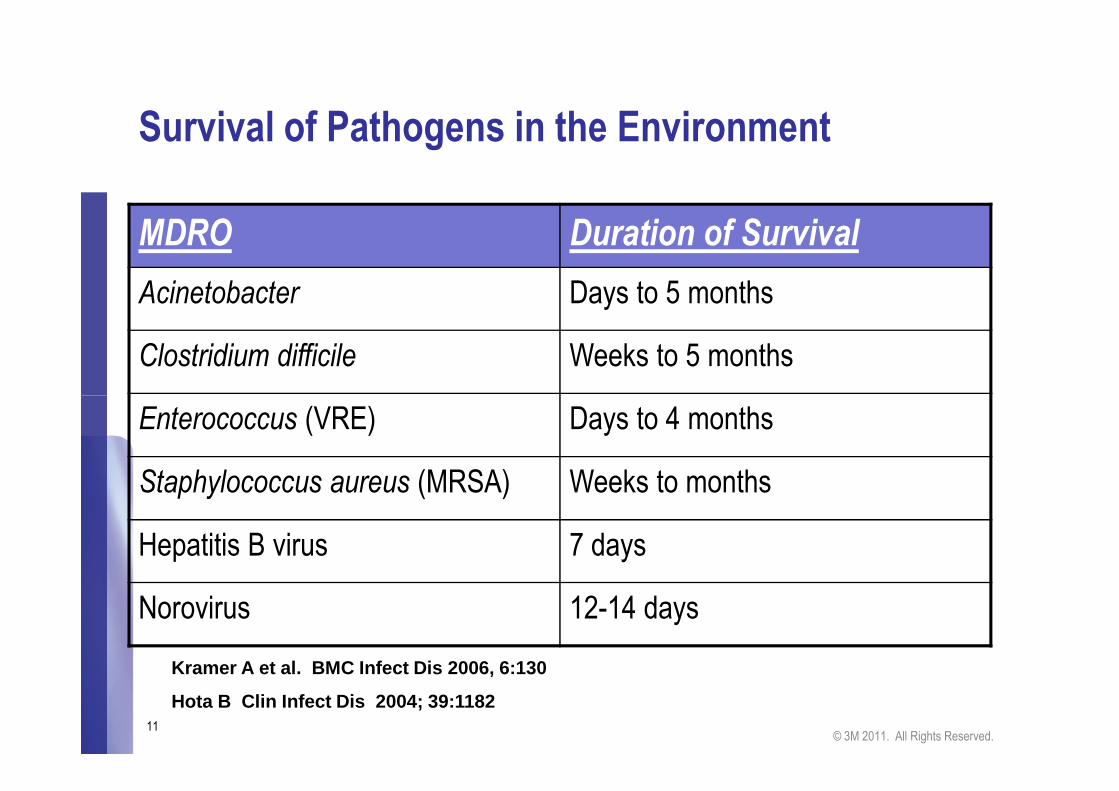
Survival of Pathogens in the Environment
MDRO Duration of Survival
Acinetobacter Days to 5 months
Clostridium difficile Weeks to 5 months
© 3M 2011. All Rights Reserved.11
Enterococcus (VRE) Days to 4 months
Staphylococcus aureus (MRSA) Weeks to months
Hepatitis B virus 7 days
Norovirus 12-14 days
Kramer A et al. BMC Infect Dis 2006, 6:130
Hota B Clin Infect Dis 2004; 39:1182
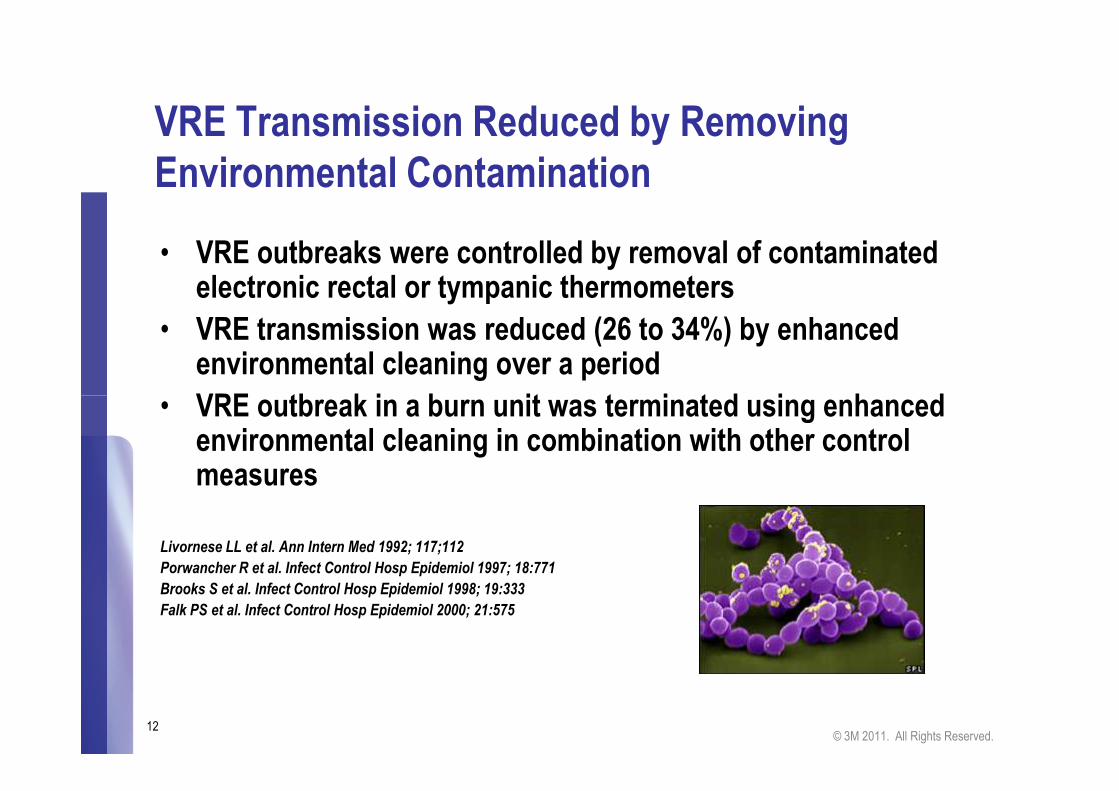
VRE Transmission Reduced by Removing
Environmental Contamination
• VRE outbreaks were controlled by removal of contaminated electronic rectal or tympanic thermometers
• VRE transmission was reduced (26 to 34%) by enhanced environmental cleaning over a period
• VRE outbreak in a burn unit was terminated using enhanced
© 3M 2011. All Rights Reserved.12
• VRE outbreak in a burn unit was terminated using enhanced environmental cleaning in combination with other control measures
Livornese LL et al. Ann Intern Med 1992; 117;112
Porwancher R et al. Infect Control Hosp Epidemiol 1997; 18:771
Brooks S et al. Infect Control Hosp Epidemiol 1998; 19:333
Falk PS et al. Infect Control Hosp Epidemiol 2000; 21:575

Standards and Guidelines
• A real lack of standards and guidelines for Cleaning Monitoring for Environmental Surfaces
• Environmental cleaning regimens are not standardized or regulated and monitoring of cleaning efficacy is generally based on visual assessment.
© 3M 2011. All Rights Reserved.13
assessment.
• There are Guidelines/Recommendations from Professional Associations on the Verification of Cleaning as part of the Quality Processes.

Recognized Need for Better Monitoring of
Environmental Cleaning Practices
• From CDC “Monitor cleaning performance to ensure consistent cleaning and disinfection of surfaces . . .(1)”
• SHEA/IDSA recommends “A system for monitoring
© 3M 2011. All Rights Reserved.14
• SHEA/IDSA recommends “A system for monitoring adherence to environmental cleaning and disinfectionprotocols is desirable.”
1. Management of Multi-Drug Resistant Organisms in Healthcare Settings, 2006. HICPAC guideline available at:www.cdc.gov/ncidod/dhqp/pdf/ar/mdroGuideline2006.pdf**
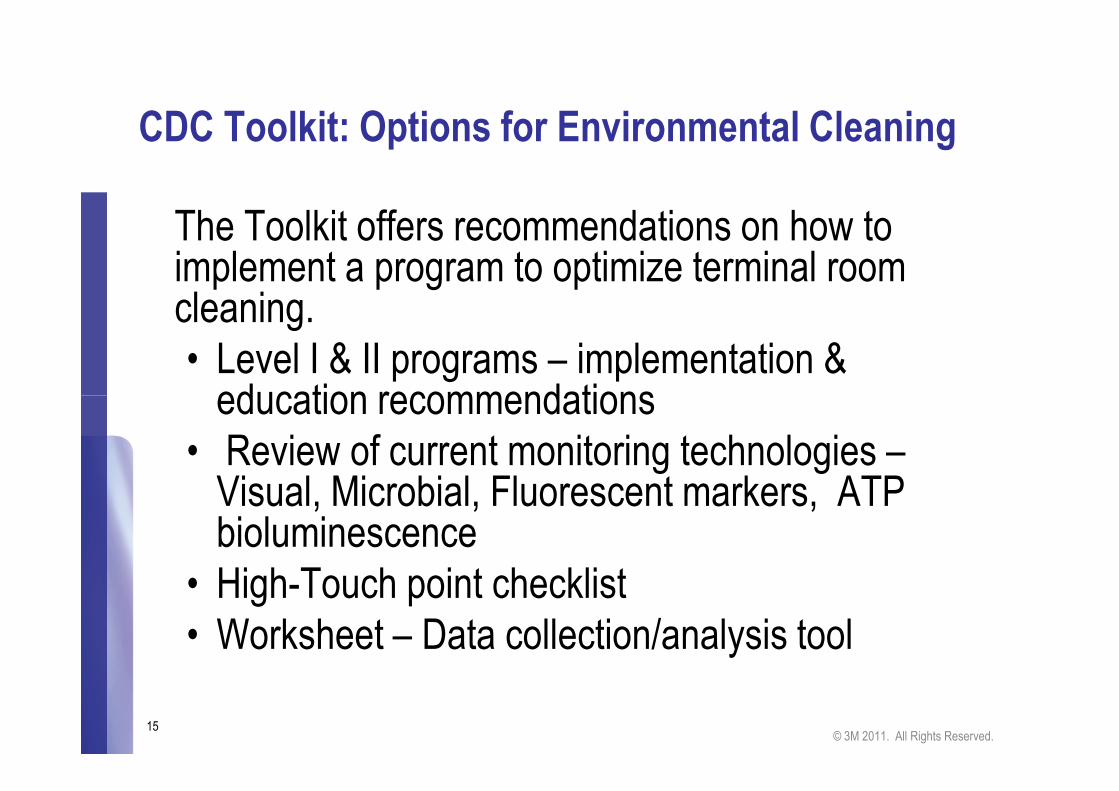
CDC Toolkit: Options for Environmental Cleaning
The Toolkit offers recommendations on how to implement a program to optimize terminal room cleaning.• Level I & II programs – implementation & education recommendations
© 3M 2011. All Rights Reserved.15
education recommendations• Review of current monitoring technologies –Visual, Microbial, Fluorescent markers, ATP bioluminescence
• High-Touch point checklist• Worksheet – Data collection/analysis tool

CDC Toolkit: Options for Environmental Cleaning.
• “In view of the evidence that transmission of many healthcare acquired pathogens (HAPs) is related to contamination of near-patient surfaces and equipment, all hospitals are encouraged to develop programs to optimize
© 3M 2011. All Rights Reserved.16
encouraged to develop programs to optimize the thoroughness of high touch surface cleaning as part of terminal room cleaning at the time of discharge or transfer of patients.”
• http://www.cdc.gov/HAI/toolkits/Evaluating-Environmental-Cleaning.html

© 3M 2011. All Rights Reserved.18

Monitoring means:
Check, supervise, watch, keep track of….
How do we monitor environmental cleaning?
• Visual Inspection
© 3M 2011. All Rights Reserved.19
• Visual Inspection
• Aerobic Colony Counts (ACC)
• Fluorescent Dyes/Powders/Gel
• ATP Bioluminescence
Current Standard Practice:
Visual Examination
• Visual assessment is not an accurate measure of surface cleanliness nor of
© 3M 2011. All Rights Reserved.20
measure of surface cleanliness nor of microbial contamination. It can be a misleading measure of cleaning efficacy.
Boyce et al. Monitoring the Effectiveness of Hospital Cleaning Practices by Use of an Adenosine TriphosphateBioluminescence Assay Infection Control and Hospital Epidemiology. July 2009, 30: 678-684.

Just because it looks clean….
does not mean it is clean.
•You can’t see biofilm or microbes•You can’t see biological residues
© 3M 2011. All Rights Reserved.21

Fluorescent Powders/Lotions/Gels
• UV fluorescent molecules are incorporated into water soluble gels , powders or lotions and used to mark an environmental surface.
• The surface is cleaned and then re-inspected by using a UVA
© 3M 2011. All Rights Reserved.22
• The surface is cleaned and then re-inspected by using a UVA light. The removal or partial removal of the fluorescent marker indicates if a surface has been wiped.
• Generate Qualitative Results: Has the surface been wiped? Yes/No
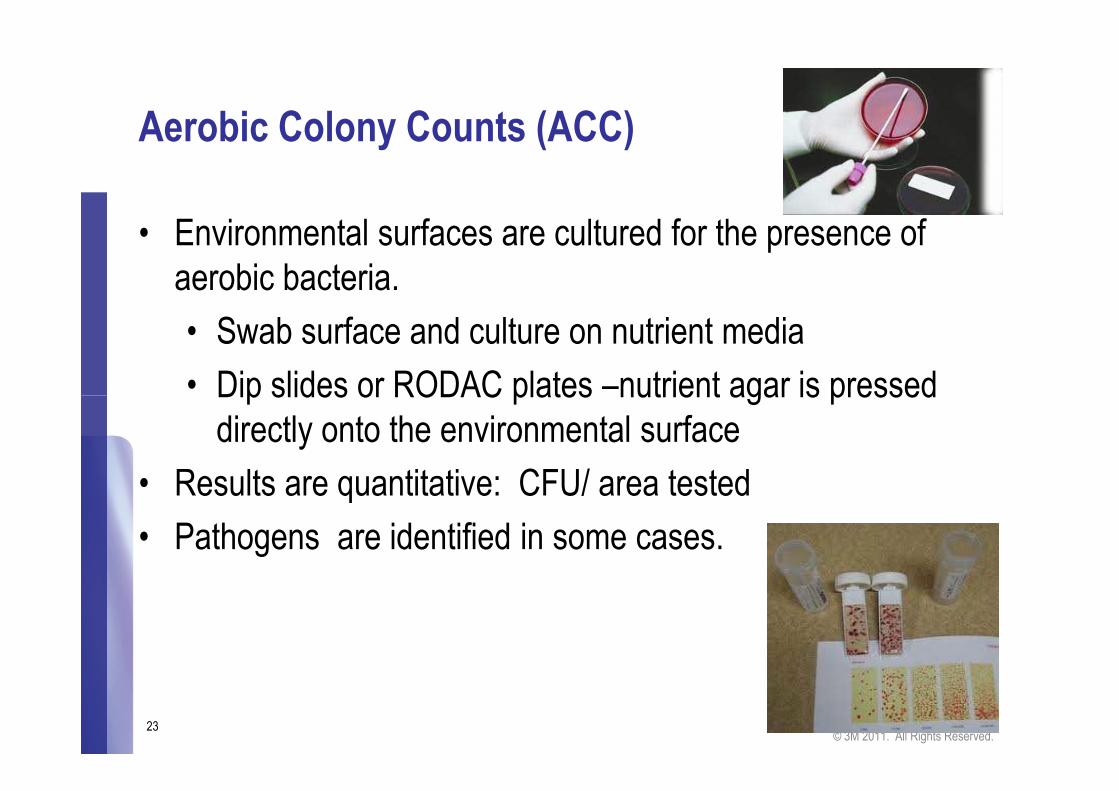
Aerobic Colony Counts (ACC)
• Environmental surfaces are cultured for the presence of aerobic bacteria.
• Swab surface and culture on nutrient media
• Dip slides or RODAC plates –nutrient agar is pressed
© 3M 2011. All Rights Reserved.23
• Dip slides or RODAC plates –nutrient agar is pressed directly onto the environmental surface
• Results are quantitative: CFU/ area tested
• Pathogens are identified in some cases.

© 3M 2011. All Rights Reserved.24

Adenosine Tri-phosphate (ATP) Bioluminescence
• ATP is present in all living organisms – animal, plant, microorganisms, human secretions and excretions.
• Contaminated surfaces show high levels of ATP, clean surfaces show low ATP levels.
© 3M 2011. All Rights Reserved.25
surfaces show low ATP levels.
• The surface is swabbed and the ATP levels measured in a luminometer
• Results are quantitative: ATP bioluminescence
is measured in Relative Light Units
• Benchmark RLU levels used to define
“clean”

Detecting ATP
In cells, ATP loses one or more phosphates to release energy
© 3M 2011. All Rights Reserved.26
Fire-fly Luciferase harnesses this energy to produce Light
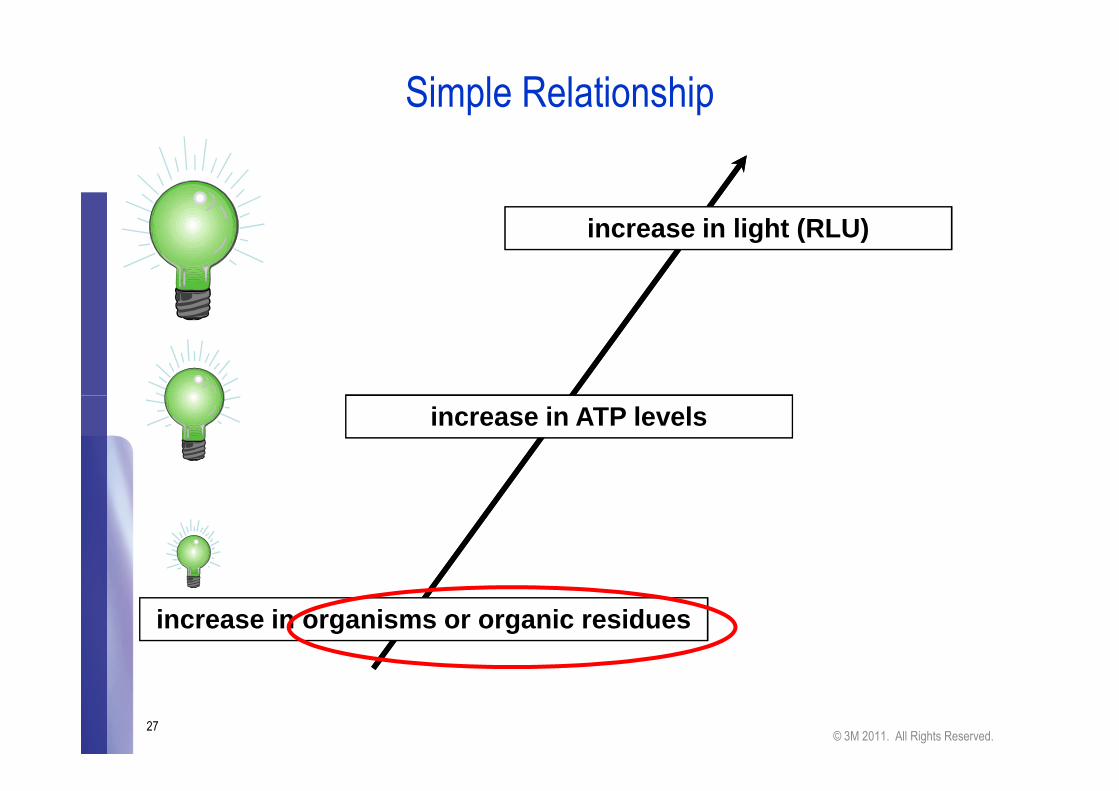
Simple Relationship
increase in light (RLU)
© 3M 2011. All Rights Reserved.27
increase in organisms or organic residues
increase in ATP levels

ATP Testing Attributes
ATP is present in every living cell; every microbe, human cell and plant cell contributes to the signal
• Tests are simple to perform
• Poor cleaning leaves sufficient ATP to register a clear
© 3M 2011. All Rights Reserved.28
• Poor cleaning leaves sufficient ATP to register a clear signal
• Results are quantitative and linear with respect to ATP\
• Results are immediately available – no days long wait for results
• The fact that ATP is present in every living organism makes it a great marker for cleanliness.

Please keep this in mind…..
• RLU does not equal CFU
• In pure lab cultures, correlations are beautiful!
• In the “real world” it’s a mixed culture
• Bigger cells have more ATP’
• ATP levels vary with the metabolic state of the cell
© 3M 2011. All Rights Reserved.29
• ATP levels vary with the metabolic state of the cell• Spores do not have ATP as they are not metabolically active
• Many environmental bacteria do not grow under “normal” culture conditions.
• Flocculent groups/bio-film chunks = 1 CFU
• Contributions to ATP readings come from non-bacterial sources (skin cells, blood, food residue, plants)

• Data from luminometer is transferred to the computer
• Ability to monitor trends
Most ATP monitoring devices have software
© 3M 2011. All Rights Reserved.30

© 3M 2011. All Rights Reserved.31

TEST PLAN LOCATION: Operating Room 2 - Post Terminal Cleaning 4/28/2011
TEST POINT OR #1 OR #2 OR #3 OR #4
Main Light Handle 1324 71 271 404
Smaller Light Handle 1246 118 90 320
Leads 2822 223 840 973
Pulse Ox 1088 1321 513 ####
Door Handles 2152 1759 307 1131
Telephone 1417 717 1456 223 EXAMPLE "RLU" LEVELS - PASS/CAUTION/FAIL
Anesthesia Machine 64 139 75 22 PASS LESS THAN 500 RLU
Bovie Buttons 3434 287 173 475 CAUTION 501 - 999 RLU
Anesthesia Monitor 4299 1396 990 1016 FAIL GREATER THAN 1000 RLU
Storage Cabinets 1450 534 743 460
© 3M 2011. All Rights Reserved.32
Storage Cabinets 1450 534 743 460
Table Controls 856 612 1548 ####
Side rail clamps 347 299 421 665
Light switches 797 528 178 199
Tourniquets N/A 4363N/A 1985
Computer Keyboards 1800 1130 772 1464
Metal parts of Seat Belts 1087 507 1173 1965
Sterilizers N/A 125N/A 82
Warming Cabinets N/A 1265N/A 984
Pyxis Keyboard/Monitor 6340 1452 776N/A
Fracture Table Handles N/A 3203N/A N/A
Fracture Table Post Hole N/A 5597N/A N/A

• Have important surfaces been wiped?• Visual Inspection/Checklist• Fluorescent powder/lotion/gel
Which monitoring method is best?
Depends on the question asked.
© 3M 2011. All Rights Reserved.33
• Is the surface “clean”?• Aerobic colony counts• Adenosine triphosphate (ATP) bioluminescence assay
Malik et al Am J Inf Cont 2003;31:181Sherlock et al J Hosp Inf 2009
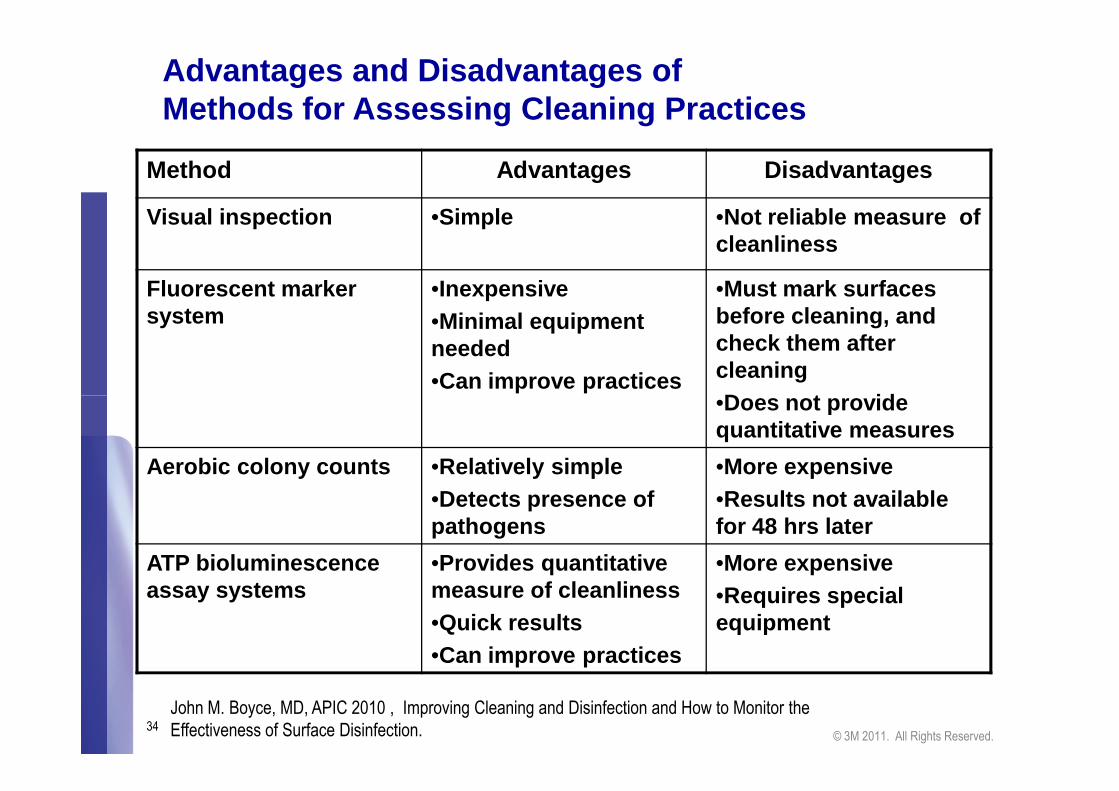
Advantages and Disadvantages of Methods for Assessing Cleaning Practices
Method Advantages Disadvantages
Visual inspection •Simple •Not reliable measure of cleanliness
Fluorescent marker system
•Inexpensive•Minimal equipment needed•Can improve practices
•Must mark surfaces before cleaning, and check them after cleaning•Does not provide
© 3M 2011. All Rights Reserved.34
•Does not provide quantitative measures
Aerobic colony counts •Relatively simple•Detects presence of pathogens
•More expensive •Results not available for 48 hrs later
ATP bioluminescence assay systems
•Provides quantitative measure of cleanliness•Quick results•Can improve practices
•More expensive•Requires special equipment
John M. Boyce, MD, APIC 2010 , Improving Cleaning and Disinfection and How to Monitor the Effectiveness of Surface Disinfection.
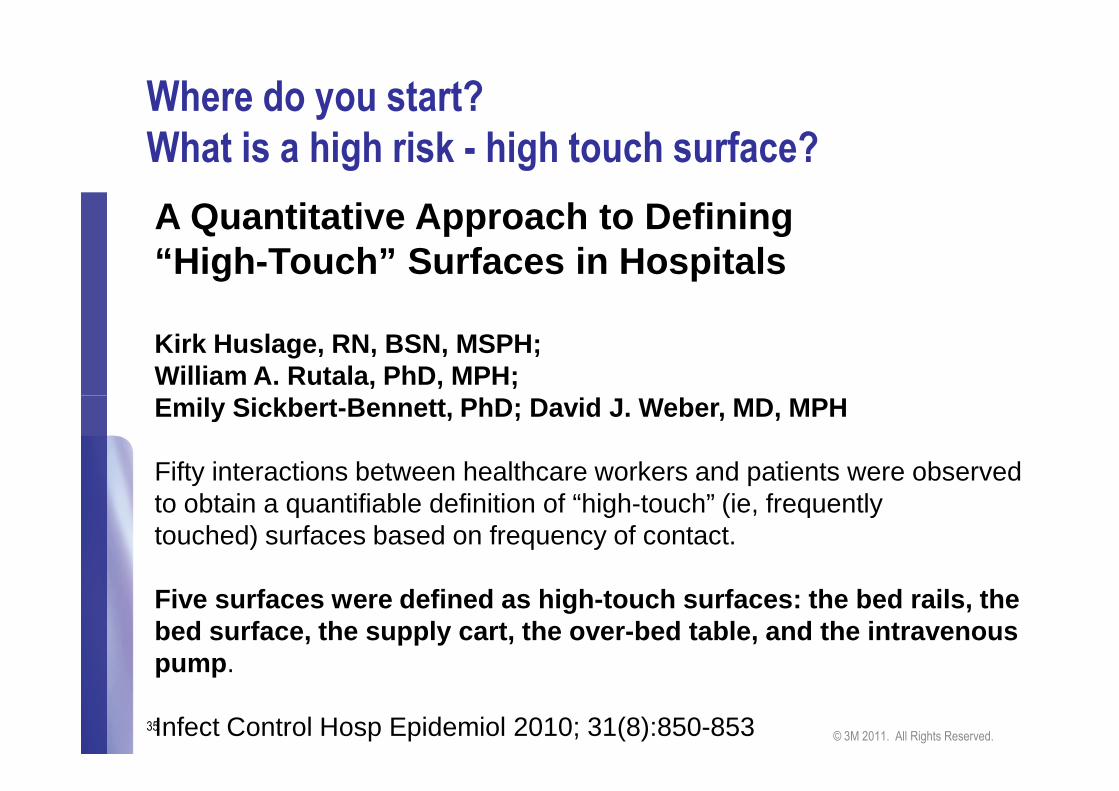
Where do you start?
What is a high risk - high touch surface?
A Quantitative Approach to Defining“High -Touch” Surfaces in Hospitals
Kirk Huslage, RN, BSN, MSPH;William A. Rutala, PhD, MPH;Emily Sickbert -Bennett, PhD; David J. Weber, MD, MPH
© 3M 2011. All Rights Reserved.35
Emily Sickbert -Bennett, PhD; David J. Weber, MD, MPH
Fifty interactions between healthcare workers and patients were observedto obtain a quantifiable definition of “high-touch” (ie, frequentlytouched) surfaces based on frequency of contact.
Five surfaces were defined as high-touch surfaces: the bed rails, the bed surface, the supply cart, the over-bed table, a nd the intravenous pump .
Infect Control Hosp Epidemiol 2010; 31(8):850-853

CDC Guidelines for Multiple-Drug Resistant Organisms
Monitoring
V.B.8 Enhanced environmental measures
V.B.8.c. Monitor (i.e., supervise and inspect) cleaning performance to ensure consistent cleaning and disinfection of surfaces in close proximity to the patient
© 3M 2011. All Rights Reserved.36
disinfection of surfaces in close proximity to the patient and those likely to be touched by the patient and HCP (e.g. bedrails, carts, bedside commodes, doorknobs, faucet handles.) Category 1BStrongly recommended for implementation and supported by some experimental, clinical or epidemiologic studies and strong theoretical rationale.
www.cdc.gov.ncidod/dhqp/gl_environinfection.html
Monitoring the efficacy of environmental
cleaning in healthcare facilities: A review
© 3M 2011. All Rights Reserved.37
cleaning in healthcare facilities: A review
of three studies.

Improving Cleaning Practices
by Using Fluorescent Marker SystemCarling PC et al. ICHE 2008;29:1035
• Study performed in 36 acute-care hospitals
• Fluorescent markers covertly applied to environmental surfaces before terminal room disinfection
• Surfaces checked with UVA light 60
70
80
Per
cent
of O
bjec
ts
© 3M 2011. All Rights Reserved.38
• Surfaces checked with UVA light after terminal cleaning
• Intervention included providing housekeepers with performance feedback
RESULT:
• Percent of objects cleaned� Before intervention: 47%� After interventions: 76 - 92%
0
10
20
30
40
50
60
Per
cent
of O
bjec
ts
Cle
aned
Baseline Post-Intervention

Is it really clean? An Evaluation of the Efficacy of Four Methods for Determining Hospital Cleanliness.Sherlock et al. Journal of Hospital Infection 2009. 72:140-146
• Objective – Answer the following question: Is visual assessment a sufficient means of monitoring cleaning efficacy? Four methods were used to monitor cleaning:
© 3M 2011. All Rights Reserved.39
efficacy? Four methods were used to monitor cleaning:
• Visual assessment, Aerobic colony counts, presence of MRSA and ATP
• Study design – Using each of the four assessment methods, the surface cleanliness of 10 environmental surfaces was compared before and after cleaning in two wards (medical and surgical).

• Visual assessments alone did not always provide a meaningful measure of surface cleanliness or cleaning efficacy
• The use of ATP to monitor cleaning efficacy is a sensitive test that reports not just the presence of microbiological, but also any organic, contamination.
Results
© 3M 2011. All Rights Reserved.40
but also any organic, contamination.
• ACCs are a good indicator of general bioburden in an environment, but they are slow to process.

Sherlock et al. Summary
• “Visual methods to evaluate cleanliness are subjective and inadequate.”
• “As standard methods for the isolation of micro-organisms
© 3M 2011. All Rights Reserved.41
• “As standard methods for the isolation of micro-organisms from the hospital, environment have not been established, and as organism recovery is often low or absent, the use of rapid methods such as ATP bioluminescence monitoring
in a hospital setting should be considered in conjunction with visual methods.”

Monitoring Daily Cleaning Practices Using an ATP Bioluminescence AssayBoyce JM et al. ICHE 2009;30:678
• Objective - To evaluate the usefulness of an adenosine triphosphate (ATP) bioluminescence assay for assessing the efficacy of daily hospital cleaning practices.
• Study design - A 2-phase prospective intervention study at
© 3M 2011. All Rights Reserved.42
• Study design - A 2-phase prospective intervention study at a university-affiliated community teaching hospital.
• Conclusions - Suboptimal cleaning practices were documented by determining aerobic colony counts and by use of an ATP bioluminescence assay. ATP readings provided quantitative evidence of improved cleanliness
of high-touch surfaces after the implementation of an
intervention program.
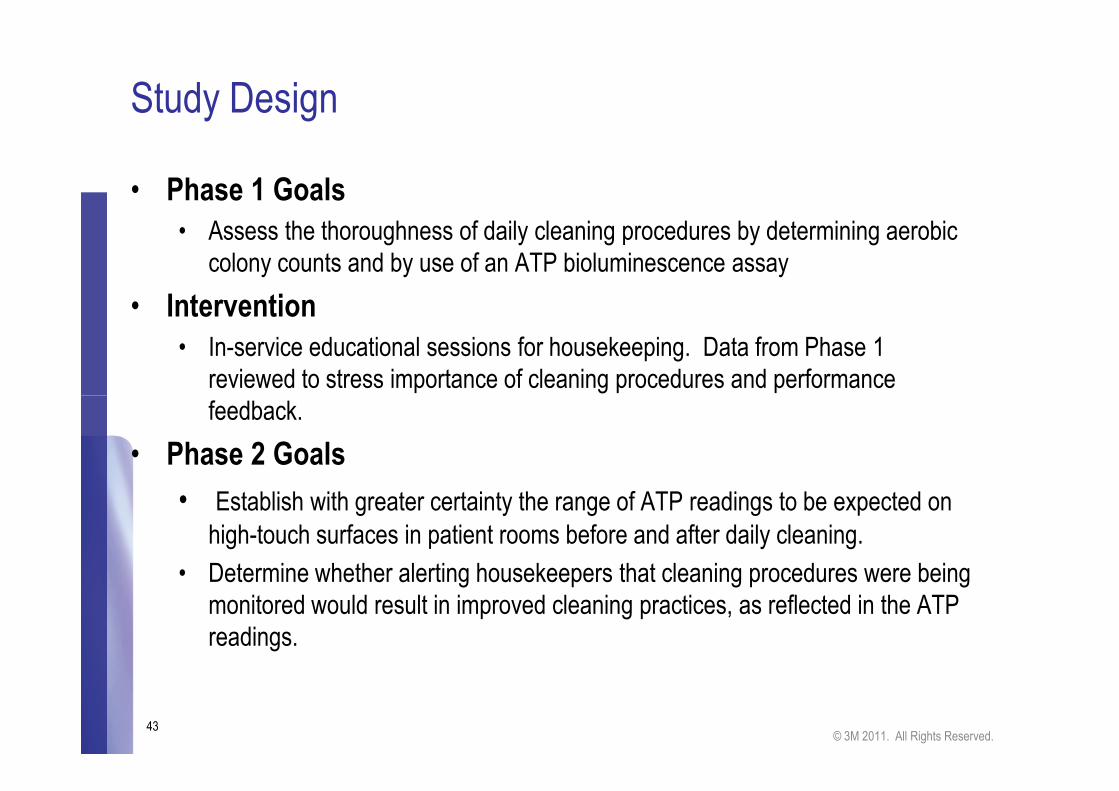
Study Design
• Phase 1 Goals
• Assess the thoroughness of daily cleaning procedures by determining aerobic colony counts and by use of an ATP bioluminescence assay
• Intervention
• In-service educational sessions for housekeeping. Data from Phase 1 reviewed to stress importance of cleaning procedures and performance feedback.
© 3M 2011. All Rights Reserved.43
feedback.
• Phase 2 Goals
• Establish with greater certainty the range of ATP readings to be expected on
high-touch surfaces in patient rooms before and after daily cleaning.
• Determine whether alerting housekeepers that cleaning procedures were being monitored would result in improved cleaning practices, as reflected in the ATP readings.

Median Relative Light Unit Readings,After Daily Cleaning, Phases I and II
400
500
600
700
800
Rel
ativ
e Li
ght U
nits
P < .001 < 0.001 .02 .002 .87
© 3M 2011. All Rights Reserved.44
0
100
200
300
Rel
ativ
e Li
ght U
nits
Bedrail OverbedTable
TVRemote
Grab bar ToiletSeat
Phase I Phase II

Monitoring Cleaning EffectivenessHow can this be used in your hospital?
• To Improve cleaning/disinfection practices in hospitals
• You need a plan that includes:
• Developing detailed protocols, educating housekeepers. monitoring cleaning and providing feedback to housekeepers
You need to decide which method best answers your most
© 3M 2011. All Rights Reserved.45
You need to decide which method best answers your most important questions:
• Has a surface been wiped? Visual assessment, fluorescent markers
• Is the surface clean? ATP bioluminescence assay systems aerobic colony counts, Quantitative Monitoring cleaning practices can help establish
the effectiveness of new technologies for “area decontamination”

Summary
• MDRO pathogens survive in the environment leading to increased environmental contamination
• Environmental contamination may lead to direct transmission of MDRO to patients and HCWs
• Transmission of pathogens can be reduced by increased cleaning.
• Current recommended practices describe cleaning monitoring as part of a quality control program
© 3M 2011. All Rights Reserved.46
part of a quality control program
• The standard practice of visual assessment is no longer adequate for the monitoring of cleaning efficacy
• Visual assessment, fluorescent powders/lotions/gels, aerobic colony counts and ATP bioluminescence are all currently used to monitor cleaning protocols.
• Together with educational interventions, monitoring technologies can be used to increase the efficacy of and compliance with cleaning protocols.

© 3M 2011. All Rights Reserved.47

Thank You
© 3M 2010. All Rights Reserved.48
Thank You