no difference in cross-modal attention or sensory ... 2016 no... · no difference in cross-modal...
TRANSCRIPT

Seediscussions,stats,andauthorprofilesforthispublicationat:https://www.researchgate.net/publication/290435440
NoDifferenceinCross-ModalAttentionorSensoryDiscriminationThresholdsinAutismandMatchedControls(2016)
ArticleinVisionResearch·March2016
ImpactFactor:1.82·DOI:10.1016/j.visres.2016.02.001
READS
95
7authors,including:
LaurieMHeller
CarnegieMellonUniversity
38PUBLICATIONS497CITATIONS
SEEPROFILE
IlanDinstein
Ben-GurionUniversityoftheNegev
48PUBLICATIONS1,565CITATIONS
SEEPROFILE
NancyMinshew
UniversityofPittsburgh
311PUBLICATIONS19,985CITATIONS
SEEPROFILE
MarleneBehrmann
CarnegieMellonUniversity
320PUBLICATIONS11,009CITATIONS
SEEPROFILE
Allin-textreferencesunderlinedinbluearelinkedtopublicationsonResearchGate,
lettingyouaccessandreadthemimmediately.
Availablefrom:SarahMHaigh
Retrievedon:24June2016

Vision Research 121 (2016) 85–94
Contents lists available at ScienceDirect
Vision Research
journal homepage: www.elsevier .com/locate /v isres
No difference in cross-modal attention or sensory discriminationthresholds in autism and matched controls
http://dx.doi.org/10.1016/j.visres.2016.02.0010042-6989/� 2016 Elsevier Ltd. All rights reserved.
⇑ Corresponding author at: Clinical Neurophysiology Research Laboratory,Department of Psychiatry, School of Medicine, University of Pittsburgh and UPMC,Suite 420 Oxford Building, 3501 Forbes Avenue, Pittsburgh, PA 15212, USA.
E-mail address: [email protected] (S.M. Haigh).
Sarah M. Haigh a,⇑, David J. Heeger b, Laurie M. Heller a, Akshat Gupta a, Ilan Dinstein c, Nancy J. Minshew d,Marlene Behrmann a
aDepartment of Psychology and Center for the Neural Basis of Cognition, Carnegie Mellon University, 5000 Forbes Avenue, Pittsburgh, PA 15213, USAbDepartment of Psychology and Center for Neural Science, New York University, 6 Washington Place, New York, NY 10003, USAcPsychology Department, Ben-Gurion University of the Negev, 653, Beer-Sheva 84105, IsraeldDepartments of Psychiatry & Neurology, University of Pittsburgh, Pittsburgh, PA 15213, USA
a r t i c l e i n f o
Article history:Received 7 October 2015Received in revised form 2 February 2016Accepted 22 February 2016
Keywords:AutismVisionAuditionAttention
a b s t r a c t
Autism has been associated with abnormalities in sensory and attentional processing. Here, we assessedthese processes independently in the visual and auditory domains using a visual contrast-discriminationtask and an auditory modulation-depth discrimination task. To evaluate changes in sensory function byattention, we measured behavioral performance (discrimination accuracy) when subjects were cued toattend and respond to the same stimulus (frequent valid cue) or cued to attend to one stimulus andrespond to the non-cued stimulus (infrequent invalid cue). The stimuli were presented at threshold toensure equal difficulty across participants and groups. Results from fifteen high-functioning adult indi-viduals with autism and fifteen matched controls revealed no significant differences in visual or auditorydiscrimination thresholds across groups. Furthermore, attention robustly modulated performance accu-racy (performance was better for valid than invalid cues) in both sensory modalities and to an equivalentextent in both groups. In conclusion, when using this well-controlled method, we found no evidence ofatypical sensory function or atypical attentional modulation in a group of high functioning individualswith clear autism symptomatology.
� 2016 Elsevier Ltd. All rights reserved.
1. Introduction
Autism is characterized by a range of atypical behaviors includ-ing sensory hypo- and/or hyper-sensitivities (Diagnostic and Sta-tistical Manual 5th edition, DSM-5). One possible explanation isthat alterations in sensory sensitivities may be due to abnormalattentional processes, which may cause individuals with autismto become overly fixated on a stimulus (Baron-Cohen, Ashwin,Ashwin, Tavassoli, & Chakrabarti, 2009; Liss, Saulnier, Fein, &Kinsbourne, 2006) or easily distracted by other stimuli (Burack,1994; Murphy, Foxe, Peters, & Molholm, 2014). Alternatively,altered sensory sensitivities may be the product of intrinsic differ-ences in the function of the sensory systems themselves (Meilleur,Berthiaume, Bertone, & Mottron, 2014), for example, alteredsignal-to-noise ratios in sensory signals (Rubenstein &Merzenich, 2003; Milne, 2011; Dinstein et al., 2012; Haigh,
Heeger, Dinstein, Minshew, & Behrmann, 2014), and may be inde-pendent of attention. Whilst sensory and attentional processingare closely related, equating individual differences in one domainmay illuminate deficits related to the other.
While some studies have reported that individuals with autismexhibit higher sensory thresholds than controls in discriminationof visual (Milne et al., 2002), auditory (Erviti et al., 2015) andsomatosensory (Puts, Wodka, Tommerdahl, Mostofsky, & Edden,2014) stimuli, others have reported no significant differencesacross groups (Cascio et al., 2008; O’Riordan & Passetti, 2006), oreven lower (i.e. better) sensory thresholds than controls(Blakemore et al., 2006; Fan, Chen, Chen, Decety, & Cheng, 2013).This apparent discrepancy emphasizes the need to control forany individual differences in sensory thresholds when measuringattention to sensory stimuli. For example, individuals withmigraine generally show impaired performance on motion detec-tion tasks (McKendrick & Badcock, 2004; McKendrick, Vingrys,Badcock, & Heywood, 2001; Antal et al., 2005; Ditchfield,Mckendrick, & Badcock, 2006; Shepherd, 2006). However, contrastsensitivity was also found to be abnormal in migraine, and

86 S.M. Haigh et al. / Vision Research 121 (2016) 85–94
mediated performance on motion tasks (Shepherd, Beaumont, &Hine, 2012), highlighting the effect of early sensory processingon more complex sensory tasks.
Attributing atypical sensory sensitivities to differences in atten-tion in autism may constitute an appealing account. However, theevidence for deficits in attention in autism is mixed, partly con-founded by the variability across studies in the attentional pro-cesses tested. Several studies, mostly conducted with childrenwith autism, have observed impairments in dividing attentionbetween stimuli (Belmonte, Gomot, & Baron-Cohen, 2010), andsustaining attention (Schatz, Weimer, & Trauner, 2002), similarto that seen in individuals with Attention Deficit HyperactivityDisorder (ADHD) (Corbett & Constantine, 2006). Additionally, def-icits in shifting attention have been documented in autism(Wainwright & Bryson, 1996; Wainwright-Sharp & Bryson, 1993;Williams, Goldstein, & Minshew, 2013), and the difficulty inswitching was exaggerated when participants were required toswitch between stimuli from different sensory modalities com-pared to a single modality (Reed & McCarthy, 2012).
In contrast to the evidence described above, other studies havereported no differences in attentional processing between adultswith autism and controls. The majority of these studies used highlycontrolled psychophysical methods to isolate attention, and foundthat exogenous and endogenous attention cues robustly modu-lated visual discriminability to the same extent in both autismand control groups across several different tasks (Grubb et al.,2013a, 2013b). Renner, Grofer Klinger, and Klinger (2006) alsofound no significant difference in endogenous attention, but foundimpaired exogenous attention in children with autism. No signifi-cant reductions in accuracy or reaction time measures to a selec-tive attention task were also reported in adults with autismregardless of the number of distractors (Remington, Swettenham,Campbell, & Coleman, 2009). Ciesielski, Knight, Prince, Harris,and Handmaker (1995) also found no evidence for behavioral dif-ferences in focused auditory and visual tasks, or in divided auditoryand visual tasks, but did note that attentional modulation of event-related potentials (ERPs) was significantly weaker in individualswith autism. Furthermore, several studies have even reportedstronger attentional modulation in autism than controls (Oades,Walker, Geffen, & Stern, 1988), leading to superiority in visualsearch, which is less affected by the presence of distractors(Kaldy, Giserman, Carter, & Blaser, 2013; Ohta et al., 2012;O’Riordan, Plaisted, Driver, & Baron-Cohen, 2001; but see Grubbet al., 2013a, 2013b). Some have attributed the superior visualsearch capabilities in autism to attentional, rather than sensory,processes (Happé & Frith, 2006; Kaldy et al., 2013), because visualsearch performance did not reliably correlate with enhanced per-ceptual discrimination (Brock, Xu, & Brooks, 2011). Others haveargued that altered sensitivity to sensory stimuli can lead toincreased attention to detail (Robertson, Kravitz, Freyberg, Baron-Cohen, & Baker, 2013a, 2013b, 2014; Baron-Cohen et al., 2009;Joseph, Keehn, Connolly, Wolfe, & Horowitz, 2009; Mottron,Dawson, & Soulières, 2009).
A possible source of the discrepancy in the literature is the mul-titude of methodologies used to measure perception and attention,some being better at controlling for possible confounding variablesthan others (Ames & Fletcher-Watson, 2010). Tasks that only mea-sure reaction times and not accuracy (Williams et al., 2012;Wainwright & Bryson, 1996; Wainwright-Sharp & Byson, 1993)can lead to ambiguous results: differences in reaction time couldreflect differences in either speed of processing, discriminability,or selection criteria. In addition, they could reflect speed-accuracy trade-offs (see, for example, Carrasco & McElree, 2001).In the current study, we adjusted the task to compensate forindividual differences in sensory processing, and measured bothaccuracy and reaction time.
In addition, a key challenge in determining whether the atypi-calities in autism derive from differences in sensory or attentionalprocessing results from the fact that investigating sensory process-ing often involves a task in which attention is directed (i) toward astimulus to measure the effects of actively processing sensorystimuli, or (ii) away from the stimulus to ensure that sensory stim-uli are perceived passively by engaging participants in a separatetask. In either case, an attentional manipulation is involved whenevaluating sensory processing.
We adopted an approach to evaluate both sensory processingand its modulation by attention in an attempt to parse the effectsof sensory processing on attention modulation in autism and con-trols. We initially examined sensory processing to ascertain differ-ences in visual and auditory thresholds between the two groups.We then probed sensory processing with and without engagingadditional attentional demands. The attention task requiredswitching attention between sensory modalities to keep the twochannels of sensory information as separate as possible. Attendingto one sensory modality or the other ensured that the stimuli wereexactly the same across valid and invalid trials, and that only thecue changed. In addition, a measure of sensory sensitivity was col-lected using the Glasgow Sensory Questionnaire (Robertson &Simmons, 2013). Responses on the questionnaire were comparedwith discrimination thresholds to assess whether greater self-reported sensitivity were correlated with improved discriminationthresholds. Clinical measures (for example, the ADOS scores for theindividuals with autism) were also compared with attention mea-sures and discrimination thresholds to test whether individualswith higher symptomatology also performed more poorly on theattention task and/or on discrimination performance.
In the first sensory experiment, we measured visual contrast-discrimination thresholds to sinusoidal gratings while, in the sec-ond, we measured auditory modulation-depth discriminationthresholds. If autism is associated with poor sensory processing,one would expect thresholds to be higher in the autism group. Inthe attention experiment, we measured discrimination perfor-mance while the same visual and auditory stimuli were presentedconcurrently at the participant’s previously determined thresholdlevel. In 75% of the trials, participants were cued to attend andrespond to the same stimulus (valid cue), and, in the remaining tri-als, participants were cued to attend to one stimulus but respondto the non-cued stimulus (invalid cue). This made it advantageousfor participants to pay attention to the cues and enabled us to com-pare the effects of attention on discrimination accuracy (Carrasco,2011). If autism is associated with abnormal attentional process-ing, then attentional modulation of discrimination accuracy invalid versus invalid cued trials would be weaker in individualswith autism compared to controls.
2. Materials and methods
2.1. Participants
Thirteen males and two females (mean age 27 years; range21–42) diagnosed with autism and no other identifiable etiology,including ADHD, consented to participate. Screening tests todetermine eligibility of the participants with autism included theWechsler Abbreviated Scale of Intelligence (Wechsler, 1999), theKaufman Test of Educational Achievement (K-TEA) (Kaufman &Kaufman, 1985), the Autism Diagnostic Observation ScheduleGeneral (ADOS-G; Lord et al., 2000), and the Autism DiagnosticInterview Revised (ADI-R; Le Couteur et al., 1989; Lord, Rutter, &Le Couteur, 1994). The diagnosis of autism, provided by the twostructured instruments, was confirmed by expert clinical opinion(Dr. Nancy Minshew). Participants with autism were also required
S.M. Haigh et al. / Vision Research 121 (2016) 85–94 87
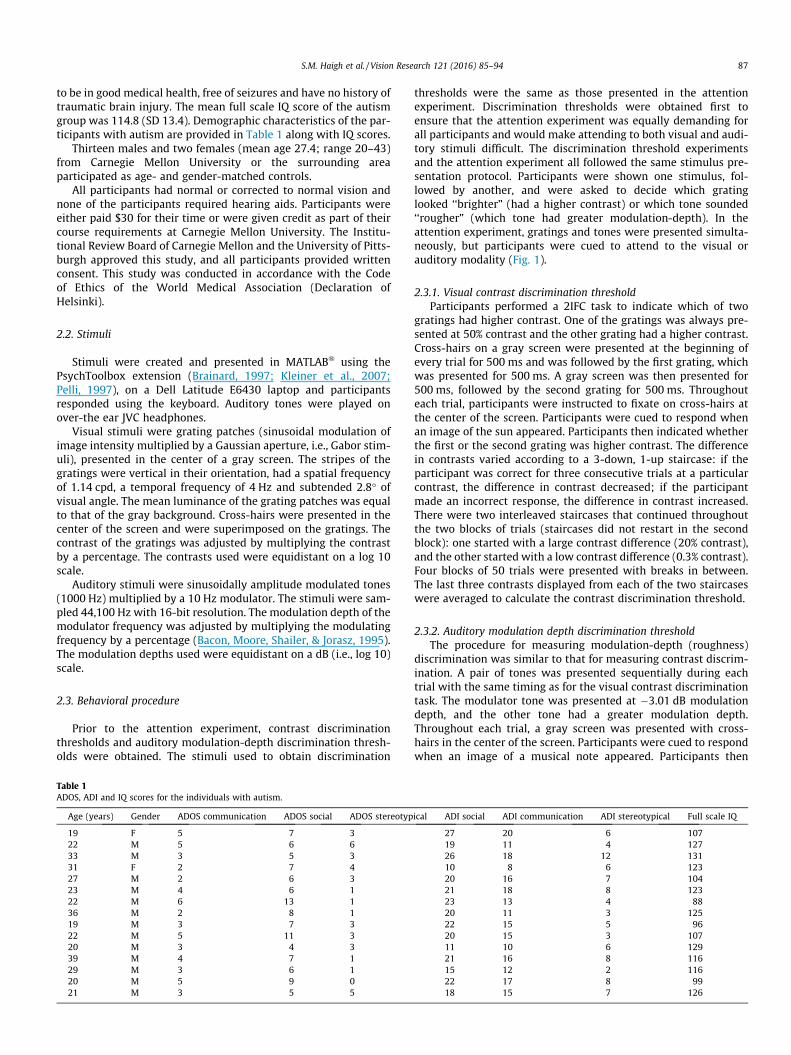
to be in good medical health, free of seizures and have no history oftraumatic brain injury. The mean full scale IQ score of the autismgroup was 114.8 (SD 13.4). Demographic characteristics of the par-ticipants with autism are provided in Table 1 along with IQ scores.
Thirteen males and two females (mean age 27.4; range 20–43)from Carnegie Mellon University or the surrounding areaparticipated as age- and gender-matched controls.
All participants had normal or corrected to normal vision andnone of the participants required hearing aids. Participants wereeither paid $30 for their time or were given credit as part of theircourse requirements at Carnegie Mellon University. The Institu-tional Review Board of Carnegie Mellon and the University of Pitts-burgh approved this study, and all participants provided writtenconsent. This study was conducted in accordance with the Codeof Ethics of the World Medical Association (Declaration ofHelsinki).
2.2. Stimuli
Stimuli were created and presented in MATLAB� using thePsychToolbox extension (Brainard, 1997; Kleiner et al., 2007;Pelli, 1997), on a Dell Latitude E6430 laptop and participantsresponded using the keyboard. Auditory tones were played onover-the ear JVC headphones.
Visual stimuli were grating patches (sinusoidal modulation ofimage intensity multiplied by a Gaussian aperture, i.e., Gabor stim-uli), presented in the center of a gray screen. The stripes of thegratings were vertical in their orientation, had a spatial frequencyof 1.14 cpd, a temporal frequency of 4 Hz and subtended 2.8� ofvisual angle. The mean luminance of the grating patches was equalto that of the gray background. Cross-hairs were presented in thecenter of the screen and were superimposed on the gratings. Thecontrast of the gratings was adjusted by multiplying the contrastby a percentage. The contrasts used were equidistant on a log 10scale.
Auditory stimuli were sinusoidally amplitude modulated tones(1000 Hz) multiplied by a 10 Hz modulator. The stimuli were sam-pled 44,100 Hz with 16-bit resolution. The modulation depth of themodulator frequency was adjusted by multiplying the modulatingfrequency by a percentage (Bacon, Moore, Shailer, & Jorasz, 1995).The modulation depths used were equidistant on a dB (i.e., log 10)scale.
2.3. Behavioral procedure
Prior to the attention experiment, contrast discriminationthresholds and auditory modulation-depth discrimination thresh-olds were obtained. The stimuli used to obtain discrimination
Table 1ADOS, ADI and IQ scores for the individuals with autism.
Age (years) Gender ADOS communication ADOS social ADOS stereotyp
19 F 5 7 322 M 5 6 633 M 3 5 331 F 2 7 427 M 2 6 323 M 4 6 122 M 6 13 136 M 2 8 119 M 3 7 322 M 5 11 320 M 3 4 339 M 4 7 129 M 3 6 120 M 5 9 021 M 3 5 5
thresholds were the same as those presented in the attentionexperiment. Discrimination thresholds were obtained first toensure that the attention experiment was equally demanding forall participants and would make attending to both visual and audi-tory stimuli difficult. The discrimination threshold experimentsand the attention experiment all followed the same stimulus pre-sentation protocol. Participants were shown one stimulus, fol-lowed by another, and were asked to decide which gratinglooked ‘‘brighter” (had a higher contrast) or which tone sounded‘‘rougher” (which tone had greater modulation-depth). In theattention experiment, gratings and tones were presented simulta-neously, but participants were cued to attend to the visual orauditory modality (Fig. 1).
2.3.1. Visual contrast discrimination thresholdParticipants performed a 2IFC task to indicate which of two
gratings had higher contrast. One of the gratings was always pre-sented at 50% contrast and the other grating had a higher contrast.Cross-hairs on a gray screen were presented at the beginning ofevery trial for 500 ms and was followed by the first grating, whichwas presented for 500 ms. A gray screen was then presented for500 ms, followed by the second grating for 500 ms. Throughouteach trial, participants were instructed to fixate on cross-hairs atthe center of the screen. Participants were cued to respond whenan image of the sun appeared. Participants then indicated whetherthe first or the second grating was higher contrast. The differencein contrasts varied according to a 3-down, 1-up staircase: if theparticipant was correct for three consecutive trials at a particularcontrast, the difference in contrast decreased; if the participantmade an incorrect response, the difference in contrast increased.There were two interleaved staircases that continued throughoutthe two blocks of trials (staircases did not restart in the secondblock): one started with a large contrast difference (20% contrast),and the other started with a low contrast difference (0.3% contrast).Four blocks of 50 trials were presented with breaks in between.The last three contrasts displayed from each of the two staircaseswere averaged to calculate the contrast discrimination threshold.
2.3.2. Auditory modulation depth discrimination thresholdThe procedure for measuring modulation-depth (roughness)
discrimination was similar to that for measuring contrast discrim-ination. A pair of tones was presented sequentially during eachtrial with the same timing as for the visual contrast discriminationtask. The modulator tone was presented at �3.01 dB modulationdepth, and the other tone had a greater modulation depth.Throughout each trial, a gray screen was presented with cross-hairs in the center of the screen. Participants were cued to respondwhen an image of a musical note appeared. Participants then
ical ADI social ADI communication ADI stereotypical Full scale IQ
27 20 6 10719 11 4 12726 18 12 13110 8 6 12320 16 7 10421 18 8 12323 13 4 8820 11 3 12522 15 5 9620 15 3 10711 10 6 12921 16 8 11615 12 2 11622 17 8 9918 15 7 126

Fig. 1. An example trial where the participant was instructed to attend to thegratings. At the end of the trial, an image of the sun indicated that the participanthad to complete the visual contrast discrimination task while an image of themusical note indicated that the participant had to complete the auditory modu-lation-depth (roughness) discrimination task.
88 S.M. Haigh et al. / Vision Research 121 (2016) 85–94
indicated which tone sounded ‘‘rougher” (i.e., which had greatermodulation). Similar to the contrast discrimination protocol, two3-down, 1-up staircases were used, one which started with a largemodulation depth difference (�3 dB), and another which started atlow modulation depth difference (�0.4 dB). Modulation depthchanged in increments of 0.2 dB. Four blocks of 50 trials were pre-sented with breaks in between. The last three modulation-depthspresented from each of the two staircases were averaged to calcu-late the modulation-depth discrimination threshold.
We measured modulation-depth discrimination thresholds asthey were analogous to visual contrast discrimination thresholds:the fluctuations in loudness (due to the modulating tone) are theauditory equivalent of fluctuations in contrast.
2.3.3. Attention experimentParticipants were cued to attend to either the visual grating or
to the auditory tone before every trial (50 trials per auditory/visualblock). On each trial, a grating and a tone were presented simulta-neously for 500 ms, followed by a gray screen for 500 ms, and thenimmediately followed by another grating and a tone for 500 ms.Participants were instructed to fixate on the cross-hairs that werepresented in the center of the screen throughout the trial. One ofthe tones was presented at �3.01 dB, and one of the gratings waspresented at 50% contrast; the other grating was presented at50% contrast plus the participant’s contrast discrimination thresh-old and the other tone was presented at �3.01 dB plus the partic-ipant’s modulation-depth discrimination threshold. Followingstimulus presentation, the participant was cued to respond toone of the two stimuli. On 75% of the trials, the response cuematched the attention cue (valid-cue trials), and on 25% of the tri-als it did not (invalid-cue trials). An example trial is shown in Fig. 1.Two sessions, each consisting of four blocks containing 50 trials(for a total of 400 trials), were presented with the option for breaks.To act as a break between the two sessions, participants wereasked to complete the Glasgow Sensory Questionnaire (Robertson& Simmons, 2013). This was done to prevent participants frombecoming overly fatigued with the task. Participants completed30 trials of the task as practice before starting the experiment(15 trials attending to the visual stimulus and 15 trials attendingto the auditory stimulus). Participants were given feedback at theend of every practice trial to help them comprehend and acclimateto the task. These data were not included in the analysis.
2.4. Data analysis
Contrast-discrimination thresholds were calculated by averag-ing together the mean of the last three contrast changes from eachstaircase, producing 80% discrimination accuracy; the same proce-dure was used to measure modulation-depth discriminationthresholds. These discrimination thresholds were used in theattention experiment to equate task difficulty across participants.Differences in the discrimination thresholds between autism andcontrols groups were assessed using independent-samples t-tests.
For the attention experiment, the responses to the gratings andthe tones were separated into valid-cue trials and invalid-cue tri-als. For example, we compared performance on those trials duringwhich the participant was cued to attend to the gratings and wasasked to respond to the gratings (valid-cue trials) and those trialswhere the participant was cued to attend to the tones, but wasasked to respond to the gratings (invalid-cue trials). Mean accuracyand reaction times were analyzed separately to measure the effectof attention, and to assess any differences in individuals with aut-ism compared to age- and gender-matched control participants.Differences between groups and sensory modalities were assessedusing mixed-measures analyses of variance, with group (autismand controls) as the between-subject variable, and sensory modal-ity (visual and auditory) and cue (valid and invalid) as within-subject variables. To ensure that all responses were above chancein the attention experiment, one-sample t-tests were conductedseparately for autism and control groups with the test value setat 50%.
Effect sizes were calculated for group differences in responsesto the valid and invalid cues for the visual and auditory tasks, usingthe following formulae:
d ¼ MeanC �MeanA
SDpooled
� �
SDpooled ¼ffiffiffiffiffiffiffiffiffiffiffiffiffiffiffiffiffiffiffiffiffiffiffiffiffiffiffiffiffiffiffiffiffiffiffiffiffiffiffiffiffiffiffiffiffiffiffiffiffiffiffiffiffiffiffiffiffiffiðNC � 1ÞSD2
C þ ðNA � 1ÞSD2A
NC þ NA
s
Formula 1. Calculations for effect size for each group comparison.N=number of observations; SD=standard deviation; C=controls,A=autism.
Finally, we performed complementary randomization tests toassess the statistical significance of differences across groups. Theparticipants’ data were randomly shuffled between the autismgroup and the control group (i.e., labels permuted) and differencesin percent response accuracy and reaction time were computed forthe randomly assigned groups. This was repeated 10,000 times, re-randomizing the labels each time, to provide null distributions ofthe differences across groups, according to the null hypothesis thatthere was no difference between groups. To be deemed statisticallysignificant, the actual difference between the correctly assignedgroups had to exceed the 95th percentile of the null distribution(equivalent to a one tailed t-test, but without assuming that vari-ables are normally distributed).
Responses to the Glasgow Sensory Profile questionnaire werescored 1 (‘Never’) to 5 (‘Always’) and the mean response to theauditory, gustatory, olfactory, proprioception, tactile, vestibularand visual questions were recorded and categorized as hyper- orhypo-sensitive. Responses to the questionnaire were correlatedwith discrimination thresholds and with performance in the atten-tion experiment. Finally, to test whether IQ was related to sensoryor attentional performance, percent accuracy and reaction timeswere correlated with IQ for the autism group (IQ was not measuredfor the controls).

S.M. Haigh et al. / Vision Research 121 (2016) 85–94 89
3. Results
Individuals with autism and controls were statistically indistin-guishable on their visual contrast (t(28) = 0.12, p = .903) and audi-tory modulation-depth (t(27) = 0.83, p = .417) discriminationthresholds (Fig. 2A). However, the individuals with autism showeda significant correlation between their contrast discriminationthresholds and their modulation-depth discrimination thresholds(r(13) = .52, p = .046), whereas the controls did not (r(12) = .08,p = .784) (Fig. 2B). This may (at least in part) be due to the some-what wider range of discrimination thresholds in the autism group(range of visual discrimination thresholds: �0.52 to �1.18 dB;auditory discrimination thresholds: �0.47 to �2.34 dB) comparedto the controls (range of visual discrimination thresholds: �0.63to �1.09 dB; auditory discrimination thresholds: �0.66 to�2.43 dB), although Spearman’s correlations (nonparametric) pro-duced the same results. There were no significant correlationsbetween visual and auditory discrimination thresholds and ADI(�.04<r>.28) or ADOS (�.33<r>.16) scores (from Social, Communi-cation and Stereotypical Behavior scales) in the autism group.
In the attention experiment, identical stimuli were presented ateach subject’s threshold level, thereby ensuring that baseline per-formance was equated for all participants. Discrimination perfor-mance was better than chance for both groups in both visual andauditory trials (all comparisons p < .001), and there was no signif-icant difference between groups in discrimination accuracy(F(1,27) = 0.40, p = .535). Discrimination accuracy was higher inboth groups on trials with a valid cue compared to trials with aninvalid cue (F(1,28) = 36.71, p < .001), and performance to validand invalid cues was indistinguishable across groups (F(1,28) =0.05, p = .818). There was no significant difference between visualand auditory modalities in discrimination accuracy (F(1,28)= 0.14, p = .709), and both groups performed equally well regard-less of sensory modality (no significant group �modality interac-tion, F(1,28) = 1.81, p = .189). There was no interaction betweensensory modality and cue (F(1,28) = 0.94, p = .341), and no signifi-cant three-way interaction with group (sensory modal-ity � cue � group: F(1,28) = .04, p = .836) (Fig. 3). Effect sizes forgroup comparisons for each condition showed that there was asmall to medium effect size for controls being more accurate thanindividuals with autism in the valid cue conditions (visual:d = 0.05; auditory: d = 0.37), but there was also a small to mediumeffect size for controls being less accurate than the individuals withautism in the invalid cue conditions (visual: d = �0.28; auditory:d = �0.01). There was, however, a large effect size for the effect
Fig. 2. (A) Visual contrast detection thresholds and auditory modulation-depth detectiostandard error. (B) Scatter plot of contrast discrimination and modulation-depth discrim
of valid versus invalid cues in both autism (d = 1.68) and controlgroups (d = 1.15).
Randomization tests showed no significant difference betweenautism and control groups in percent accuracy in the valid cue con-ditions (visual: p = .442; auditory: p = .159), or in the invalid cueconditions (visual: p = .228; auditory: p = .159).
There were no significant correlations between ADOS (social,communication or stereotypical behavior) measures and percent-age accuracy in the attention task to either the valid cue (visual:�.16<r>.17; auditory: �.07<r>.40) or invalid cue (visual:�.44<r>�.01; auditory: �.47<r>.28) or with ADI (social, communi-cation or stereotypical behavior) measures (valid visual:�.13<r>.26; valid auditory: �.06<r>.23; invalid visual:�.14<r>.11; invalid auditory: �.03<r>.20).
Reaction times were statistically indistinguishable across indi-viduals with autism and controls (F(1,28) = 0.52, p = .475). Partici-pants were faster at responding in the visual task (regardless of theattention cue) than the auditory task (F(1,28) = 5.64, p = .025), butthis was the case for both the autism and control groups to anequal extent (sensory modality � group: F(1,28) = 0.16, p = .689).The difference in reaction times between the valid and invalid cueswere larger in the visual task compared to the auditory task (F(1,28) = 77.38, p < .001), but again this was the case for bothgroups (cue � group: F(1,28) = 1.38, p = .250) (Fig. 4). Effect sizesfor group comparisons for each condition showed that there wasno difference in response accuracy between controls and individu-als with autism for the visual valid cue conditions (d < 0.01), but asmall effect size for individuals with autism being faster to respondthan controls (d = �0.25). Individuals with autism also respondedfaster than the controls in the invalid cue conditions (visual:d = �0.38; auditory: d = �0.20). Again, there was a large effect sizefor the effect of valid versus invalid cue in both autism (d = 1.05)and control groups (d = 0.81).
Randomization tests showed no significant difference betweenautism and control groups in response accuracy in the valid cueconditions (visual: p = .503; auditory: p = .256), or in the invalidcue conditions (visual: p = .151; auditory: p = .288).
There were no significant correlations between ADOS measuresand reaction times to either the valid cue (visual: �.33<r>�.06;auditory: �.31<r>�.25) or invalid cue (visual: �.31<r>�.13; audi-tory: �.43<r>�.09) or with ADI measures (valid visual:�.29<r>.08; valid auditory: �.38<r>.17; invalid visual:�.20<r>.20; invalid auditory: �.31<r>�.05).
To measure the potential trade-off between invalid and validcues, we computed the difference between the performance
n thresholds in the autism (white) and control groups (black). Error bars show oneination thresholds for the autism and control groups and regression lines.

50
60
70
80
90
100
Valid cue (gra�ng) Invalid cue (tone)Perf
orm
ance
acc
urac
y (%
corr
ect)
When cued to a�end to the gra�ng
Au�sm Control
50
60
70
80
90
100
Valid cue (tone) Invalid cue (gra�ng)Perf
orm
ance
acc
urac
y (%
corr
ect)
When cued to a�end to the tone
Au�sm Control
Fig. 3. Performance accuracy (% correct) in the visual (left panel) and auditory (right panel) discrimination tasks for valid and invalid cues in the autism group and the controlgroup. Error bars show one standard error. 50% correct is chance performance.
0
0.5
1
1.5
2
Valid cue (gra�ng) Invalid cue (tone)
Reac
�on
�me
(sec
onds
)
When cued to a�end to the gra�ng
Au�sm Control
0
0.5
1
1.5
2
Valid cue (tone) Invalid cue (gra�ng)
Reac
�on
�me
(sec
onds
)
When cued to a�end to the tone
Au�sm Control
Fig. 4. Reaction times (s), shown separately for visual (left panel) and auditory (right panel) discrimination tasks and for valid and invalid cues, for the autism group and thecontrol group. Error bars show one standard error.
90 S.M. Haigh et al. / Vision Research 121 (2016) 85–94
accuracy for valid-cue trials minus invalid-cue trials. The same wasdone for reaction times. There was no significant difference intrade-off accuracy between autism and control groups (F(1,28)= 1.31, p = .262), or between visual and auditory stimuli (F(1,28)= 0.14, p = .709) and no significant interaction (F(1,28) = 1.81,p = .189). Effect sizes for group comparisons for each conditionshowed that there was a small effect size for controls showing agreater trade-off than individuals with autism for the visual stim-ulus (d = 0.03), but there was a medium effect size for the auditorystimulus (d = 0.57).
There was also no group difference in reaction time trade-off(F(1,28) = 1.38, p = .250), or a significant interaction with stimulustype (F(1,28) = 0.16, p = .689), but there was a significant maineffect of stimulus type (F(1,28) = 5.64, p = .025), with the trade-off being greater for the auditory stimulus compared to the audi-tory stimulus. Effect sizes for group comparisons for each conditionshowed that there was a small to medium effect size for controlsshowing a greater trade-off in reaction times than individuals withautism (visual: d = 0.29; auditory: d = 0.44).
The data were reanalyzed to ensure that trials with exception-ally long reaction times (suggesting lapses), or trials with excep-tionally short reaction times (suggesting accidental button-press)were not affecting results. Specifically, we excluded trials in whichthe reaction time was greater than 3 SD above the mean of theindividual’s reaction time, or trials in which the reaction timewas faster than 150 ms. An average of 3% of trials were excludedfor these reasons (max 9%; min 0.75%). Excluding these trials madeno statistical difference to the results.
Previous studies have reported that individuals with autismexhibit larger trial-to-trial reaction time variability than controls(Karalunas, Geurts, Konrad, Bender, & Nigg, 2014), which may berelated to larger trial-by-trial variability in sensory evoked fMRIresponses (Dinstein et al., 2012; Haigh et al., 2014) in autism.The RT standard deviation across trials, however, was statisticallyindistinguishable across individuals with autism and controls(F(1,28) = 1.51, p = .229) in the current study. Note that the lackof difference across groups may be due to the delayed-responsenature of the task (participants had to respond after the secondcue). Additional analyses showed that RT variability across trialswas statistically indistinguishable across responses in the visual(regardless of the attention cue) and auditory domains (F(1,28)= 0.03, p = .861) to a similar extent in both the autism and controlgroups (sensory modality x group: F(1,28) = 2.03, p = .166). The dif-ference in reaction times between the valid and invalid cues werelarger in the visual task compared to the auditory task (F(1,28)= 17.22, p<.001), but again this was the case for both groups (cuex group: F(1,28) = 0.31, p = .581) (Fig. 5).
Randomization tests showedno significant difference in variabil-ity in reaction timesbetweenautismand control groups in thevisualvalid cue condition (p = .435), but the autism group produced signif-icantly greater variability in the auditory valid cue condition(p = .048). There were no significant differences between groups inthe invalid cue conditions (visual: p = .151; auditory: p = .288).
There were no significant correlations between ADOS measuresand variability in reaction times in the attention task to either thevalid cue (visual: �.25<r>�.20; auditory: �.40<r>�.13) or invalid

0
0.25
0.5
0.75
1
1.25
1.5
Valid cue (gra�ng) Invalid cue (tone)
SD in
reac
�on
�mes
(sec
onds
)
When cued to a�end to the gra�ng
Au�sm Control
0
0.25
0.5
0.75
1
1.25
1.5
Valid cue (tone) Invalid cue (gra�ng)
SD in
reac
�on
�mes
(sec
onds
)
When cued to a�end to the tone
Au�sm Control
Fig. 5. Standard deviation (SD) in reaction times (s), shown separately for visual (left panel) and auditory (right panel) discrimination tasks and for valid and invalid cues, forthe autism group and the control group. Error bars show one standard error.
S.M. Haigh et al. / Vision Research 121 (2016) 85–94 91
cue (visual:�.33<r>�.19; auditory:�.39<r>�.20) or with ADI mea-sures, except for a significant negative correlation with valid visualcues and social measures (r(13) = �.55, p = .034) (valid visual:�.37<r>�.11; valid auditory: �.50<r>�.15; invalid visual:�.37<r>.08; invalid auditory: �.43<r>.09).
There were no significant differences between groups across thefour blocks of the attention task in percent accuracy (group �block: F(3,84) = 0.71, p = .549), but controls did produce slowerreaction times to the first block compared to the other blocks(group x block: F(3,84) = 3.48, p = .019).
There were no significant correlations between responses to theauditory questions on the Glasgow Sensory Profile questionnaireand modulation-depth discrimination thresholds, nor betweenvisual responses on the Glasgow Sensory Profile questionnaireand the contrast-discrimination thresholds (�.5>r<.5). AverageGlasgow Sensory Profile scores were below average for both groupson hyper-sensitivity measures (controls mean = 2, SD = 0.4; autismmean = 2.1, SD = 0.6) and hypo-sensitivity measures (controlmean = 2.1, SD = 0.4; autism mean = 2.2, SD = 0.5), and did not dif-fer significantly between groups (hyper: t(29) = 0.53, p = .598;hypo: t(29) = 0.55, p = .589).
IQ did not correlate with attentional performance (�.1>r<.3),nor with modulation-depth discrimination thresholds (r(13)= �.09, p = .775), but there was a significant correlation withcontrast-discrimination thresholds (r(13) = �.56, p = .048).
4. Discussion
We used robust psychophysical methods to test for perceptualand/or attentional abnormalities in autism compared to a groupof healthy control participants. There were several benefits tousing this particular empirical protocol. First, we compared theeffect of valid and invalid cues with the same stimuli on every trialto isolate the effect of attention (as recommended by Carrasco,2011). Second, task difficulty was controlled by presenting thestimuli at the participant’s individual thresholds. This avoidedany effects of attention from being confounded by task difficulty(as highlighted by Shepherd et al., 2012). Third, we measured bothaccuracy and reaction time to avoid a speed-accuracy tradeoff con-found, and to distinguish a change in performance from responsebias. These features of the experimental design are both necessaryand sufficient to establish unambiguous effects of attention, andconsequently these features are also necessary to establishingunambiguous differences in attention between groups.
We found robust attentional effects (valid cue visual, invalidcue visual, valid auditory cue, and invalid auditory cue all signifi-cantly different from chance, p < .001) in both groups (autism
and control) that were indistinguishable between groups. Therewas also no significant difference in the trade-off between validand invalid cues between groups. There were several individualswith autism in this study with clear autism diagnoses who donot exhibit attention deficits (see Table 1), and there were no sig-nificant correlations with any of the attention measures and ADOSand ADI scores. The effect sizes for group differences in attentionwere small to medium (Cohen, 1988), suggesting that any deficit/improvement in cross-modal attention in autism is not reliableand does not offer any diagnostic value.
Nor did we find evidence for differences in sensory processing.There were no significant differences in auditory or visual discrim-ination thresholds between autism and control groups. The autismgroup did produce a significant correlation between visual andauditory discrimination thresholds, but discrimination thresholdsdid not correlate with ADOS or ADI scores, and so are not obviouslyassociated with autism severity. There were also no significant cor-relations with responses on Glasgow Sensory Questionnaire,although the autism group did not report extreme hypo orhyper-sensitivity, which may have limited the correlations. It istherefore possible that individuals with autism who exhibit greatersensory sensitivity may have performed differently in this task.There was a greater range of auditory and visual thresholds inthe autism group compared to the controls, suggesting greaterheterogeneity in sensory processing abilities across individualswith autism.
One possible cause for the lack of significant difference betweengroups in attention and sensory measures could be small samplesizes. Psychophysical studies like this are typically based on similarsample sizes. Importantly, it is also not the case that we observednull results across the board; we had sufficient statistical power tofind large clear effects of attention in both accuracy and reactiontime (p < .001), with similar amounts of within group variability(error bars in Figs. 3–5) in both the control and autism groups. Apower analysis of the largest group effect size that was not signif-icant (visual invalid cue condition; d = 0.38) would require at least70 participants per group to have 90% power in the results (Faul,Erdfelder, Buchner, & Lang, 2009; Faul, Erdfelder, Lang, &Buchner, 2007). Participants also completed a large number of tri-als – 200 trials for each of the discrimination threshold tasks, and400 trials for the attention task and so we almost certainly havesufficient statistical power to observe possible differences betweengroups. Last, the effect sizes of group differences for each cue con-dition in auditory and visual tasks were not consistent in terms ofwhich group was faster to respond or were more accurate, and soany (non-significant) group differences in attention were not con-sistent across conditions, again showing that it is unlikely that

92 S.M. Haigh et al. / Vision Research 121 (2016) 85–94
sample size is the cause for the absence of significant groupdifferences.
The individuals with autism who participated in this study hada high average IQ (114.8) and it is possible that higher IQ is associ-ated with better sensory processing (lower discrimination thresh-olds). Better contrast-discrimination thresholds were associatedwith higher IQs in the autism group, but this was not the casefor the modulation-depth discrimination thresholds. IQ was notmeasured for control participants, but they are likely to have highIQs given that they were mostly students from Carnegie MellonUniversity. We cannot ascertain whether there were any correla-tions between discrimination thresholds and IQ in the controlgroup. Nor can we determine if there were any differences in IQbetween the autism and control groups, or if IQ accounted forany variance in the results between the autism and control groups.However, others have reported no significant correlation betweenIQ and sensory processing in either typical (Hammill, 1972;Moore, Hobson, & Anderson, 1995) or autism (Behrmann,Thomas, & Humphreys, 2006) groups. It is our opinion, therefore,that our findings, along with the mixed findings apparent in the lit-erature, suggest that there is a large heterogeneity in sensory pro-cessing capabilities across different individuals with autism. Notethat the range of sensory discriminations thresholds was largerin the autism group as compared with the control group: severalindividuals with autism even had better discrimination thresholdsthan controls (see Fig. 2).
Just as there is inconsistency and controversy in the literatureregarding the sensory atypicalities in autism, so too is there anongoing debate in the literature regarding attention deficits inautism. Many previous studies have reported that individualswith autism exhibit attentional deficits, in dividing, sustaining,and shifting attention between stimuli, but the majority of thesestudies involve children with autism (Belmonte et al., 2010;Christakou et al., 2013; Corbett & Constantine, 2006; Di Martinoet al., 2013; Fitzgerald et al., 2015; Funabiki, Murai, & Toichi,2012; Reed & McCarthy, 2012; Schatz et al., 2002; Williamset al., 2013), with a couple of studies reporting differential effectsof attention on processing sensory stimuli in adults with autism(Koolen, Vissers, Hendriks, Egger, & Verhoeven, 2012; Robertson,Kravitz, Freyberg, Baron-Cohen, & Baker, 2013b). However, thereare several studies that corroborate our findings in adults withautism (Ciesielski et al., 1995; Grubb et al., 2013a, 2013b) sug-gesting that adults with autism do not exhibit deficits in attend-ing to one of two sensory channels compared to healthy controls.One possible explanation for the discrepancy in the literaturecould be that individuals with autism only show deficits in cer-tain types of attention. Here, we found no significant differencesin the tasks we conducted, engaging attention-switching withinand across modalities, in adults with autism compared to con-trols. Other studies have also found no significant differencebetween autism and controls in spatial attention tasks either(Grubb et al., 2013a, 2013b). It could be that these attentionalabilities are intact in individuals with autism, but that otherattention tasks, like dividing or sustaining attention, are abnor-mal. However, our results are in direct contrast with Reed andMcCarthy’s (2012) study which found that deficits (in childrenwith autism) were more pronounced when switching betweensensory modalities. A second explanation could be that individu-als with autism perform well at tasks where all the stimuli pre-sented are relevant to the task. For instance, in this taskparticipants were asked to respond to either visual or auditorystimuli, and so the expectations of the task were clear. Deficitsin individuals with autism may only become manifest when itis unclear what information is relevant (Van de Cruys et al.,2014; White, Burgess, & Hill, 2009), as these latter cases increase
the load on autonomous selection (Gottlieb, 2012). This mightexplain why deficits in attention in autism do not always appearunder strict lab conditions, but might appear under more natural-istic settings. A third possible explanation for the ostensible dis-crepancy in the literature is that attentional abnormalities areprevalent in children with autism, but not in adults with autism.If so, then this would point to a developmental delay in attention,as opposed to a sustained deficit (Williams et al., 2013). Beforejumping to this conclusion, however, it would be critical to runan experimental protocol similar to that used for the currentstudy, but with children.
Yet another possibility is that the stimuli differed across exper-iments. Reed and McCarthy (2012) investigated attention-modulating abilities in autism and found small deficits in modulat-ing attention within the same modality, but found that the deficitswere exaggerated when switching between visual and auditorytasks. The main difference between the current task and Reedand McCarthy’s task is that they used words and pictures of objectsas their stimuli, whereas the stimuli presented in the current study(as well as Ciesielski et al., 1995; Grubb et al., 2013a, 2013b) aremuch more basic and do not have semantic/linguistic content. Itis possible that stimulus complexity emphasizes any deficits inattention: that is, deficits in attention to low-level stimuli are verysmall and subtle, but complex stimuli involving processing frommultiple areas of the brain (in Reed and McCarthy’s task, vision,audition and language areas) multiply any small deficits in sensoryattention in autism contributing the measurable deficits. Inessence, deficits could be occurring further down the processingstream (Goldstein, Johnson, & Minshew, 2001; Robertson et al.,2013a, 2013b).
Stimulus complexity can also potentially explain some of themixed findings regarding differences in sensory perceptionbetween autism and controls. For example, Stevenson et al.(2014) found an extended temporal binding window for simpleauditory-visual synchrony judgements – when a flash of lightand an auditory beep are presented simultaneously, it creates theillusion that there were two flashes shown. They found an even lar-ger effect when creating the McGurk effect – when a phoneme con-flicts with the visual display of a face saying another phonemecreating the illusion of hearing another phoneme; for example,when the phoneme ‘ba’ is presented with a face mouthing the pho-neme ‘ga’ and the resulting phoneme is perceived as ‘da’. Theadded linguistic component in the McGurk effect appears to mag-nify the temporal window in autism compared to controls. There-fore, differences in sensory attention in autism may only appearwith complex stimuli.
5. Conclusion
In conclusion, using rigorous psychophysical methods, we iso-lated and characterized sensory and attentional processing, in agroup of adult individuals with autism. We found robust differ-ences in performance for different attention cues (valid versusinvalid) that were indistinguishable between autism and controlgroups, similar to Grubb et al. (2013a, 2013b). This suggests thathigh functioning individuals with clear symptoms of autism (totalADOS scores of 7–19) do not necessarily exhibit attentionalimpairments.
Acknowledgments
We would like to thank Nicole Navolio, Louise O’Hare, MichaelGrubb, and Elizabeth Cutrone for their help with designing thestimuli, Brian Coffman and Marisa Carrasco for their commentson the manuscript, and the staff at the Center for Excellence in

S.M. Haigh et al. / Vision Research 121 (2016) 85–94 93
Autism Research at the University of Pittsburgh for recruitmentand assessment of participants.
This work was supported by a grant from the Simons Founda-tion Autism Research Initiative (177638) to D.H. and M.B., and aNational Institutes of Health/National Institute of Child Healthand Human Development Grant (HD055748) to N.J.M.
References
Ames, C., & Fletcher-Watson, S. (2010). A review of methods in the study ofattention in autism. Developmental Review, 30(1), 52–73.
Antal, A., Temme, J., Nitsche, M. A., Varga, E. T., Lang, N., & Paulus, W. (2005). Alteredmotion perception in migraineurs: Evidence for interictal corticalhyperexcitability. Cephalalgia, 25(10), 788–794.
Bacon, S. P., Moore, B. C. J., Shailer, M. J., & Jorasz, U. (1995). Effects of combiningmaskers in modulation detection interference. The Journal of the AcousticalSociety of America, 97(3).
Baron-Cohen, S., Ashwin, E., Ashwin, C., Tavassoli, T., & Chakrabarti, B. (2009). Talentin autism: Hyper-systemizing, hyper-attention to detail and sensoryhypersensitivity. Philosophical Transactions of the Royal Society B: BiologicalSciences, 364(1522), 1377–1383.
Behrmann, M., Thomas, C., & Humphreys, K. (2006). Seeing it differently: Visualprocessing in autism. Trends in Cognitive Sciences, 10(6), 258–264.
Belmonte, M. K., Gomot, M., & Baron-Cohen, S. (2010). Visual attention in autismfamilies: ‘‘Unaffected” sibs share atypical frontal activation. Journal of ChildPsychology and Psychiatry, 51(3), 259–276.
Blakemore, S.-J., Tavassoli, T., Calò, S., Thomas, R. M., Catmur, C., Frith, U., et al.(2006). Tactile sensitivity in Asperger syndrome. Brain and Cognition, 61(1),5–13.
Brainard, D. H. (1997). The psychophysics toolbox. Spatial Vision, 10(4), 433–436.Brock, J., Xu, J. Y., & Brooks, K. R. (2011). Individual differences in visual search:
Relationship to autistic traits, discrimination thresholds, and speed ofprocessing. Perception, 40(6), 739–742.
Burack, J. A. (1994). Selective attention deficits in persons with autism: Preliminaryevidence of an inefficient attentional lens. Journal of Abnormal Psychology, 103(3), 535–543.
Carrasco, M. (2011). Visual attention: The past 25 years. Vision Research, 51(13),1484–1525.
Carrasco, M., & McElree, B. (2001). Covert attention accelerates the rate of visualinformation processing. Proceedings of the National Academy of Sciences, 98(9),5363–5367.
Cascio, C., McGlone, F., Folger, S., Tannan, V., Baranek, G., Pelphrey, K., et al. (2008).Tactile perception in adults with autism: A multidimensional psychophysicalstudy. Journal of Autism and Developmental Disorders, 38(1), 127–137.
Christakou, A., Murphy, C. M., Chantiluke, K., Cubillo, A. I., Smith, A. B., Giampietro,V., et al. (2013). Disorder-specific functional abnormalities during sustainedattention in youth with Attention Deficit Hyperactivity Disorder (ADHD) andwith autism. Molecular Psychiatry, 18(2), 236–244.
Ciesielski, K. T., Knight, J. E., Prince, R. J., Harris, R. J., & Handmaker, S. D. (1995).Event-related potentials in cross-modal divided attention in autism.Neuropsychologia, 33(2), 225–246.
Cohen, J. (1988). Statistical power analysis for the behavioral sciences (2nd ed.)NewJersey: Lawrence Erlbaum Associates Publishers.
Corbett, B. A., & Constantine, L. J. (2006). Autism and attention deficit hyperactivitydisorder: Assessing attention and response control with the integrated visualand auditory continuous performance test. Child Neuropsychology, 12(4–5),335–348.
Di Martino, A., Zuo, X.-N., Kelly, C., Grzadzinski, R., Mennes, M., Schvarcz, A., et al.(2013). Shared and distinct intrinsic functional network centrality in autismand attention-deficit/hyperactivity disorder. Biological Psychiatry, 74(8),623–632.
Dinstein, I., Heeger, D. J., Lorenzi, L., Minshew, N. J., Malach, R., & Behrmann, M.(2012). Unreliable evoked responses in autism. Neuron, 75(6), 981–991.
Ditchfield, J. A., Mckendrick, A. M., & Badcock, D. R. (2006). Processing of global formand motion in migraineurs. Vision Research, 46, 141–148.
Erviti, M., Semal, C., Wright, B. A., Amestoy, A., Bouvard, M. P., & Demany, L. (2015).A late-emerging auditory deficit in autism. Neuropsychology, 29(3), 454–462.
Fan, Y.-T., Chen, C., Chen, S.-C., Decety, J., & Cheng, Y. (2013). Empathic arousal andsocial understanding in individuals with autism: Evidence from fMRI and ERPmeasurements. Social Cognitive and Affective Neuroscience.
Faul, F., Erdfelder, E., Buchner, A., & Lang, A. G. (2009). Statistical power analysesusing G⁄Power 3.1: Tests for correlation and regression analyses. BehaviorResearch Methods, 41, 1149–1160.
Faul, F., Erdfelder, E., Lang, A. G., & Buchner, A. (2007). G⁄Power 3: A flexiblestatistical power analysis program for the social, behavioral, and biomedicalsciences. Behavior Research Methods, 39, 175–191.
Fitzgerald, J., Johnson, K., Kehoe, E., Bokde, A. L. W., Garavan, H., Gallagher, L., et al.(2015). Disrupted functional connectivity in dorsal and ventral attentionnetworks during attention orienting in autism spectrum disorders. AutismResearch, 8(2), 136–152.
Funabiki, Y., Murai, T., & Toichi, M. (2012). Cortical activation during attention tosound in autism spectrum disorders. Research in Developmental Disabilities, 33(2), 518–524.
Goldstein, G., Johnson, C., & Minshew, N. (2001). Attentional processes in autism.Journal of Autism and Developmental Disorders, 31(4), 433–440.
Gottlieb, J. (2012). Attention, learning, and the value of information. Neuron, 76(2),281–295.
Grubb, M. A., Behrmann, M., Egan, R., Minshew, N. J., Carrasco, M., & Heeger, D. J.(2013a). Endogenous spatial attention: Evidence for intact functioning in adultswith autism. Autism Research, 6(2), 108–118.
Grubb, M. A., Behrmann, M., Egan, R., Minshew, N. J., Heeger, D. J., & Carrasco, M.(2013b). Exogenous spatial attention: Evidence for intact functioning in adultswith autism spectrum disorder. Journal of Vision, 13(14), 1–13. 9.
Haigh, S., Heeger, D., Dinstein, I., Minshew, N., & Behrmann, M. (2014). Corticalvariability in the sensory-evoked response in autism. Journal of Autism andDevelopmental Disorders, 45(5), 1176–1190.
Hammill, D. (1972). Training visual perceptual processes. Journal of LearningDisabilities, 5(9), 552–559.
Happé, F., & Frith, U. (2006). The weak coherence account: Detail-focused cognitivestyle in autism spectrum disorders. Journal of Autism and DevelopmentalDisorders, 36(1), 5–25.
Joseph, R. M., Keehn, B., Connolly, C., Wolfe, J. M., & Horowitz, T. S. (2009). Why isvisual search superior in autism spectrum disorder? Developmental Science, 12(6), 1083–1096.
Kaldy, Z., Giserman, I., Carter, A., & Blaser, E. (2013). The mechanisms underlying theASD advantage in visual search. Journal of Autism and Developmental Disorders,1–15.
Karalunas, S. L., Geurts, H. M., Konrad, K., Bender, S., & Nigg, J. T. (2014). Annualresearch review: Reaction time variability in ADHD and autism spectrumdisorders: measurement and mechanisms of a proposed trans-diagnosticphenotype. Journal of Child Psychology and Psychiatry, 55(6), 685–710.
Kaufman, A. S., & Kaufman, N. L. (1985). Kaufman test of educational achievement.Cirle Pines, MN: American Guidance Service.
Kleiner, M., Brainard, D., Pelli, D., Ingling, A., Murray, R., & Broussard, C. (2007).What’s new in psychtoolbox-3. Perception, 36(14), 1.
Koolen, S., Vissers, C. T. W. M., Hendriks, A. W. C. J., Egger, J. I. M., & Verhoeven, L.(2012). The interplay between attentional strategies and language processing inhigh-functioning adults with autism spectrum disorder. Journal of Autism andDevelopmental Disorders, 42(5), 805–814.
Le Couteur, A., Rutter, M., Lord, C., Rios, P., Robertson, S., Holdgrafer, M., et al. (1989).Autism diagnostic interview: A standardized investigator-based instrument.Journal of Autism and Developmental Disorders, 19(3), 363–387.
Liss, M., Saulnier, C., Fein, D., & Kinsbourne, M. (2006). Sensory and attentionabnormalities in autistic spectrum disorders. Autism, 10(2), 155–172.
Lord, C., Risi, S., Lambrecht, L., Cook, E. H., Leventhal, B. L., DiLavore, P. C., et al.(2000). The autism diagnostic observation schedule-generic: A standardmeasure of social and communication deficits associated with the spectrumof autism. Journal of Autism and Developmental Disorders, 30(3), 205–223.
Lord, C., Rutter, M., & Le Couteur, A. (1994). Autism diagnostic interview-revised: Arevised version of a diagnostic interview for caregivers of individuals withpossible pervasive developmental disorders. Journal of Autism andDevelopmental Disorders, 24(5), 659–685.
McKendrick, A. M., & Badcock, D. R. (2004). Motion processing deficits in migraine.Cephalalgia: An International Journal of Headache, 24(5), 363–372.
McKendrick, A. M., Vingrys, A. J., Badcock, D. R., & Heywood, J. T. (2001). Visualdysfunction between migraine events. Investigative Ophthalmology & VisualScience, 42(3), 626–633.
Meilleur, A.-A. S., Berthiaume, C., Bertone, A., & Mottron, L. (2014). Autism-specificcovariation in perceptual performances: ‘‘g” or ‘‘p” factor? PLoS One, 9(8)e103781.
Milne, E. (2011). Increased intra-participant variability in children with autisticspectrum disorders: Evidence from single-trial analysis of evoked EEG. Frontiersin Psychology, 2, 51.
Milne, E., Swettenham, J., Hansen, P., Campbell, R., Jeffries, H., & Plaisted, K. (2002).High motion coherence thresholds in children with autism. Journal of ChildPsychology and Psychiatry, 43(2), 255–263.
Moore, D. G., Hobson, R. P., & Anderson, M. (1995). Person perception: Does itinvolve IQ-independent perceptual processing? Intelligence, 20(1), 65–86.
Mottron, L., Dawson, M., & Soulières, I. (2009). Enhanced perception in savantsyndrome: Patterns, structure and creativity. Philosophical Transactions of theRoyal Society of London B: Biological Sciences, 364(1522), 1385–1391.
Murphy, J. W., Foxe, J. J., Peters, J. B., & Molholm, S. (2014). Susceptibility todistraction in autism spectrum disorder: Probing the integrity of oscillatoryalpha-band suppression mechanisms. Autism Research, 7(4), 442–458.
O’Riordan, M., & Passetti, F. (2006). Discrimination in autism within differentsensory modalities. Journal of Autism and Developmental Disorders, 36(5),665–675.
O’Riordan, M. A., Plaisted, K. C., Driver, J., & Baron-Cohen, S. (2001). Superior visualsearch in autism. Journal of Experimental Psychology: Human Perception andPerformance, 27(3), 719–730.
Oades, R. D., Walker, M. K., Geffen, L. B., & Stern, L. M. (1988). Event-relatedpotentials in autistic and healthy children on an auditory choice reaction timetask. International Journal of Psychophysiology, 6(1), 25–37.
Ohta, H., Yamada, T., Watanabe, H., Kanai, C., Tanaka, E., Ohno, T., et al. (2012). AnfMRI study of reduced perceptual load-dependent modulation of task-irrelevantactivity in adults with autism spectrum conditions. NeuroImage, 61(4),1176–1187.
Pelli, D. G. (1997). The VideoToolbox software for visual psychophysics:Transforming numbers into movies. Spatial Vision.

94 S.M. Haigh et al. / Vision Research 121 (2016) 85–94
Puts, N. A. J., Wodka, E. L., Tommerdahl, M., Mostofsky, S. H., & Edden, R. A. E. (2014).Impaired tactile processing in children with autism spectrum disorder. Journalof Neurophysiology, 111(9), 1803–1811.
Reed, P., & McCarthy, J. (2012). Cross-modal attention-switching is impaired inautism spectrum disorders. Journal of Autism and Developmental Disorders, 42(6),947–953.
Remington, A., Swettenham, J., Campbell, R., & Coleman, M. (2009). Selectiveattention and perceptual load in autism spectrum disorder. PsychologicalScience, 20(11), 1388–1393.
Renner, P., Grofer Klinger, L., & Klinger, M. R. (2006). Exogenous and endogenousattention orienting in autism spectrum disorders. Child Neuropsychology, 12(4–5), 361–382.
Robertson, C. E., Kravitz, D. J., Freyberg, J., Baron-Cohen, S., & Baker, C. I. (2013a).Slower rate of binocular rivalry in autism. The Journal of Neuroscience, 33(43),16983–16991.
Robertson, C. E., Kravitz, D. J., Freyberg, J., Baron-Cohen, S., & Baker, C. I. (2013b).Tunnel vision: sharper gradient of spatial attention in autism. The Journal ofNeuroscience, 33(16), 6776–6781.
Robertson, A., & Simmons, D. (2013). The relationship between sensory sensitivityand autistic traits in the general population. Journal of Autism and DevelopmentalDisorders, 43(4), 775–784.
Robertson, C. E., Thomas, C., Kravitz, D. J., Wallace, G. L., Baron-Cohen, S., Martin, A.,et al. (2014). Global motion perception deficits in autism are reflected as earlyas primary visual cortex. Brain.
Rubenstein, J. L. R., & Merzenich, M. M. (2003). Model of autism: Increased ratio ofexcitation/inhibition in key neural systems. Genes, Brain and Behavior, 2(5),255–267.
Schatz, A., Weimer, A., & Trauner, D. (2002). Brief report: Attention differences inasperger syndrome. Journal of Autism and Developmental Disorders, 32(4),333–336.
Shepherd, A. J. (2006). Local and global motion after-effects are both enhanced inmigraine, and the underlying mechanisms differ across cortical areas. Brain,1833–1843. http://dx.doi.org/10.1093/brain/awl124.
Shepherd, A. J., Beaumont, H. M., & Hine, T. J. (2012). Motion processing deficits inmigraine are related to contrast sensitivity. Cephalalgia: An International Journalof Headache, 32(7), 554–570.
Stevenson, R. A., Siemann, J. K., Schneider, B. C., Eberly, H. E., Woynaroski, T. G.,Camarata, S. M., et al. (2014). Multisensory temporal integration in autismspectrum disorders. The Journal of Neuroscience, 34(3), 691–697.
Van de Cruys, S., Evers, K., Van der Hallen, R., Van Eylen, L., Boets, B., de-Wit, L., et al.(2014). Precise minds in uncertain worlds: Predictive coding in autism.Psychological Review, 121(4), 649–675.
Wainwright, J. A., & Bryson, S. (1996). Visual-spatial orienting in autism. Journal ofAutism and Developmental Disorders, 26(4), 423–438.
Wainwright-Sharp, J. A., & Bryson, S. (1993). Visual orienting deficits in high-functioning people with autism. Journal of Autism and Developmental Disorders,23(1), 1–13.
Wechsler, D. (1999). The Wechsler abbreviated scale for intelligence.San Antonio, TX:The Psychological Coporation.
White, S. J., Burgess, P. W., & Hill, E. L. (2009). Impairments on ‘‘open-ended”executive function tests in autism. Autism Research, 2(3), 138–147.
Williams, D., Goldstein, G., & Minshew, N. (2013). The modality shift experiment inadults and children with high functioning autism. Journal of Autism andDevelopmental Disorders, 43(4), 794–806.