no. 14-20 july 2014 working paper
TRANSCRIPT

WORKINGPAPER
No. 14-20 JULY 2014
DO CERTIFICATE-OF-NEED LAWS INCREASE INDIGENT CARE?
by Thomas Stratmann and Jacob W. Russ
The opinions expressed in this Working Paper are the authors’ and do not represent official positions of the Mercatus Center or George Mason University.

1
About the Authors Thomas Stratmann Mercatus Center Scholar, Mercatus Center at George Mason University Professor of Economics, George Mason University [email protected] Jacob W. Russ PhD Fellow, Mercatus Center at George Mason University [email protected] Acknowledgments We thank Chase Archibald, Holly Jean Soto, and Laura Stanley for providing excellent research assistance. We also gratefully acknowledge helpful comments and suggestions from two anonymous reviewers and the financial support of the Mercatus Center at George Mason University. Abstract Many states have certificate-of-need regulations, which prohibit hospitals, nursing homes, and ambulatory surgical centers from entering new markets or making changes to the existing capacity of medical facilities without first gaining approval from certificate-of-need regulators. These regulations purport to limit the supply of medical services and to induce regulated institutions to use the resulting economic profits to cross-subsidize indigent care. We document that these regulations do limit supply. However, we do not find strong evidence of higher levels of indigent-care provision in states that have certificate-of-need regulations as opposed to those that do not. JEL code: I180 Keywords: certificate-of-need, certificate of need, medical subsidy program, healthcare, health care, Medicaid, regulation, entry barrier

2
Do Certificate-of-Need Laws Increase Indigent Care?
Thomas Stratmann and Jacob W. Russ
1. Introduction
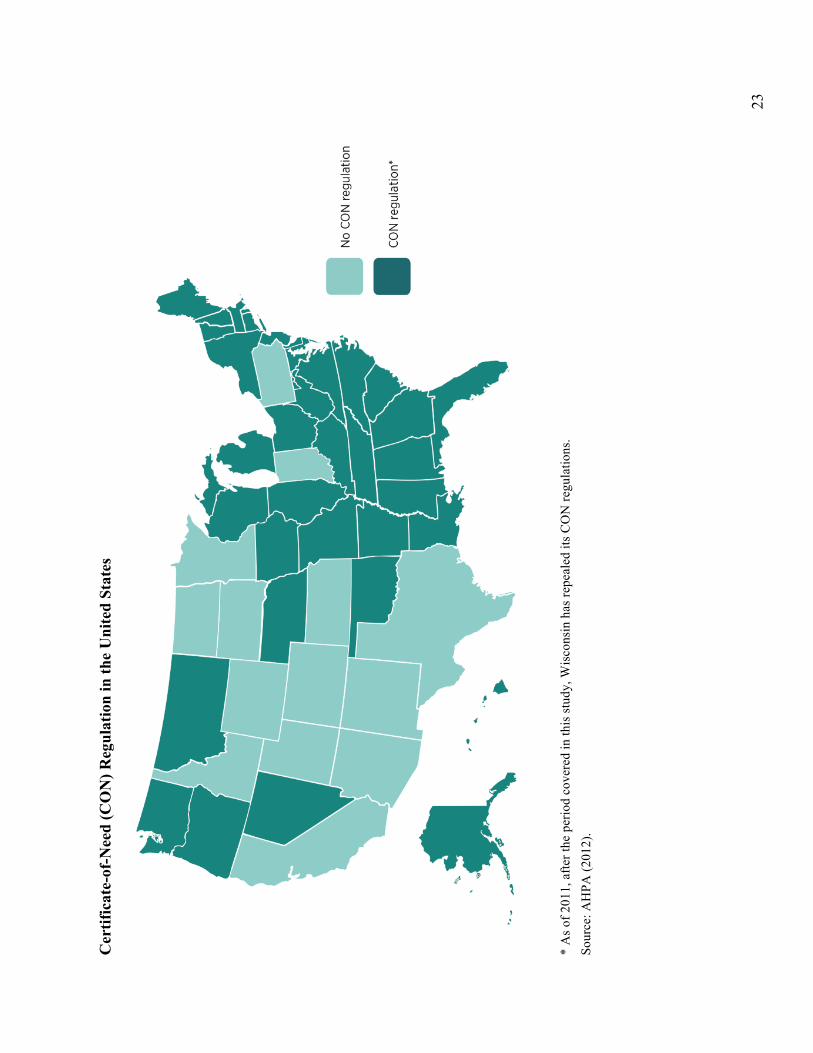
Certificate-of-need (CON) programs prohibit hospitals, nursing homes, and ambulatory surgical
centers from entering new markets or making changes to the existing capacity of medical
facilities without first gaining approval from certificate-of-need regulators. During the period
examined, 36 states and the District of Columbia had CON programs that reviewed applications
for medical equipment and services (see the map on page 23).1 These programs intend to create a
quid pro quo in which the agencies increase the profitability of covered medical services by
restricting competition and, in return, medical providers cross-subsidize specified amounts of
indigent care, or medical services to the poor that are unprofitable to the provider (Banks,
Foreman, and Keeler 1999; David et al. 2011).2
The theory of cross-subsidization is well established. Posner (1971) and Faulhaber (1975)
outline how regulators can create “internal subsidies” within firms to encourage them to provide
unprofitable, but socially desirable, services. If regulators restrict entry and limit firm output,
profits for existing firms likely increase because of reduced competition. After regulation, firms
have the monopoly profits with which to cover losses on unremunerated services.3
However, there is reason to question the willingness and ability of medical providers to
comply with the subsidy scheme (David et al. 2011). First, because hospitals can claim to offer
1 CON programs vary significantly in the stringency of the review process and the services and equipment covered. At the extremes, in 2011, Ohio’s CON program only regulated long-term acute care, while as many as 30 categories of medical services and equipment are reviewable in Vermont (AHPA 2012). 2 For example, Virginia’s CON statute explicitly grants the state health commissioner the discretion to include indigent care as a condition of approving a CON permit (Virginia Dept. of Health 2004). 3 We take the claim of cross-subsidization at face value, but note that firms may view such regulation as part of their profit maximizing strategy (i.e., regulatory capture). Two papers that directly hypothesize that hospitals desire CON regulations are Payton and Powsner (1980) and Wendling and Werner (1980).

3
subsidized service through one of many channels, regulators cannot monitor the hospitals
effectively. Without effective monitoring, hospitals have little incentive to subsidize indigent
care. Second, because technological change, the rise of managed care organizations, reduced
federal payment rates to Medicare, and deregulation have made the health care industry more
competitive since the 1980s, medical providers have lower profits and less ability to provide
cross-subsidies (Santerre and Pepper 2000; Frakt 2011, 2014).
Several state-specific studies, however, do find evidence of cross-subsidization among
hospitals and nursing homes (Dranove 1988; Campbell and Fournier 1993; Ford and Kaserman
1993; Fournier and Campbell 1997; Troyer 2002; David et al. 2011). Most of this evidence
comes from the 1980s.
In this paper, we provide new evidence on the cross-subsidization hypothesis and
contribute to the literature on the economics of regulation (Stigler 1971; Peltzman 1976; Becker
1983). We use two state-level measures of indigent care, covering the entire United States:
uncompensated care from 2007 to 2010 and Medicaid patient days from 2000 to 2010.4 Further,
we create a comprehensive database on state CON regulations. This dataset allows us to capture
differences in regulatory authority among state CON programs.
We do not find evidence associating CON programs with an increase of indigent care.
The effect of CON programs on indigent care shows no clear pattern using either direct or
indirect measures of indigent care. However, consistent with the existing literature, our results
suggest that CON programs restrict entry and limit the provision of regulated medical services.
For example, CON states have about 13 percent fewer hospital beds per 100,000 persons than
non-CON states. 4 The only other large-scale study of CON programs is Zhang (2008), which uses data from 17 states. Zhang finds that both for-profit and nonprofit hospitals increase their provision of uncompensated care in response to CON laws.

4
In section 2 we provide background on CON regulations and discuss the above justification
and a different one. In section 3 we describe our data and outline our empirical strategy. Section 4
presents our results. We then discuss these results and conclude our analysis in section 5.
2. Background
New York introduced CON regulation to the United States in 1964 to contain health care costs.5
Proponents thought unregulated market competition created incentives for medical providers to
overinvest in facilities and equipment. Regulators could lower the growth rate of health care
costs by restricting market expansion to expenditures for which the medical provider could
demonstrate a clear public need. The early studies of these laws generally found evidence neither
of reduced investment by hospitals (Hellinger 1976; Salkever and Bice 1976) nor of cost control
(Sloan and Steinwald 1980; Sloan 1981; Joskow 1980; Joskow 1981).
The results of more recent research are mixed: Conover and Sloan (1998) find that while
CON laws appear to have a modest cost-control effect, their removal in several states was not
associated with a surge in hospital spending. The “Big Three” automakers, Chrysler, Ford, and
General Motors, released internal studies showing that health care costs in a handful of non-CON
states were higher than in Michigan, New York, Missouri, and Kentucky, each of which has
CON laws (DaimlerChrysler Corporation 2002; Ford Motor Company 2000; General Motors
Corporation 2002). A study by Rivers, Fottler, and Frimpong (2010) finds no evidence that CON
laws are associated with reduced hospital costs, but does find evidence that stringent CON
programs increase costs by 5 percent. Most recently, Rosko and Mutter (2014), using stochastic
frontier analysis, find that states with CON laws show increased cost efficiency.
5 Simpson (1985) provides a brief and comprehensive history of CON legislation.

5
Campbell and Fournier (1993) and Fournier and Campbell (1997) propose that regulators
have a different primary justification for CON programs: cross-subsidizing indigent care. Using
CON application data in Florida, they find evidence of a quid pro quo. Hospitals that provided
the most indigent care had a higher probability of winning CON approval.6 Several other state-
specific studies also find evidence of cross-subsidization among hospitals and nursing homes.
Dranove (1988) argues hospitals in Illinois raised prices on privately paying patients in response
to a drop in Medicaid payments in the 1980s—an example of cross-subsidization.7 Troyer (2002)
finds evidence of cross-subsidies among nursing home patients in Florida. Self-paying nursing
home patients appear to pay more than do comparable Medicaid patients. Troyer concludes that
this cross-subsidy is intertemporal: nursing homes charge more at the beginning of a patient’s
care cycle in anticipation of switching to the lower-paying Medicaid system later. Finally, David
et al. (2011) find that hospitals in Arizona and Colorado changed their product mix in response
to the entry of specialty hospitals. As competition increased, hospitals provided fewer
unprofitable services and more profitable services. Their results show that competition limits
hospitals’ ability to cross-subsidize.
Recent papers, however, do not find evidence of cross-subsidization. Frakt (2011, 2014)
surveys the literature and concludes that although in the 1980s it was possible for hospitals to
shift much of their costs between patient groups (Cutler 1998), the market is now too competitive
to allow them to do so to a significant extent (Wu 2010; Dranove, Garthwaite, and Ody 2013;
White 2013; White and Wu 2014). 6 Miller and Hutton (2004) cite court documents as additional evidence that uncompensated care provision leads to favorable treatment during the application process. 7 Dranove uses the term “cost-shift” when describing the process of raising private prices in response to changes in public prices. While we recognize that cross-subsidization and cost-shifting are not interchangeable in the literature, both are examples of price discrimination. Because the underlying mechanism is the same, forces that affect a firm’s ability to price discriminate will influence both of these processes. Therefore, we reference studies in the cost-shifting literature here. However, to ease exposition, we will only refer to cross-subsidization throughout this paper.

6
3. Data and Empirical Strategy
3.1. Data
The dependent variables used in this paper come from three sources. The most direct measure of
indigent care, uncompensated care, comes from the Healthcare Cost Report Information System
(HCRIS).8 HCRIS defines uncompensated care as the sum of charity care and bad debt (CMS
2014). We use HCRIS figures from fiscal years 2007 to 2010.9 We aggregate hospital-level data
to create state-level observations. These data include the number of beds from the reporting
hospitals, which allows us to standardize our uncompensated care measure on a per-bed basis.
Second, we use data from two American Hospital Association (AHA) sources: Hospital
Statistics 2013 and the AHA subsidiary Health Forum’s Medicaid statistics. We glean two indirect
measures of indigent care: ratios of Medicaid patient days to total patient days and of Medicaid
admissions to total patient discharges. Hospital Statistics, compiled from the AHA’s Annual
Survey of Hospitals, contains state-level summary data from 1994 to 2011. This source provides
information on facilities and services, utilization rates, personnel, and financial aggregates.
We use other data from the AHA to examine whether CON laws restrict hospital
capacity. Data include state-level summaries of total patient admissions, discharges, and
inpatient days. These data distinguish between hospitals and nursing homes as well as between
Medicare and Medicaid status. They cover separate measures of health care capacity based on
the number of hospitals that report providing each of the following medical services: computed
tomography (CT) scanning, magnetic resonance imaging (MRI), optical colonoscopy, and virtual
colonoscopy. These hospitals also report the number of operating indigent-care clinics and rural
8 HCRIS data are collected by the Centers for Medicare & Medicaid Services (CMS 2014). 9 For example, fiscal year 2007 began on October 1, 2006, and ended on September 30, 2007.

7
health clinics, the total number of hospital beds in a state, and the number of beds for hospitals
that reported data to the AHA.
Certificate-of-need program data come from our third source, the American Health
Planning Association (AHPA). The AHPA publishes its annual survey of state CON programs
in annual national directories. From these directories we assembled the most comprehensive
dataset on state CON regulations to date, covering 1992 through 2011.10 Classifying data by
AHPA’s state-by-state surveys allows us to create variables that evaluate the stringency of
CON programs by state.
The first of these variables equals one if there is CON regulation in a state. Second, from
the directories’ 28 standardized categories11 for equipment and services regulated by CON
programs, we create a variable counting the number of categories by state and year. We also
create binary measures for each of the categories. These variables capture the fact that although a
state may have a CON regulation agency, this agency may or may not regulate a particular
service or type of equipment. For example, in 2011 Delaware had a CON program, but its
agency did not review psychiatric services or MRIs.
The control variables we use in our study come from a variety of sources. We collect
state-level demographic information from the Census Bureau on the total population, the poverty
level, and the percentages of white, black, and Hispanic citizens. From the census data we also
calculate, for three population groups, measures likely to be correlated with an increased use of
hospital facilities and with indigent care: the proportion of the population below age 18, above 10 AHPA has published its national directories from 1990 to 2012, but we do not use the two earlier surveys because AHPA did not report its survey data by state. 11 The AHPA surveys actually cover 31 categories. Because they do not report three of these categories consistently for the entire period, we omit them to keep our count of regulated services uniform. Business computers started as a reported category, but as of the 2008 directory no state claimed to regulate this category and in the 2009 directory it was removed completely. Hospice was added as a category as part of the 2006 directory, and nursing home bed regulation was separated from long-term acute care and given its own category as part of the 2007 directory.

8
age 65, and female and of child-bearing age (15–44). We collect nominal per capita state income
from the Bureau of Economic Analysis and convert it to real income using the consumer price
index from the Bureau of Labor Statistics. We use 2011 as our base year. Our state-level
unemployment-rate data also come from the Bureau of Labor Statistics. Finally, we get the age-
adjusted percentage of adults (persons 18 and over) with diagnosed diabetes from the Centers for
Disease Control and Prevention. We include diabetes as an additional control variable to capture
poor health outcomes that may not be captured by the other control variables. Diabetes is known
to increase the risk of heart disease and strokes (NDIC 2014).
We show summary statistics for each of our measures in table 1 (page 24). The second
column reports the number of observations per variable. These numbers range from a low of four
surveyed years and 204 observations for optical colonoscopy to a high of eleven years and 561
observations for emergency room visits. The mean of our CON indicator is 73 percent, and on
average each state regulates 10.1 medical services. If we restrict the sample to states that have
CON programs, the average count of regulated services increases to about 14. In the analysis that
follows we only include in our models the category-specific CON indicators that are relevant to
the dependent variable in question. Thus, in table 1 we only report the indicators that appear in
our model specifications. As two examples, with these indicators we report that only 27 percent
of our state-year observations have CT scanner regulation, and 54 percent of our sample
regulates acute hospital beds.
3.2. Empirical Strategy
If state CON programs grant medical providers a degree of market power, we should expect to
see evidence of capacity restrictions in the states with CON programs. Only monopoly power

9
allows providers to raise prices, giving them excess profits to potentially use to cross-subsidize
indigent services. Without market power, providers are unlikely to have the capital with which to
cross-subsidize indigent care, as mandated in some of the CON regulations.
We estimate a set of models such as
!"#$%ℎ !"#$ !"#"!$%&!" = α !"#!" + δ!!" + ϑ! + ε!", (1)
in each of which we use several measures of health care capacity. These measures include the
number of hospital beds per 100,000 persons and the number of hospitals that report the use of
CT scanners, MRI machines, optical colonoscopy, and virtual colonoscopy. To compare across
states, we scale each of these measures to the number of hospitals offering any particular medical
service per 500,000 persons. For these regressions, the coefficient of interest is α. A negative
indicates that CON regulations correlate with restricted health care capacity.
As with previous studies, we measure CONst as a binary variable for the presence or
absence of a CON program. But because this variable implicitly assumes that all states’ CON
programs are identical, we introduce additional variation into our CON regulation measure. We
include specifications where CONst counts the number of regulated-service categories in a state.
This variable potentially allows us to differentiate between stringent CON programs and
programs that intervene less. For example, Louisiana’s CON program only regulated three
categories in 2011, while its neighbor Mississippi regulated 18 of the 28 categories. In other
specifications, we include the category-specific indicator for regulation in the area relevant for
our dependent variable. For example, in some of our MRI services regressions, we include an
indicator for both the presence of a CON program and MRI regulation because not all CON
programs regulate MRI machines.

10
The matrix Xst includes our control variables for state s in year t. We also include year
indicators ϑt. We do not include state fixed effects because the CON binary variable is constant
for 36 states and the District of Columbia.
Having determined whether CON laws restrict capacity, we estimate several
specifications to test whether CON programs influence the provision of indigent care:
!"#$%&"' !"#$!" = β !"#!" + δ!!" + ϑ! + ε!". (2)
We use two measures of indigent care: uncompensated care and the ratio of Medicaid patient
days to total patient days. For these regressions, a positive coefficient β indicates that CON
programs correlate with greater provision of indigent care.
4. Results
This section presents two sets of results. We first show the effect of CON programs on several
measures of hospital capacity. We then estimate the effect of CON programs on the provision of
uncompensated care.
4.1. Certificate-of-Need Regulation and Hospital Capacity
Table 2 (page 25) shows estimates for the effect of CON programs on the number of hospital
beds in a given state. Columns 1–4 use hospital beds per 100,000 persons and columns 5 and 6
use the log of this measure. All specifications reported in table 2 and subsequent tables present
robust standard errors clustered by state.
Our coefficients of interest, the state CON program measures, are all negative and
statistically significant in most specifications. This suggests that CON programs correlate with
fewer hospital beds. Throughout the United States there are, on average, 362 hospital beds per

11
100,000 persons. Controlling for demographics and year-specific effects, the presence of a state
CON program is associated with 99 fewer hospital beds per 100,000 persons. As we discussed
earlier, not every state CON program regulates acute hospital beds. If we control for the effect of
regulation of acute hospital beds, the reduction increases to about 131 fewer hospital beds per
100,000, as shown in column 3.
Our results in column 4 of table 2 show that the stringency and effectiveness of CON
programs vary by state. When we measure stringency by the number of services regulated in a
state, we find 4.7 fewer hospital beds per 100,000 persons for each additional regulated service.
Recall that among states with CON programs, the average number of regulated services is about
fourteen, the minimum, one, and the maximum, twenty-eight. Because the average CON program
reduces the number of beds per 100,000 by about 66, as shown in column 4, we would expect to
see roughly 132 fewer hospital beds in states that regulate the maximum number of services. Our
log specifications produce similar magnitudes, and the −13 percent estimate in column 5 closely
resembles the −12.3 percent estimate that Eichmann and Santerre (2011) present.
Table 3 (page 26) shows the effect of CON programs on the number of hospitals that
offer MRI services. The estimated coefficients on the CON measures are negative across all
specifications and statistically significant in all but one specification. An average of six
hospitals per 500,000 persons offer MRI services. CON programs reduce MRI provision by
between one and two hospitals per 500,000 persons. As expected, if a CON program regulates
MRI machines, the effect increases in absolute value, to 2.5 fewer hospitals. The effects in
columns 4, 5, and 6 are similar.
Table 4 (page 27) reports the effect of CON programs on the number of hospitals with
CT scanners per 500,000 persons. All specifications show a negative effect of CON programs on

12
availability of CT scanners. About half of the estimated coefficients are statistically significant.
In the average state, nine hospitals per 500,000 individuals offer CT scans. The presence of a
CON program in a state is associated with about 2.5 to 3.5 fewer hospitals offering CT scans. If a
CON program specifically regulates CT scanners, the reduction increases roughly 25 percent in
absolute value, from −3.41 to −4.27. Our estimated coefficient for CON regulation per covered
service, −0.16, implies that for the average CON program, which regulates 14 services, 2.24
fewer hospitals per 500,000 persons offer CT scanning.
We can compare the effects on MRI machines and CT scanners, which are potential
substitutes for hospitals. Since we estimate that CON programs reduce MRI provision by one to
two hospitals per 500,000 persons and reduce CT scanners by 2.5 to 3.5 hospitals, it appears that
CON programs have a larger effect on CT-scan services than on MRI services. When these
estimates are compared to their standard deviations, the effect on MRIs is slightly larger. CON
regulation decreases the availability of each of these services by about one standard deviation.
According to the Technology Price Index from Modern Healthcare and the ECRI Institute
(2014), MRI machines are more expensive than CT scanners. As of January 2014, the average
MRI machine costs $1.6 million and the average CT scanner is priced at $913,000. In terms of
CON regulations, MRI machines are regulated in 42 percent of our state-year observations, as
compared to 29 percent for CT scanners.
That MRI machines are the more expensive capital investment and are regulated more
frequently than CT scanners suggests that CON regulations exert tighter control over MRI
machines. Thus, hospitals have an incentive to invest in more CT scanners than MRI machines,
and the effect of CON regulation on MRI machines should be larger than the effect on CT
scanners. The figures we report in table 1 show that more hospitals offer CT scanning than

13
MRIs. The mean number of hospitals offering CT scans is nine hospitals per 500,000 persons,
as compared to only six hospitals for MRIs, though the standard deviation for CT scanners is
also higher—that is, 5.2 and 2.7 for CT scanners and MRI machines, respectively. This
evidence is not conclusive, but is consistent with our expectation that hospitals invest in CT
scanners at the margin.
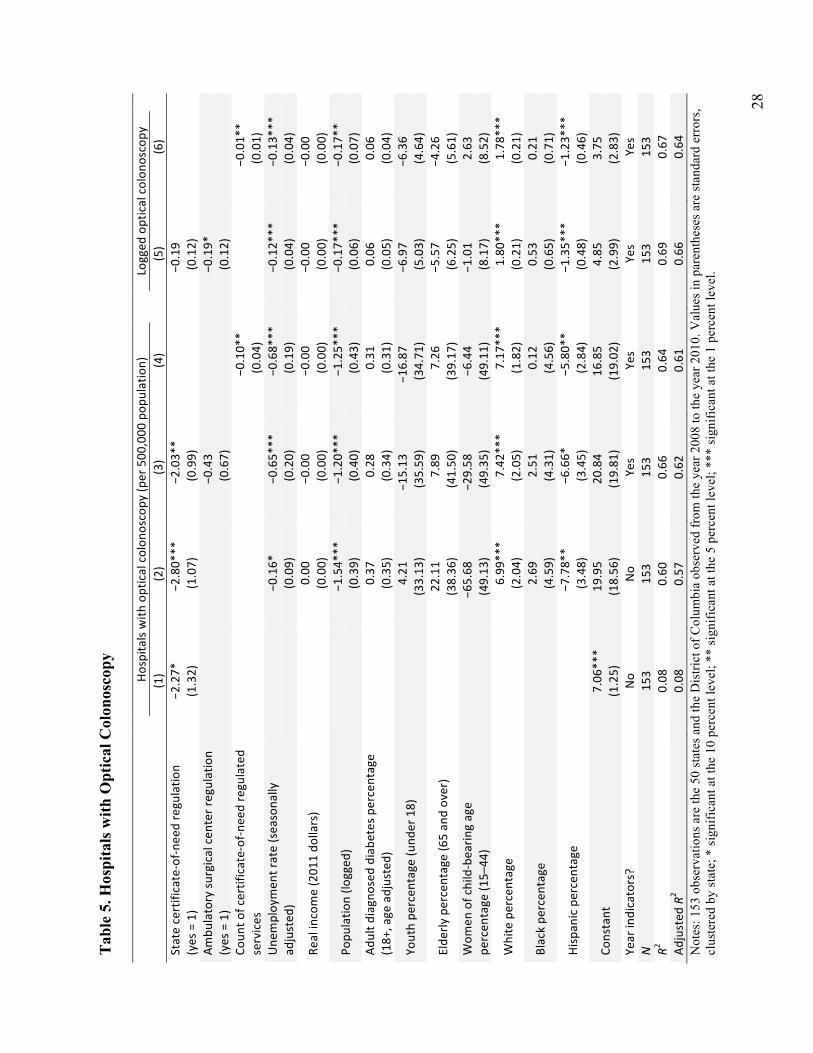
The estimated effect of CON programs on the provision of optical colonoscopy, shown in
table 5 (page 28), is negative in all specifications and statistically significant in four of the six
models. The mean number of hospitals offering optical colonoscopy is about 5.5 per 500,000
persons. Between the count measure of CON regulation and the indicator variable for CON
presence, the results show that CON regulations reduce the number of hospitals offering optical
colonoscopy by between 1.4 and 2.8 per 500,000 persons.
We hypothesize that hospitals are more likely to provide optical colonoscopies where
ambulatory surgical centers are restricted because optical colonoscopies are typically classified
as an outpatient surgery, and ambulatory surgical centers can perform them away from hospital
facilities. In table 5, column 3, we include an indicator for regulation of ambulatory surgery
centers. We do not find evidence for this conjecture: the estimated effect is negative, small, and
not statistically different from zero.
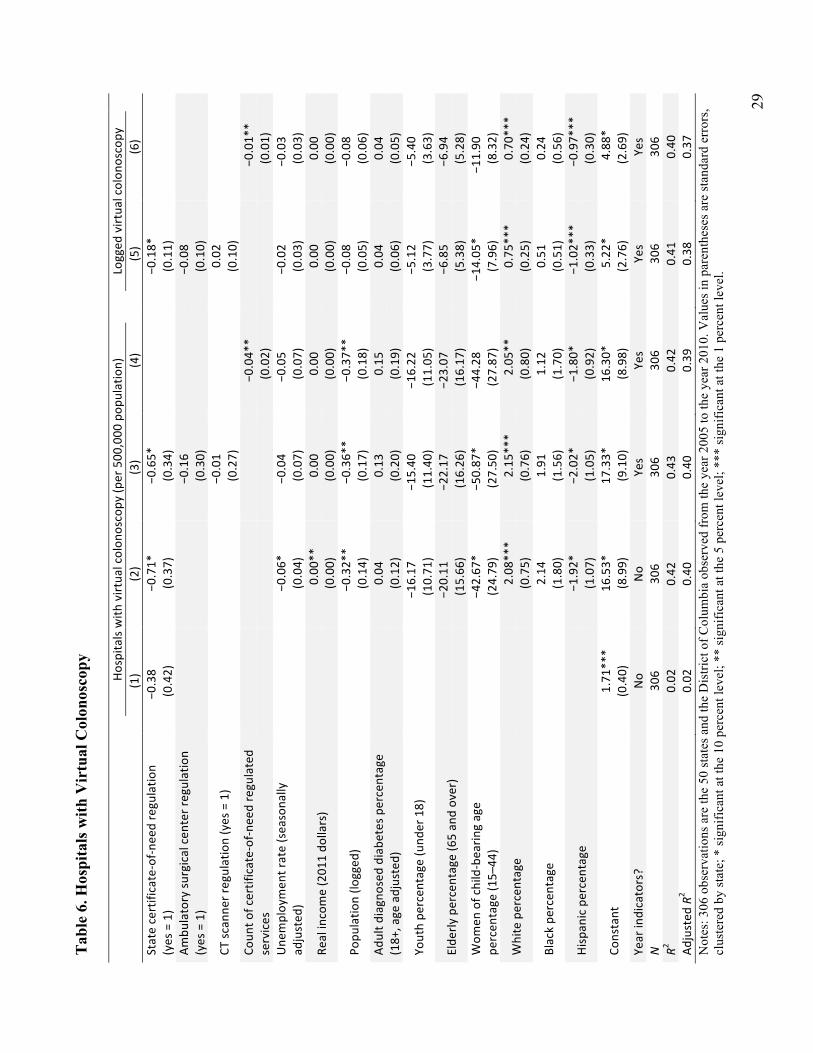
The majority of the coefficients on variables of interest in our estimates for the effect of
CON regulation on virtual colonoscopy are negative, as shown in table 6 (page 29). Two
coefficients are statistically significant. Like optical colonoscopy, virtual colonoscopy is an
outpatient surgery. The key difference between the two procedures is that for virtual colonoscopy
a CT scanner is used to make the surgery less invasive. Thus, in addition to our binary variable
for the presence of a CON program and the count of regulated services, we also include dummies

14
for ambulatory surgical centers and CT scanner regulation. These coefficients are both small and
statistically insignificant.
In line with the previous tables, CON regulations correlate with fewer hospitals offering
virtual colonoscopy. On average, about 1.5 hospitals per 500,000 persons provide virtual
colonoscopy. CON programs reduce this number by roughly a third, the specifics depending on
the indicator of CON regulation.
4.2. Certificate-of-Need Regulation and Indigent Care
We calculate our measure of uncompensated care as the sum of hospital-level uncompensated
care in a state divided by the number of beds in the reporting hospitals. Table 7 (page 30) shows
the effect of CON programs on uncompensated care. For the years 2007 to 2011, the average
annual level of uncompensated care was about $100,000 per reporting hospital bed.
The results in table 7 suggest that CON programs do not have an effect on indigent care,
as measured by uncompensated care. The estimated effect is negative in half of the specifications
and positive in the other half. Additionally, the coefficients are small relative to the standard
deviation, and none are statistically significant.
Of the 37 CON programs, 13 have made charity care a requirement in the CON
application process. To measure the impact of these requirements on reported uncompensated
care, we include an indicator that tracks the presence of these requirements.12 The estimated
effect of charity care requirements is positive, but is never statistically significant. For those
12 The CON programs that have these requirements, and the years when these requirements were added to state statutes, are Connecticut in 2007, Delaware in 2005, the District of Columbia in 1996, Florida in 1987, Georgia in 2008, Illinois in 2009, Iowa in 1991, Nebraska in 1997, North Carolina in 1983, Ohio in 2009, Virginia in 1991, Washington in 1979, and West Virginia in 1977.

15
regressions where we estimate a negative effect of CON programs, the net effect, taking into
account charity care requirements, is smaller but would still be negative.
We have tested two other variations of uncompensated care but do not report the results.
Because the results of these tests were nearly identical to those reported in table 7, we avoid
unnecessary duplication. In the first case, we divide uncompensated care by the population in the
state. One problem with this straight per capita metric is that the number of reporting hospitals
changes from year to year, which means the variation in measured uncompensated care per
capita may be driven by changes in the number of reporting hospitals, not by changes in actual
uncompensated care rates.
To address this issue, we use a second per capita measure, in which we multiply the
straight per capita measure by the fraction of reporting beds in a state. For example, suppose a
state has 10,000 hospital beds and the number of beds in reporting hospitals in that state was
6,000 in a given year. We would divide the aggregate total of uncompensated care by 60 percent
of the population in that state. Here we assume that population is distributed in the same manner
that hospitals file cost reports. While this assumption is strong, we use it as an attempt to account
for the year-to-year changes in reporting hospitals.
Our per-bed metric inaccurately measures provision of uncompensated care if larger
hospitals were more likely both to file a cost report and to provide different amounts of
uncompensated care. Still, averaging uncompensated care by the number of reporting beds
seemed to be the most accurate way to scale this measure.
We also investigate several other measures of indigent care. Taken together, our
regression results show little evidence of a cross-subsidy for Medicaid patients. Since Medicaid
is the largest source of funding for health care for low-income groups in the United States

16
(O’Neill 2014), we test two measures related to Medicaid patients. Medicaid is an insurance
program that reimburses hospitals for health care services, but some studies show that Medicaid
patients often have higher patient costs and lower reimbursement rates (Miller 2014). The results
of those studies lead us to test whether there is evidence that the hypothetical indigent-care cross-
subsidy goes toward providing increased access to Medicaid patients.
In table 8 (page 31) we report the results for the percentage of inpatient days for Medicaid
patients. The coefficients on the CON variables are positive, but the estimated effects are small,
and only one of the four is statistically significant. Approximately 17 percent of all inpatient days
are accounted for by Medicaid patients. CON programs correlate with an increase in Medicaid
patient days of between 0.3 and 1.3 percentage points, a range whose maximum is about one-third
of the standard deviation. In column 4 the coefficient for count of regulated services is 0.001 and is
statistically significant. For the average CON program, with 14 regulated services, this amounts to
an increase of 0.014 patient days, a nearly identical magnitude to the effect reported in column 3.
We also tested, but do not report in our tables, regressions with the percentage of
admissions by Medicaid patients. The descriptive statistics are similar to inpatient days, with the
same mean, 17 percent, and a correlation coefficient between these measures of 0.61. The results
of these specifications were similar to those in table 8, with one exception. The sign on the
binary CON-program variable switched to negative, −0.002, in the specification that includes the
dummy for acute hospital beds.
4.3. Limitations and Alternative Interpretations
A major limitation of this study is that while we are able to present correlations, we do not
have an identification strategy that allows us to give a causal interpretation to our results.

17
Future studies should address this concern by identifying a causal mechanism for how CON
regulations are able to enforce the cross-subsidy. Because CON programs often report their
decisions for individual applications, with hospital-level data it may be possible to identify the
effect directly.
Other limitations of this study relate to our measurement of indigent care. We use
uncompensated-care data because this measure is the closest available metric for measuring
indigent care, and its widespread use in health economics suggests the profession agrees.
However, one could argue that an increase in uncompensated care may not represent a true
increase in indigent care. If regulators focus on uncompensated care to monitor the provision of
indigent care, this may simply incentivize hospitals to provide more unnecessary, but billable,
services to the same number of patients as before. Costs will have increased, but indigent care
will not have increased in a meaningful sense.
In light of the weaknesses of our study, we do not place undue weight on any single
measure. Our empirical strategy is to look for an increase in indigent care across multiple
measures and draw our conclusions on the basis of the overall patterns.
5. Discussion and Conclusion
This paper analyzes the connection between CON laws and cross-subsidization in the health
care industry. We consider CON laws as a mechanism for financing a subsidy to the
medically indigent.
The theory of cross-subsidization requires that CON programs do two things: First, they
must act as an entry barrier to reduce the competitiveness of regulated medical sectors and
increase the profitability of existing providers. Accomplishing that, these regulations must also

18
force firms to provide the cross-subsidy. CON laws must provide incentives for the regulated to
use their profits to provide more indigent services than they otherwise would.
We investigated indigent care with state-level hospital data and put together the most
comprehensive CON-regulation database to date. We do not find any evidence of an increase in
indigent care. Our coefficients are small in magnitude, not statistically different from zero, and
the direction of the effect changes across specifications. Our evidence is consistent with previous
studies in showing that CON programs are effective at restricting the supply of regulated medical
services. It appears, however, that CON programs do not induce cross-subsidization. Since we
lack measures of hospital profitability, our data do not allow us to make conclusions about
whether this is because supply restrictions have not increased hospital profits, or because
indigent care provision is not sufficiently enforced by the states that have these provisions.

19
References
American Health Planning Association (AHPA) (2012). National Directory: State Certificate of Need Programs, Health Planning Agencies. Annual volumes, 1994–2012. Falls Church, Virginia: American Health Planning Association.
American Hospital Association (AHA) and Health Forum (2013). AHA Hospital Statistics 2013: The Comprehensive Reference Source for Analysis and Comparison of Hospital Trends. Hospital Statistics. Chicago, Illinois: American Hospital Association.
American Hospital Association (AHA) and Health Forum (2014). AHA Annual Survey Database. Chicago, Illinois: American Hospital Association.
Banks, D. A., S. E. Foreman, and T. E. Keeler (1999). Cross-subsidization in hospital care: Some lessons from the law and economics of regulation. Health Matrix 9(1), 1–35.
Becker, G. S. (1983). A theory of competition among pressure groups for political influence. The Quarterly Journal of Economics 98(3), 371–400.
Campbell, E. S. and G. M. Fournier (1993). Certificate-of-need deregulation and indigent hospital care. Journal of Health Politics, Policy and Law 18(4), 905–25.
Centers for Medicare and Medicaid Services (CMS). (2014). Healthcare Cost Reporting Information System (HCRIS). Department of Health and Human Services.
Conover, C. J. and F. A. Sloan (1998). Does removing certificate-of-need regulations lead to a surge in health care spending? Journal of Health Politics, Policy and Law 23(3), 455–81.
Cutler, D. M. (1998). Cost shifting or cost cutting? The incidence of reductions in Medicare payments. In J. M. Poterba (Ed.), Tax Policy and the Economy, Volume 12, pp. 1–28. MIT Press.
DaimlerChrysler Corporation (2002). Certificate-of-need.
David, G., R. Lindrooth, L. A. Helmchen, and L. R. Burns (2011). Do hospitals cross subsidize? Working Paper 17300, National Bureau of Economic Research.
Dranove, D. (1988). Pricing by non-profit institutions: The case of hospital cost-shifting. Journal of Health Economics 7(1), 47–57.
Dranove, D., C. Garthwaite, and C. Ody (2013). How do hospitals respond to negative financial shocks? The impact of the 2008 stock market crash. Working Paper 18853, National Bureau of Economic Research.
Eichmann, T. L. and R. E. Santerre (2011). Do hospital chief executive officers extract rents from certificate-of-need laws? Journal of Health Care Finance 37(4), 1–14.

20
Faulhaber, G. R. (1975). Cross-subsidization: Pricing in public enterprises. American Economic Review 65(5), 966–77.
Ford, J. M. and D. L. Kaserman (1993). Certificate-of-need regulation and entry: Evidence from the dialysis industry. Southern Economic Journal 59(4), 783–91.
Ford Motor Company (2000). Relative cost data vs. certificate-of-need (CON) for states in which Ford has a major presence.
Fournier, G. M. and E. S. Campbell (1997). Indigent care as quid pro quo in hospital regulation. Review of Economics and Statistics 79(4), 669–73.
Frakt, A. B. (2011). How much do hospitals cost shift? A review of the evidence. Milbank Quarterly 89(1), 90–130.
Frakt, A. B. (2014). The end of hospital cost shifting and the quest for hospital productivity. Health Services Research 49(1), 1–10.
General Motors Corporation (2002). Statement of general motors corporation on the certificate-of-need (CON) program in Michigan.
Hellinger, F. J. (1976). The effect of certificate-of-need legislation on hospital investment. Inquiry: A Journal of Medical Care Organization, Provision and Financing 13(2), 187–93.
Joskow, P. L. (1980). The effects of competition and regulation on hospital bed supply and the reservation quality of the hospital. Bell Journal of Economics 11(2), 421–47.
Joskow, P. L. (1981). Controlling Hospital Costs: The Role of Government Regulation. Cambridge, Massachusetts: MIT Press.
Miller, R. D. and R. C. Hutton (2004). Problems in Health Care Law. Jones & Bartlett Learning.
Miller, T. P. (2014). How to achieve sustainable Medicaid reform. In J. J. Fichtner (Ed.), The Economics of Medicaid, pp. 147–72. Arlington, Virginia: Mercatus Center at George Mason University.
Modern Healthcare and ECRI Institute (2014). Technology Price Index. Accessed: 2014-04-09. <http://www.modernhealthcare.com/section/technology-price-index>.
National Diabetes Information Clearinghouse (NDIC). (2014). Diabetes, Heart Disease, and Stroke. Accessed: 2014-07-01. US Department of Health and Human Services. <http://diabetes.niddk.nih.gov/dm/pubs/stroke/>.
O’Neill, J. (2014). Medicaid’s cost drivers. In J. J. Fichtner (Ed.), The Economics of Medicaid, pp. 31–45. Arlington, Virginia: Mercatus Center at George Mason University.
Payton, S. and R. M. Powsner (1980). Regulation through the looking glass: Hospitals, Blue Cross, and certificate-of-need. Michigan Law Review 79(2), 203–77.

21
Peltzman, S. (1976). Toward a more general theory of regulation. Journal of Law and Economics 19(2), 211–40.
Posner, R. A. (1971). Taxation by regulation. The Bell Journal of Economics and Management Science 2(1), 22–50.
Rivers, P. A., M. D. Fottler, and J. A. Frimpong (2010). The effects of certificate-of-need regulation on hospital costs. Journal of Health Care Finance 36(4), 1–16.
Rosko, M. D. and R. L. Mutter (2014). The association of hospital cost-inefficiency with certificate-of-need regulation. Medical Care Research and Review 71(3), 280–98.
Salkever, D. S. and T. W. Bice (1976). The impact of certificate-of-need controls on hospital investment. The Milbank Memorial Fund Quarterly. Health and Society 54(2), 185–214.
Santerre, R. E. and D. Pepper (2000). Survivorship in the US hospital services industry. The Milbank Memorial Fund Quarterly. Health and Society 21(5), 181–89.
Simpson, J. B. (1985). State certificate-of-need programs: The current status. American Journal of Public Health 75(10), 1225–29.
Sloan, F. A. (1981). Regulation and the rising cost of hospital care. The Review of Economics and Statistics 63(4), 479–87.
Sloan, F. A. and B. Steinwald (1980). Effects of regulation on hospital costs and input use. Journal of Law and Economics 23(1), 81–109.
Stigler, G. J. (1971). The theory of economic regulation. The Bell Journal of Economics and Management Science 2(1), 3–21.
Troyer, J. L. (2002). Cross-subsidization in nursing homes: Explaining rate differentials among payer types. Southern Economic Journal 68(4), 750–73.
Virginia Department of Health (2004). Guidance Document: Compliance with Conditions on Certificates of Public Need. Accessed: 2014-05-22. <http://www.vdh.virginia.gov/OLC /COPN/copnconditioncompliance.htm>.
Wendling, W. and J. Werner (1980). Non-profit firms and the economic theory of regulation. Quarterly Review of Economics and Business 20(3), 6–18.
White, C. (2013). Contrary to cost-shift theory, lower Medicare hospital payment rates for inpatient care lead to lower private payment rates. Health Affairs 32(5), 935–43.
White, C. and V. Y. Wu (2014). How do hospitals cope with sustained slow growth in Medicare prices? Health Services Research 49(1), 11–31.

22
Wu, V. Y. (2010). Hospital cost shifting revisited: New evidence from the balanced budget act of 1997. International Journal of Health Care Finance and Economics 10(1), 61–83.
Zhang, L. (2008). Uncompensated Care Provision and the Economic Behavior of Hospitals: The Influence of the Regulatory Environment. PhD thesis, Georgia Institute of Technology.
23
Cer
tific
ate-
of-N
eed
(CO
N) R
egul
atio
n in
the
Uni
ted
Stat
es
* A
s of 2
011,
afte
r the
per
iod
cove
red
in th
is st
udy,
Wis
cons
in h
as re
peal
ed it
s CO
N re
gula
tions
. So
urce
: AH
PA (2
012)
.

24
Tab
le 1
. Sum
mar
y St
atis
tics f
or H
ospi
tal C
apac
ity, C
ertif
icat
e of
Nee
d, a
nd In
dige
nt C
are
Statistic
N
Mean
Stan
. dev.
Min
Med
ian
Max
Hospita
l bed
s (pe
r 100
,000
pop
ulation)
561
362.05
12
1.80
20
8.80
32
7.60
90
6.60
Ho
spita
ls with
MRI se
rvices (p
er 500
,000
pop
ulation)
561
5.87
2.69
1.91
5.12
17
.21
Hospita
ls with
CT scan
ner (pe
r 500
,000
pop
ulation)
561
9.00
5.20
2.55
7.37
26
.27
Hospita
ls with
optical colon
oscopy (p
er 500
,000
pop
ulation)
153
5.41
3.55
1.17
4.24
17
.86
Hospita
ls with
virtua
l colon
oscopy (p
er 500
,000
pop
ulation)
306
1.44
1.11
0.00
1.12
6.82
Uncom
pensated
care (dollars per cap
ita)
204
247.40
41
0.10
53
.30
206.40
5,77
3.00
Uncom
pensated
care (dollars per cap
ita, adjusted)
204
517.40
87
9.40
14
4.50
40
9.20
12
,549
.00
Uncom
pensated
care (per re
porting be
d)
204
109,34
6 10
3,84
1 27
,234
91
,440
1,30
6,57
4 Ho
spita
l inp
atient days: percentage Med
icaid
561
0.16
0.04
0.08
0.16
0.31
Facility ad
miss
ions: p
ercentage Med
icaid
561
0.17
0.03
0.09
0.17
0.29
State certificate-‐of-‐n
eed regulatio
n (yes = 1)
561
0.73
0.45
0
1 1
Coun
t of certificate-‐of-‐need regulated services
561
10.13
9.02
0
9 28
Ac
ute ho
spita
l bed
regulatio
n (yes = 1)
561
0.54
0.50
0
1 1
Ambu
latory su
rgical cen
ter regulation (yes = 1)
561
0.53
0.50
0
1 1
CT sc
anne
r regulation (yes = 1)
561
0.27
0.44
0
0 1
MRI re
gulatio
n (yes = 1)
561
0.39
0.49
0
0 1
Certificate-‐of-‐n
eed ap
plication: cha
rity care re
quire
d (yes = 1)
561
0.19
0.39
0
0 1
Une
mploymen
t rate (seasona
lly adjusted)
561
5.52
1.98
2.30
5.10
13
.80
State real per cap
ita income (201
1 do
llars)
561
30,875
7,91
7 16
,501
30
,166
67
,634
Po
pulatio
n (× 1,000
) 56
1 5,80
2 6,47
2 49
4 4,10
1 37
,267
Ad
ult d
iagnosed
diabe
tes p
ercentage (18+
, age adjusted)
561
7.25
1.41
4.60
7.10
11
.30
Youth pe
rcen
tage (u
nder 18)
561
0.25
0.02
0.17
0.25
0.32
Elde
rly percentage (65 an
d over)
561
0.12
0.02
0.05
0.12
0.17
Wom
en of child-‐bearin
g age pe
rcen
tage (1
5–44
) 56
1 0.21
0.01
0.18
0.21
0.27
White percentage
561
0.81
0.14
0.26
0.84
0.97
Black pe
rcen
tage
561
0.11
0.11
0.00
0.08
0.61
Hispan
ic percentage
561
0.09
0.09
0.01
0.06
0.46

25
Tab
le 2
. Hos
pita
l Bed
s
Hospita
l bed
s (pe
r 100
,000
pop
ulation)
Logged
hospital bed
s
(1)
(2)
(3)
(4)
(5)
(6)
State certificate-‐of-‐n
eed regulatio
n (yes = 1)
−2.78
(41.02
) −9
9.00
***
(31.19
) −6
1.47
* (36.02
)
−0.13
(0.09)
Acute ho
spita
l bed
regulatio
n (yes = 1)
−70.07
***
(25.87
)
−0.17*
* (0.07)
Coun
t of certificate-‐of-‐need regulated
services
−4
.66*
**
(1.45)
−0
.01*
**
(0.00)
Une
mploymen
t rate (seasona
lly
adjusted
)
−4.06
(2.96)
−1.21
(6.55)
−4.85
(6.98)
−0.01
(0.02)
−0.02
(0.02)
Real income (201
1 do
llars)
0.00
0 (0.002
) 0.00
4 (0.003
) 0.00
2 (0.003
) 0.00
0 (0.000
) 0.00
0 0.00
0
Popu
latio
n (lo
gged
)
−48.67
***
(13.76
) −5
5.37
***
(12.69
) −5
5.21
***
(15.31
) −0
.11*
**
(0.03)
−0.11*
**
(0.04)
Adult d
iagnosed
diabe
tes p
ercentage
(18+
, age adjusted)
13
.25
(9.15)
29.71*
**
(10.70
) 27
.24*
* (12.50
) 0.08
***
(0.03)
0.08
**
(0.03)
Youth pe
rcen
tage (u
nder 18)
30
.95
(1,218
.00)
−158
.70
(1,078
.00)
−148
.70
(1,175
.00)
0.07
(2.74)
0.21
(3.05)
Elde
rly percentage (65 an
d over)
3,40
2.00
***
(1,291
.00)
2,68
6.00
**
(1,209
.00)
2,85
1.00
**
(1,322
.00)
6.35
**
(3.05)
6.89
**
(3.38)
Wom
en of child-‐bearin
g age
percen
tage (1
5–44
)
3,28
6.00
* (1,807
.00)
1,69
3.00
(1,801
.00)
3,39
3.00
* (2,049
.00)
1.03
(4.97)
5.03
(5.62)
White percentage
−1
1.62
(98.97
) −1
1.59
(80.73
) −2
5.92
(81.51
) −0
.003
(0.18)
−0.03
(0.19)
Black pe
rcen
tage
40
1.90
**
(188
.40)
387.90
**
(164
.40)
255.10
(178
.00)
0.95
**
(0.39)
0.66
(0.42)
Hispan
ic percentage
−3
10.00*
**
(110
.20)
−301
.90*
**
(105
.40)
−279
.40*
**
(94.64
) −0
.89*
**
(0.26)
−0.84*
**
(0.25)
Constant
364.50
***
(36.54
) −3
51.90
(746
.70)
0.33
(630
.80)
−336
.40
(706
.80)
5.29
***
(1.74)
4.45
**
(1.98)
Year indicators?
No
No
Yes
Yes
Yes
Yes
N
561
561
561
561
561
561
R2
0.00
01
0.60
0.64
0.59
0.62
0.56
Ad
justed
R2
−0.002
0.59
0.63
0.57
0.60
0.54
N
otes
: 561
obs
erva
tions
are
the
50 st
ates
and
the
Dis
trict
of C
olum
bia
obse
rved
from
the
year
200
0 to
the
year
201
0. V
alue
s in
pare
nthe
ses a
re st
anda
rd e
rror
s, cl
uste
red
by st
ate;
* si
gnifi
cant
at t
he 1
0 pe
rcen
t lev
el; *
* si
gnifi
cant
at t
he 5
per
cent
leve
l; **
* si
gnifi
cant
at t
he 1
per
cent
leve
l.

26
Tab
le 3
. Hos
pita
ls w
ith M
agne
tic R
eson
ance
Imag
ing
(MR
I) S
ervi
ces
Hospita
ls with
MRI se
rvices (p
er 500
,000
pop
ulation)
Logged
hospital M
RI se
rvices
(1)
(2)
(3)
(4)
(5)
(6)
State certificate-‐of-‐n
eed regulatio
n (yes = 1)
−1.28
(0.98)
2.10
***
(0.76)
−1.85*
* (0.87)
−0
.26*
* (0.11)
MRI re
gulatio
n (yes = 1)
−0.64
(0.55)
−0
.07
(0.09)
Coun
t of certificate-‐of-‐need regulated
services
−0
.10*
**
(0.03)
−0
.01*
**
(0.00)
Une
mploymen
t rate (seasona
lly
adjusted
)
−0.10
(0.07)
−0.12
(0.11)
−0.18
(0.11)
−0.02
(0.02)
−0.03
(0.02)
Real income (201
1 do
llars)
0.00
(0.00)
−0.00
(0.00)
−0.00
(0.00)
−0.00*
* (0.00)
−0.00*
* (0.00)
Popu
latio
n (lo
gged
)
−1.26*
**
(0.31)
−1.25*
**
(0.36)
−1.30*
**
(0.38)
−0.18*
**
(0.05)
−0.19*
**
(0.05)
Adult d
iagnosed
diabe
tes p
ercentage
(18+
, age adjusted)
0.33
**
(0.17)
0.35
(0.28)
0.40
(0.28)
0.04
(0.04)
0.05
(0.04)
Youth pe
rcen
tage (u
nder 18)
−4
.93
(21.58
) −1
3.50
(19.62
) −1
4.14
(19.58
) −2
.73
(3.04)
−3.20
(3.02)
Elde
rly percentage (65 an
d over)
−3
.93
(25.90
) −8
.89
(29.38
) −1
2.65
(31.76
) −1
.16
(4.04)
−2.01
(4.23)
Wom
en of child-‐bearin
g age
percen
tage (1
5–44
)
−70.97
(36.04
) −5
7.59
(55.79
) −4
4.24
(55.85
) −2
.82
(7.50)
−0.98
(7.52)
White percentage
4.24
***
(1.21)
4.00
***
(1.31)
3.58
***
(1.32)
0.61
***
(0.16)
0.54
***
(0.16)
Black pe
rcen
tage
4.82
(3.21)
3.81
(2.75)
2.11
(2.76)
0.48
(0.42)
0.21
(0.43)
Hispan
ic percentage
−7
.29*
**
(2.54)
−7.89*
**
(2.51)
−6.59*
**
(2.26)
−1.42*
**
(0.38)
−1.28*
**
(0.36)
Constant
6.80
***
(0.92)
29.73*
* (14.62
) 30
.21*
(16.96
) 28
.11*
(17.03
) 4.59
**
(2.29)
4.45
**
(2.26)
Year indicators?
No
No
Yes
Yes
Yes
Yes
N
561
561
561
561
561
561
R2
0.04
0.56
0.57
0.56
0.60
0.60
Ad
justed
R2
0.04
0.56
0.56
0.54
0.58
0.58
N
otes
: 561
obs
erva
tions
are
the
50 st
ates
and
the
Dis
trict
of C
olum
bia
obse
rved
from
the
year
200
0 to
the
year
201
0. V
alue
s in
pare
nthe
ses a
re st
anda
rd e
rror
s, cl
uste
red
by st
ate;
* si
gnifi
cant
at t
he 1
0 pe
rcen
t lev
el; *
* si
gnifi
cant
at t
he 5
per
cent
leve
l; **
* si
gnifi
cant
at t
he 1
per
cent
leve
l.

27
Tab
le 4
. Hos
pita
ls w
ith C
ompu
ted
Tom
ogra
phy
(CT
) Sca
nner
s
Hospita
ls with
CT scan
ners (p
er 500
,000
pop
ulation)
Logged
hospital CT scan
ners
(1)
(2)
(3)
(4)
(5)
(6)
State certificate-‐of-‐n
eed regulatio
n (yes = 1)
−2.45
(1.92)
−3.41*
* (1.56)
−3.01*
(1.70)
−0
.26*
(0.15)
CT sc
anne
r regulation (yes = 1)
−1.26
(0.87)
−0
.10
(0.09)
Coun
t of certificate-‐of-‐need regulated
services
−0.16
**
(0.06)
−0
.01*
**
(0.01)
Une
mploymen
t rate (seasona
lly
adjusted
)
−0.26*
* (0.12)
−0.39
(0.24)
−0.47*
(0.24)
−0.04
(0.03)
−0.04*
(0.03)
Real income (201
1 do
llars)
−0
.00
(0.00)
−0.00
(0.00)
−0.00
(0.00)
−0.00*
* (0.00)
−0.00*
* (0.00)
Popu
latio
n (lo
gged
)
−2.25*
**
(0.61)
−2.23*
**
(0.64)
−2.32*
**
(0.68)
−0.20*
**
(0.07)
−0.21*
**
(0.07)
Adult d
iagnosed
diabe
tes p
ercentage
(18+
, age adjusted)
0.26
(0.37)
0.27
(0.51)
0.48
(0.52)
0.02
(0.05)
0.05
(0.05)
Youth pe
rcen
tage (u
nder 18)
16
.44
(48.74
) 1.93
(47.05
) 1.13
(49.20
) −2
.47
(4.73)
−2.95
(4.81)
Elde
rly percentage (65 an
d over)
17
.57
(52.65
) 5.27
(56.03
) −1
.12
(60.46
) −2
.21
(5.61)
−3.13
(5.85)
Wom
en of child-‐bearin
g age
percen
tage (1
5–44
)
−144
.60*
(77.47
) −1
32.40
(102
.40)
−110
.10
(102
.70)
−6.42
(10.61
) −4
.66
(10.57
)
White percentage
8.27
***
(2.68)
7.43
***
(2.69)
7.48
***
(2.53)
0.85
***
(0.21)
0.83
***
(0.19)
Black pe
rcen
tage
9.93
(6.72)
8.21
(5.99)
5.50
(6.35)
0.54
(0.60)
0.28
(0.62)
Hispan
ic percentage
−1
3.82
**
(5.55)
−14.14
**
(5.58)
−12.50
**
(4.89)
−1.79*
**
(0.59)
−1.69*
**
(0.55)
Constant
10.77*
**
(1.79)
49.08
(30.74
) 52
.94
(32.97
) 48
.13
(33.34
) 6.18
* (3.40)
5.97
* (3.36)
Year indicators?
No
No
Yes
Yes
Yes
Yes
N
561
561
561
561
561
561
R2
0.04
0.58
0.59
0.58
0.60
0.60
Ad
justed
R2
0.04
0.57
0.57
0.56
0.59
0.58
N
otes
: 561
obs
erva
tions
are
the
50 st
ates
and
the
Dis
trict
of C
olum
bia
obse
rved
from
the
year
200
0 to
the
year
201
0. V
alue
s in
pare
nthe
ses a
re st
anda
rd e
rror
s, cl
uste
red
by st
ate;
* si
gnifi
cant
at t
he 1
0 pe
rcen
t lev
el; *
* si
gnifi
cant
at t
he 5
per
cent
leve
l; **
* si
gnifi
cant
at t
he 1
per
cent
leve
l.
28
Tab
le 5
. Hos
pita
ls w
ith O
ptic
al C
olon
osco
py
Hospita
ls with
optical colon
oscopy (p
er 500
,000
pop
ulation)
Logged
optical colon
oscopy
(1)
(2)
(3)
(4)
(5)
(6)
State certificate-‐of-‐n
eed regulatio
n (yes = 1)
−2.27*
−2
.80*
**
−2.03*
*
−0.19
(1.32)
(1.07)
(0.99)
(0.12)
Am
bulatory su
rgical cen
ter regulation
(yes = 1)
−0.43
−0
.19*
(0.67)
(0.12)
Co
unt o
f certificate-‐of-‐need regulated
services
−0
.10*
*
−0.01*
*
(0.04)
(0.01)
Une
mploymen
t rate (seasona
lly
adjusted
)
−0.16*
−0
.65*
**
−0.68*
**
−0.12*
**
−0.13*
**
(0.09)
(0.20)
(0.19)
(0.04)
(0.04)
Real income (201
1 do
llars)
0.00
−0
.00
−0.00
−0.00
−0.00
(0.00)
(0.00)
(0.00)
(0.00)
(0.00)
Popu
latio
n (lo
gged
)
−1.54*
**
−1.20*
**
−1.25*
**
−0.17*
**
−0.17*
*
(0.39)
(0.40)
(0.43)
(0.06)
(0.07)
Adult d
iagnosed
diabe
tes p
ercentage
(18+
, age adjusted)
0.37
0.28
0.31
0.06
0.06
(0.35)
(0.34)
(0.31)
(0.05)
(0.04)
Youth pe
rcen
tage (u
nder 18)
4.21
−1
5.13
−1
6.87
−6
.97
−6.36
(33.13
) (35.59
) (34.71
) (5.03)
(4.64)
Elde
rly percentage (65 an
d over)
22
.11
7.89
7.26
−5
.57
−4.26
(38.36
) (41.50
) (39.17
) (6.25)
(5.61)
Wom
en of child-‐bearin
g age
percen
tage (1
5–44
)
−65.68
−2
9.58
−6
.44
−1.01
2.63
(49.13
) (49.35
) (49.11
) (8.17)
(8.52)
White percentage
6.99
***
7.42
***
7.17
***
1.80
***
1.78
***
(2.04)
(2.05)
(1.82)
(0.21)
(0.21)
Black pe
rcen
tage
2.69
2.51
0.12
0.53
0.21
(4.59)
(4.31)
(4.56)
(0.65)
(0.71)
Hispan
ic percentage
−7
.78*
* −6
.66*
−5
.80*
* −1
.35*
**
−1.23*
**
(3.48)
(3.45)
(2.84)
(0.48)
(0.46)
Constant
7.06
***
19.95
20.84
16.85
4.85
3.75
(1.25)
(18.56
) (19.81
) (19.02
) (2.99)
(2.83)
Year indicators?
No
No
Yes
Yes
Yes
Yes
N
153
153
153
153
153
153
R2
0.08
0.60
0.66
0.64
0.69
0.67
Ad
justed
R2
0.08
0.57
0.62
0.61
0.66
0.64
N
otes
: 153
obs
erva
tions
are
the
50 st
ates
and
the
Dis
trict
of C
olum
bia
obse
rved
from
the
year
200
8 to
the
year
201
0. V
alue
s in
pare
nthe
ses a
re st
anda
rd e
rror
s, cl
uste
red
by st
ate;
* si
gnifi
cant
at t
he 1
0 pe
rcen
t lev
el; *
* si
gnifi
cant
at t
he 5
per
cent
leve
l; **
* si
gnifi
cant
at t
he 1
per
cent
leve
l.
29
Tab
le 6
. Hos
pita
ls w
ith V
irtu
al C
olon
osco
py
Hospita
ls with
virtua
l colon
oscopy (p
er 500
,000
pop
ulation)
Logged
virtua
l colon
oscopy
(1)
(2)
(3)
(4)
(5)
(6)
State certificate-‐of-‐n
eed regulatio
n (yes = 1)
−0.38
−0.71*
−0
.65*
−0.18*
(0.42)
(0.37)
(0.34)
(0.11)
Am
bulatory su
rgical cen
ter regulation
(yes = 1)
−0.16
−0
.08
(0.30)
(0.10)
CT sc
anne
r regulation (yes = 1)
−0.01
0.02
(0.27)
(0.10)
Co
unt o
f certificate-‐of-‐need regulated
services
−0
.04*
*
−0.01*
*
(0.02)
(0.01)
Une
mploymen
t rate (seasona
lly
adjusted
)
−0.06*
−0
.04
−0.05
−0.02
−0.03
(0.04)
(0.07)
(0.07)
(0.03)
(0.03)
Real income (201
1 do
llars)
0.00
**
0.00
0.00
0.00
0.00
(0.00)
(0.00)
(0.00)
(0.00)
(0.00)
Popu
latio
n (lo
gged
)
−0.32*
* −0
.36*
* −0
.37*
* −0
.08
−0.08
(0.14)
(0.17)
(0.18)
(0.05)
(0.06)
Adult d
iagnosed
diabe
tes p
ercentage
(18+
, age adjusted)
0.04
0.13
0.15
0.04
0.04
(0.12)
(0.20)
(0.19)
(0.06)
(0.05)
Youth pe
rcen
tage (u
nder 18)
−1
6.17
−1
5.40
−1
6.22
−5
.12
−5.40
(10.71
) (11.40
) (11.05
) (3.77)
(3.63)
Elde
rly percentage (65 an
d over)
−2
0.11
−2
2.17
−2
3.07
−6
.85
−6.94
(15.66
) (16.26
) (16.17
) (5.38)
(5.28)
Wom
en of child-‐bearin
g age
percen
tage (1
5–44
)
−42.67
* −5
0.87
* −4
4.28
−1
4.05
* −1
1.90
(24.79
) (27.50
) (27.87
) (7.96)
(8.32)
White percentage
2.08
***
2.15
***
2.05
**
0.75
***
0.70
***
(0.75)
(0.76)
(0.80)
(0.25)
(0.24)
Black pe
rcen
tage
2.14
1.91
1.12
0.51
0.24
(1.80)
(1.56)
(1.70)
(0.51)
(0.56)
Hispan
ic percentage
−1
.92*
−2
.02*
−1
.80*
−1
.02*
**
−0.97*
**
(1.07)
(1.05)
(0.92)
(0.33)
(0.30)
Constant
1.71
***
16.53*
17
.33*
16
.30*
5.22
* 4.88
* (0.40)
(8.99)
(9.10)
(8.98)
(2.76)
(2.69)
Year indicators?
No
No
Yes
Yes
Yes
Yes
N
306
306
306
306
306
306
R2
0.02
0.42
0.43
0.42
0.41
0.40
Ad
justed
R2
0.02
0.40
0.40
0.39
0.38
0.37
N
otes
: 306
obs
erva
tions
are
the
50 st
ates
and
the
Dis
trict
of C
olum
bia
obse
rved
from
the
year
200
5 to
the
year
201
0. V
alue
s in
pare
nthe
ses a
re st
anda
rd e
rror
s, cl
uste
red
by st
ate;
* si
gnifi
cant
at t
he 1
0 pe
rcen
t lev
el; *
* si
gnifi
cant
at t
he 5
per
cent
leve
l; **
* si
gnifi
cant
at t
he 1
per
cent
leve
l.

30
Tab
le 7
. Hos
pita
l Unc
ompe
nsat
ed C
are
(per
rep
orte
d be
d)
Uncom
pensated
care (per re
ported
bed
)
Logged
uncom
p. care
(1)
(2)
(3)
(4)
(5)
(6)
State certificate-‐of-‐n
eed
regulatio
n (yes = 1)
6,97
6.00
−9
,380
.00
−13,66
1.00
0.07
(20,71
3.00
) (13,50
7.00
) (14,86
8.00
)
(0.12)
Ac
ute ho
spita
l bed
regulatio
n (yes = 1)
−2,548
.00
0.07
(15,49
0.00
)
(0.14)
Co
unt o
f certificate-‐of-‐need
regulated services
−5
57.20
0.01
(1,944
.00)
(0.01)
Charity
care requ
ired (yes = 1)
4,18
3.00
7,28
6.00
4,71
5.00
0.00
5 0.01
(11,72
2.00
) (14,03
0.00
) (15,25
2.00
) (0.10)
(0.09)
Une
mploymen
t rate (seasona
lly
adjusted
)
1,61
7.00
6,23
6.00
5,70
7.00
0.06
* 0.06
*
(3,419
.00)
(4,536
.00)
(4,967
.00)
(0.03)
(0.03)
Real income (201
1 do
llars)
−2
.00
−0.73
−0.79
−0.00
−0.00
(1.75)
(1.55)
(1.52)
(0.00)
(0.00)
Popu
latio
n (lo
gged
)
2,43
2.00
−1
,349
.00
−1,546
.00
0.07
0.07
(6,878
.00)
(7,710
.00)
(7,932
.00)
(0.05)
(0.05)
Adult d
iagnosed
diabe
tes
percen
tage (1
8+, age adjusted)
−5
,163
.00
−2,106
.00
−2,124
.00
−0.02
−0.03
(6,016
.00)
(5,805
.00)
(6,282
.00)
(0.05)
(0.05)
Youth pe
rcen
tage (u
nder 18)
−1
,813
,548
.00*
**
−1,631
,841
.00*
**
−1,631
,525
.00*
* −9
.28*
* −7
.71*
(624
,266
.00)
(597
,637
.00)
(705
,266
.00)
(4.45)
(4.13)
Elde
rly percentage (65 an
d over)
−1
44,962
.00
−95,37
2.00
−8
1,95
4.00
−4
.03
−2.96
(649
,204
.00)
(659
,800
.00)
(784
,602
.00)
(4.80)
(4.94)
Wom
en of child-‐bearin
g age
percen
tage (1
5–44
)
3,47
8,05
3.00
***
2,91
2,56
7.00
**
3,10
2,96
3.00
***
14.03*
12
.97*
(763
,924
.00)
(1,161
,876
.00)
(1,162
,779
.00)
(7.29)
(6.63)
White percentage
−2
39,766
.00*
**
−242
,538
.00*
**
−241
,099
.00*
**
−0.92*
**
−0.81*
*
(34,51
6.00
) (40,30
8.00
) (59,31
1.00
) (0.30)
(0.33)
Black pe
rcen
tage
−3
16,800
.00*
* −3
19,635
.00*
* −3
33,778
.00*
**
−2.59*
**
−2.40*
**
(135
,418
.00)
(129
,620
.00)
(122
,349
.00)
(0.76)
(0.75)
Hispan
ic percentage
14
0,97
5.00
* 13
2,95
0.00
**
139,98
3.00
**
1.20
***
1.32
***
(72,48
1.00
) (66,17
6.00
) (63,58
7.00
) (0.40)
(0.39)
Constant
104,28
5.00
***
166,06
4.00
18
6,74
8.00
14
6,40
0.00
11
.70*
**
11.26*
**
(17,70
6.00
) (417
,738
.00)
(436
,178
.00)
(529
,704
.00)
(2.64)
(2.78)
Year indicators?
No
No
Yes
Yes
Yes
Yes
N
204
204
204
204
204
204
R2
0.00
1 0.25
0.26
0.26
0.42
0.43
Ad
justed
R2
−0.004
0.21
0.20
0.20
0.37
0.39
N
otes
: 204
obs
erva
tions
are
the
50 st
ates
and
the
Dis
trict
of C
olum
bia
obse
rved
from
the
year
200
7 to
the
year
201
0. V
alue
s in
pare
nthe
ses a
re st
anda
rd e
rror
s, cl
uste
red
by st
ate;
* si
gnifi
cant
at t
he 1
0 pe
rcen
t lev
el; *
* si
gnifi
cant
at t
he 5
per
cent
leve
l; **
* si
gnifi
cant
at t
he 1
per
cent
leve
l.

31
Tab
le 8
. Per
cent
age
of H
ospi
tal I
npat
ient
Day
s for
Med
icai
d Pa
tient
s
Percen
tage of h
ospital inp
atient days for M
edicaid pa
tients
(1)
(2)
(3)
(4)
State certificate-‐of-‐n
eed regulatio
n (yes = 1)
0.00
3 0.01
0.01
(0.01)
(0.01)
(0.01)
Acute ho
spita
l bed
regulatio
n (yes = 1)
0.00
3
(0.01)
Coun
t of certificate-‐of-‐need regulated services
0.00
1**
(0.000
4)
Une
mploymen
t rate (seasona
lly adj.)
0.00
3***
0.00
3 0.00
3
(0.001
) (0.003
) (0.003
)
Real income (201
1 do
llars)
0.00
−0
.00
−0.00
(0.00)
(0.00)
(0.00)
Popu
latio
n (lo
gged
)
−0.003
−0
.002
−0
.002
(0.003
) (0.004
) (0.003
)
Adult d
iagnosed
diabe
tes p
ercentage (18+
, age adj.)
0.00
5*
0.00
1 −0
.001
(0.003
) (0.004
) (0.004
)
Youth pe
rcen
tage
0.12
0.07
0.25
(0.25)
(0.29)
(0.29)
Elde
rly percentage
0.09
0.17
0.33
(0.41)
(0.44)
(0.42)
Wom
en of child-‐bearin
g age pe
rcen
tage (1
5–44
)
0.65
1.02
1.00
(0.55)
(0.68)
(0.63)
White percentage
−0
.06*
−0
.07*
−0
.06
(0.03)
(0.04)
(0.04)
Black pe
rcen
tage
−0
.10*
−0
.10*
−0
.07
(0.06)
(0.06)
(0.06)
Hispan
ic percentage
0.08
**
0.08
**
0.10
***
(0.03)
(0.03)
(0.03)
Constant
0.16
***
−0.003
−0
.04
−0.11
(0.01)
(0.21)
(0.23)
(0.22)
Year indicators?
No
No
Yes
Yes
N
561
561
561
561
R2
0.00
1 0.20
0.22
0.25
Ad
justed
R2
−0.001
0.18
0.19
0.22
N
otes
: 561
obs
erva
tions
are
the
50 st
ates
and
the
Dis
trict
of C
olum
bia
obse
rved
from
the
year
200
0 to
the
year
201
0. V
alue
s in
pare
nthe
ses a
re st
anda
rd e
rror
s, cl
uste
red
by st
ate;
* si
gnifi
cant
at t
he 1
0 pe
rcen
t lev
el; *
* si
gnifi
cant
at t
he 5
per
cent
leve
l;
***
sign
ifica
nt a
t the
1 p
erce
nt le
vel.