nlu school psychology program annual report 2013-2014 1 · nlu school psychology program annual...
TRANSCRIPT
NLU School Psychology Program Annual Report 2013-2014
1
NCE Program Assessment Report (2013-2014)
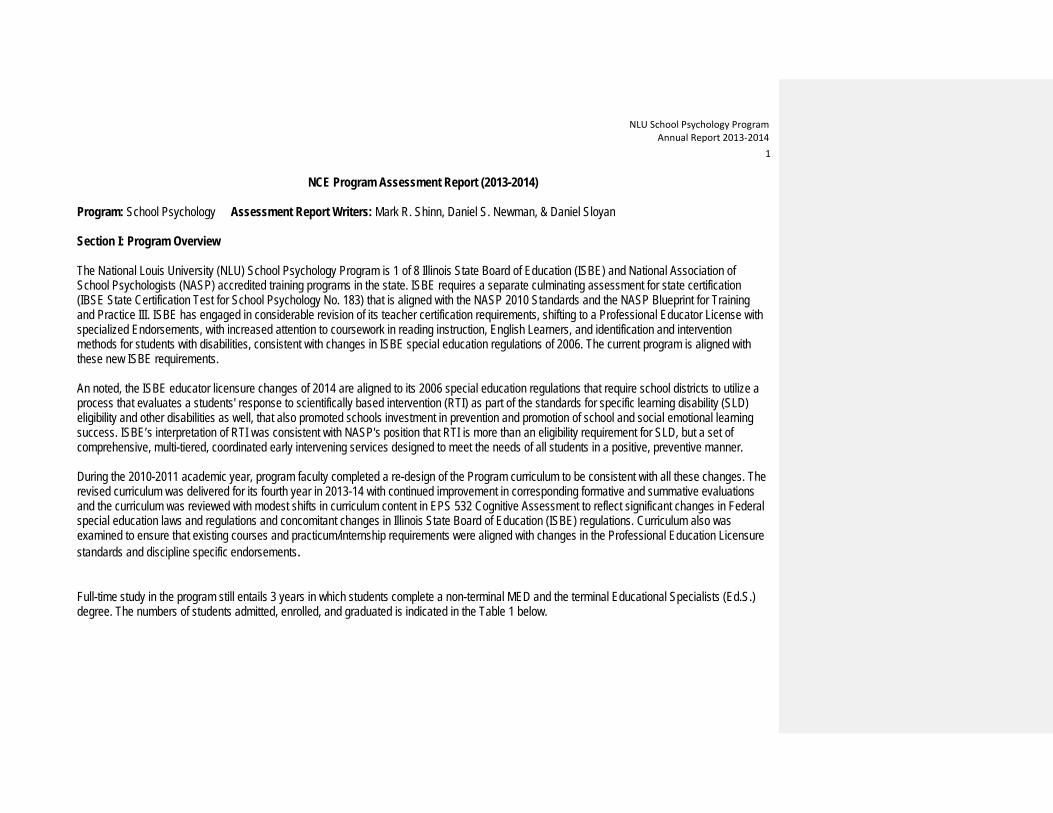
Program: School Psychology Assessment Report Writers: Mark R. Shinn, Daniel S. Newman, & Daniel Sloyan Section I: Program Overview The National Louis University (NLU) School Psychology Program is 1 of 8 Illinois State Board of Education (ISBE) and National Association of School Psychologists (NASP) accredited training programs in the state. ISBE requires a separate culminating assessment for state certification (IBSE State Certification Test for School Psychology No. 183) that is aligned with the NASP 2010 Standards and the NASP Blueprint for Training and Practice III. ISBE has engaged in considerable revision of its teacher certification requirements, shifting to a Professional Educator License with specialized Endorsements, with increased attention to coursework in reading instruction, English Learners, and identification and intervention methods for students with disabilities, consistent with changes in ISBE special education regulations of 2006. The current program is aligned with these new ISBE requirements. An noted, the ISBE educator licensure changes of 2014 are aligned to its 2006 special education regulations that require school districts to utilize a process that evaluates a students' response to scientifically based intervention (RTI) as part of the standards for specific learning disability (SLD) eligibility and other disabilities as well, that also promoted schools investment in prevention and promotion of school and social emotional learning success. ISBE’s interpretation of RTI was consistent with NASP's position that RTI is more than an eligibility requirement for SLD, but a set of comprehensive, multi-tiered, coordinated early intervening services designed to meet the needs of all students in a positive, preventive manner. During the 2010-2011 academic year, program faculty completed a re-design of the Program curriculum to be consistent with all these changes. The revised curriculum was delivered for its fourth year in 2013-14 with continued improvement in corresponding formative and summative evaluations and the curriculum was reviewed with modest shifts in curriculum content in EPS 532 Cognitive Assessment to reflect significant changes in Federal special education laws and regulations and concomitant changes in Illinois State Board of Education (ISBE) regulations. Curriculum also was examined to ensure that existing courses and practicum/internship requirements were aligned with changes in the Professional Education Licensure standards and discipline specific endorsements. Full-time study in the program still entails 3 years in which students complete a non-terminal MED and the terminal Educational Specialists (Ed.S.) degree. The numbers of students admitted, enrolled, and graduated is indicated in the Table 1 below.

NLU School Psychology Program Annual Report 2013-2014
2

NLU School Psychology Program Annual Report 2013-2014
3
2013-2014 (June 30, 2013 – July 1, 2014) Number of Candidates:
Undergraduate Graduate Alternative Programs (AUSL,
TFA, etc.)
Online Other (i.e. WI, FL)
Number of Students Admitted to the Program
63
Number of Students Enrolled in the Program
62
Section II: Relation of Assessments to Program Outcomes and Standards
The program is based on a problem-solving model where students learn functional assessment strategies and evidence-based intervention strategies to promote positive development and facilitate early and powerful remediation in academic and social emotional outcomes. At the core of this training model is continuous alignment of coursework taught by content area experts that is aligned each and every quarter with meaningful school-based practica and internships under the supervision of practicing licensed school psychologists. School Psychology candidates are continuously enrolled in practicum field experiences beginning with their first School Psychology Program course and by the time of their graduation, an Ed.S. student will have accumulated more than 2000 of supervised field experiences. The culminating experience in the program entails a full-time partially paid school psychology internship of at least 1200 hours. Candidates’ growth is monitored through a series of formative and summative assessments that reflect the NASP Standards in a portfolio assessment organized in Livetext, the School Psychology Program Portfolio (SP3). The S3P is compiled annually where students generate their own narrative and with representative attachments from their coursework and more importantly, that reflect their accomplishments in their school-based practica and internship. The S3P requires students to demonstrate required knowledge and competencies with a critical thinking narrative and a developmental perspective, supported by sample papers, reports for individual students and schools, projects, and applied research. The S3P is evaluated annually by program faculty using a rubric aligned with the NASP standards. The NLU School Psychology Program also regularly engages in frequent and multi-faceted evaluation of students’ Clinical Practice by field and university supervisors using our web-based evaluation system, School Psychology Observation Tools (SPOT). Our evaluation process has four separate evaluations:
1. Field Evaluation of Student (FES) where certified field supervisors and university supervisors rate students on their clinical practices. 2. Professional Behaviors Evaluation of Student (PBES) where certified field supervisors and university supervisors rate students on their
professional behaviors or dispositions relevant for successful clinical practice.

NLU School Psychology Program Annual Report 2013-2014
4
3. Evaluation of Field Experience and Field Supervisor (EFEFS) where students evaluate the quality of their field settings and field-based supervisors.
4. Evaluation of University Supervision (EUS) where students evaluate the quality of their university supervisors.
The goal of the program is to prepare candidates to effectively participate in school systems to ensure that all students grow with respect to current academics and social and emotional learning standards. Alignment of Program Assessments to NCE Conceptual Framework/Outcomes
NCE Conceptual Framework/Outcomes
NCE Candidates:
Program Assessments
Envision, articulate and model democratic and progressive education Livetext School Psychology Program Program Portfolio (S3P)
Design powerful learning environments that integrate appropriate technologies Livetext School Psychology Program Program Portfolio (S3P) Field Evaluation of Student (FES) Survey Applied Research Project
Design powerful learning environments that utilize multiple meaningful assessments Design powerful learning environments that enable self-directed learning
Work collaboratively in diverse communities and with diverse learners to achieve learning goals
Livetext School Psychology Program Program Portfolio (S3P) Professional Behaviors Evaluation of Student (PBES)
Advocate for democratic values, equity, access and resources to assure educational success for all Cultivate curiosity and excitement for learning in themselves and others Respect and learn from other peoples, cultures, and points of view Demonstrate a caring attitude in recognizing the needs of others and acting to promote their growth Act with confidence and self-knowledge to assume professional leadership roles and responsibilities Use information from self and others to continuously improve

NLU School Psychology Program Annual Report 2013-2014
5
Alignment of Program Assessments to Professional Standards and Program Outcomes
Program Outcomes
Professional Standards Program Assessments
Prevention and Promotion of Positive Outcomes
NASP 2.3, 2.4, 2.5, 2.6, 2.7, 2.8, 2.10 Portfolio FES
Problem Solving for Students with Performance Discrepancies
NASP 2.1, 2.2, 2.3, 2.4, 2.9 Portfolio FES
Assessment, Data-Based Decision Making, Including Research
NASP 2.1, 2.9, 2.10, 2.11 Portfolio FES Field research project
Professional Self Development NASP 2.2, 2.5, 2.10 Portfolio PBES
Section III: Key Program Assessments Table 2 summarizes the major program assessments.

NLU School Psychology Program Annual Report 2013-2014
6
Table 2. Major Program Assessments
We are placing priority in moving from a recommendation that students complete the NCSP examination to a Program Requirement. We expect this decision will be finalized Winter 2015.
Name of Instrument Type or Form of Assessment
When the Instrument(s) Administered
1. Assessment of Content Knowledge I (i.e., Licensure assessment, or other content-based assessment)
• ISBE State Certification Examination (#183) • *Recommended: NASP National
Certification Test (NCSP)
• Final year of program (end of internship for EDS) • Post Internship
2. Assessment of Content Knowledge • First-year Livetext School Psychology Program Program Portfolio (S3P)
• Second-year S3P • Third-year (Internship) S3P
• End of Year I • End of Year II • End of Year 3 (Internship)
3. Assessment of Professional Knowledge (Pedagogical content knowledge)
• Second year S3P • Internship S3P
• End of Year I • End of Year II • End of Year 3 (Internship)
5. Assessment of Candidate Impact on Student Learning
• Applied research project (Research section of the S3P)
• Third-year (Internship) S3P
• End of Year I • End of Year II • End of Year 3 (Internship)
6. Assessment of Candidate Dispositions and Professional Behavior
• Professional Behaviors Evaluation of Student (PBES)
• 1x per Year at end of year for Year I students • 2x per Year at mid and end of year for Year 2
students • 3x per Year at end of each quarter and end of
year for Year 3 students
7. Assessment of Candidate Diversity Proficiencies Professional Behaviors Evaluation of Student (PBES)
Midyear and end of year second practicum II Midyear and end of year internship
8. Assessment of Candidate Technology Proficiencies
• Field Evaluation of Student (FES) Survey
Midyear and end of year second practicum II Midyear and end of year internship
NLU School Psychology Program Annual Report 2013-2014
7
Section IV: Assessment Tools and Data Analysis A1. Assessment of Content Knowledge I (State): ISBE Test #183 Content Test
All NLU graduates must pass the Illinois State Certification Test for School Psychologists (#183) to be certified as a School Psychologist with the Type 73 Certification and for the future School Psychology Endorsement. The criteria have been set by the state. A passing score is 240 or above. A maximum score is 300. The ISBE 183 test was revised in 2005-2006 to align with the NASP standards. The test has three major sections:
1. Human development, diversity, and learning; 2. Factors that affect students and schools; and 3. Schools, systems, research, and practice of school psychology.
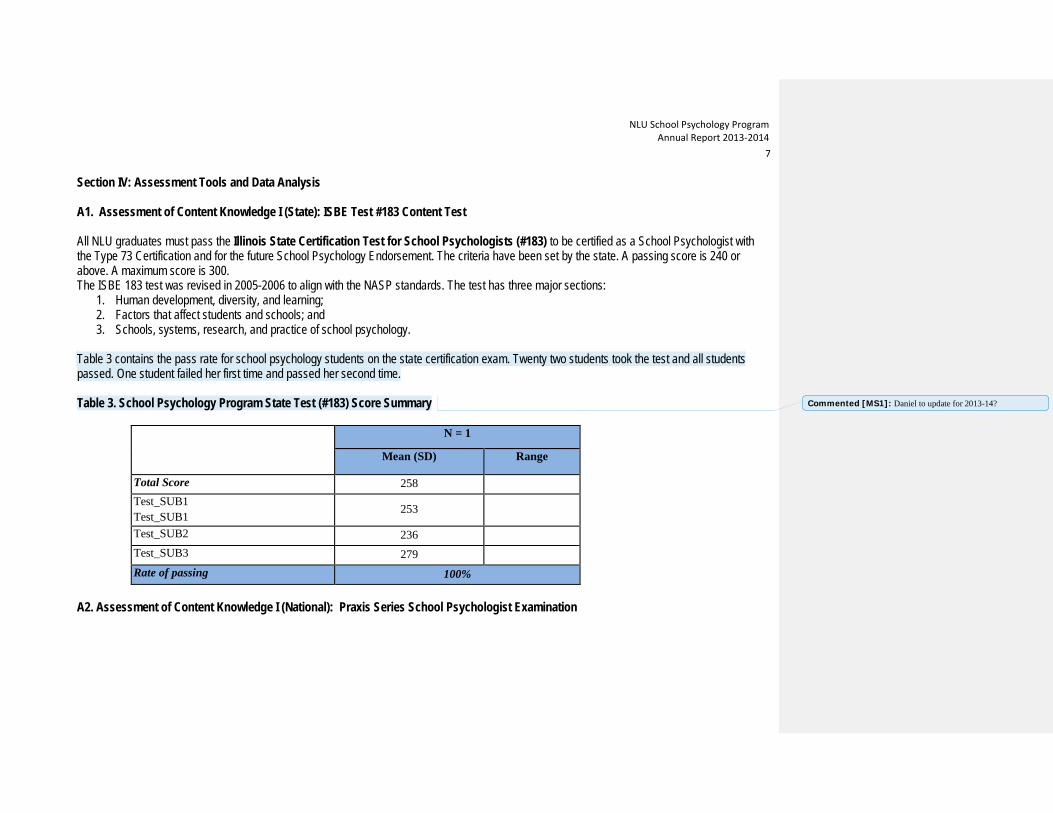
Table 3 contains the pass rate for school psychology students on the state certification exam. Twenty two students took the test and all students passed. One student failed her first time and passed her second time. Table 3. School Psychology Program State Test (#183) Score Summary
N = 1
Mean (SD) Range
Total Score 258 Test_SUB1 Test_SUB1
253
Test_SUB2 236 Test_SUB3 279
Rate of passing 100% A2. Assessment of Content Knowledge I (National): Praxis Series School Psychologist Examination
Commented [MS1]: Daniel to update for 2013-14?

NLU School Psychology Program Annual Report 2013-2014
8
We strongly recommend that NLU School Psychology students complete the National Association of School Psychologists-approved test, the Praxis Series School Psychologist Examination that is required for eligibility as a Nationally Certified School Psychologist (NCSP as evidence of Content Knowledge. Candidates must achieve a score of 165 to pass (score range is 100-200). Although we strongly encourage graduating candidates to take this examination, as noted earlier, it is neither a Program nor ISBE requirement and NASP returns test results only to examinees. We rely on students to report their Praxis test results, and NCSP status to us. Of the 16 specialist-level interns in 2012-2013, 13 students reported passing the exam and becoming NCSPs.
Commented [MS2]: Danny Newman update?

NLU School Psychology Program Annual Report 2013-2014
9
B. Assessment of Content Knowledge II: Local Assessments The major components of the National Louis University (NLU) School Psychology Program’s Content Knowledge assessment are the School Psychology Program Portfolio (S3P) and a series of ratings from 4 scales organized in the School Psychology Observational Tool (SPOT). These data are compiled annually for purposes of formative and summative evaluation. School Psychology Program Portfolio (S3P) The S3P is collected using a set of student-generated narratives with representative attachments in a Portfolio using the web-based software LiveText. The S3P requires students to demonstrate required knowledge and competencies with a critical thinking narrative and developmental perspective, supported by sample papers, reports for individual students and schools, projects, and applied research. The S3P is evaluated annually by program faculty using a rubric aligned with the NASP standards. The S3P has five sections:
1. Tell Us About Yourself as a Professional. Students provide academic and work history before attending NLU as well as an overview of their current interests.
2. Prevention of Problems and Promotion of Student Learning. Information and accomplishments about NLU the student’s knowledge, skills, and “real life” accomplishments that are necessary to support all students academically and social/emotionally by creating healthy school and family environments using evidence-based practices.
3. Problem Solving for Student Learning and System Improvement. Information and accomplishments about NLU student’s knowledge, skills, and “real life” (i.e., case-based) accomplishments in identifying students or schools that are at risk to support early intervention using evidence-based practices to reduce the gap academically or social/emotionally.
4. Assessment and Data-Based Decision Making, Including Research and Program Evaluation. Information and accomplishments about NLU student’s knowledge, skills, and “real life” accomplishments in identifying and answering important questions about “what works” (i.e., the effects on students’ academic and social emotional learning) from an evidence-based, data-driven perspective.
5. Professional Development. Information and accomplishments about an NLU student’s efforts to sustain professional development as a life-long activity.

NLU School Psychology Program Annual Report 2013-2014
10
A screen shot of the S3P is shown in Figure 1.
Figure 1. Screenshot of the S3P Introduction Instructions.
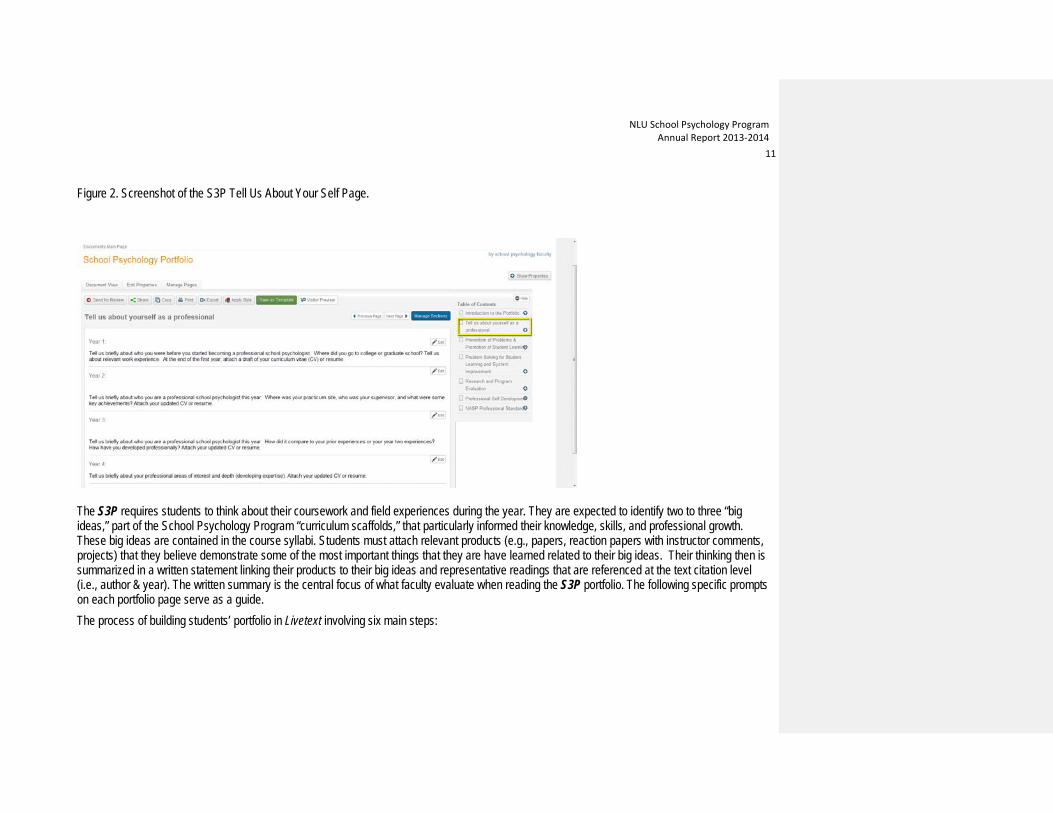
The S3P in Figure 2 is a screen shot that shows the first page of the portfolio that asks students to tell the faculty about themselves as a professional. This page prompts students to attach a curriculum vitae (CV) and to tell us something about who they are becoming as a professional.
NLU School Psychology Program Annual Report 2013-2014
11
Figure 2. Screenshot of the S3P Tell Us About Your Self Page.
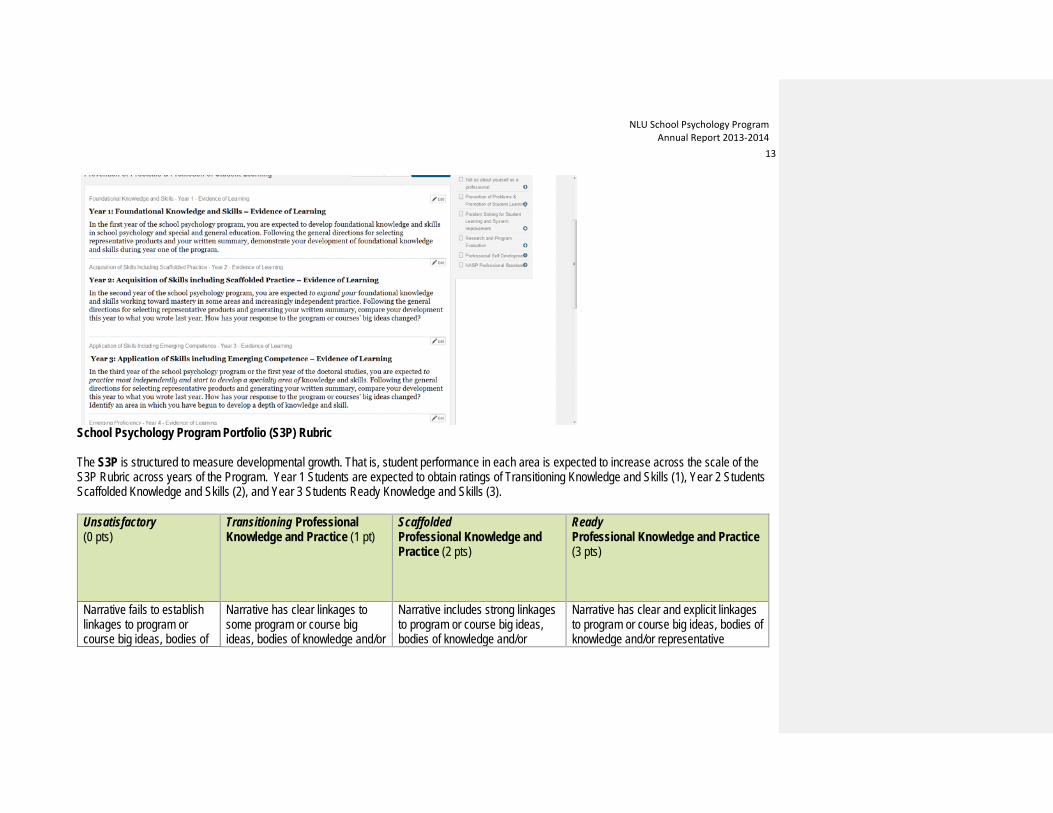
The S3P requires students to think about their coursework and field experiences during the year. They are expected to identify two to three “big ideas,” part of the School Psychology Program “curriculum scaffolds,” that particularly informed their knowledge, skills, and professional growth. These big ideas are contained in the course syllabi. Students must attach relevant products (e.g., papers, reaction papers with instructor comments, projects) that they believe demonstrate some of the most important things that they are have learned related to their big ideas. Their thinking then is summarized in a written statement linking their products to their big ideas and representative readings that are referenced at the text citation level (i.e., author & year). The written summary is the central focus of what faculty evaluate when reading the S3P portfolio. The following specific prompts on each portfolio page serve as a guide. The process of building students’ portfolio in Livetext involving six main steps:
NLU School Psychology Program Annual Report 2013-2014
12
1. SELECTION: Students are instructed to choose course products that are representative of the program outcome areas outcomes/NASP Standards that are completed in their courses, from individual assignments, projects, and papers. 2. ATTACHMENTS: Students attach and date these products to the S3P with a brief statement as to its relevance. 3. THINKING: Students are instructed to think about what has learned as a result of the work products. Students are expected to write from the lens of our program outcomes/ big ideas and key professional articles or chapters. In the first year, we ask students to think about what was learned and casework that was completed and make connections to the big ideas in the field. In subsequent years, students are expected to continue to do this, and also analyze their growth developmentally from the previous year. 4. WRITING: Students compose three to four reflective paragraphs putting what they are thinking into words, making their linkages clear to course goals and big ideas, and referencing key articles and other professional literature. 5. FIELD FEEDBACK: Students include copies of the School Psychology Program Dispositional Assessment from their practicum supervisor(s) and instructors. 6. SUBMITION: Students submit the S3P for review to the School Psychology faculty.
The evaluative emphasis in completing the S3P is on the summary narrative for each of the 5 sections as shown in Figure 3.
Figure 3. Screenshot of the S3P Developmental Perspective.
NLU School Psychology Program Annual Report 2013-2014
13
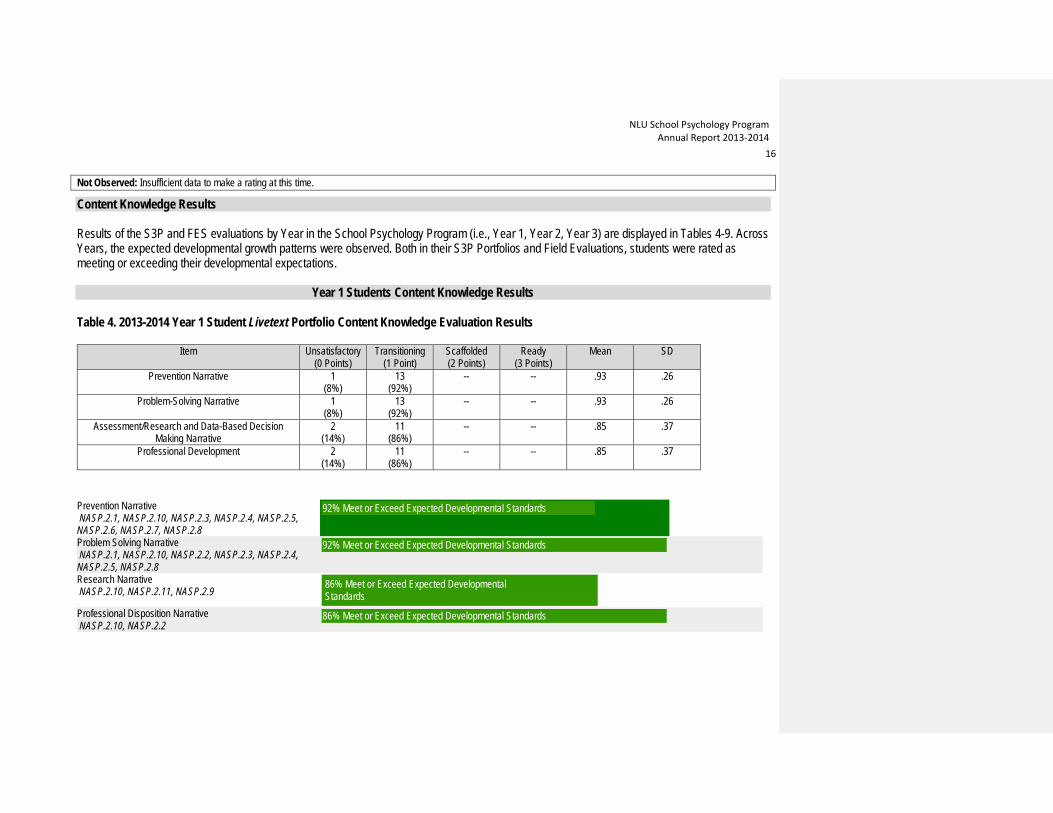
School Psychology Program Portfolio (S3P) Rubric The S3P is structured to measure developmental growth. That is, student performance in each area is expected to increase across the scale of the S3P Rubric across years of the Program. Year 1 Students are expected to obtain ratings of Transitioning Knowledge and Skills (1), Year 2 Students Scaffolded Knowledge and Skills (2), and Year 3 Students Ready Knowledge and Skills (3).
Unsatisfactory (0 pts)
Transitioning Professional Knowledge and Practice (1 pt)
Scaffolded Professional Knowledge and Practice (2 pts)
Ready Professional Knowledge and Practice (3 pts)
Narrative fails to establish linkages to program or course big ideas, bodies of
Narrative has clear linkages to some program or course big ideas, bodies of knowledge and/or
Narrative includes strong linkages to program or course big ideas, bodies of knowledge and/or
Narrative has clear and explicit linkages to program or course big ideas, bodies of knowledge and/or representative

NLU School Psychology Program Annual Report 2013-2014
14
knowledge and/or representative references in research and practice. Artifacts are not representative and/or not linked to narrative.
representative references in research and practice and establishes a baseline by which to judge future growth. Representative artifacts are linked to the narrative.
representative references in research and practice and is written in a way that demonstrates developmental differences from Transitional Knowledge and Practice. Selected artifacts are linked to the narrative to demonstrate growth and development.
references in research and practice and are written in a way consistent with a professional ready for independent practice. Developmental differences from Scaffolded Knowledge and Practice are noted. Selected artifacts are representative of accomplishments in this domain and are used to demonstrate proficiency.

NLU School Psychology Program Annual Report 2013-2014
15
School Psychology Observation Tools (SPOT) The NLU School Psychology Program regularly engages in frequent and multi-faceted evaluation of students’ Clinical Practice by field and university supervisors using our web-based evaluation system, School Psychology Observation Tools (SPOT). Our evaluation process has four separate evaluations:
1. Field Evaluation of Student (FES) where field and university supervisors rate students on their clinical practices. 2. Professional Behaviors Evaluation of Student (PBES) where field and university supervisors rate students on their professional behaviors. 3. Evaluation of Field Experience and Field Supervisor (EFEFS) where students evaluate the quality of their field settings and field-based
supervisors. 4. Evaluation of University Experience and University Supervisor (UFUS) where students evaluate the quality of their University supervisors.
Field Evaluation of Student (FES) Additional data on Content Knowledge is provided by ISBE-licensed school psychologists field supervisors who complete the FES at prescribed intervals and frequencies based on the student’s program year. Year 1 students are evaluated once at the end-of-the-year. Year 2 and Year 3 students are evaluated twice, at mid-year and the end-of the–year. In situations where a student has more than one supervisor, the FES may be submitted separately or based on combined ratings. The FES was adapted from materials in: Harvey, V.S., & Struzziero, J. (2008). Professional development and supervision of school psychologists: From intern to expert (2nd ed.). Bethesda, MD: Corwin Press and NASP. FES Rubric The FES was designed to measure student performance in school practicum internship in the NASP school psychology practice domains, including data-based decision-making, intervention, and consultation with individual students and teachers, schools, and communities. Performance is evaluated on the following scales: Poor (1): Fails to meet expectations. Consistently performs poorly and needs improvement. A specific plan and period of time should be established to improve performance.
Below Standard (2): Performance is below average. Requires improvement to perform effectively in a professional environment.
Standard (3): Meets typical expectations. Most students will possess skills and judgment sufficient to meet professional demands in the area and a large portion of them will remain in this range.
Above Standard (4): Performance and judgment of students in this category is decidedly better than average. Shows sensitivity, judgment and skills beyond what is normally expected or displayed by peers.
Outstanding (5): Performance is recognizably and decidedly better than that of a large proportion of other students.
NLU School Psychology Program Annual Report 2013-2014
16
Not Observed: Insufficient data to make a rating at this time.
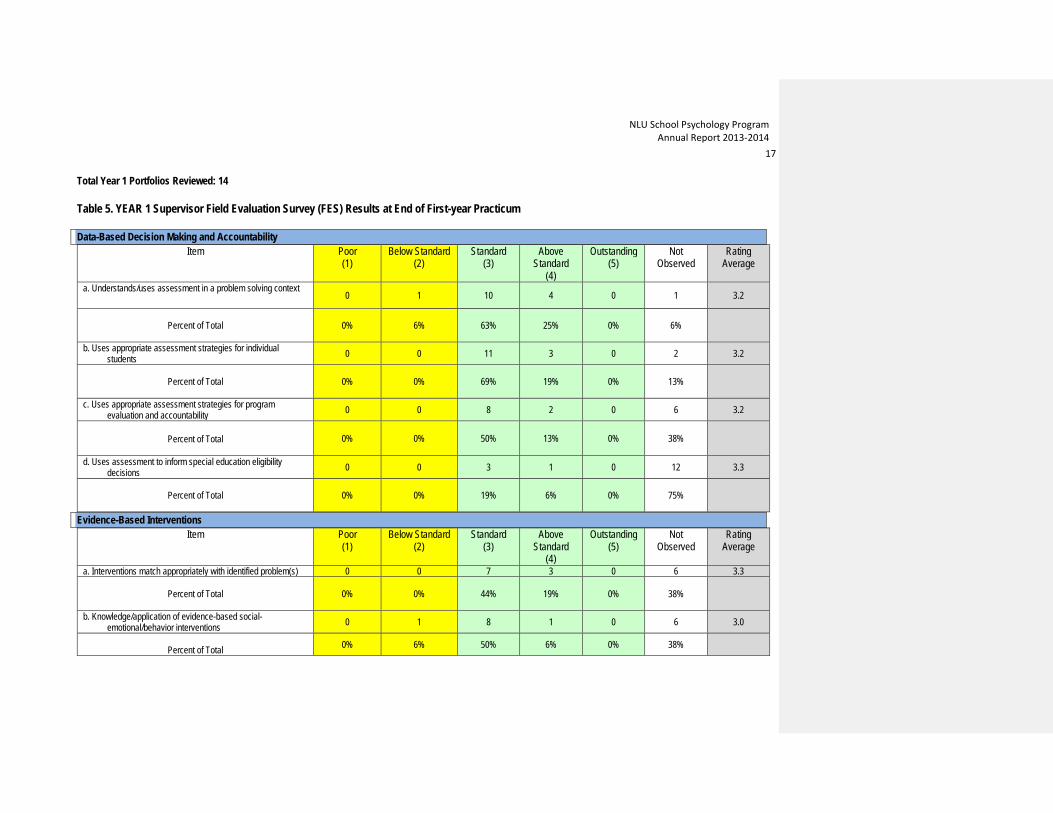
Content Knowledge Results Results of the S3P and FES evaluations by Year in the School Psychology Program (i.e., Year 1, Year 2, Year 3) are displayed in Tables 4-9. Across Years, the expected developmental growth patterns were observed. Both in their S3P Portfolios and Field Evaluations, students were rated as meeting or exceeding their developmental expectations.
Year 1 Students Content Knowledge Results
Table 4. 2013-2014 Year 1 Student Livetext Portfolio Content Knowledge Evaluation Results
Item Unsatisfactory (0 Points)
Transitioning (1 Point)
Scaffolded (2 Points)
Ready (3 Points)
Mean SD
Prevention Narrative 1 (8%)
13 (92%)
-- -- .93 .26
Problem-Solving Narrative 1 (8%)
13 (92%)
-- -- .93 .26
Assessment/Research and Data-Based Decision Making Narrative
2 (14%)
11 (86%)
-- -- .85 .37
Professional Development 2 (14%)
11 (86%)
-- -- .85 .37
Prevention Narrative NASP.2.1, NASP.2.10, NASP.2.3, NASP.2.4, NASP.2.5, NASP.2.6, NASP.2.7, NASP.2.8
92% Meet or Exceed Expected Developmental Standards
Problem Solving Narrative NASP.2.1, NASP.2.10, NASP.2.2, NASP.2.3, NASP.2.4, NASP.2.5, NASP.2.8
92% Meet or Exceed Expected Developmental Standards
Research Narrative NASP.2.10, NASP.2.11, NASP.2.9
86% Meet or Exceed Expected Developmental Standards
Professional Disposition Narrative NASP.2.10, NASP.2.2
86% Meet or Exceed Expected Developmental Standards
NLU School Psychology Program Annual Report 2013-2014
17
Total Year 1 Portfolios Reviewed: 14
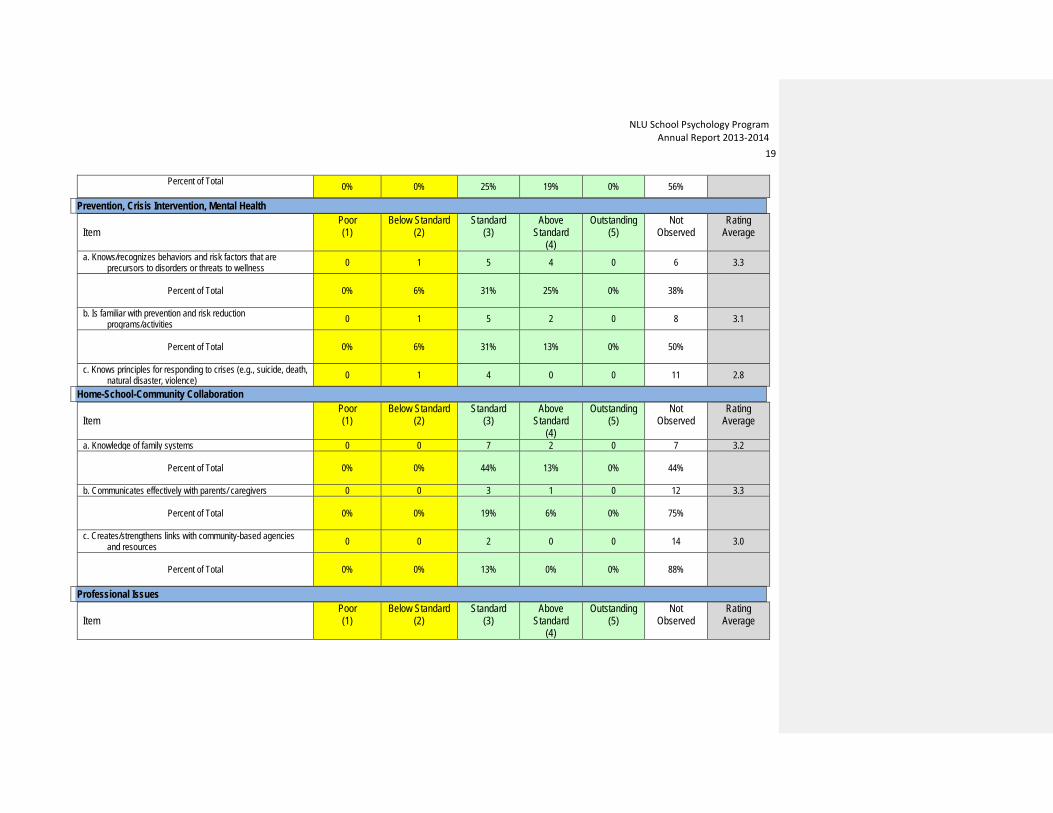
Table 5. YEAR 1 Supervisor Field Evaluation Survey (FES) Results at End of First-year Practicum Data-Based Decision Making and Accountability
Item Poor (1)
Below Standard (2)
Standard (3)
Above Standard
(4)
Outstanding (5)
Not Observed
Rating Average
a. Understands/uses assessment in a problem solving context 0 1 10 4 0 1 3.2
Percent of Total
0% 6% 63% 25% 0% 6%
b. Uses appropriate assessment strategies for individual students 0 0 11 3 0 2 3.2
Percent of Total
0% 0% 69% 19% 0% 13%
c. Uses appropriate assessment strategies for program
evaluation and accountability 0 0 8 2 0 6 3.2
Percent of Total
0% 0% 50% 13% 0% 38%
d. Uses assessment to inform special education eligibility decisions 0 0 3 1 0 12 3.3
Percent of Total
0% 0% 19% 6% 0% 75%
Evidence-Based Interventions Item Poor
(1) Below Standard
(2) Standard
(3) Above
Standard (4)
Outstanding (5)
Not Observed
Rating Average
a. Interventions match appropriately with identified problem(s) 0 0 7 3 0 6 3.3
Percent of Total
0% 0% 44% 19% 0% 38%
b. Knowledge/application of evidence-based social-emotional/behavior interventions 0 1 8 1 0 6 3.0
Percent of Total 0% 6% 50% 6% 0% 38%
NLU School Psychology Program Annual Report 2013-2014
18
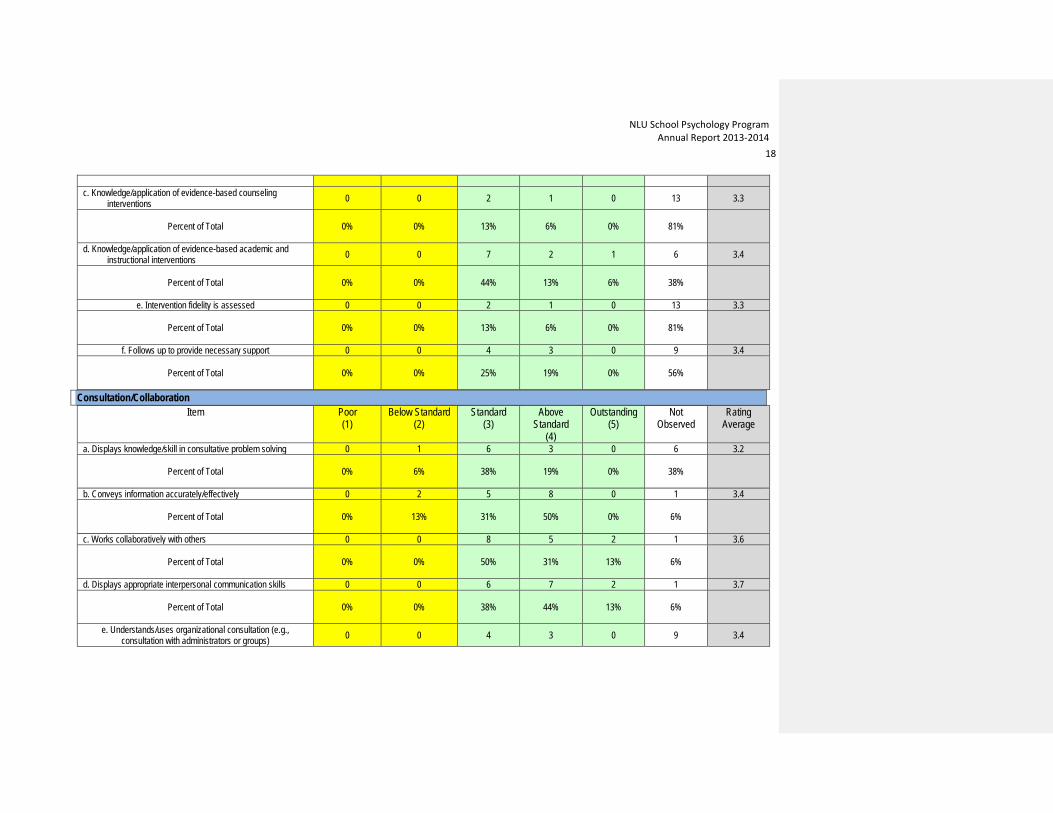
c. Knowledge/application of evidence-based counseling
interventions 0 0 2 1 0 13 3.3
Percent of Total
0% 0% 13% 6% 0% 81%
d. Knowledge/application of evidence-based academic and instructional interventions 0 0 7 2 1 6 3.4
Percent of Total
0% 0% 44% 13% 6% 38%
e. Intervention fidelity is assessed 0 0 2 1 0 13 3.3
Percent of Total
0% 0% 13% 6% 0% 81%
f. Follows up to provide necessary support 0 0 4 3 0 9 3.4
Percent of Total
0% 0% 25% 19% 0% 56%
Consultation/Collaboration Item Poor
(1) Below Standard
(2) Standard
(3) Above
Standard (4)
Outstanding (5)
Not Observed
Rating Average
a. Displays knowledge/skill in consultative problem solving 0 1 6 3 0 6 3.2
Percent of Total
0% 6% 38% 19% 0% 38%
b. Conveys information accurately/effectively 0 2 5 8 0 1 3.4
Percent of Total
0% 13% 31% 50% 0% 6%
c. Works collaboratively with others 0 0 8 5 2 1 3.6
Percent of Total
0% 0% 50% 31% 13% 6%
d. Displays appropriate interpersonal communication skills 0 0 6 7 2 1 3.7
Percent of Total
0% 0% 38% 44% 13% 6%
e. Understands/uses organizational consultation (e.g., consultation with administrators or groups) 0 0 4 3 0 9 3.4
NLU School Psychology Program Annual Report 2013-2014
19
Percent of Total 0% 0% 25% 19% 0% 56%
Prevention, Crisis Intervention, Mental Health
Item Poor (1)
Below Standard (2)
Standard (3)
Above Standard
(4)
Outstanding (5)
Not Observed
Rating Average
a. Knows/recognizes behaviors and risk factors that are precursors to disorders or threats to wellness 0 1 5 4 0 6 3.3
Percent of Total
0% 6% 31% 25% 0% 38%
b. Is familiar with prevention and risk reduction programs/activities 0 1 5 2 0 8 3.1
Percent of Total
0% 6% 31% 13% 0% 50%
c. Knows principles for responding to crises (e.g., suicide, death, natural disaster, violence) 0 1 4 0 0 11 2.8
Home-School-Community Collaboration Item
Poor (1)
Below Standard (2)
Standard (3)
Above Standard
(4)
Outstanding (5)
Not Observed
Rating Average
a. Knowledge of family systems 0 0 7 2 0 7 3.2
Percent of Total
0% 0% 44% 13% 0% 44%
b. Communicates effectively with parents/ caregivers 0 0 3 1 0 12 3.3
Percent of Total
0% 0% 19% 6% 0% 75%
c. Creates/strengthens links with community-based agencies and resources 0 0 2 0 0 14 3.0
Percent of Total
0% 0% 13% 0% 0% 88%
Professional Issues
Item Poor (1)
Below Standard (2)
Standard (3)
Above Standard
(4)
Outstanding (5)
Not Observed
Rating Average
NLU School Psychology Program Annual Report 2013-2014
20
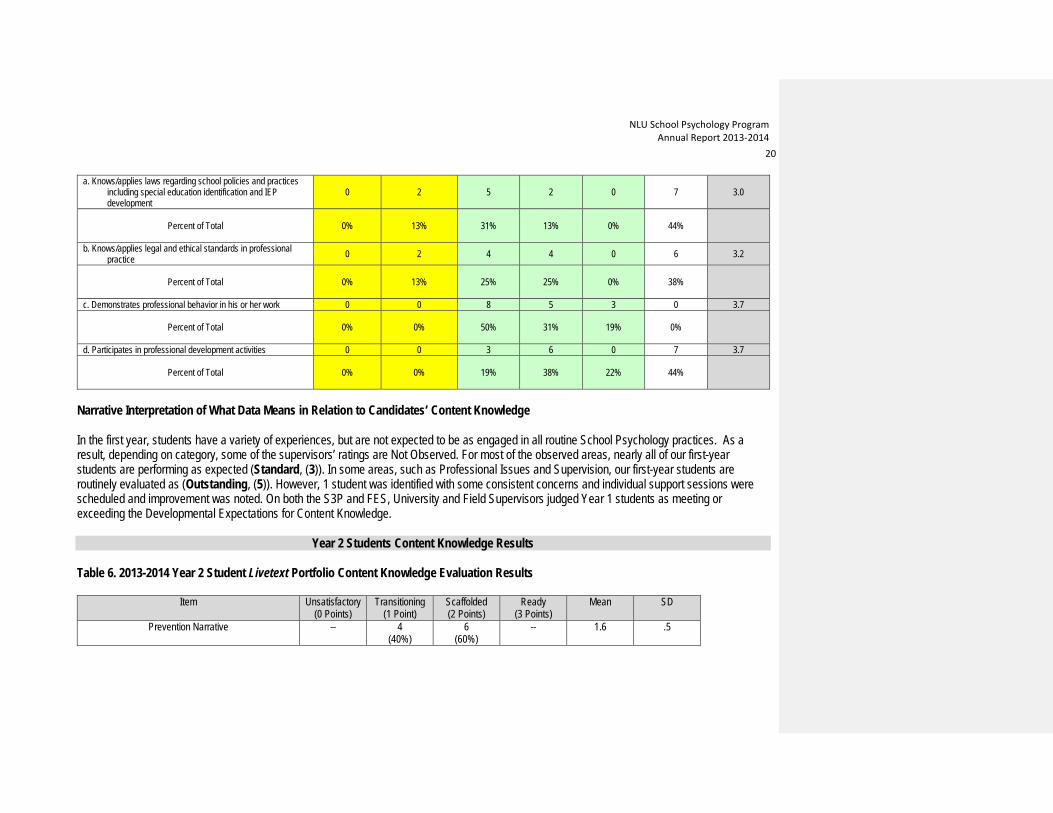
a. Knows/applies laws regarding school policies and practices including special education identification and IEP development
0 2 5 2 0 7 3.0
Percent of Total
0% 13% 31% 13% 0% 44%
b. Knows/applies legal and ethical standards in professional practice 0 2 4 4 0 6 3.2
Percent of Total
0% 13% 25% 25% 0% 38%
c. Demonstrates professional behavior in his or her work 0 0 8 5 3 0 3.7
Percent of Total
0% 0% 50% 31% 19% 0%
d. Participates in professional development activities 0 0 3 6 0 7 3.7
Percent of Total
0% 0% 19% 38% 22% 44%
Narrative Interpretation of What Data Means in Relation to Candidates’ Content Knowledge
In the first year, students have a variety of experiences, but are not expected to be as engaged in all routine School Psychology practices. As a result, depending on category, some of the supervisors’ ratings are Not Observed. For most of the observed areas, nearly all of our first-year students are performing as expected (Standard, (3)). In some areas, such as Professional Issues and Supervision, our first-year students are routinely evaluated as (Outstanding, (5)). However, 1 student was identified with some consistent concerns and individual support sessions were scheduled and improvement was noted. On both the S3P and FES, University and Field Supervisors judged Year 1 students as meeting or exceeding the Developmental Expectations for Content Knowledge.
Year 2 Students Content Knowledge Results
Table 6. 2013-2014 Year 2 Student Livetext Portfolio Content Knowledge Evaluation Results
Item Unsatisfactory (0 Points)
Transitioning (1 Point)
Scaffolded (2 Points)
Ready (3 Points)
Mean SD
Prevention Narrative -- 4 (40%)
6 (60%)
-- 1.6 .5

NLU School Psychology Program Annual Report 2013-2014
21
Problem-Solving Narrative -- 5 (50%)
5 (50%)
-- 1.5 .5
Assessment/Research and Data-Based Decision Making Narrative
-- 5 (50%)
5 (50%)
-- 1.5 .5
Professional Development -- 4 (40%)
6 (60%)
-- 1.4 .5
Prevention Narrative NASP.2.1, NASP.2.10, NASP.2.3, NASP.2.4, NASP.2.5, NASP.2.6, NASP.2.7, NASP.2.8
60% Meet or Exceed Expected Developmental Standards
Problem Solving Narrative NASP.2.1, NASP.2.10, NASP.2.2, NASP.2.3, NASP.2.4, NASP.2.5, NASP.2.8
50% Meet or Exceed Expected Developmental Standards
Research Narrative NASP.2.10, NASP.2.11, NASP.2.9
50% Meet or Exceed Expected Developmental Standards
Professional Disposition Narrative NASP.2.10, NASP.2.2
60% Meet or Exceed Expected Developmental Standards
Total Evaluations completed: 10
NLU School Psychology Program Annual Report 2013-2014
22
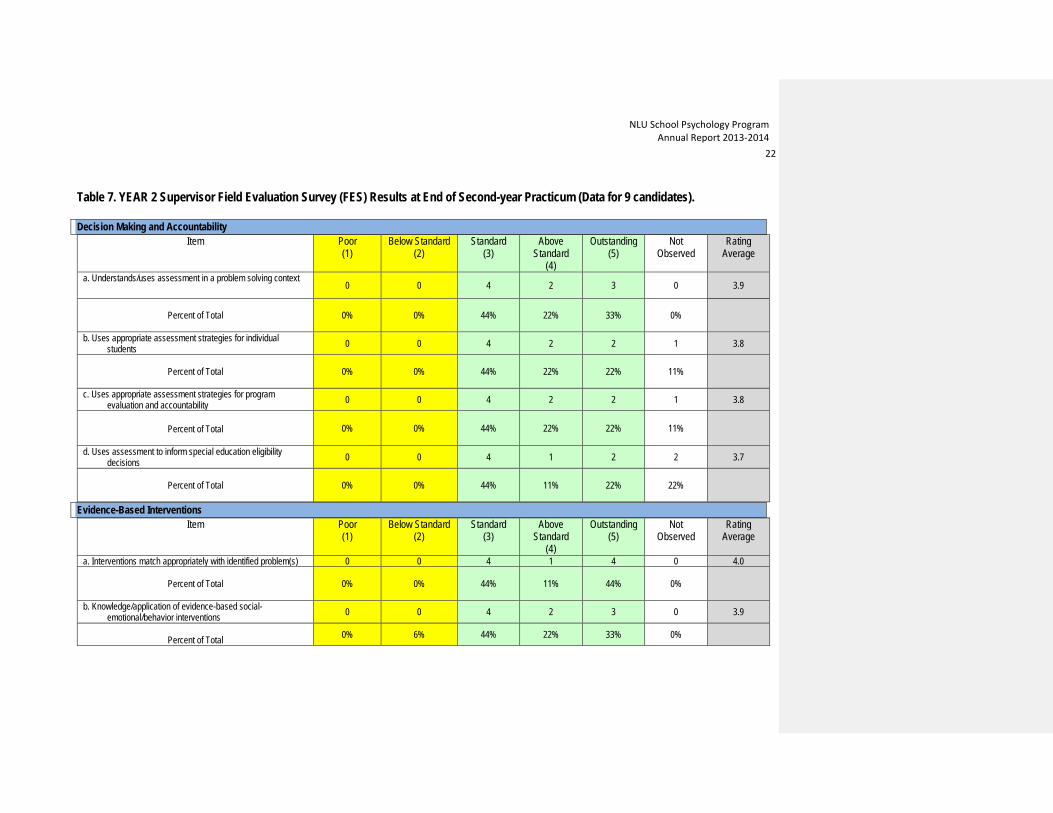
Table 7. YEAR 2 Supervisor Field Evaluation Survey (FES) Results at End of Second-year Practicum (Data for 9 candidates). Decision Making and Accountability
Item Poor (1)
Below Standard (2)
Standard (3)
Above Standard
(4)
Outstanding (5)
Not Observed
Rating Average
a. Understands/uses assessment in a problem solving context 0 0 4 2 3 0 3.9
Percent of Total
0% 0% 44% 22% 33% 0%
b. Uses appropriate assessment strategies for individual students 0 0 4 2 2 1 3.8
Percent of Total
0% 0% 44% 22% 22% 11%
c. Uses appropriate assessment strategies for program
evaluation and accountability 0 0 4 2 2 1 3.8
Percent of Total
0% 0% 44% 22% 22% 11%
d. Uses assessment to inform special education eligibility decisions 0 0 4 1 2 2 3.7
Percent of Total
0% 0% 44% 11% 22% 22%
Evidence-Based Interventions Item Poor
(1) Below Standard
(2) Standard
(3) Above
Standard (4)
Outstanding (5)
Not Observed
Rating Average
a. Interventions match appropriately with identified problem(s) 0 0 4 1 4 0 4.0
Percent of Total
0% 0% 44% 11% 44% 0%
b. Knowledge/application of evidence-based social-emotional/behavior interventions 0 0 4 2 3 0 3.9
Percent of Total 0% 6% 44% 22% 33% 0%

NLU School Psychology Program Annual Report 2013-2014
23
c. Knowledge/application of evidence-based counseling
interventions 0 0 5 1 2 1 3.6
Percent of Total
0% 0% 56% 11% 22% 11%
d. Knowledge/application of evidence-based academic and instructional interventions 0 0 3 4 2 0 3.9
Percent of Total
0% 0% 33% 44% 22% 0%
e. Intervention fidelity is assessed 0 0 2 2 3 2 4.1
Percent of Total
0% 0% 22% 22% 33% 22%
f. Follows up to provide necessary support 0 1 3 1 4 0 3.9
Percent of Total
0% 11% 33% 11% 44% 0%
Consultation/Collaboration Item Poor
(1) Below Standard
(2) Standard
(3) Above
Standard (4)
Outstanding (5)
Not Observed
Rating Average
a. Displays knowledge/skill in consultative problem solving 0 0 2 4 3 0 4.1
Percent of Total
0% 0% 33% 22% 44% 0%
b. Conveys information accurately/effectively 0 0 3 2 4 0 4.1
Percent of Total
0% 0% 33% 22% 44% 0%
c. Works collaboratively with others 0 1 2 2 4 0 4.0
Percent of Total
0% 11% 22% 22% 44% 0%
d. Displays appropriate interpersonal communication skills 0 1 3 1 4 0 3.9
Percent of Total
0% 11% 33% 11% 44% 0%
e. Understands/uses organizational consultation (e.g., consultation with administrators or groups) 0 0 2 2 3 2 4.1
NLU School Psychology Program Annual Report 2013-2014
24
Percent of Total
0% 0% 22% 22% 33% 22%
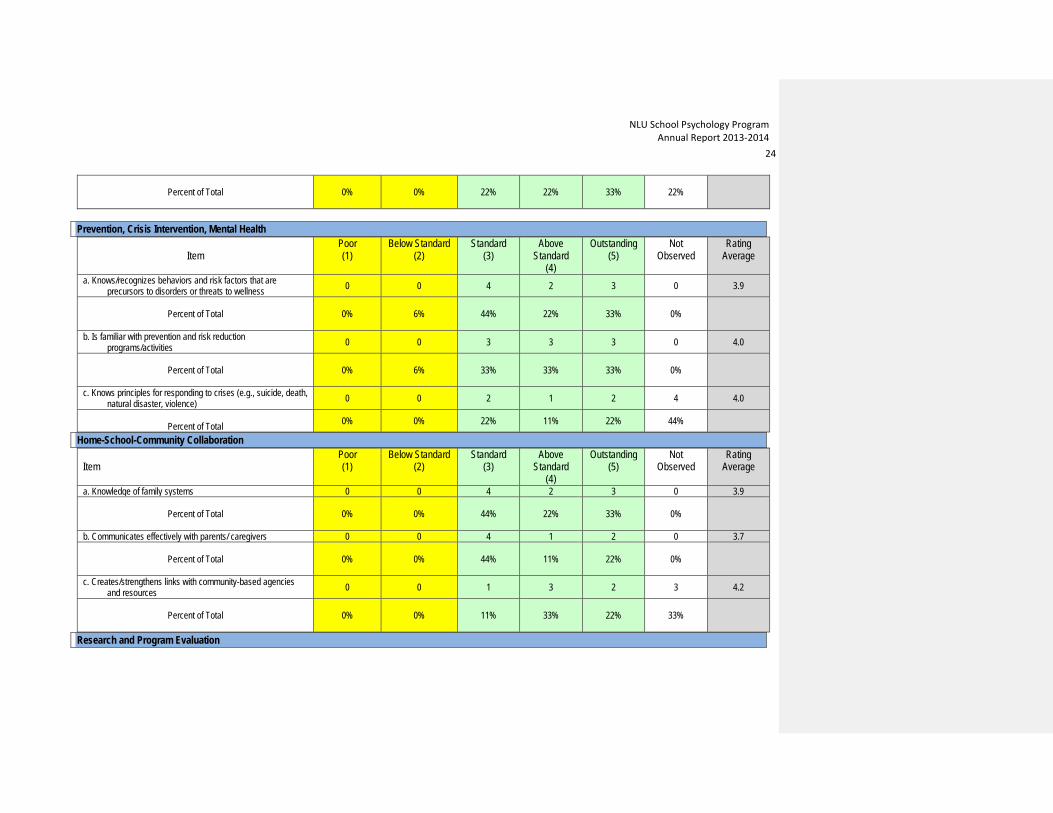
Prevention, Crisis Intervention, Mental Health
Item
Poor (1)
Below Standard (2)
Standard (3)
Above Standard
(4)
Outstanding (5)
Not Observed
Rating Average
a. Knows/recognizes behaviors and risk factors that are precursors to disorders or threats to wellness 0 0 4 2 3 0 3.9
Percent of Total
0% 6% 44% 22% 33% 0%
b. Is familiar with prevention and risk reduction programs/activities 0 0 3 3 3 0 4.0
Percent of Total
0% 6% 33% 33% 33% 0%
c. Knows principles for responding to crises (e.g., suicide, death, natural disaster, violence) 0 0 2 1 2 4 4.0
Percent of Total 0% 0% 22% 11% 22% 44%
Home-School-Community Collaboration Item
Poor (1)
Below Standard (2)
Standard (3)
Above Standard
(4)
Outstanding (5)
Not Observed
Rating Average
a. Knowledge of family systems 0 0 4 2 3 0 3.9
Percent of Total
0% 0% 44% 22% 33% 0%
b. Communicates effectively with parents/ caregivers 0 0 4 1 2 0 3.7
Percent of Total
0% 0% 44% 11% 22% 0%
c. Creates/strengthens links with community-based agencies and resources 0 0 1 3 2 3 4.2
Percent of Total
0% 0% 11% 33% 22% 33%
Research and Program Evaluation
NLU School Psychology Program Annual Report 2013-2014
25
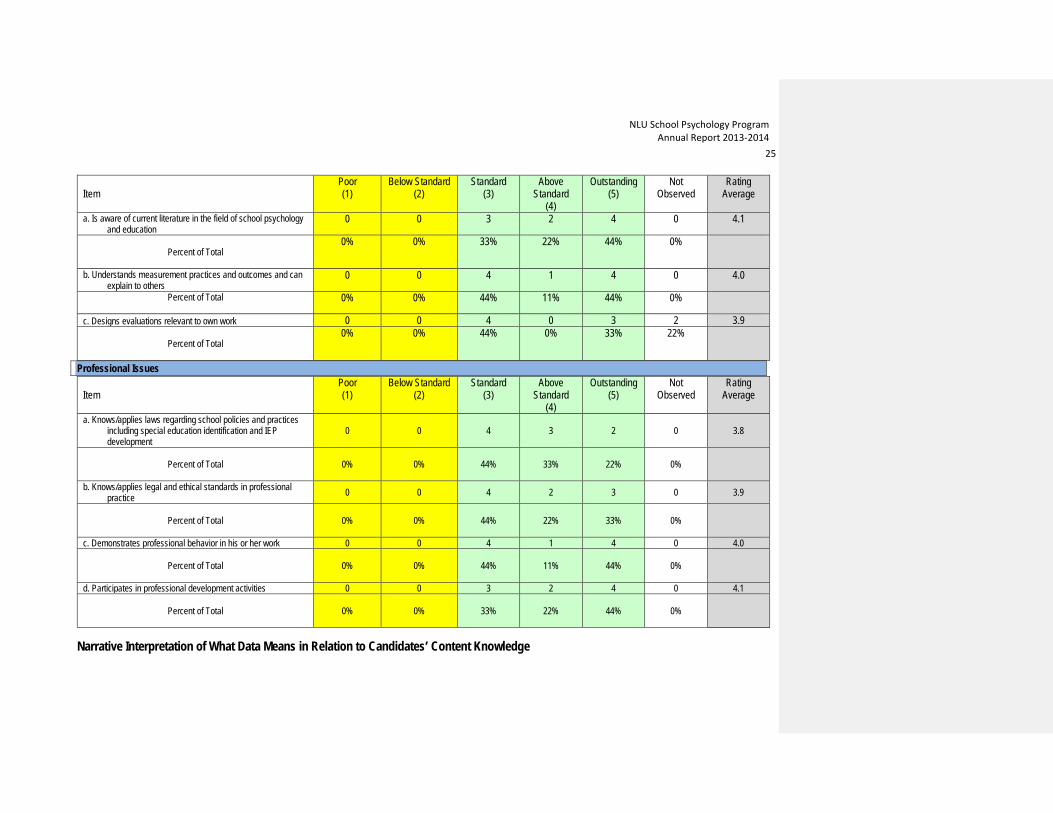
Item
Poor (1)
Below Standard (2)
Standard (3)
Above Standard
(4)
Outstanding (5)
Not Observed
Rating Average
a. Is aware of current literature in the field of school psychology and education
0 0 3 2 4 0 4.1
Percent of Total
0% 0% 33% 22% 44% 0%
b. Understands measurement practices and outcomes and can explain to others
0 0 4 1 4 0 4.0
Percent of Total
0% 0% 44% 11% 44% 0%
c. Designs evaluations relevant to own work 0 0 4 0 3 2 3.9
Percent of Total
0% 0% 44% 0% 33% 22%
Professional Issues
Item Poor (1)
Below Standard (2)
Standard (3)
Above Standard
(4)
Outstanding (5)
Not Observed
Rating Average
a. Knows/applies laws regarding school policies and practices including special education identification and IEP development
0 0 4 3 2 0 3.8
Percent of Total
0% 0% 44% 33% 22% 0%
b. Knows/applies legal and ethical standards in professional practice 0 0 4 2 3 0 3.9
Percent of Total
0% 0% 44% 22% 33% 0%
c. Demonstrates professional behavior in his or her work 0 0 4 1 4 0 4.0
Percent of Total
0% 0% 44% 11% 44% 0%
d. Participates in professional development activities 0 0 3 2 4 0 4.1
Percent of Total
0% 0% 33% 22% 44% 0%
Narrative Interpretation of What Data Means in Relation to Candidates’ Content Knowledge

NLU School Psychology Program Annual Report 2013-2014
26
In the second year, students are expected to be increasingly engaged in standard School Psychology service delivery practices with increasing independence as the year proceeds. As a result, depending on category, fewer ratings are reported as Not Observed. For most of the observed areas, nearly all of our second-year students are performing as expected (Standard, (3)) with many category averages above 4 (Above Standard). In some areas, such as Professional Issues and Supervision, our second-year students are routinely evaluated as (Outstanding, (5)). However, 1 student in this group was identified as Below Standard in three of the S3P portfolio evaluation categories and formative feedback was provided for improvement.
Year 3 Students Content Knowledge Results Table 8. 2013-2014 Year 3 (Interns) Student Livetext Portfolio Content Knowledge Evaluation Results
Item Unsatisfactory (0 Points)
Transitioning (1 Point)
Scaffolded (2 Points)
Ready (3 Points)
Mean SD
Prevention Narrative -- 3 (15%)
7 (35%)
10 (50%)
2.4 .70
Problem-Solving Narrative -- 4 (20%)
7 (35%)
9 (45%)
2.3 .70
Assessment/Research and Data-Based Decision Making Narrative
-- 5 (25%)
4 (20%)
11 (55%)
2.3 .70
Professional Development -- 3 (15%)
7 (35%)
10 (50%)
2.4 .70
Prevention Narrative NASP.2.1, NASP.2.10, NASP.2.3, NASP.2.4, NASP.2.5, NASP.2.6, NASP.2.7, NASP.2.8
50% Meet or Exceed Expected Developmental Standards
Problem Solving Narrative NASP.2.1, NASP.2.10, NASP.2.2, NASP.2.3, NASP.2.4, NASP.2.5, NASP.2.8
45% Meet or Exceed Expected Developmental Standards
Research Narrative NASP.2.10, NASP.2.11, NASP.2.9
55% Meet or Exceed Expected Developmental Standards
Professional Disposition Narrative NASP.2.10, NASP.2.2
50%

NLU School Psychology Program Annual Report 2013-2014
27
Total Portfolio Reviews completed: 20

NLU School Psychology Program Annual Report 2013-2014
28
Table 9. YEAR 3 Supervisor Field Evaluation Survey (FES) Results at End of Internship (Data for 17 candidates) Decision Making and Accountability
Item Poor (1)
Below Standard (2)
Standard (3)
Above Standard
(4)
Outstanding (5)
Not Observed
Rating Average
a. Understands/uses assessment in a problem solving context 0 0 3 5 9 0 4.4
Percent of Total
0% 0% 18% 29% 53% 0%
b. Uses appropriate assessment strategies for individual students 0 0 3 7 7 0 4.2
Percent of Total
0% 0% 18% 41% 41% 0%
c. Uses appropriate assessment strategies for program
evaluation and accountability 0 0 2 6 8 1 4.4
Percent of Total
0% 0% 12% 35% 47% 6%
d. Uses assessment to inform special education eligibility decisions 0 0 3 6 8 0 4.3
Percent of Total
0% 0% 18% 35% 47% 0%
Evidence-Based Interventions Item Poor
(1) Below Standard
(2) Standard
(3) Above
Standard (4)
Outstanding (5)
Not Observed
Rating Average
a. Interventions match appropriately with identified problem(s) 0 0 3 5 9 0 4.4
Percent of Total
0% 0% 18% 29% 53% 0%
b. Knowledge/application of evidence-based social-emotional/behavior interventions 0 0 2 6 9 0 4.4
Percent of Total
0% 0% 12% 18% 29% 0%

NLU School Psychology Program Annual Report 2013-2014
29
c. Knowledge/application of evidence-based counseling interventions 0 0 7 3 5 2 3.9
Percent of Total
0% 0% 41% 18% 29% 12%
d. Knowledge/application of evidence-based academic and instructional interventions 0 0 4 5 8 0 4.2
Percent of Total
0% 0% 24% 29% 47% 0%
e. Intervention fidelity is assessed 0 0 3 4 8 2 4.3
Percent of Total
0% 0% 18% 24% 47% 12%
f. Follows up to provide necessary support 0 0 4 3 9 1 4.3
Percent of Total
0% 0% 24% 18% 53% 6%
Consultation/Collaboration Item Poor
(1) Below Standard
(2) Standard
(3) Above
Standard (4)
Outstanding (5)
Not Observed
Rating Average
a. Displays knowledge/skill in consultative problem solving 0 0 2 6 9 0 4.4
Percent of Total
0% 0% 12% 35% 53% 0%
b. Conveys information accurately/effectively 0 0 2 5 10 0 4.5
Percent of Total
0% 0% 12% 29% 59% 0%
c. Works collaboratively with others 0 0 3 2 12 0 4.5
Percent of Total
0% 0% 18% 12% 71% 0%
d. Displays appropriate interpersonal communication skills 0 0 4 3 10 0 4.4
Percent of Total
0% 0% 24% 18% 59% 0%
e. Understands/uses organizational consultation (e.g., consultation with administrators or groups) 0 0 4 4 8 1 4.3
0% 0% 24% 24% 47% 6%
NLU School Psychology Program Annual Report 2013-2014
30
Percent of Total
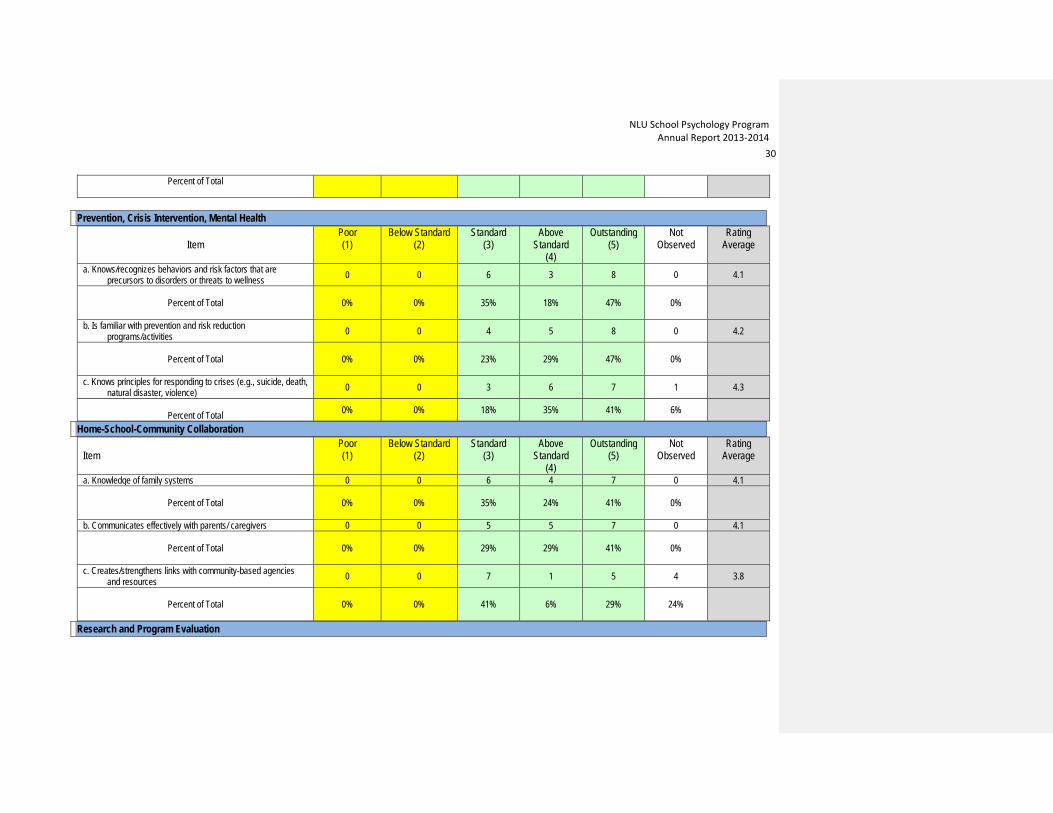
Prevention, Crisis Intervention, Mental Health
Item
Poor (1)
Below Standard (2)
Standard (3)
Above Standard
(4)
Outstanding (5)
Not Observed
Rating Average
a. Knows/recognizes behaviors and risk factors that are precursors to disorders or threats to wellness 0 0 6 3 8 0 4.1
Percent of Total
0% 0% 35% 18% 47% 0%
b. Is familiar with prevention and risk reduction programs/activities 0 0 4 5 8 0 4.2
Percent of Total
0% 0% 23% 29% 47% 0%
c. Knows principles for responding to crises (e.g., suicide, death, natural disaster, violence) 0 0 3 6 7 1 4.3
Percent of Total 0% 0% 18% 35% 41% 6%
Home-School-Community Collaboration Item
Poor (1)
Below Standard (2)
Standard (3)
Above Standard
(4)
Outstanding (5)
Not Observed
Rating Average
a. Knowledge of family systems 0 0 6 4 7 0 4.1
Percent of Total
0% 0% 35% 24% 41% 0%
b. Communicates effectively with parents/ caregivers 0 0 5 5 7 0 4.1
Percent of Total
0% 0% 29% 29% 41% 0%
c. Creates/strengthens links with community-based agencies and resources 0 0 7 1 5 4 3.8
Percent of Total
0% 0% 41% 6% 29% 24%
Research and Program Evaluation
NLU School Psychology Program Annual Report 2013-2014
31
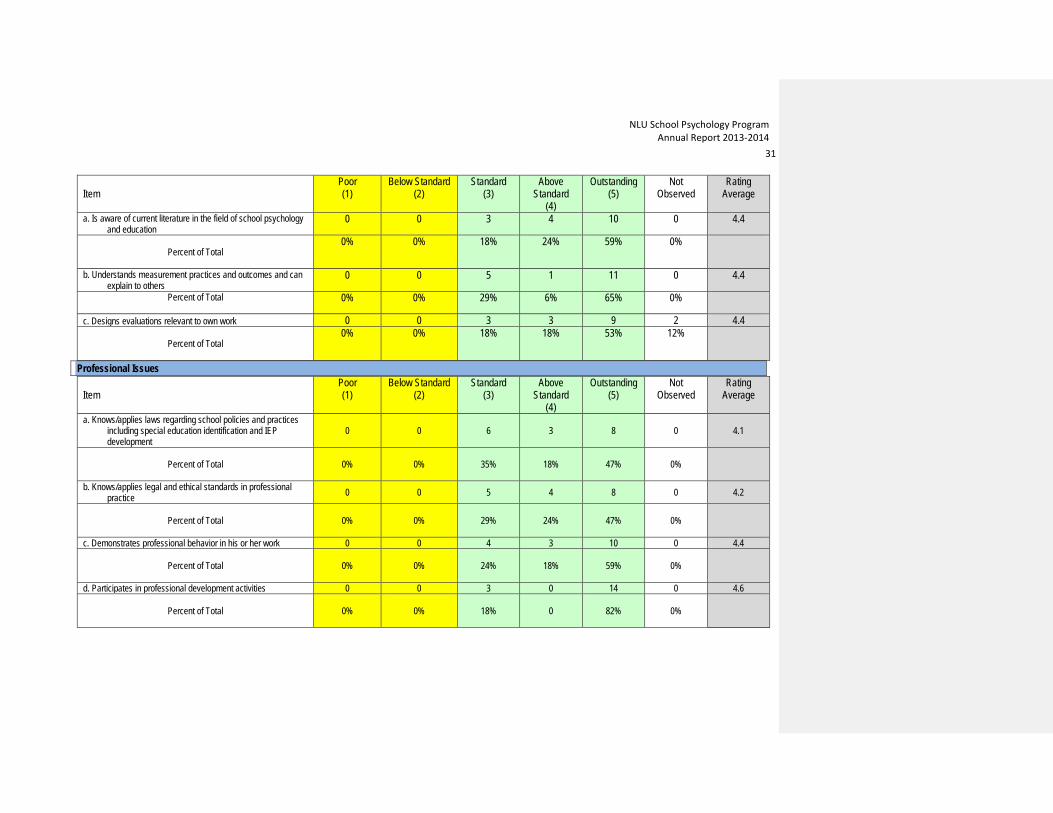
Item
Poor (1)
Below Standard (2)
Standard (3)
Above Standard
(4)
Outstanding (5)
Not Observed
Rating Average
a. Is aware of current literature in the field of school psychology and education
0 0 3 4 10 0 4.4
Percent of Total
0% 0% 18% 24% 59% 0%
b. Understands measurement practices and outcomes and can explain to others
0 0 5 1 11 0 4.4
Percent of Total
0% 0% 29% 6% 65% 0%
c. Designs evaluations relevant to own work 0 0 3 3 9 2 4.4
Percent of Total
0% 0% 18% 18% 53% 12%
Professional Issues
Item Poor (1)
Below Standard (2)
Standard (3)
Above Standard
(4)
Outstanding (5)
Not Observed
Rating Average
a. Knows/applies laws regarding school policies and practices including special education identification and IEP development
0 0 6 3 8 0 4.1
Percent of Total
0% 0% 35% 18% 47% 0%
b. Knows/applies legal and ethical standards in professional practice 0 0 5 4 8 0 4.2
Percent of Total
0% 0% 29% 24% 47% 0%
c. Demonstrates professional behavior in his or her work 0 0 4 3 10 0 4.4
Percent of Total
0% 0% 24% 18% 59% 0%
d. Participates in professional development activities 0 0 3 0 14 0 4.6
Percent of Total
0% 0% 18% 0 82% 0%
NLU School Psychology Program Annual Report 2013-2014
32
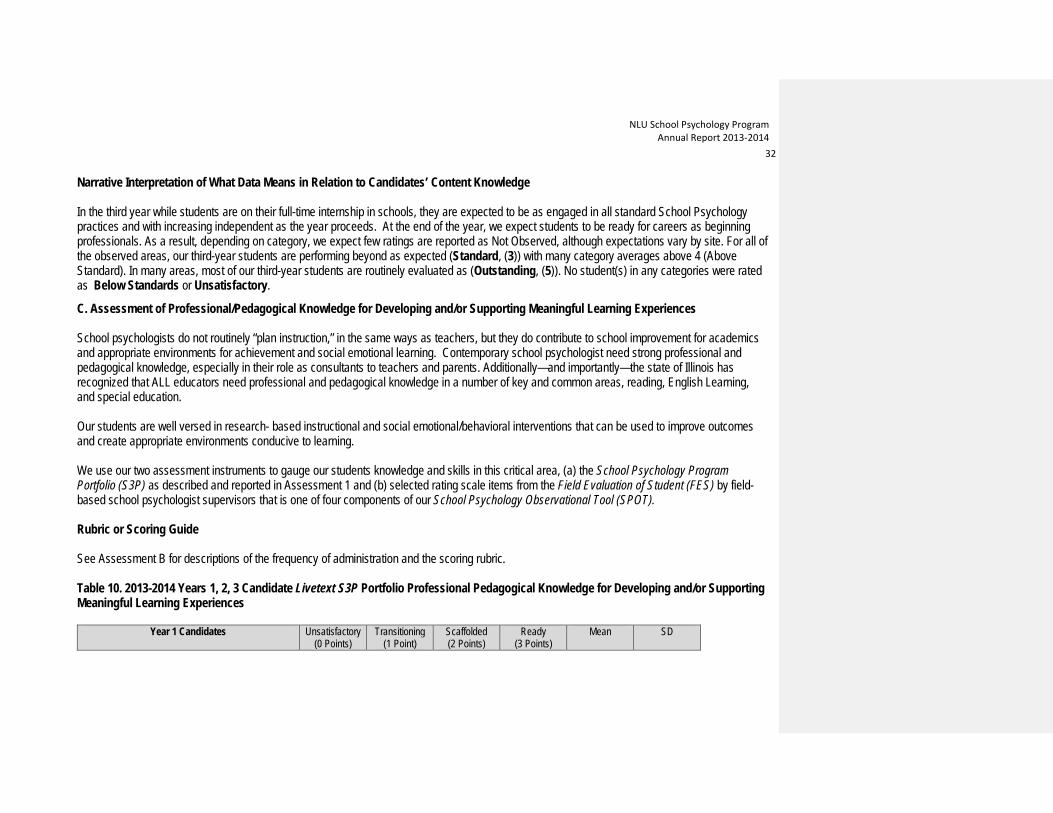
Narrative Interpretation of What Data Means in Relation to Candidates’ Content Knowledge In the third year while students are on their full-time internship in schools, they are expected to be as engaged in all standard School Psychology practices and with increasing independent as the year proceeds. At the end of the year, we expect students to be ready for careers as beginning professionals. As a result, depending on category, we expect few ratings are reported as Not Observed, although expectations vary by site. For all of the observed areas, our third-year students are performing beyond as expected (Standard, (3)) with many category averages above 4 (Above Standard). In many areas, most of our third-year students are routinely evaluated as (Outstanding, (5)). No student(s) in any categories were rated as Below Standards or Unsatisfactory.
C. Assessment of Professional/Pedagogical Knowledge for Developing and/or Supporting Meaningful Learning Experiences School psychologists do not routinely “plan instruction,” in the same ways as teachers, but they do contribute to school improvement for academics and appropriate environments for achievement and social emotional learning. Contemporary school psychologist need strong professional and pedagogical knowledge, especially in their role as consultants to teachers and parents. Additionally—and importantly—the state of Illinois has recognized that ALL educators need professional and pedagogical knowledge in a number of key and common areas, reading, English Learning, and special education. Our students are well versed in research- based instructional and social emotional/behavioral interventions that can be used to improve outcomes and create appropriate environments conducive to learning. We use our two assessment instruments to gauge our students knowledge and skills in this critical area, (a) the School Psychology Program Portfolio (S3P) as described and reported in Assessment 1 and (b) selected rating scale items from the Field Evaluation of Student (FES) by field-based school psychologist supervisors that is one of four components of our School Psychology Observational Tool (SPOT). Rubric or Scoring Guide See Assessment B for descriptions of the frequency of administration and the scoring rubric. Table 10. 2013-2014 Years 1, 2, 3 Candidate Livetext S3P Portfolio Professional Pedagogical Knowledge for Developing and/or Supporting Meaningful Learning Experiences
Year 1 Candidates Unsatisfactory (0 Points)
Transitioning (1 Point)
Scaffolded (2 Points)
Ready (3 Points)
Mean SD

NLU School Psychology Program Annual Report 2013-2014
33
Prevention Narrative -- 4 (40%)
6 (60%)
-- 1.6 .5
Problem-Solving Narrative -- 5 (50%)
5 (50%)
-- 1.5 .5
Year 2 Candidates Unsatisfactory (0 Points)
Transitioning (1 Point)
Scaffolded (2 Points)
Ready (3 Points)
Mean SD
Prevention Narrative -- 4 (40%)
6 (60%)
-- 1.6 .5
Problem-Solving Narrative -- 5 (50%)
5 (50%)
-- 1.5 .5
Year 3 Candidates Unsatisfactory (0 Points)
Transitioning (1 Point)
Scaffolded (2 Points)
Ready (3 Points)
Mean SD
Prevention Narrative -- 3 (15%)
7 (35%)
10 (50%)
2.4 .70
Problem-Solving Narrative -- 4 (20%)
7 (35%)
9 (45%)
2.3 .70
Narrative Interpretation of What Data Means in Relation to Candidates’ Professional Pedagogical Knowledge for Developing and/or Supporting Meaningful Learning Experiences The expected developmental pattern is observed in the Livetext Portfolio evaluations, with most students meeting their specific Year expectations and an increasing pattern of Ready Knowledge for effective practice in this critical area. Some students were judged by their course performances to have knowledge and skills above the quality of their Livetext Portfolios and in those instances, they were encouraged to revise their portfolio. Additionally, changes to provide more explicit instruction in these areas and changes in assignments were made to increase content knowledge of Year 2 Practicum students when they went on their Internships.
NLU School Psychology Program Annual Report 2013-2014
34
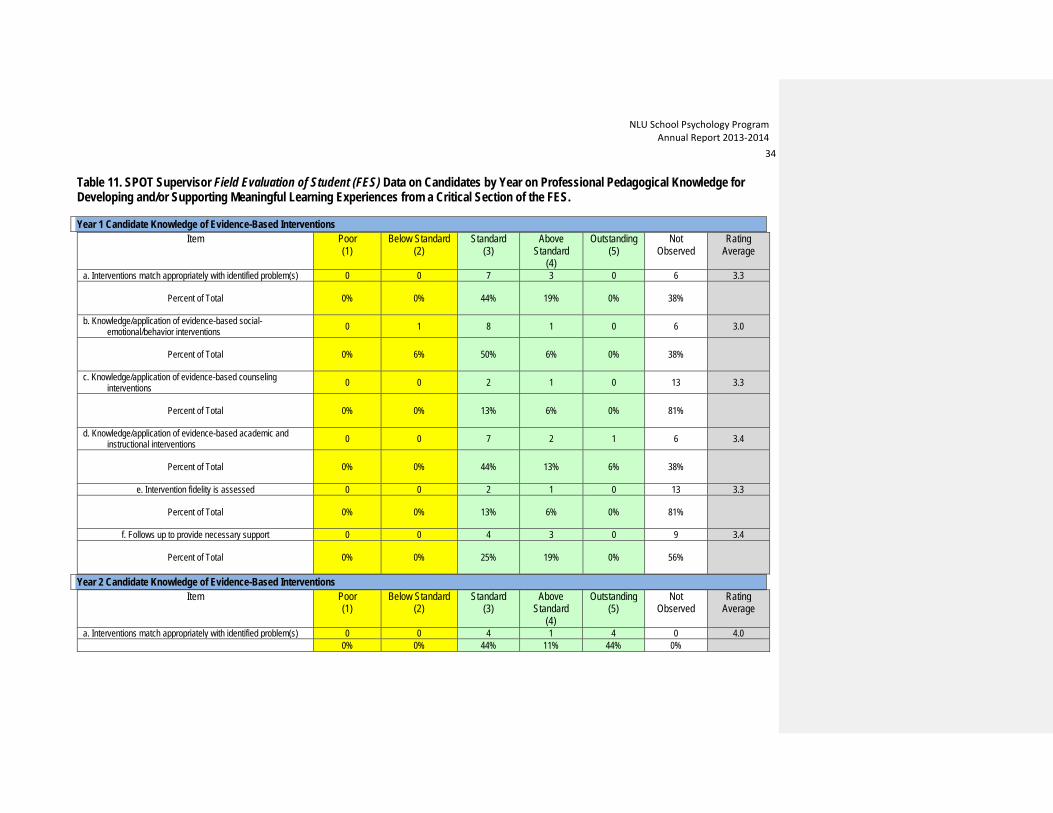
Table 11. SPOT Supervisor Field Evaluation of Student (FES) Data on Candidates by Year on Professional Pedagogical Knowledge for Developing and/or Supporting Meaningful Learning Experiences from a Critical Section of the FES. Year 1 Candidate Knowledge of Evidence-Based Interventions
Item Poor (1)
Below Standard (2)
Standard (3)
Above Standard
(4)
Outstanding (5)
Not Observed
Rating Average
a. Interventions match appropriately with identified problem(s) 0 0 7 3 0 6 3.3
Percent of Total
0% 0% 44% 19% 0% 38%
b. Knowledge/application of evidence-based social-emotional/behavior interventions 0 1 8 1 0 6 3.0
Percent of Total
0% 6% 50% 6% 0% 38%
c. Knowledge/application of evidence-based counseling interventions 0 0 2 1 0 13 3.3
Percent of Total
0% 0% 13% 6% 0% 81%
d. Knowledge/application of evidence-based academic and instructional interventions 0 0 7 2 1 6 3.4
Percent of Total
0% 0% 44% 13% 6% 38%
e. Intervention fidelity is assessed 0 0 2 1 0 13 3.3
Percent of Total
0% 0% 13% 6% 0% 81%
f. Follows up to provide necessary support 0 0 4 3 0 9 3.4
Percent of Total
0% 0% 25% 19% 0% 56%
Year 2 Candidate Knowledge of Evidence-Based Interventions Item Poor
(1) Below Standard
(2) Standard
(3) Above
Standard (4)
Outstanding (5)
Not Observed
Rating Average
a. Interventions match appropriately with identified problem(s) 0 0 4 1 4 0 4.0 0% 0% 44% 11% 44% 0%

NLU School Psychology Program Annual Report 2013-2014
35
Percent of Total b. Knowledge/application of evidence-based social-
emotional/behavior interventions 0 0 4 2 3 0 3.9
Percent of Total
0% 6% 44% 22% 33% 0%
c. Knowledge/application of evidence-based counseling interventions 0 0 5 1 2 1 3.6
Percent of Total
0% 0% 56% 11% 22% 11%
d. Knowledge/application of evidence-based academic and instructional interventions 0 0 3 4 2 0 3.9
Percent of Total
0% 0% 33% 44% 22% 0%
e. Intervention fidelity is assessed 0 0 2 2 3 2 4.1
Percent of Total
0% 0% 22% 22% 33% 22%
f. Follows up to provide necessary support 0 1 3 1 4 0 3.9
Percent of Total
0% 11% 33% 11% 44% 0%
Year 3 Candidate Knowledge of Evidence-Based Interventions Item Poor
(1) Below Standard
(2) Standard
(3) Above
Standard (4)
Outstanding (5)
Not Observed
Rating Average
a. Interventions match appropriately with identified problem(s) 0 0 3 5 9 0 4.4
Percent of Total
0% 0% 18% 29% 53% 0%
b. Knowledge/application of evidence-based social-emotional/behavior interventions 0 0 2 6 9 0 4.4
Percent of Total
0% 0% 12% 18% 29% 0%
c. Knowledge/application of evidence-based counseling interventions 0 0 7 3 5 2 3.9
0% 0% 41% 18% 29% 12%

NLU School Psychology Program Annual Report 2013-2014
36
Percent of Total d. Knowledge/application of evidence-based academic and
instructional interventions 0 0 4 5 8 0 4.2
Percent of Total
0% 0% 24% 29% 47% 0%
e. Intervention fidelity is assessed 0 0 3 4 8 2 4.3
Percent of Total
0% 0% 18% 24% 47% 12%
f. Follows up to provide necessary support 0 0 4 3 9 1 4.3
Percent of Total
0% 0% 24% 18% 53% 6%
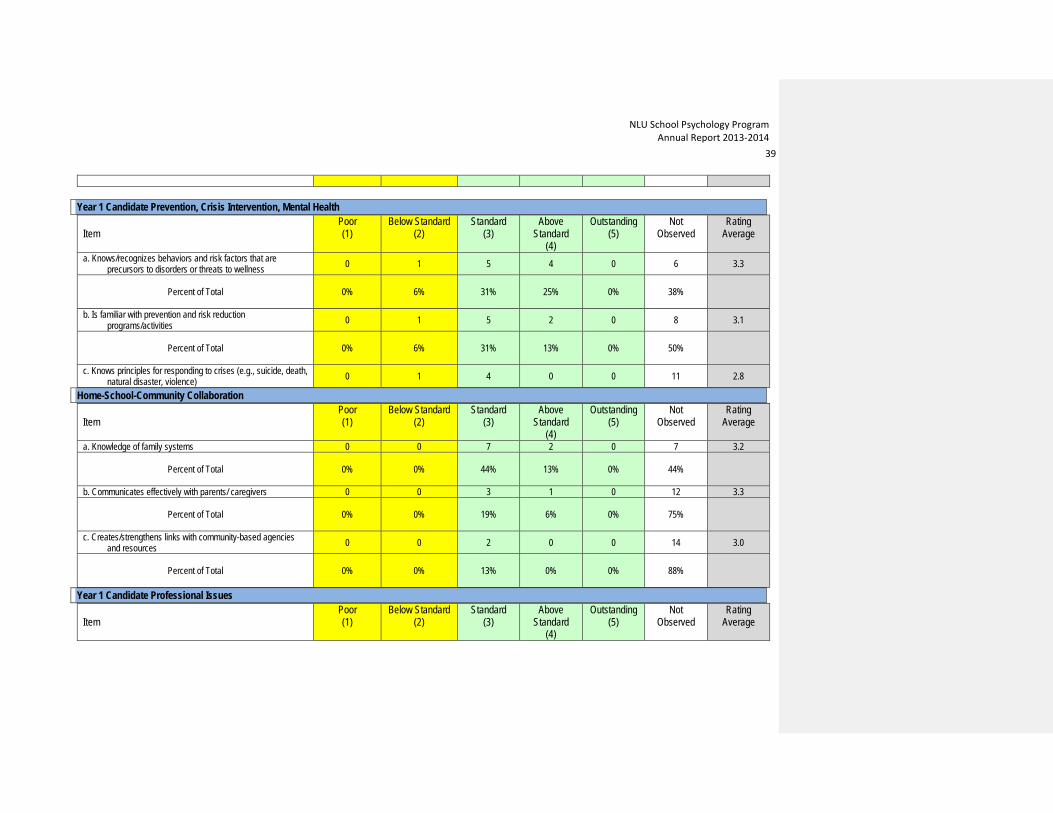
Narrative Interpretation of What Data Means in Relation to Candidates’ Professional Pedagogical Knowledge for Developing and/or Supporting Meaningful Learning Experiences Results of our SPOT data obtained from practica and internship field-based supervisors’ ratings of our students’ Professional Pedagogical Knowledge for Developing and/or Supporting Meaningful Learning Experiences show our predicted and preferred outcomes. First-year students are rated as Standard or Above in all expected skill domains with the exception of a single student in a single rating. All but one Year 2 student met or exceeded Supervisors’ ratings of Standard. All Interns were rated as Standard or above, with the majority of students are rated as Above Standard or Outstanding by their supervisors. D. Assessment of Field or Clinical Experiences/Application to Professional Work The primary tool to address this domain is the Field Evaluation of Student (FES) from the SPOT that was described earlier. The rubric is the same.

NLU School Psychology Program Annual Report 2013-2014
37
Table 12. Field Evaluation Survey (FES) 2013-2014 Results of Field or Clinical Experiences/Application to Professional Work by Year in the Program Year 1 Candidate Decision Making and Accountability
Item Poor (1)
Below Standard (2)
Standard (3)
Above Standard
(4)
Outstanding (5)
Not Observed
Rating Average
a. Understands/uses assessment in a problem solving context 0 1 10 4 0 1 3.2
Percent of Total
0% 6% 63% 25% 0% 6%
b. Uses appropriate assessment strategies for individual students 0 0 11 3 0 2 3.2
Percent of Total
0% 0% 69% 19% 0% 13%
c. Uses appropriate assessment strategies for program
evaluation and accountability 0 0 8 2 0 6 3.2
Percent of Total
0% 0% 50% 13% 0% 38%
d. Uses assessment to inform special education eligibility decisions 0 0 3 1 0 12 3.3
Percent of Total
0% 0% 19% 6% 0% 75%
Year 1 Candidate Evidence-Based Interventions Item Poor
(1) Below Standard
(2) Standard
(3) Above
Standard (4)
Outstanding (5)
Not Observed
Rating Average
a. Interventions match appropriately with identified problem(s) 0 0 7 3 0 6 3.3
Percent of Total
0% 0% 44% 19% 0% 38%
b. Knowledge/application of evidence-based social-emotional/behavior interventions 0 1 8 1 0 6 3.0
Percent of Total
0% 6% 50% 6% 0% 38%

NLU School Psychology Program Annual Report 2013-2014
38
c. Knowledge/application of evidence-based counseling interventions 0 0 2 1 0 13 3.3
Percent of Total
0% 0% 13% 6% 0% 81%
d. Knowledge/application of evidence-based academic and instructional interventions 0 0 7 2 1 6 3.4
Percent of Total
0% 0% 44% 13% 6% 38%
e. Intervention fidelity is assessed 0 0 2 1 0 13 3.3
Percent of Total
0% 0% 13% 6% 0% 81%
f. Follows up to provide necessary support 0 0 4 3 0 9 3.4
Percent of Total
0% 0% 25% 19% 0% 56%
Year 1 Candidate Consultation/Collaboration Item Poor
(1) Below Standard
(2) Standard
(3) Above
Standard (4)
Outstanding (5)
Not Observed
Rating Average
a. Displays knowledge/skill in consultative problem solving 0 1 6 3 0 6 3.2
Percent of Total
0% 6% 38% 19% 0% 38%
b. Conveys information accurately/effectively 0 2 5 8 0 1 3.4
Percent of Total
0% 13% 31% 50% 0% 6%
c. Works collaboratively with others 0 0 8 5 2 1 3.6
Percent of Total
0% 0% 50% 31% 13% 6%
d. Displays appropriate interpersonal communication skills 0 0 6 7 2 1 3.7
Percent of Total
0% 0% 38% 44% 13% 6%
e. Understands/uses organizational consultation (e.g., consultation with administrators or groups) 0 0 4 3 0 9 3.4
Percent of Total 0% 0% 25% 19% 0% 56%
NLU School Psychology Program Annual Report 2013-2014
39
Year 1 Candidate Prevention, Crisis Intervention, Mental Health
Item
Poor (1)
Below Standard (2)
Standard (3)
Above Standard
(4)
Outstanding (5)
Not Observed
Rating Average
a. Knows/recognizes behaviors and risk factors that are precursors to disorders or threats to wellness 0 1 5 4 0 6 3.3
Percent of Total
0% 6% 31% 25% 0% 38%
b. Is familiar with prevention and risk reduction programs/activities 0 1 5 2 0 8 3.1
Percent of Total
0% 6% 31% 13% 0% 50%
c. Knows principles for responding to crises (e.g., suicide, death, natural disaster, violence) 0 1 4 0 0 11 2.8
Home-School-Community Collaboration Item
Poor (1)
Below Standard (2)
Standard (3)
Above Standard
(4)
Outstanding (5)
Not Observed
Rating Average
a. Knowledge of family systems 0 0 7 2 0 7 3.2
Percent of Total
0% 0% 44% 13% 0% 44%
b. Communicates effectively with parents/ caregivers 0 0 3 1 0 12 3.3
Percent of Total
0% 0% 19% 6% 0% 75%
c. Creates/strengthens links with community-based agencies and resources 0 0 2 0 0 14 3.0
Percent of Total
0% 0% 13% 0% 0% 88%
Year 1 Candidate Professional Issues
Item Poor (1)
Below Standard (2)
Standard (3)
Above Standard
(4)
Outstanding (5)
Not Observed
Rating Average

NLU School Psychology Program Annual Report 2013-2014
40
a. Knows/applies laws regarding school policies and practices including special education identification and IEP development
0 2 5 2 0 7 3.0
Percent of Total
0% 13% 31% 13% 0% 44%
b. Knows/applies legal and ethical standards in professional practice 0 2 4 4 0 6 3.2
Percent of Total
0% 13% 25% 25% 0% 38%
c. Demonstrates professional behavior in his or her work 0 0 8 5 3 0 3.7
Percent of Total
0% 0% 50% 31% 19% 0%
d. Participates in professional development activities 0 0 3 6 0 7 3.7
Percent of Total
0% 0% 19% 38% 22% 44%
Year 2 Candidate Decision Making and Accountability Item Poor
(1) Below Standard
(2) Standard
(3) Above
Standard (4)
Outstanding (5)
Not Observed
Rating Average
a. Understands/uses assessment in a problem solving context 0 0 4 2 3 0 3.9
Percent of Total
0% 0% 44% 22% 33% 0%
b. Uses appropriate assessment strategies for individual students 0 0 4 2 2 1 3.8
Percent of Total
0% 0% 44% 22% 22% 11%
c. Uses appropriate assessment strategies for program
evaluation and accountability 0 0 4 2 2 1 3.8
Percent of Total
0% 0% 44% 22% 22% 11%
d. Uses assessment to inform special education eligibility decisions 0 0 4 1 2 2 3.7
0% 0% 44% 11% 22% 22%

NLU School Psychology Program Annual Report 2013-2014
41
Percent of Total
Year 2 Candidate Decision Making and Accountability
Item Poor (1)
Below Standard (2)
Standard (3)
Above Standard
(4)
Outstanding (5)
Not Observed
Rating Average
a. Understands/uses assessment in a problem solving context 0 0 3 5 9 0 4.4
Percent of Total
0% 0% 18% 29% 53% 0%
b. Uses appropriate assessment strategies for individual students 0 0 3 7 7 0 4.2
Percent of Total
0% 0% 18% 41% 41% 0%
c. Uses appropriate assessment strategies for program
evaluation and accountability 0 0 2 6 8 1 4.4
Percent of Total
0% 0% 12% 35% 47% 6%
d. Uses assessment to inform special education eligibility decisions 0 0 3 6 8 0 4.3
Percent of Total
0% 0% 18% 35% 47% 0%
Year 2 Candidate Evidence-Based Interventions Item Poor
(1) Below Standard
(2) Standard
(3) Above
Standard (4)
Outstanding (5)
Not Observed
Rating Average
a. Interventions match appropriately with identified problem(s) 0 0 3 5 9 0 4.4
Percent of Total
0% 0% 18% 29% 53% 0%
b. Knowledge/application of evidence-based social-emotional/behavior interventions 0 0 2 6 9 0 4.4
0% 0% 12% 18% 29% 0%

NLU School Psychology Program Annual Report 2013-2014
42
Percent of Total c. Knowledge/application of evidence-based counseling
interventions 0 0 7 3 5 2 3.9
Percent of Total
0% 0% 41% 18% 29% 12%
d. Knowledge/application of evidence-based academic and instructional interventions 0 0 4 5 8 0 4.2
Percent of Total
0% 0% 24% 29% 47% 0%
e. Intervention fidelity is assessed 0 0 3 4 8 2 4.3
Percent of Total
0% 0% 18% 24% 47% 12%
f. Follows up to provide necessary support 0 0 4 3 9 1 4.3
Percent of Total
0% 0% 24% 18% 53% 6%
Year 2 Candidate Consultation/Collaboration Item Poor
(1) Below Standard
(2) Standard
(3) Above
Standard (4)
Outstanding (5)
Not Observed
Rating Average
a. Displays knowledge/skill in consultative problem solving 0 0 2 6 9 0 4.4
Percent of Total
0% 0% 12% 35% 53% 0%
b. Conveys information accurately/effectively 0 0 2 5 10 0 4.5
Percent of Total
0% 0% 12% 29% 59% 0%
c. Works collaboratively with others 0 0 3 2 12 0 4.5
Percent of Total
0% 0% 18% 12% 71% 0%
d. Displays appropriate interpersonal communication skills 0 0 4 3 10 0 4.4
Percent of Total
0% 0% 24% 18% 59% 0%
NLU School Psychology Program Annual Report 2013-2014
43
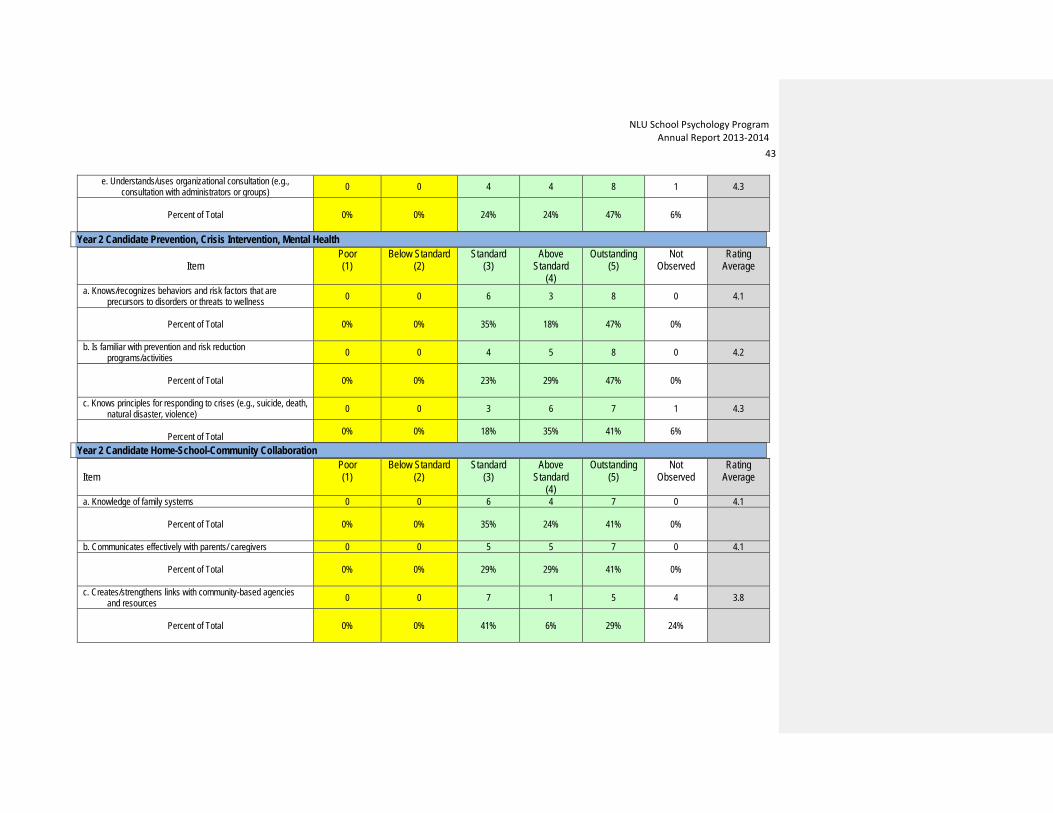
e. Understands/uses organizational consultation (e.g., consultation with administrators or groups) 0 0 4 4 8 1 4.3
Percent of Total
0% 0% 24% 24% 47% 6%
Year 2 Candidate Prevention, Crisis Intervention, Mental Health
Item Poor (1)
Below Standard (2)
Standard (3)
Above Standard
(4)
Outstanding (5)
Not Observed
Rating Average
a. Knows/recognizes behaviors and risk factors that are precursors to disorders or threats to wellness 0 0 6 3 8 0 4.1
Percent of Total
0% 0% 35% 18% 47% 0%
b. Is familiar with prevention and risk reduction programs/activities 0 0 4 5 8 0 4.2
Percent of Total
0% 0% 23% 29% 47% 0%
c. Knows principles for responding to crises (e.g., suicide, death, natural disaster, violence) 0 0 3 6 7 1 4.3
Percent of Total 0% 0% 18% 35% 41% 6%
Year 2 Candidate Home-School-Community Collaboration Item
Poor (1)
Below Standard (2)
Standard (3)
Above Standard
(4)
Outstanding (5)
Not Observed
Rating Average
a. Knowledge of family systems 0 0 6 4 7 0 4.1
Percent of Total
0% 0% 35% 24% 41% 0%
b. Communicates effectively with parents/ caregivers 0 0 5 5 7 0 4.1
Percent of Total
0% 0% 29% 29% 41% 0%
c. Creates/strengthens links with community-based agencies and resources 0 0 7 1 5 4 3.8
Percent of Total
0% 0% 41% 6% 29% 24%
NLU School Psychology Program Annual Report 2013-2014
44
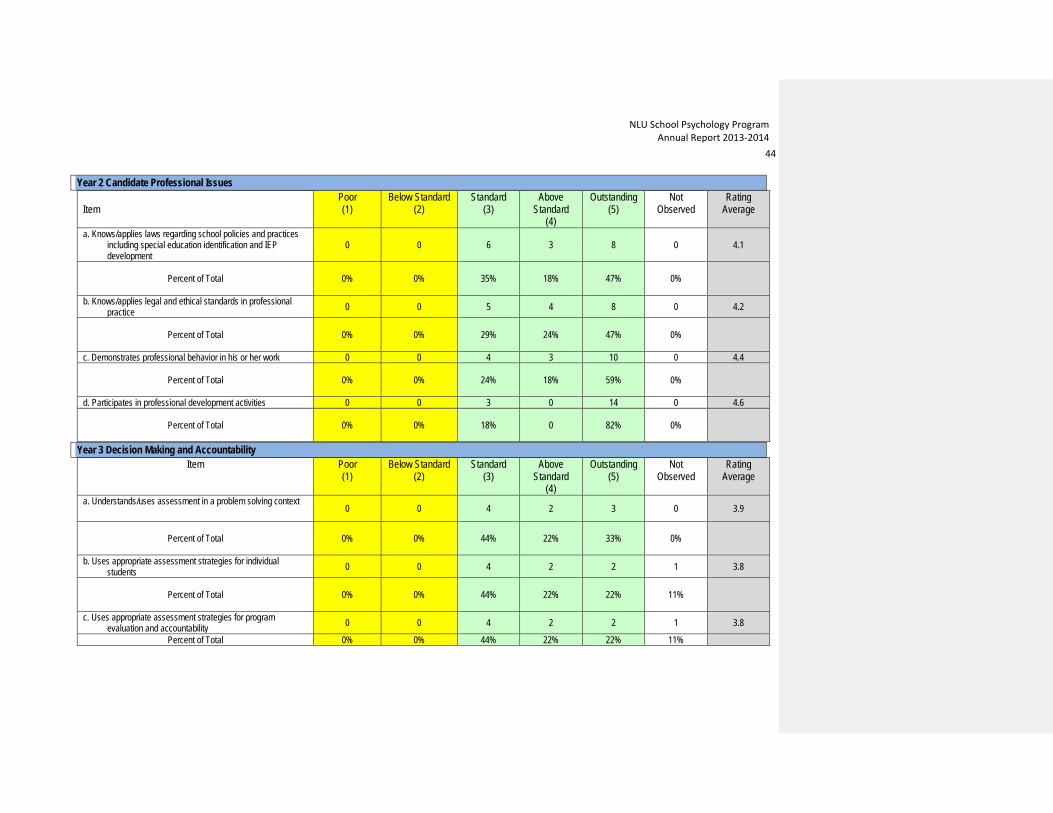
Year 2 Candidate Professional Issues
Item Poor (1)
Below Standard (2)
Standard (3)
Above Standard
(4)
Outstanding (5)
Not Observed
Rating Average
a. Knows/applies laws regarding school policies and practices including special education identification and IEP development
0 0 6 3 8 0 4.1
Percent of Total
0% 0% 35% 18% 47% 0%
b. Knows/applies legal and ethical standards in professional practice 0 0 5 4 8 0 4.2
Percent of Total
0% 0% 29% 24% 47% 0%
c. Demonstrates professional behavior in his or her work 0 0 4 3 10 0 4.4
Percent of Total
0% 0% 24% 18% 59% 0%
d. Participates in professional development activities 0 0 3 0 14 0 4.6
Percent of Total
0% 0% 18% 0 82% 0%
Year 3 Decision Making and Accountability Item Poor
(1) Below Standard
(2) Standard
(3) Above
Standard (4)
Outstanding (5)
Not Observed
Rating Average
a. Understands/uses assessment in a problem solving context 0 0 4 2 3 0 3.9
Percent of Total
0% 0% 44% 22% 33% 0%
b. Uses appropriate assessment strategies for individual students 0 0 4 2 2 1 3.8
Percent of Total
0% 0% 44% 22% 22% 11%
c. Uses appropriate assessment strategies for program
evaluation and accountability 0 0 4 2 2 1 3.8 Percent of Total 0% 0% 44% 22% 22% 11%

NLU School Psychology Program Annual Report 2013-2014
45
d. Uses assessment to inform special education eligibility decisions 0 0 4 1 2 2 3.7
Percent of Total
0% 0% 44% 11% 22% 22%
Year 3 Candidate Evidence-Based Interventions Item Poor
(1) Below Standard
(2) Standard
(3) Above
Standard (4)
Outstanding (5)
Not Observed
Rating Average
a. Interventions match appropriately with identified problem(s) 0 0 4 1 4 0 4.0
Percent of Total
0% 0% 44% 11% 44% 0%
b. Knowledge/application of evidence-based social-emotional/behavior interventions 0 0 4 2 3 0 3.9
Percent of Total
0% 6% 44% 22% 33% 0%
c. Knowledge/application of evidence-based counseling interventions 0 0 5 1 2 1 3.6
Percent of Total
0% 0% 56% 11% 22% 11%
d. Knowledge/application of evidence-based academic and instructional interventions 0 0 3 4 2 0 3.9
Percent of Total
0% 0% 33% 44% 22% 0%
e. Intervention fidelity is assessed 0 0 2 2 3 2 4.1
Percent of Total
0% 0% 22% 22% 33% 22%
f. Follows up to provide necessary support 0 1 3 1 4 0 3.9
Percent of Total
0% 11% 33% 11% 44% 0%
Year 3 Candidate Consultation/Collaboration Item Poor
(1) Below Standard
(2) Standard
(3) Above
Standard Outstanding
(5) Not
Observed Rating
Average

NLU School Psychology Program Annual Report 2013-2014
46
(4) a. Displays knowledge/skill in consultative problem solving 0 0 2 4 3 0 4.1
Percent of Total
0% 0% 33% 22% 44% 0%
b. Conveys information accurately/effectively 0 0 3 2 4 0 4.1
Percent of Total
0% 0% 33% 22% 44% 0%
c. Works collaboratively with others 0 1 2 2 4 0 4.0
Percent of Total
0% 11% 22% 22% 44% 0%
d. Displays appropriate interpersonal communication skills 0 1 3 1 4 0 3.9
Percent of Total
0% 11% 33% 11% 44% 0%
e. Understands/uses organizational consultation (e.g., consultation with administrators or groups) 0 0 2 2 3 2 4.1
Percent of Total
0% 0% 22% 22% 33% 22%
Year 3 Candidate Prevention, Crisis Intervention, Mental Health
Item Poor (1)
Below Standard (2)
Standard (3)
Above Standard
(4)
Outstanding (5)
Not Observed
Rating Average
a. Knows/recognizes behaviors and risk factors that are precursors to disorders or threats to wellness 0 0 4 2 3 0 3.9
Percent of Total
0% 6% 44% 22% 33% 0%
b. Is familiar with prevention and risk reduction programs/activities 0 0 3 3 3 0 4.0
Percent of Total
0% 6% 33% 33% 33% 0%
c. Knows principles for responding to crises (e.g., suicide, death, natural disaster, violence) 0 0 2 1 2 4 4.0
Percent of Total 0% 0% 22% 11% 22% 44%
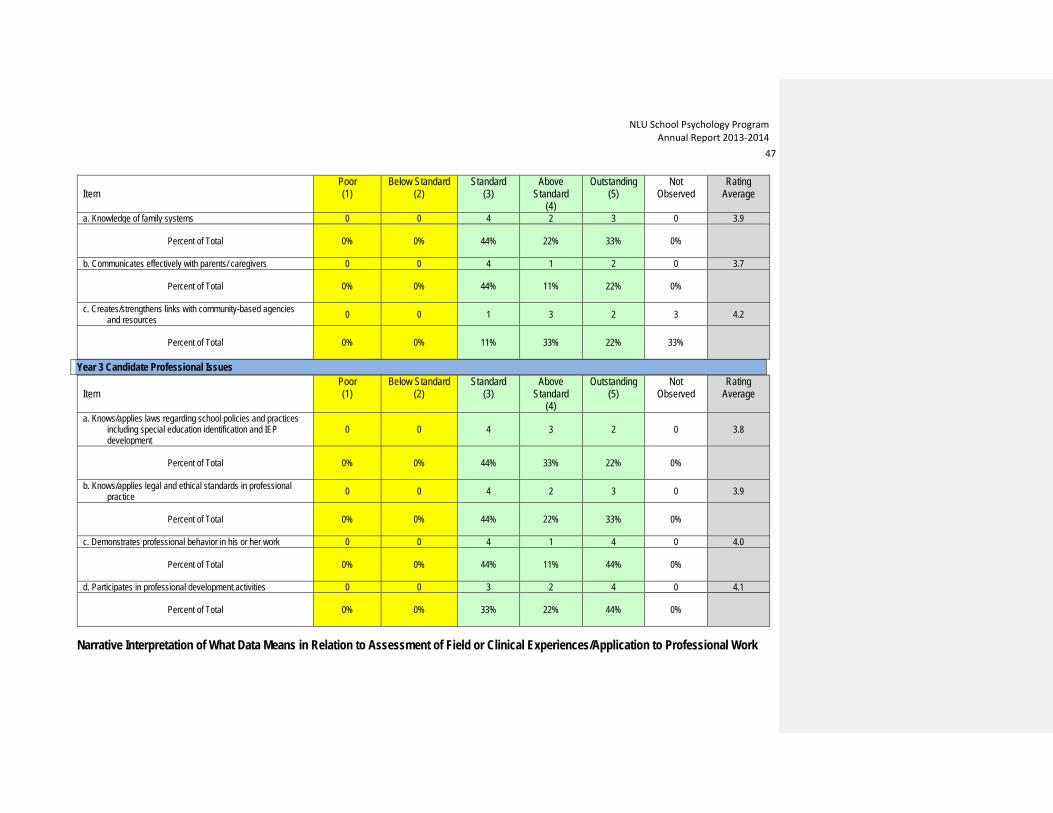
Year 3 Candidate Home-School-Community Collaboration
NLU School Psychology Program Annual Report 2013-2014
47
Item
Poor (1)
Below Standard (2)
Standard (3)
Above Standard
(4)
Outstanding (5)
Not Observed
Rating Average
a. Knowledge of family systems 0 0 4 2 3 0 3.9
Percent of Total
0% 0% 44% 22% 33% 0%
b. Communicates effectively with parents/ caregivers 0 0 4 1 2 0 3.7
Percent of Total
0% 0% 44% 11% 22% 0%
c. Creates/strengthens links with community-based agencies and resources 0 0 1 3 2 3 4.2
Percent of Total
0% 0% 11% 33% 22% 33%
Year 3 Candidate Professional Issues
Item Poor (1)
Below Standard (2)
Standard (3)
Above Standard
(4)
Outstanding (5)
Not Observed
Rating Average
a. Knows/applies laws regarding school policies and practices including special education identification and IEP development
0 0 4 3 2 0 3.8
Percent of Total
0% 0% 44% 33% 22% 0%
b. Knows/applies legal and ethical standards in professional practice 0 0 4 2 3 0 3.9
Percent of Total
0% 0% 44% 22% 33% 0%
c. Demonstrates professional behavior in his or her work 0 0 4 1 4 0 4.0
Percent of Total
0% 0% 44% 11% 44% 0%
d. Participates in professional development activities 0 0 3 2 4 0 4.1
Percent of Total
0% 0% 33% 22% 44% 0%
Narrative Interpretation of What Data Means in Relation to Assessment of Field or Clinical Experiences/Application to Professional Work

NLU School Psychology Program Annual Report 2013-2014
48
Results of our FES data obtained from practica and internship field-based supervisors’ ratings of our students’ Field or Clinical Experience/Application to Professional work again show our predicted and preferred outcomes. First-year students are rated as Standard or Above in all expected skill domains, with some individual exceptions in specific areas that are not the focus of Year 1 (e.g., legal issues). In each subsequent year, students are rated by their field-based practicum and internship supervisors higher with the exception of a single Year 2 student who was provided remediation; a greater percentage of students are rated Above Standard and Outstanding on all the relevant items. By Year 3, the vast majority of students are rated as Above Standard or Outstanding by their supervisors.

NLU School Psychology Program Annual Report 2013-2014
49
E. Assessment of Candidate Impact on Student Learning
We again use two assessment instruments to gauge our students knowledge and skills in this critical area, (a) the School Psychology Program Portfolio (S3P) as described and reported in Assessment 1 and (b) selected rating scale items from the Field Evaluation of Student (FES) by field-based school psychologist supervisors that is one of four components of our School Psychology Observational Tool (SPOT).
Rubric or Scoring Guide
See Assessment B for descriptions of the frequency of administration and the scoring rubric.
Table 13. 2013-2014 Year 1 Student Livetext S3P Portfolio Content Knowledge Evaluation Results
Year 1 Candidates Unsatisfactory (0 Points)
Transitioning (1 Point)
Scaffolded (2 Points)
Ready (3 Points)
Mean SD
Assessment/Research and Data-Based Decision Making Narrative
2 (14%)
11 (86%)
-- -- .85 .37
Year 2 Candidates Unsatisfactory (0 Points)
Transitioning (1 Point)
Scaffolded (2 Points)
Ready (3 Points)
Mean SD
Assessment/Research and Data-Based Decision Making Narrative
-- 5 (50%)
5 (50%)
-- 1.5 .5
Year 3 Candidates Unsatisfactory (0 Points)
Transitioning (1 Point)
Scaffolded (2 Points)
Ready (3 Points)
Mean SD
Assessment/Research and Data-Based Decision Making Narrative
-- 5 (25%)
4 (20%)
11 (55%)
2.3 .70
NLU School Psychology Program Annual Report 2013-2014
50
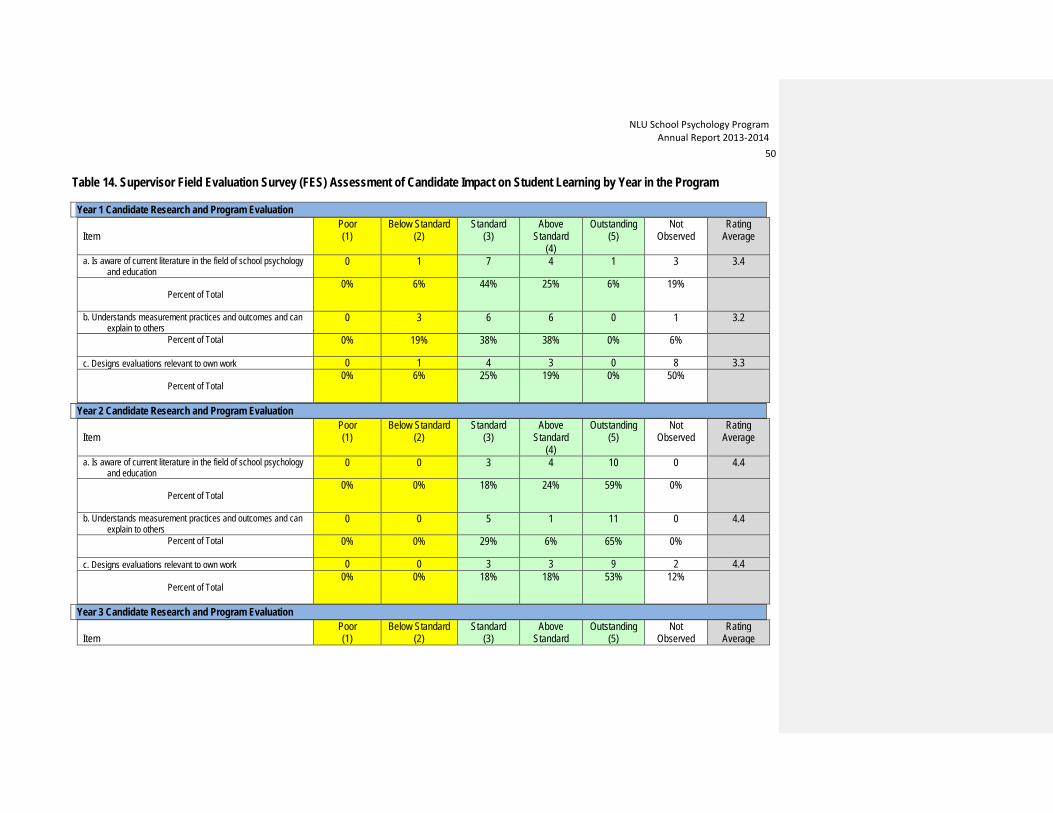
Table 14. Supervisor Field Evaluation Survey (FES) Assessment of Candidate Impact on Student Learning by Year in the Program Year 1 Candidate Research and Program Evaluation
Item
Poor (1)
Below Standard (2)
Standard (3)
Above Standard
(4)
Outstanding (5)
Not Observed
Rating Average
a. Is aware of current literature in the field of school psychology and education
0 1 7 4 1 3 3.4
Percent of Total
0% 6% 44% 25% 6% 19%
b. Understands measurement practices and outcomes and can explain to others
0 3 6 6 0 1 3.2
Percent of Total
0% 19% 38% 38% 0% 6%
c. Designs evaluations relevant to own work 0 1 4 3 0 8 3.3
Percent of Total
0% 6% 25% 19% 0% 50%
Year 2 Candidate Research and Program Evaluation
Item Poor (1)
Below Standard (2)
Standard (3)
Above Standard
(4)
Outstanding (5)
Not Observed
Rating Average
a. Is aware of current literature in the field of school psychology and education
0 0 3 4 10 0 4.4
Percent of Total
0% 0% 18% 24% 59% 0%
b. Understands measurement practices and outcomes and can explain to others
0 0 5 1 11 0 4.4
Percent of Total
0% 0% 29% 6% 65% 0%
c. Designs evaluations relevant to own work 0 0 3 3 9 2 4.4
Percent of Total
0% 0% 18% 18% 53% 12%
Year 3 Candidate Research and Program Evaluation
Item Poor (1)
Below Standard (2)
Standard (3)
Above Standard
Outstanding (5)
Not Observed
Rating Average

NLU School Psychology Program Annual Report 2013-2014
51
(4) a. Is aware of current literature in the field of school psychology
and education 0 0 3 2 4 0 4.1
Percent of Total
0% 0% 33% 22% 44% 0%
b. Understands measurement practices and outcomes and can explain to others
0 0 4 1 4 0 4.0
Percent of Total
0% 0% 44% 11% 44% 0%
c. Designs evaluations relevant to own work 0 0 4 0 3 2 3.9
Percent of Total
0% 0% 44% 0% 33% 22%
Narrative Interpretation of What Data Means in Relation to Candidates’ Impact on PreK-12 Student Learning Analysis of the SP3 Portfolio shows that, as expected, first-year students are acquiring skills in this domain and typically are rated as Transitioning in their professional development and knowledge. After their second year, our students’ portfolios are typically rated as Scaffolded. However, this Year’s cohort was judged to need more additional support and content instruction as noted earlier in the portfolio that is to be delivered in Internship Supervision courses. Supervisors rated students much higher than their University professors’ Livetext evaluations, consistent with the hypothesis that some students’ Livetext Portfolios were underestimates of their skills. To address this potential hypothesis, University faculty will provide more opportunities to receive corrective feedback in drafts of their Livetext Portfolio. At the end of Years 2 and 3 only 1 student was rated as Below Standards and in a specific skill areas. As our first-year students acquire skills in this domain, they are viewed by their professional school psychologist supervisors as At or Above standards. We believe this is evidence that our courses and experiences are attaining their objectives. Similarly, our second-year students are viewed by their professional school psychologist supervisors as At or Above standards. Most of our students were rated as Outstanding in this domain. No single Year 2 or 3 student was rated below our target minimum. We believe this is evidence that our courses and experiences are attaining their objectives. Our third-year students clearly demonstrate that they are have skills in this domain. Almost 1 in 4 Year 3 Interns were rated as Outstanding in this domain. No single student was rated below our target minimum. We believe this is evidence that our courses and experiences are attaining their objectives.

NLU School Psychology Program Annual Report 2013-2014
52
F. Assessment of Candidate Dispositions The School Psychology Program regularly engages in frequent and multi-faceted evaluation of students’ professional behaviors (i.e., “dispositions”) using the Professional Behaviors Evaluation of Student (PBES) adapted from the Professional Behaviors Quarterly Checklist developed by Dr. Mark R. Shinn when he was program director at the University of Oregon and from materials in: Harvey, V.S., & Struzziero, J. (2008). Professional development and supervision of school psychologists: From intern to expert (2nd ed.). Bethesda,
MD: Corwin Press and NASP. Cruise, T.K., & Swerdlik, M.E. (2010). Problematic behaviors: Mediating differences and negotiating change. In J. Kauffman, T.L. Hughs, & C.A.
Riccio (Eds.), Handbook of education, training, and supervision of school psychologists in school and community (vol. 2). New York: Routledge. It is designed to measure elements of behavior or dispositions conducive to professional practice, ranging from timeliness and accepting responsibility to seeking out professional resources and feedback for continuous improvement across settings (i.e., school and clinical practicum, internship). Evaluations Rubric Performance is evaluated regularly on the following scales.
. Poor (1): Fails to meet expectations. Consistently performs poorly and needs improvement. A specific plan and period of time should be established to improve performance.
. Below Standard (2): Performance is below average. Requires improvement to perform effectively in a professional environment.
. Standard (3): Meets typical expectations. Most students will possess skills and judgment sufficient to meet professional demands in the area and a large portion of them will remain in this range.
. Above Standard (4): Performance and judgment of students in this category is decidedly better than average. Shows sensitivity, judgment and skills beyond what is normally expected or displayed by peers.
. Outstanding (5): Performance is recognizably and decidedly better than that of a large proportion of other students.
. Not Observed: Insufficient data to make a rating at this time.

NLU School Psychology Program Annual Report 2013-2014
53
Table 15. Supervisor Professional Behaviors Evaluation of Student (PBES) Assessment of Candidate Dispositions by Year in the Program (Year 1 data for 14 candidates; Year 2 data for 6 candidates; Year 3 data for 17 candidates) Year 1 Candidate Professional and Self Awareness
Item
Poor (1)
Below Standard (2)
Standard (3)
Above Standard
(4)
Outstanding (5)
Not Observed
Rating Average
a. Exhibits appropriate professional appearance and self-presentation
0 0 5 7 2 0 3.8
Percent of Total
0% 0% 36% 50% 14% 0%
b. Adapts to the demands of the program/setting 0 0 7 5 2 0 3.6
Percent of Total
0% 0% 50% 36% 14% 0%
c. Aware of impact of personal values and beliefs 0 0 5 8 1 0 3.7
Percent of Total
0% 0% 36% 57% 7% 0%
d. Engages in problem solving to address problem situations
0 0 4 6 0 4 3.6
Percent of Total
0% 0% 29% 43% 0% 29%
Year 1 Candidate Ethical Responsibility
Item Poor (1)
Below Standard (2)
Standard (3)
Above Standard
(4)
Outstanding (5)
Not Observed
Rating Average
a. Demonstrates knowledge of ethical guidelines 0 1 9 3 1 0 3.3 (Percent of Total)
0% 7% 64% 21% 7% 0%
b. Applies ethical guidelines to practice 0 1 7 3 1 2 3.3 (Percent of Total)
0% 7% 50% 21% 7% 14%
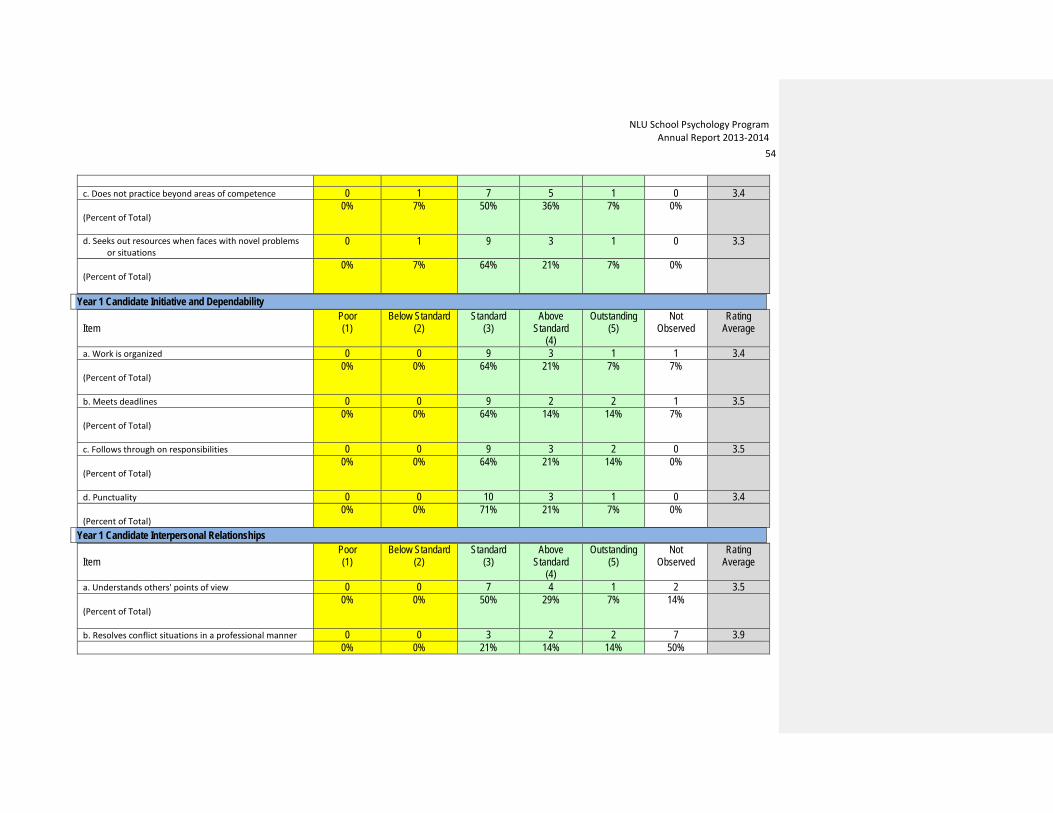
NLU School Psychology Program Annual Report 2013-2014
54
c. Does not practice beyond areas of competence 0 1 7 5 1 0 3.4 (Percent of Total)
0% 7% 50% 36% 7% 0%
d. Seeks out resources when faces with novel problems or situations
0 1 9 3 1 0 3.3
(Percent of Total)
0% 7% 64% 21% 7% 0%
Year 1 Candidate Initiative and Dependability
Item Poor (1)
Below Standard (2)
Standard (3)
Above Standard
(4)
Outstanding (5)
Not Observed
Rating Average
a. Work is organized 0 0 9 3 1 1 3.4 (Percent of Total)
0% 0% 64% 21% 7% 7%
b. Meets deadlines 0 0 9 2 2 1 3.5 (Percent of Total)
0% 0% 64% 14% 14% 7%
c. Follows through on responsibilities 0 0 9 3 2 0 3.5 (Percent of Total)
0% 0% 64% 21% 14% 0%
d. Punctuality 0 0 10 3 1 0 3.4 (Percent of Total)
0% 0% 71% 21% 7% 0%
Year 1 Candidate Interpersonal Relationships
Item Poor (1)
Below Standard (2)
Standard (3)
Above Standard
(4)
Outstanding (5)
Not Observed
Rating Average
a. Understands others' points of view 0 0 7 4 1 2 3.5 (Percent of Total)
0% 0% 50% 29% 7% 14%
b. Resolves conflict situations in a professional manner 0 0 3 2 2 7 3.9 0% 0% 21% 14% 14% 50%

NLU School Psychology Program Annual Report 2013-2014
55
(Percent of Total) c. Exhibits positive relationships with faculty, staff, peers,
clients, and other professionals 0 0 7 4 3 0 3.7
(Percent of Total)
0% 0% 50% 29% 21% 0%
Year 1 Candidate Communication Skills
Item Poor (1)
Below Standard (2)
Standard (3)
Above Standard
(4)
Outstanding (5)
Not Observed
Rating Average
a. Clearly express ideas verbally 0 1 8 5 0 0 3.3 (Percent of Total)
0% 7% 57% 36% 0% 0%
b. Clearly express ideas in writing 0 0 7 5 0 2 3.4 (Percent of Total)
0% 0% 50% 36% 0% 14%
c. Written work is free of errors 0 1 3 5 0 5 3.4 (Percent of Total)
0% 7% 21% 36% 0% 36%
d. Demonstrates appropriate non-verbal behaviors 0 0 8 3 2 1 3.5 (Percent of Total)
0% 0% 57% 21% 14% 7%
Year 1 Candidate Work Completion
Item Poor (1)
Below Standard (2)
Standard (3)
Above Standard
(4)
Outstanding (5)
Not Observed
Rating Average
a. Completes coursework in appropriate time frame 0 0 5 2 0 7 3.3 (Percent of Total)
0% 0% 36% 14% 0% 50%
b. Completes field-based assignments in an appropriate time frame
0 0 9 1 1 3 3.3
(Percent of Total)
0% 0% 64% 7% 7% 21%

NLU School Psychology Program Annual Report 2013-2014
56
c. Quality of class assignments 0 0 3 1 0 10 3.3 (Percent of Total)
0% 0% 21% 7% 0% 71%
d. Quality of field-based work 0 0 7 5 0 2 3.4 (Percent of Total)
0% 0% 50% 36% 0% 14%
Year 1 Candidate Supervision Process
Item Poor (1)
Below Standard (2)
Standard (3)
Above Standard
(4)
Outstanding (5)
Not Observed
Rating Average
a. Prepares for supervision 0 0 8 5 0 1 3.4 (Percent of Total)
0% 0% 57% 36% 0% 7%
b. Accepts feedback constructively 0 0 9 3 2 0 3.5 (Percent of Total)
0% 0% 64% 21% 14% 0%
c. Seeks to resolve issues raised in supervision 0 0 4 2 1 7 3.6 (Percent of Total)
0% 0% 29% 14% 7% 50%
d. Open to professional growth 0 0 6 5 3 0 3.8 (Percent of Total)
0% 0% 43% 36% 21% 0%
Year 1 Candidate Overall Rating
Item Poor (1)
Below Standard (2)
Standard (3)
Above Standard
(4)
Outstanding (5)
Not Observed
Rating Average
a. Overall rating of student 0 0 7 6 1 0 3.6 (Percent of Total)
0% 0% 50% 43% 7% 0%
Year 2 Candidate Professional and Self Awareness
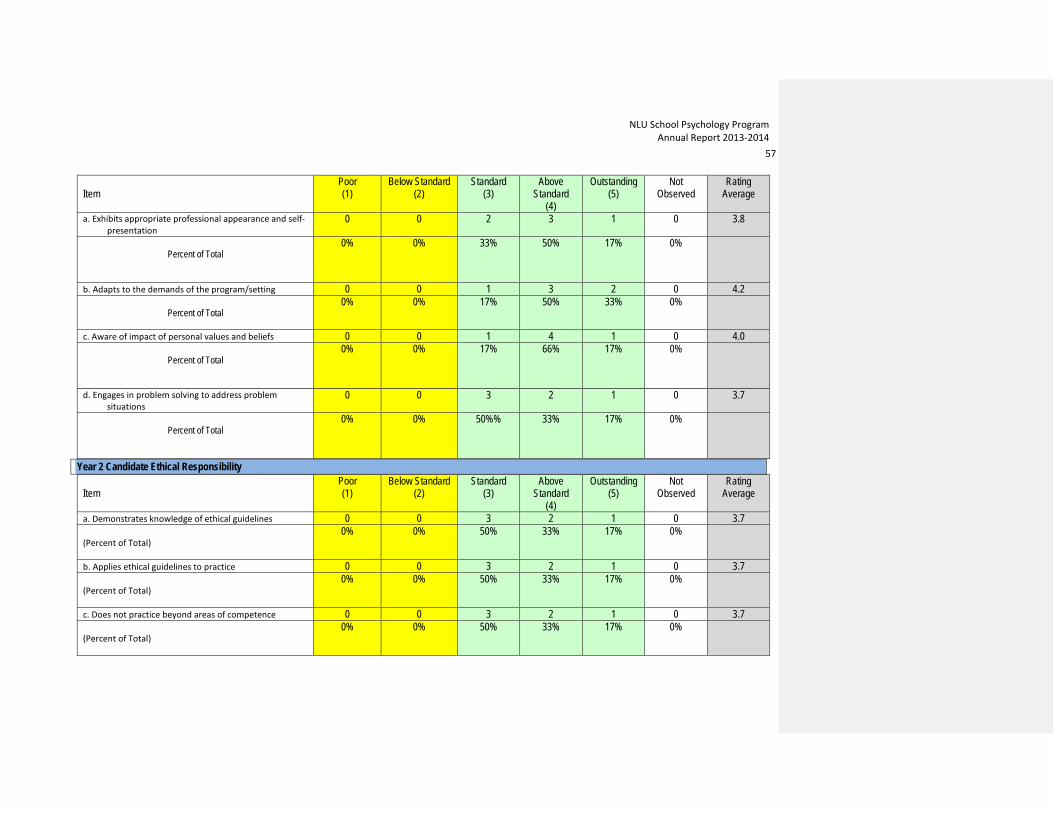
NLU School Psychology Program Annual Report 2013-2014
57
Item
Poor (1)
Below Standard (2)
Standard (3)
Above Standard
(4)
Outstanding (5)
Not Observed
Rating Average
a. Exhibits appropriate professional appearance and self-presentation
0 0 2 3 1 0 3.8
Percent of Total
0% 0% 33% 50% 17% 0%
b. Adapts to the demands of the program/setting 0 0 1 3 2 0 4.2
Percent of Total
0% 0% 17% 50% 33% 0%
c. Aware of impact of personal values and beliefs 0 0 1 4 1 0 4.0
Percent of Total
0% 0% 17% 66% 17% 0%
d. Engages in problem solving to address problem situations
0 0 3 2 1 0 3.7
Percent of Total
0% 0% 50%% 33% 17% 0%
Year 2 Candidate Ethical Responsibility
Item Poor (1)
Below Standard (2)
Standard (3)
Above Standard
(4)
Outstanding (5)
Not Observed
Rating Average
a. Demonstrates knowledge of ethical guidelines 0 0 3 2 1 0 3.7 (Percent of Total)
0% 0% 50% 33% 17% 0%
b. Applies ethical guidelines to practice 0 0 3 2 1 0 3.7 (Percent of Total)
0% 0% 50% 33% 17% 0%
c. Does not practice beyond areas of competence 0 0 3 2 1 0 3.7 (Percent of Total)
0% 0% 50% 33% 17% 0%

NLU School Psychology Program Annual Report 2013-2014
58
d. Seeks out resources when faces with novel problems or situations
0 0 2 3 1 0 3.8
(Percent of Total)
0% 0% 33% 50% 17% 0%
Year 2 Candidate Initiative and Dependability
Item
Poor (1)
Below Standard (2)
Standard (3)
Above Standard
(4)
Outstanding (5)
Not Observed
Rating Average
a. Work is organized 0 0 3 2 1 0 3.7 (Percent of Total)
0% 0% 50% 33% 17% 0%
b. Meets deadlines 0 0 3 2 1 0 3.7 (Percent of Total)
0% 0% 50% 33% 17% 0%
c. Follows through on responsibilities 0 0 3 2 1 0 3.7 (Percent of Total)
0% 0% 50% 33% 17% 0%
d. Punctuality 0 1 2 2 1 0 3.5 (Percent of Total)
0% 17% 33% 33% 17% 0%
Year 2 Candidate Interpersonal Relationships
Item Poor (1)
Below Standard (2)
Standard (3)
Above Standard
(4)
Outstanding (5)
Not Observed
Rating Average
a. Understands others' points of view 0 0 2 3 1 0 3.8 (Percent of Total)
0% 0% 33% 50% 17% 0%
b. Resolves conflict situations in a professional manner 0 0 3 2 1 0 3.7 (Percent of Total)
0% 0% 50% 33% 17% 0%
c. Exhibits positive relationships with faculty, staff, peers, clients, and other professionals
0 1 1 3 1 0 3.7
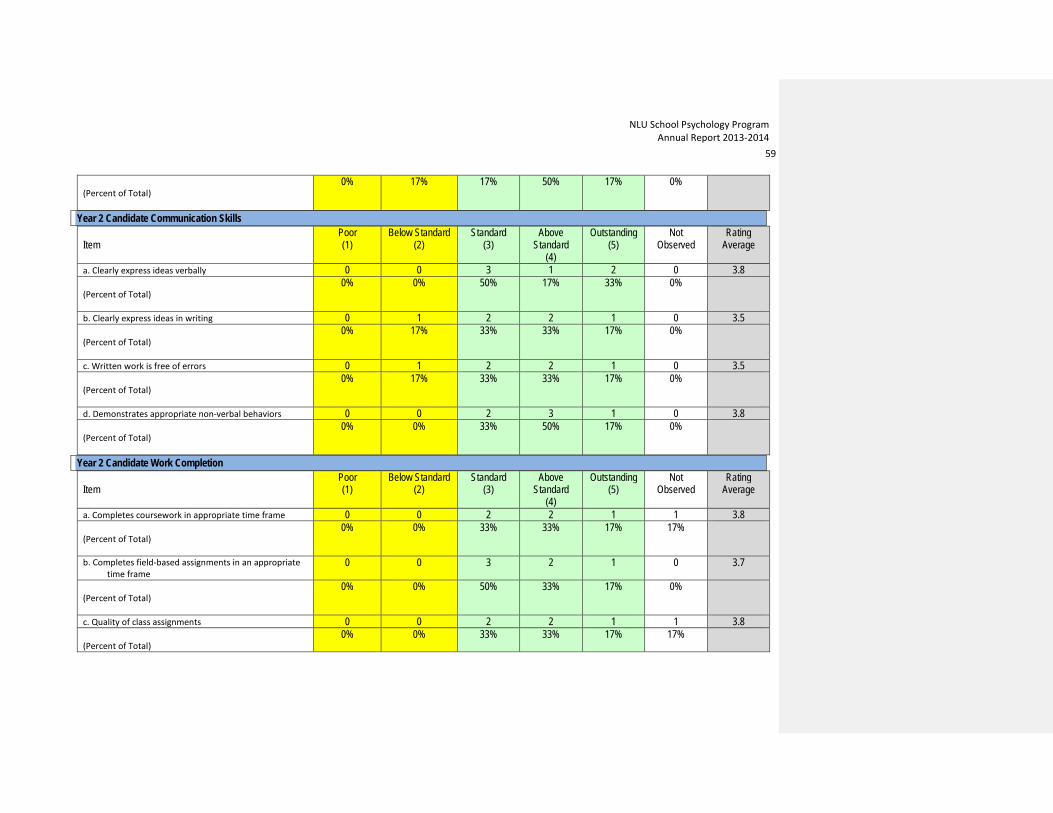
NLU School Psychology Program Annual Report 2013-2014
59
(Percent of Total)
0% 17% 17% 50% 17% 0%
Year 2 Candidate Communication Skills
Item Poor (1)
Below Standard (2)
Standard (3)
Above Standard
(4)
Outstanding (5)
Not Observed
Rating Average
a. Clearly express ideas verbally 0 0 3 1 2 0 3.8 (Percent of Total)
0% 0% 50% 17% 33% 0%
b. Clearly express ideas in writing 0 1 2 2 1 0 3.5 (Percent of Total)
0% 17% 33% 33% 17% 0%
c. Written work is free of errors 0 1 2 2 1 0 3.5 (Percent of Total)
0% 17% 33% 33% 17% 0%
d. Demonstrates appropriate non-verbal behaviors 0 0 2 3 1 0 3.8 (Percent of Total)
0% 0% 33% 50% 17% 0%
Year 2 Candidate Work Completion
Item Poor (1)
Below Standard (2)
Standard (3)
Above Standard
(4)
Outstanding (5)
Not Observed
Rating Average
a. Completes coursework in appropriate time frame 0 0 2 2 1 1 3.8 (Percent of Total)
0% 0% 33% 33% 17% 17%
b. Completes field-based assignments in an appropriate time frame
0 0 3 2 1 0 3.7
(Percent of Total)
0% 0% 50% 33% 17% 0%
c. Quality of class assignments 0 0 2 2 1 1 3.8 (Percent of Total)
0% 0% 33% 33% 17% 17%

NLU School Psychology Program Annual Report 2013-2014
60
d. Quality of field-based work 0 0 3 2 1 0 3.7 (Percent of Total)
0% 0% 50% 33% 17% 0%
Year 2 Candidate Supervision Process
Item Poor (1)
Below Standard (2)
Standard (3)
Above Standard
(4)
Outstanding (5)
Not Observed
Rating Average
a. Prepares for supervision 0 0 3 2 1 0 3.7 (Percent of Total)
0% 0% 50% 33% 17% 0%
b. Accepts feedback constructively 0 0 2 3 1 0 3.8 (Percent of Total)
0% 0% 33% 50% 17% 0%
c. Seeks to resolve issues raised in supervision 0 0 2 3 1 0 3.8 (Percent of Total)
0% 0% 33% 50% 17% 0%
d. Open to professional growth 0 0 2 2 2 0 3.8 (Percent of Total)
0% 0% 33% 33% 33% 0%
Year 2 Candidate Overall Rating
Item Poor (1)
Below Standard (2)
Standard (3)
Above Standard
(4)
Outstanding (5)
Not Observed
Rating Average
a. Overall rating of student 0 0 3 2 1 0 3.7 (Percent of Total)
0% 0% 50% 33% 17% 0%
Year 3 Candidate Professional and Self Awareness
Item Poor (1)
Below Standard (2)
Standard (3)
Above Standard
(4)
Outstanding (5)
Not Observed
Rating Average
a. Exhibits appropriate professional appearance and self-presentation
0 0 3 1 13 0 4.6

NLU School Psychology Program Annual Report 2013-2014
61
Percent of Total
0% 0% 18% 6% 76% 0%
b. Adapts to the demands of the program/setting 0 0 3 3 11 0 4.5
Percent of Total
0% 0% 18% 18% 65% 0%
c. Aware of impact of personal values and beliefs 0 0 3 5 9 0 4.4
Percent of Total
0% 0% 18% 29% 52% 0%
d. Engages in problem solving to address problem situations
0 0 4 1 12 0 4.5
Percent of Total
0% 0% 24% 6% 71% 0%
Year 3 Candidate Ethical Responsibility
Item Poor (1)
Below Standard (2)
Standard (3)
Above Standard
(4)
Outstanding (5)
Not Observed
Rating Average
a. Demonstrates knowledge of ethical guidelines 0 0 3 3 11 0 4.5 (Percent of Total)
0% 0% 18% 18% 65% 0%
b. Applies ethical guidelines to practice 0 0 4 2 11 0 4.4 (Percent of Total)
0% 0% 24% 12% 65% 0%
c. Does not practice beyond areas of competence 0 0 3 3 11 0 4.5 (Percent of Total)
0% 0% 18% 18% 65% 0%
d. Seeks out resources when faces with novel problems or situations
0 0 4 3 10 0 4.4
(Percent of Total)
0% 0% 24% 18% 59% 0%
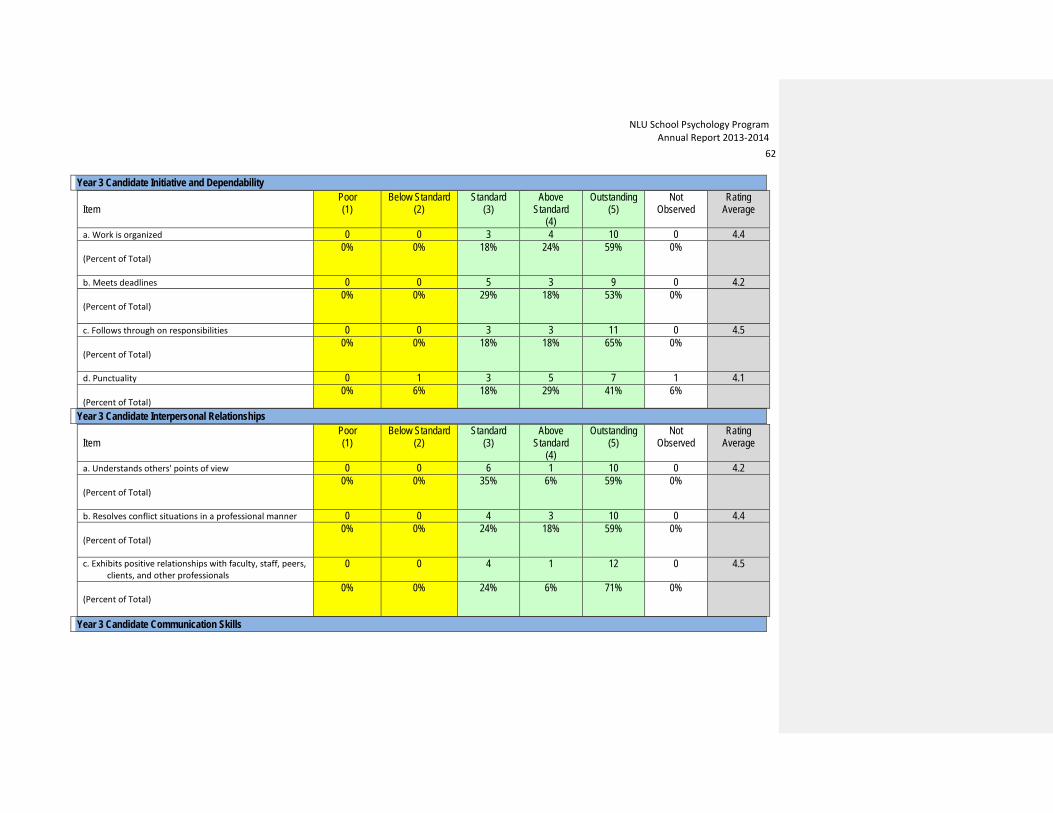
NLU School Psychology Program Annual Report 2013-2014
62
Year 3 Candidate Initiative and Dependability
Item Poor (1)
Below Standard (2)
Standard (3)
Above Standard
(4)
Outstanding (5)
Not Observed
Rating Average
a. Work is organized 0 0 3 4 10 0 4.4 (Percent of Total)
0% 0% 18% 24% 59% 0%
b. Meets deadlines 0 0 5 3 9 0 4.2 (Percent of Total)
0% 0% 29% 18% 53% 0%
c. Follows through on responsibilities 0 0 3 3 11 0 4.5 (Percent of Total)
0% 0% 18% 18% 65% 0%
d. Punctuality 0 1 3 5 7 1 4.1 (Percent of Total)
0% 6% 18% 29% 41% 6%
Year 3 Candidate Interpersonal Relationships
Item Poor (1)
Below Standard (2)
Standard (3)
Above Standard
(4)
Outstanding (5)
Not Observed
Rating Average
a. Understands others' points of view 0 0 6 1 10 0 4.2 (Percent of Total)
0% 0% 35% 6% 59% 0%
b. Resolves conflict situations in a professional manner 0 0 4 3 10 0 4.4 (Percent of Total)
0% 0% 24% 18% 59% 0%
c. Exhibits positive relationships with faculty, staff, peers, clients, and other professionals
0 0 4 1 12 0 4.5
(Percent of Total)
0% 0% 24% 6% 71% 0%
Year 3 Candidate Communication Skills

NLU School Psychology Program Annual Report 2013-2014
63
Item
Poor (1)
Below Standard (2)
Standard (3)
Above Standard
(4)
Outstanding (5)
Not Observed
Rating Average
a. Clearly express ideas verbally 0 0 4 3 10 0 4.4 (Percent of Total)
0% 0% 24% 18% 59% 0%
b. Clearly express ideas in writing 0 0 3 6 8 0 4.3 (Percent of Total)
0% 0% 18% 35% 47% 0%
c. Written work is free of errors 0 0 4 6 7 0 4.2 (Percent of Total)
0% 0% 24% 35% 41% 0%
d. Demonstrates appropriate non-verbal behaviors 0 0 4 3 10 0 4.4 (Percent of Total)
0% 0% 24% 35% 59% 0%
Year 3 Candidate Work Completion
Item Poor (1)
Below Standard (2)
Standard (3)
Above Standard
(4)
Outstanding (5)
Not Observed
Rating Average
a. Completes coursework in appropriate time frame 0 0 5 0 9 3 4.3 (Percent of Total)
0% 0% 29% 0% 53% 18%
b. Completes field-based assignments in an appropriate time frame
0 0 3 2 10 2 4.5
(Percent of Total)
0% 0% 18% 12% 59% 12%
c. Quality of class assignments 0 0 2 2 5 8 4.3 (Percent of Total)
0% 0% 12% 12% 29% 47%
d. Quality of field-based work 0 0 2 3 11 1 4.6 (Percent of Total)
0% 0% 12% 18% 65% 6%
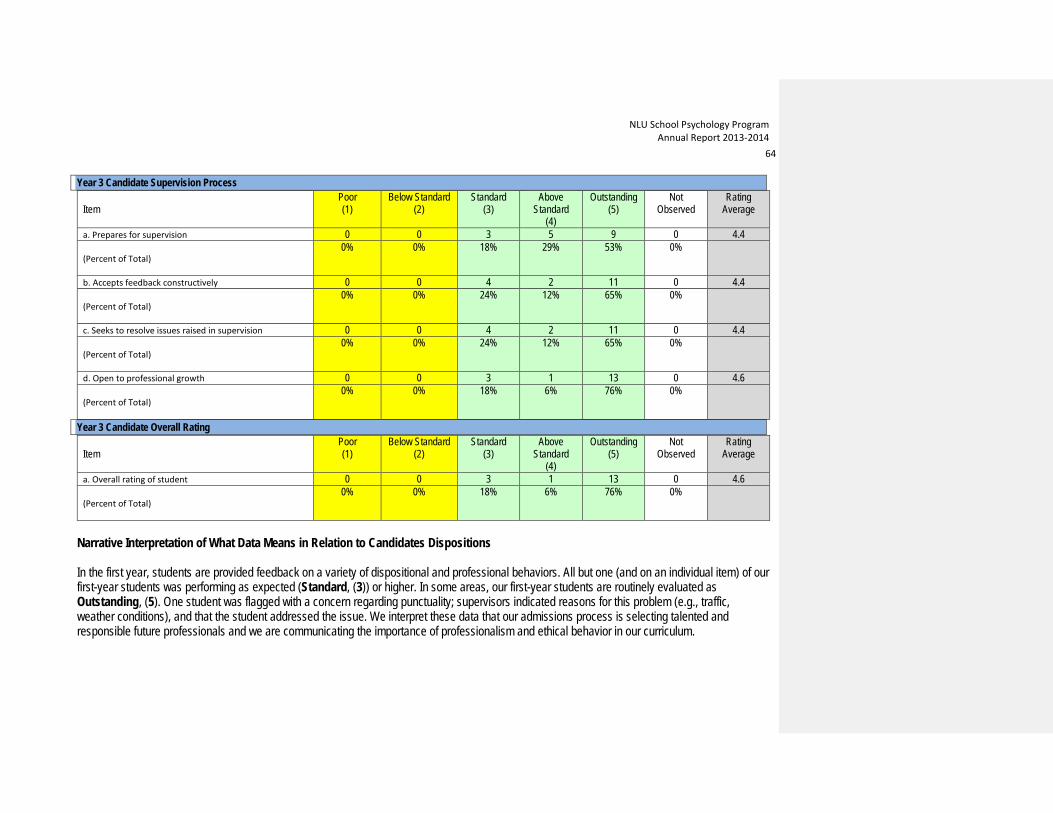
NLU School Psychology Program Annual Report 2013-2014
64
Year 3 Candidate Supervision Process
Item Poor (1)
Below Standard (2)
Standard (3)
Above Standard
(4)
Outstanding (5)
Not Observed
Rating Average
a. Prepares for supervision 0 0 3 5 9 0 4.4 (Percent of Total)
0% 0% 18% 29% 53% 0%
b. Accepts feedback constructively 0 0 4 2 11 0 4.4 (Percent of Total)
0% 0% 24% 12% 65% 0%
c. Seeks to resolve issues raised in supervision 0 0 4 2 11 0 4.4 (Percent of Total)
0% 0% 24% 12% 65% 0%
d. Open to professional growth 0 0 3 1 13 0 4.6 (Percent of Total)
0% 0% 18% 6% 76% 0%
Year 3 Candidate Overall Rating
Item Poor (1)
Below Standard (2)
Standard (3)
Above Standard
(4)
Outstanding (5)
Not Observed
Rating Average
a. Overall rating of student 0 0 3 1 13 0 4.6 (Percent of Total)
0% 0% 18% 6% 76% 0%
Narrative Interpretation of What Data Means in Relation to Candidates Dispositions In the first year, students are provided feedback on a variety of dispositional and professional behaviors. All but one (and on an individual item) of our first-year students was performing as expected (Standard, (3)) or higher. In some areas, our first-year students are routinely evaluated as Outstanding, (5). One student was flagged with a concern regarding punctuality; supervisors indicated reasons for this problem (e.g., traffic, weather conditions), and that the student addressed the issue. We interpret these data that our admissions process is selecting talented and responsible future professionals and we are communicating the importance of professionalism and ethical behavior in our curriculum.

NLU School Psychology Program Annual Report 2013-2014
65
Our second-year students were generally rated as meeting the Standard or exceeding standards. We interpret these data that our admissions process is selecting talented and responsible future professionals and we are communicating the importance of professionalism and ethical behavior in our curriculum. Two students were rated below standard on either or both of these items: Meets deadlines; Follows through on responsibilities; Punctuality; Clearly express ideas verbally. These issues were addressed by the faculty via a remediation plan, and proactive planning prior to the students’ beginning their school psychology internships. By the end of their full-time, school-based internship the vast majority of our third-year students are rated as Outstanding in their professional dispositions and behavior. We interpret these data that our admissions process is selecting talented and responsible future professionals and we are communicating the importance of professionalism and ethical behavior in our curriculum.

NLU School Psychology Program Annual Report 2013-2014
66
G. Assessment of Candidate Diversity Proficiencies Candidates’ proficiencies in the area of Diversity is assessed from selected relevant items from the Additional data on Content Knowledge is provided by ISBE certified school psychologists FES at prescribed intervals and frequencies based on the student’s year in the program. Year 1 students are evaluated once at the end of the year. Year 2 and Year 3 students are evaluated twice, at mid-year and the end-of the –year. Students are rated based on observation and reports received from others (i.e., staff, parents, students). In situations where a student has more than one supervisor, they may complete separate surveys as a team.
The FES was adapted from materials in: Harvey, V.S., & Struzziero, J. (2008). Professional development and supervision of school psychologists: From intern to expert (2nd ed.). Bethesda, MD: Corwin Press and NASP.
Rubric or Scoring Guide
See Assessment B for descriptions of the frequency of administration and the scoring rubric.
Table 16. Candidate Field Supervisors’ Ratings of Diversity Proficiencies by Year in the Program according to FES Data (Year 1 data
for 16 candidates; Year 2 data for 9 candidates; Year 3 data for 17 candidates).
Year 1 Candidate Multicultural/Diversity
Item Poor (1)
Below Standard (2)
Standard (3)
Above Standard
(4)
Outstanding (5)
Not Observed
Rating Average
a. Possesses adequate knowledge base regarding age, race, ethnicity, gender, disability, sexual orientation, and culture
0 0 8 4 2 2 3.6
(Percent of Total)
0% 0% 50% 25% 13% 13%
b. Understands how race, ethnicity and culture may affect client behaviors and attitudes
0 0 7 5 1 3 3.5
(Percent of Total)
0% 0% 44% 31% 6% 19%
c. Uses culturally appropriate assessment and intervention methods
0 0 5 2 0 9 3.3
0% 0% 31% 13% 0% 56%
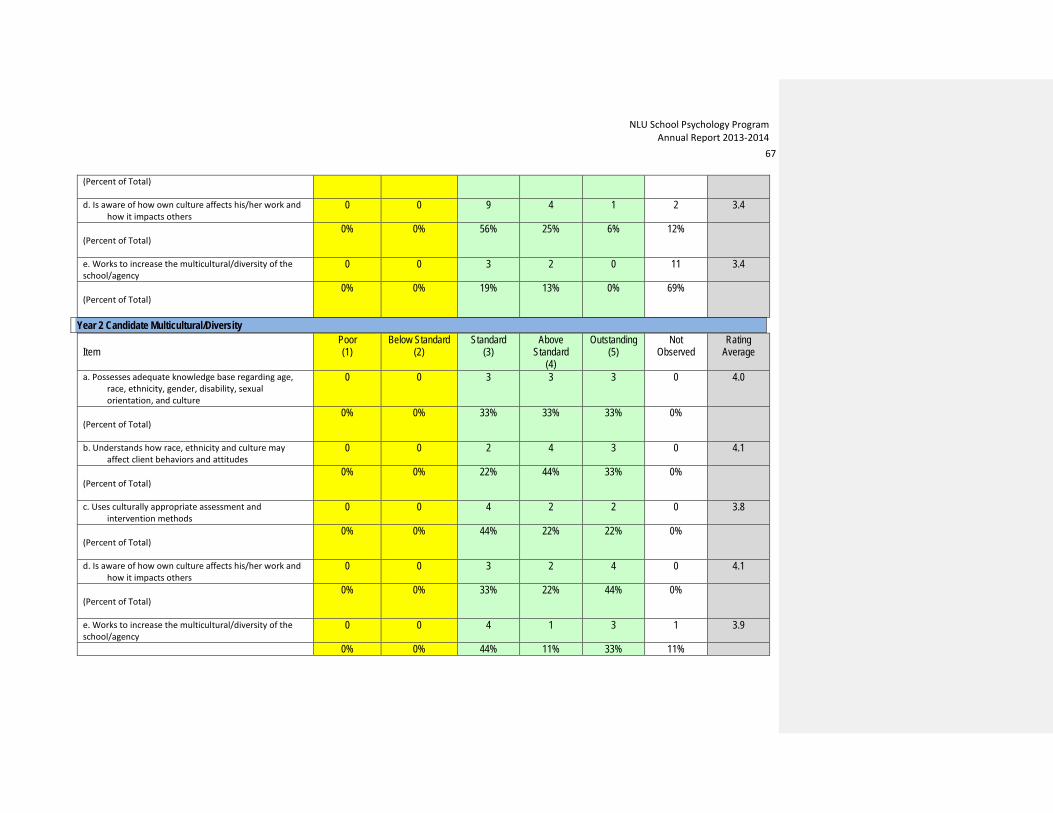
NLU School Psychology Program Annual Report 2013-2014
67
(Percent of Total) d. Is aware of how own culture affects his/her work and
how it impacts others 0 0 9 4 1 2 3.4
(Percent of Total)
0% 0% 56% 25% 6% 12%
e. Works to increase the multicultural/diversity of the school/agency
0 0 3 2 0 11 3.4
(Percent of Total)
0% 0% 19% 13% 0% 69%
Year 2 Candidate Multicultural/Diversity
Item Poor (1)
Below Standard (2)
Standard (3)
Above Standard
(4)
Outstanding (5)
Not Observed
Rating Average
a. Possesses adequate knowledge base regarding age, race, ethnicity, gender, disability, sexual orientation, and culture
0 0 3 3 3 0 4.0
(Percent of Total)
0% 0% 33% 33% 33% 0%
b. Understands how race, ethnicity and culture may affect client behaviors and attitudes
0 0 2 4 3 0 4.1
(Percent of Total)
0% 0% 22% 44% 33% 0%
c. Uses culturally appropriate assessment and intervention methods
0 0 4 2 2 0 3.8
(Percent of Total)
0% 0% 44% 22% 22% 0%
d. Is aware of how own culture affects his/her work and how it impacts others
0 0 3 2 4 0 4.1
(Percent of Total)
0% 0% 33% 22% 44% 0%
e. Works to increase the multicultural/diversity of the school/agency
0 0 4 1 3 1 3.9
0% 0% 44% 11% 33% 11%

NLU School Psychology Program Annual Report 2013-2014
68
(Percent of Total)
Year 3 Candidate Multicultural/Diversity
Item
Poor (1)
Below Standard (2)
Standard (3)
Above Standard
(4)
Outstanding (5)
Not Observed
Rating Average
a. Possesses adequate knowledge base regarding age, race, ethnicity, gender, disability, sexual orientation, and culture
0 0 3 4 10 0 4.4
(Percent of Total)
0% 0% 18% 24% 59% 0%
b. Understands how race, ethnicity and culture may affect client behaviors and attitudes
0 0 3 4 10 0 4.4
(Percent of Total)
0% 0% 18% 24% 59% 0%
c. Uses culturally appropriate assessment and intervention methods
0 0 3 4 10 0 4.4
(Percent of Total)
0% 0% 18% 24% 59% 0%
d. Is aware of how own culture affects his/her work and how it impacts others
0 0 4 3 9 1 4.3
(Percent of Total)
0% 0% 24% 18% 53% 6%
e. Works to increase the multicultural/diversity of the school/agency
0 0 3 4 8 2 4.3
(Percent of Total)
0% 0% 18% 24% 47% 12%
Narrative Interpretation of What Data Means in Relation to Candidates’ Diversity Proficiencies Across all 3 years of the program, students engage in professional behavior indicative of careful attention to and knowledge of individual differences. All students meet standards and by their third year, and typically half or more are rated as outstanding in this domain. We interpret these data that

NLU School Psychology Program Annual Report 2013-2014
69
our admissions process is selecting talented and responsible future professionals and that programmatically, we are communicating the importance of diversity and culture in our curriculum. H. Assessment of Candidate Technology Proficiencies Candidates’ proficiencies in using technologies appropriate to the role of the school psychologist are evaluation through selected items from the FES.
Rubric or Scoring Guide
See Assessment B for descriptions of the frequency of administration and the scoring rubric.
Table 17. Candidates’ Field Supervisors’ Ratings of Technology Proficiencies by Year in the School Psychology Program according to FES Data (Year 1 data for 16 candidates; Year 2 data for 9 candidates; Year 3 data for 17 candidates) Year 1 Candidate Information Technology
Item
Poor (1)
Below Standard (2)
Standard (3)
Above Standard
(4)
Outstanding (5)
Not Observed
Rating Average
a. Demonstrates Knowledge of Information Resources 0 0 7 4 3 2 3.7 (Percent of Total)
0% 0% 44% 25% 19% 13%
b. Uses technology to safeguard and enhance quality of services
0 0 5 4 1 6 3.6
(Percent of Total)
0% 0% 31% 25% 6% 38%
Year 2 Candidate Multicultural/Diversity
Item
Poor (1)
Below Standard (2)
Standard (3)
Above Standard
(4)
Outstanding (5)
Not Observed
Rating Average
a. Demonstrates Knowledge of Information Resources 0 0 3 1 4 1 4.1 0% 0% 33% 11% 44% 11%

NLU School Psychology Program Annual Report 2013-2014
70
(Percent of Total) b. Uses technology to safeguard and enhance quality of
services 0 0 4 1 3 1 3.9
(Percent of Total)
0% 0% 44% 11% 33% 11%
Year 3 Candidate Multicultural/Diversity
Item
Poor (1)
Below Standard (2)
Standard (3)
Above Standard
(4)
Outstanding (5)
Not Observed
Rating Average
a. Demonstrates Knowledge of Information Resources 0 0 4 3 10 0 4.4 (Percent of Total)
0% 0% 24% 18% 59% 0%
b. Uses technology to safeguard and enhance quality of services
0 0 5 2 10 0 4.3
(Percent of Total)
0% 0% 29% 12% 59% 0%
Narrative Interpretation of What Data Means in Relation to Candidates’ Technology Proficiencies Across all 3 years of the program, all students are rated as meeting or exceeding standards in Technology Proficiencies. All students meet standards and by their third year, more than half are rated as outstanding in this domain. We interpret these data that our active instruction and modeling of technology use, plus related assignments and feedback are producing candidates with strong competencies in this area. Section V: Use of Assessment Results to Improve Candidate and Program Performance As we explained in the beginning of our report, the School Psychology program completed a curriculum revision 4 years ago and our two cohorts that entered into the revised program have graduated. We redesigned our major assessment tools in line with this revision and made major changes in our Livetext Portfolio instructions to support clarity. The our revised tools were “cross walked: by students this past Spring to reduce redundancy and address consistency with NCE Dispositions.
NLU School Psychology Program Annual Report 2013-2014
71
In addition to the sections in this report directly linked to the evaluation areas of concern with respect to how we interpreted and used specific information, we are providing a more summative analysis. We highlight the key ways in which we were able to use assessment data to support candidates and to review our program:
Use of data for student support • We review assessment data midyear (including the field competency data and professional behavior data) with on-site or telephone/internet
meetings with supervisors to support increased formative evaluation. • Several candidates received unsatisfactory ratings on their end of the year S3P portfolios last year. In these instances, the candidates met
with their advisors and received feedback and guidance with respect to the portfolio expectations. These data speak for the need for increased instruction with respect to critical thinking regarding course goals and big ideas.
Use of data for program improvement • In previous candidate progress reviews, we recognized that they needed increased practice and support with professional writing. We
designed the portfolio narrative rubric with this in mind. Faculty is also requiring candidates to write more in their courses to provide more opportunities to practice professional/scholarly writing (i.e., integrating theory and research literature with observations and evidence from the field).
• Faculty continue to incorporate more formative assessments (including tests and quizzes) into courses to monitor candidates’ progress with assigned readings, their comprehension of the big ideas, and their ability to use these ideas in practice contexts.
• The format and content of the internship seminar was changed again based on candidate feedback to provide them with targeted, individual assignments related to practice.
• As discussed earlier, changes in EPS 532 Cognitive Assessment were made to increase content knowledge especially consequential validity and test (mis)use instead of focusing exclusively on administration and scoring of multiple cognitive tests.
Recommendations for further Discussion in the Program • In the re-design of the program, faculty made great strides in linking sets of courses around big ideas and core practices. This work should
continue to further differentiate what each course contributes and how the courses interact to reinforce student learning. Collaborative examination of the candidate portfolio artifacts may prove informative to these efforts. We were disappointed in our failure to secure our top candidate for our 4th full time faculty member, but we will continue those efforts. We also would like to continue to pursue a “value-added” doctoral degree by submitting a proposal to ISBE to offer the Special Education Director endorsement.

NLU School Psychology Program Annual Report 2013-2014
72
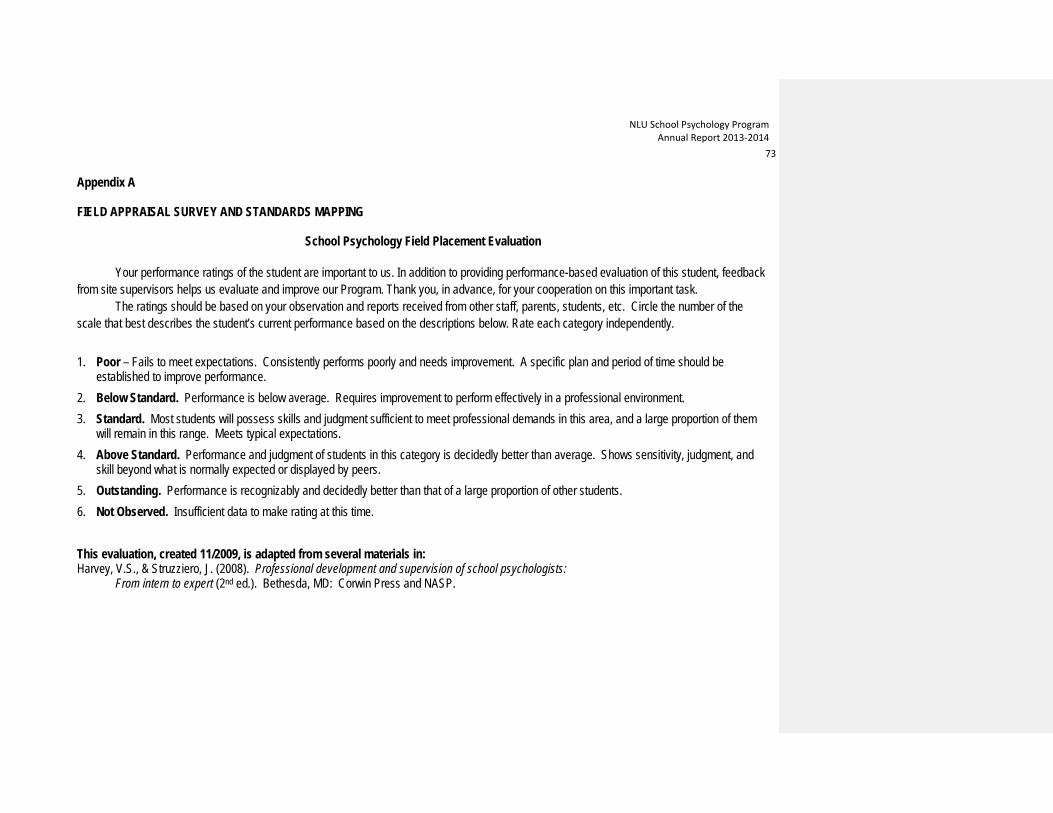
NLU School Psychology Program Annual Report 2013-2014
73
Appendix A FIELD APPRAISAL SURVEY AND STANDARDS MAPPING
School Psychology Field Placement Evaluation
Your performance ratings of the student are important to us. In addition to providing performance-based evaluation of this student, feedback from site supervisors helps us evaluate and improve our Program. Thank you, in advance, for your cooperation on this important task. The ratings should be based on your observation and reports received from other staff, parents, students, etc. Circle the number of the scale that best describes the student’s current performance based on the descriptions below. Rate each category independently. 1. Poor – Fails to meet expectations. Consistently performs poorly and needs improvement. A specific plan and period of time should be
established to improve performance. 2. Below Standard. Performance is below average. Requires improvement to perform effectively in a professional environment. 3. Standard. Most students will possess skills and judgment sufficient to meet professional demands in this area, and a large proportion of them
will remain in this range. Meets typical expectations. 4. Above Standard. Performance and judgment of students in this category is decidedly better than average. Shows sensitivity, judgment, and
skill beyond what is normally expected or displayed by peers. 5. Outstanding. Performance is recognizably and decidedly better than that of a large proportion of other students. 6. Not Observed. Insufficient data to make rating at this time. This evaluation, created 11/2009, is adapted from several materials in: Harvey, V.S., & Struzziero, J. (2008). Professional development and supervision of school psychologists: From intern to expert (2nd ed.). Bethesda, MD: Corwin Press and NASP.
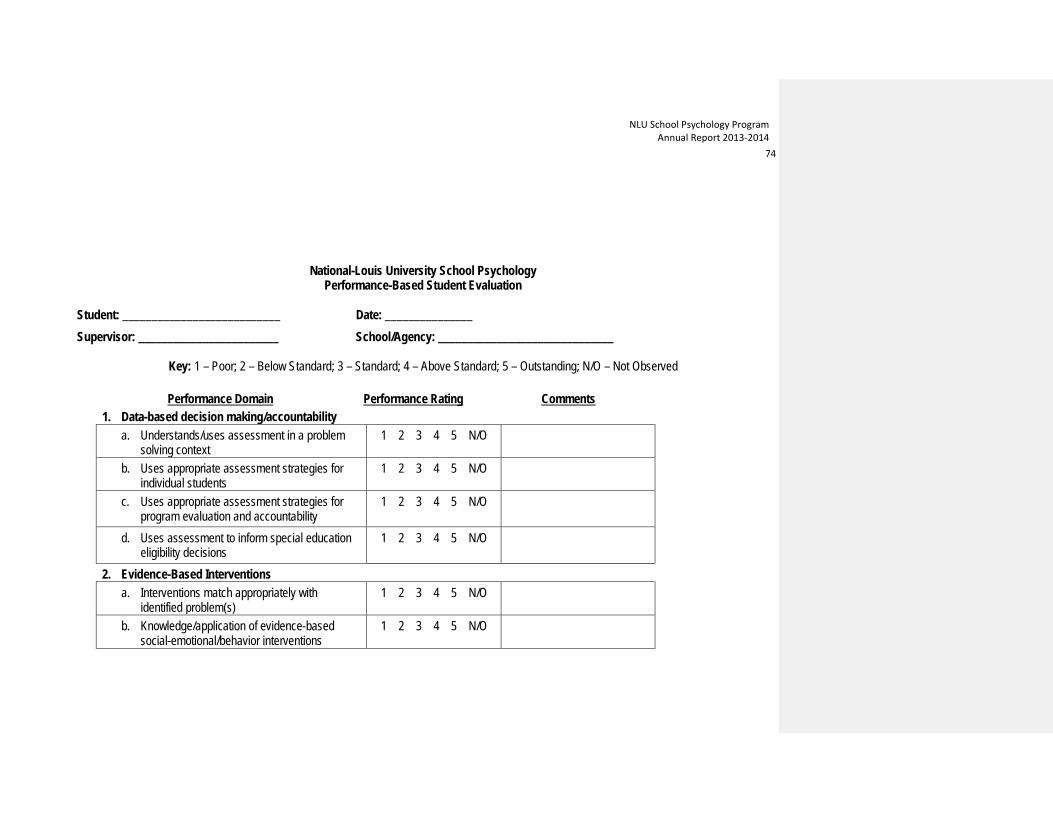
NLU School Psychology Program Annual Report 2013-2014
74
National-Louis University School Psychology Performance-Based Student Evaluation
Student: ___________________________ Date: _______________ Supervisor: ________________________ School/Agency: ______________________________
Key: 1 – Poor; 2 – Below Standard; 3 – Standard; 4 – Above Standard; 5 – Outstanding; N/O – Not Observed
Performance Domain Performance Rating Comments 1. Data-based decision making/accountability
a. Understands/uses assessment in a problem solving context
1 2 3 4 5 N/O
b. Uses appropriate assessment strategies for individual students
1 2 3 4 5 N/O
c. Uses appropriate assessment strategies for program evaluation and accountability
1 2 3 4 5 N/O
d. Uses assessment to inform special education eligibility decisions
1 2 3 4 5 N/O
2. Evidence-Based Interventions a. Interventions match appropriately with
identified problem(s) 1 2 3 4 5 N/O
b. Knowledge/application of evidence-based social-emotional/behavior interventions
1 2 3 4 5 N/O
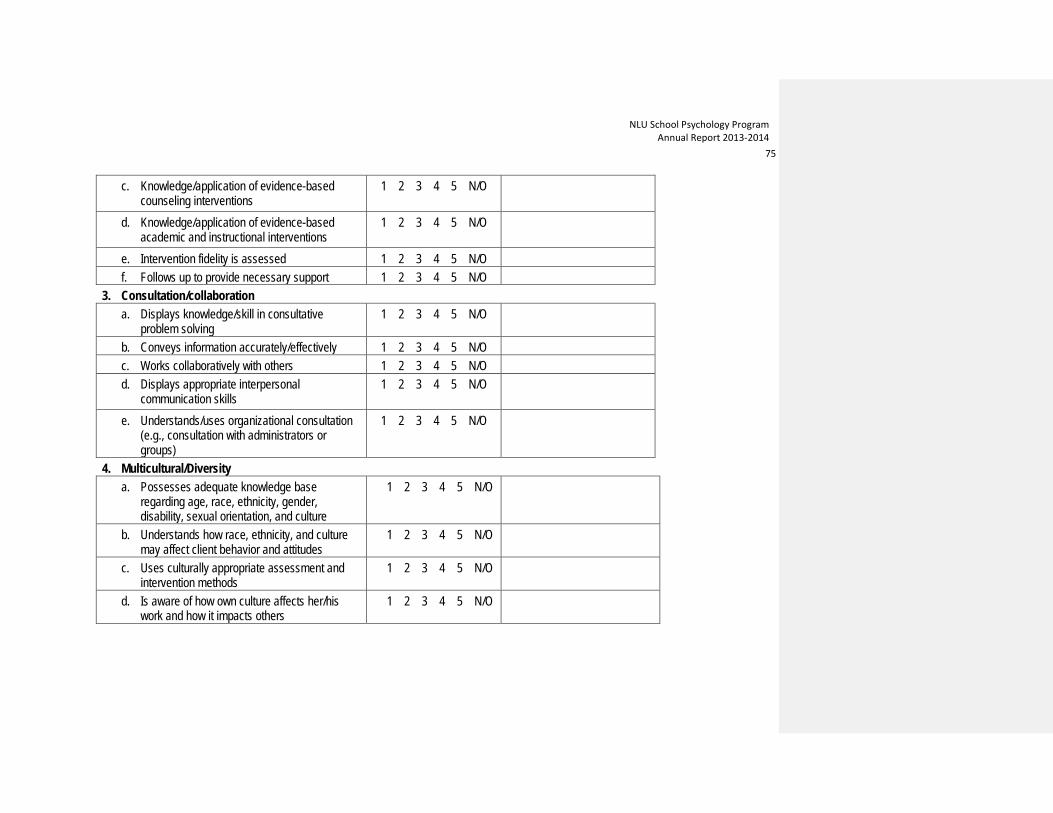
NLU School Psychology Program Annual Report 2013-2014
75
c. Knowledge/application of evidence-based counseling interventions
1 2 3 4 5 N/O
d. Knowledge/application of evidence-based academic and instructional interventions
1 2 3 4 5 N/O
e. Intervention fidelity is assessed 1 2 3 4 5 N/O f. Follows up to provide necessary support 1 2 3 4 5 N/O
3. Consultation/collaboration a. Displays knowledge/skill in consultative
problem solving 1 2 3 4 5 N/O
b. Conveys information accurately/effectively 1 2 3 4 5 N/O c. Works collaboratively with others 1 2 3 4 5 N/O d. Displays appropriate interpersonal
communication skills 1 2 3 4 5 N/O
e. Understands/uses organizational consultation (e.g., consultation with administrators or groups)
1 2 3 4 5 N/O
4. Multicultural/Diversity a. Possesses adequate knowledge base
regarding age, race, ethnicity, gender, disability, sexual orientation, and culture
1 2 3 4 5 N/O
b. Understands how race, ethnicity, and culture may affect client behavior and attitudes
1 2 3 4 5 N/O
c. Uses culturally appropriate assessment and intervention methods
1 2 3 4 5 N/O
d. Is aware of how own culture affects her/his work and how it impacts others
1 2 3 4 5 N/O
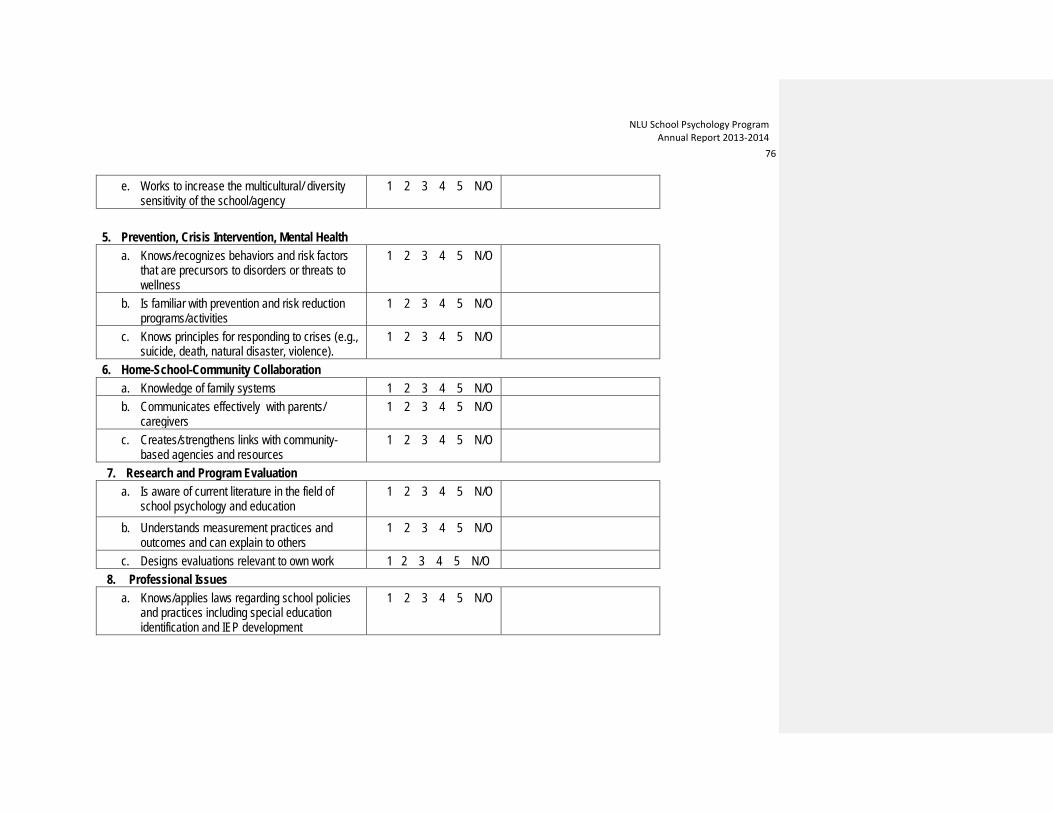
NLU School Psychology Program Annual Report 2013-2014
76
e. Works to increase the multicultural/ diversity sensitivity of the school/agency
1 2 3 4 5 N/O
5. Prevention, Crisis Intervention, Mental Health
a. Knows/recognizes behaviors and risk factors that are precursors to disorders or threats to wellness
1 2 3 4 5 N/O
b. Is familiar with prevention and risk reduction programs/activities
1 2 3 4 5 N/O
c. Knows principles for responding to crises (e.g., suicide, death, natural disaster, violence).
1 2 3 4 5 N/O
6. Home-School-Community Collaboration a. Knowledge of family systems 1 2 3 4 5 N/O b. Communicates effectively with parents/
caregivers 1 2 3 4 5 N/O
c. Creates/strengthens links with community-based agencies and resources
1 2 3 4 5 N/O
7. Research and Program Evaluation a. Is aware of current literature in the field of
school psychology and education 1 2 3 4 5 N/O
b. Understands measurement practices and outcomes and can explain to others
1 2 3 4 5 N/O
c. Designs evaluations relevant to own work 1 2 3 4 5 N/O 8. Professional Issues
a. Knows/applies laws regarding school policies and practices including special education identification and IEP development
1 2 3 4 5 N/O

NLU School Psychology Program Annual Report 2013-2014
77
b. Knows/applies legal and ethical standards in professional practice
1 2 3 4 5 N/O
c. Demonstrates professional behavior in his or her work
1 2 3 4 5 N/O
d. Participates in professional development activities
1 2 3 4 5 N/O
9. Information Technology a. Demonstrates knowledge of information
resources 1 2 3 4 5 N/O
b. Uses technology to safeguard and enhance quality of services
1 2 3 4 5 N/O
10. Supervision a. Prepares for supervision 1 2 3 4 5 N/O b. Exhibits appropriate levels of independence 1 2 3 4 5 N/O c. Prioritizes own needs for support 1 2 3 4 5 N/O d. Uses supervision time productively 1 2 3 4 5 N/O
Overall Rating of Student: 1 2 3 4 5 N/O General Comments:
Convergence of this Evaluation and the 11 NASP Domains
1. Data-based Decision Making and Accountability:
• 1a: Understands/uses assessment in a problem-solving context • 1b: Uses appropriate assessment strategies for individual students • 1c: Uses appropriate assessment strategies for program evaluation and accountability • 1d: Uses assessment to make special education eligibility decisions

NLU School Psychology Program Annual Report 2013-2014
78
2. Consultation and Collaboration • 3a: Displays knowledge/skill in consultative problem solving • 3b: Conveys information accurately/effectively • 3c: Works collaboratively with others • 3d: Displays appropriate interpersonal communication skills • 3e: Understands/uses organizational consultation
3. Effective Instruction and Development of Cognitive and Academic Skills
• 2a: Interventions match appropriately with identified problem(s) • 2d: Knowledge/application of evidence-based academic and instructional interventions • 2e: Intervention fidelity is assessed • 2f: Follows up to provide necessary support
4. Socialization and Development of Life Competencies
• 2a: Interventions match appropriately with identified problem(s) • 2b: Knowledge/application of evidence-based social-emotional/behavioral interventions • 2e: Intervention fidelity is assessed • 2f: Follows up to provide necessary support
5. Student Diversity in Development and Learning
• 4a: Possesses adequate knowledge base regarding age, race, ethnicity, gender, disability, sexual orientation, & culture • 4b: Understands how race, ethnicity, & culture may affect client behavior and attitudes • 4c: Uses culturally appropriate assessment & intervention methods • 4d: Is aware of how own culture affects her/his work and how it impacts others • 4e: Works to increase the multicultural/diversity sensitivity of the school/agency
6. School and Systems Organization, Policy Development, and Climate
• 1a: Understands/uses assessment in a problem-solving context • 1c: Uses appropriate assessment strategies for program evaluation and accountability • 3e: Understands/uses organizational consultation • 4e: Works to increase the multicultural/diversity sensitivity of the school/agency

NLU School Psychology Program Annual Report 2013-2014
79
7. Prevention, Crisis Intervention, and Mental Health
• 2c: Knowledge/application of evidence-based counseling interventions • 5a: Knows/recognizes behaviors and risk factors that are precursors to disorders or threats to wellness • 5b: Is familiar with prevention and risk reduction programs/activities • 5c: Knows principles for responding to crises
8. Home-School Community Collaboration
• 6a: Knowledge of family systems • 6b: Communicates effectively with parents/caregivers • 6c: Creates/strengthens links with community-based agencies and resources
9. Research and Program Evaluation
• 1c: Uses appropriate assessment strategies for program evaluation and accountability • 7a: Is aware of current literature in the field of school psychology and education • 7b: Understands measurement practices and outcomes and can explain to others • 7c: Designs evaluations relevant to own work
10. School Psychology Practice and Professional Development
• 8a: Knows/applies laws regarding school policies and practices including special education identification and IEP development • 8b: Knows/applies legal and ethical standards in professional practice • 8c: Demonstrates professional behavior in his or her work • 8d: Participates in professional development activities • 10a: Prepares for supervision • 10b: Exhibits appropriate levels of independence • 10c: Prioritizes own needs for support • 10d: Uses supervision time productively
11. Information Technology
• 9a: Demonstrates knowledge of information resources • 9b: Uses technology to safeguard and enhance quality of services

NLU School Psychology Program Annual Report 2013-2014
80

NLU School Psychology Program Annual Report 2013-2014
81
APPENDIX D PROFESSIONAL DISPOSITIONS SURVEY
Student Evaluation Form: Professional Dispositions School Psychology Program
The Professional Dispositions evaluation is to be completed for students at the end of the Fall, Winter, and Spring quarters. The purpose is to provide feedback on student progress, identify students’ strengths and weaknesses, and identify activities or procedures that may be considered with students who are not performing up to program/departmental expectations. Please rate the student in those areas for which you have information. Circle the number of the scale that best describes the student’s current performance based on the descriptions below. Each evaluator is encouraged to provide additional comments at the end of this form. Ratings will be discussed with the student. 7. Poor. Fails to meet expectations. Consistently performs poorly and needs improvement. A specific plan and period of time should be established to
improve performance. 8. Below Standard. Performance is below average. Requires improvement to perform effectively in a professional environment. 9. Standard. Meets typical expectations. Most students will possess skills and judgment sufficient to meet professional demands in this area, and a large
proportion of them will remain in this range. 10. Above Standard. Performance and judgment of students in this category is decidedly better than average. Shows sensitivity, judgment, and skill
beyond what is normally expected or displayed by peers. 11. Outstanding. Performance is recognizably and decidedly better than that of a large proportion of other students. 12. Not Observed. Insufficient data to make rating at this time. This evaluation, created August, 2010, is adapted from materials in: Harvey, V.S., & Struzziero, J. (2008). Professional development and supervision of school
psychologists: From intern to expert (2nd ed.). Bethesda, MD: Corwin Press and NASP.
NLU School Psychology Program Annual Report 2013-2014
82
Cruise, T.K. & Swerdlik, M.E. (2010). Problematic behaviors: Mediating differences and negotiating change. In J. Kaufman, T.L. Hughes, & C.A. Riccio (Eds.), Handbook of education, training, and supervision of school psychologists in school and community (Vol. 2). New York: Routledge.

NLU School Psychology Program Annual Report 2013-2014
83
National-Louis University School Psychology Student Evaluation Form: Professional Dispositions
Student: ___________________________ Rater: ___________________ Course: ____________________ Quarter: _______________
Key: 1 – Poor; 2 – Below Standard; 3 – Standard; 4 – Above Standard; 5 – Outstanding; N/O – Not Observed
Dispositional Area Rating Comments 11. Professionalism and Self-awareness
a. Exhibits appropriate professional appearance and self-presentation
1 2 3 4 5 N/O
b. Adapts to the demands of the program/setting 1 2 3 4 5 N/O
c. Aware of impact of personal values and beliefs 1 2 3 4 5 N/O
d. Engages in problem solving to address problem situations 1 2 3 4 5 N/O
12. Ethical Responsibility a. Demonstrates knowledge of ethical guidelines 1 2 3 4 5 N/O
b. Applies ethical guidelines to practice 1 2 3 4 5 N/O
c. Does not practice beyond areas of competence 1 2 3 4 5 N/O
d. Seeks out resources when faced with novel problems or situations
1 2 3 4 5 N/O
3. Initiative and Dependability a. Work is organized 1 2 3 4 5 N/O
b. Meets deadlines 1 2 3 4 5 N/O

NLU School Psychology Program Annual Report 2013-2014
84
c. Follows through on responsibilities 1 2 3 4 5 N/O
d. Punctuality 1 2 3 4 5 N/O 4. Interpersonal Relationships
e. Understands others’ points of view 1 2 3 4 5 N/O
f. Resolves conflict situations in a professional manner 1 2 3 4 5 N/O
g. Exhibits positive relationships with faculty, staff, peers, clients, and other professionals
1 2 3 4 5 N/O
5. Communication Skills a. Clearly express ideas verbally 1 2 3 4 5 N/O
b. Clearly express ideas in writing 1 2 3 4 5 N/O
c. Written work is free of errors 1 2 3 4 5 N/O
d. Demonstrates appropriate non-verbal behaviors 1 2 3 4 5 N/O 6. Respect for Human Diversity
a. Sensitive in working with issues of diversity 1 2 3 4 5 N/O
b. Aware of challenges individual differences pose in the schools 1 2 3 4 5 N/O
7. Completion of Work a. Completes coursework in an appropriate time frame 1 2 3 4 5 N/O
b. Completes field-based assignments in an appropriate time frame 1 2 3 4 5 N/O
c. Quality of class assignments 1 2 3 4 5 N/O
d. Quality of field-based work 1 2 3 4 5 N/O
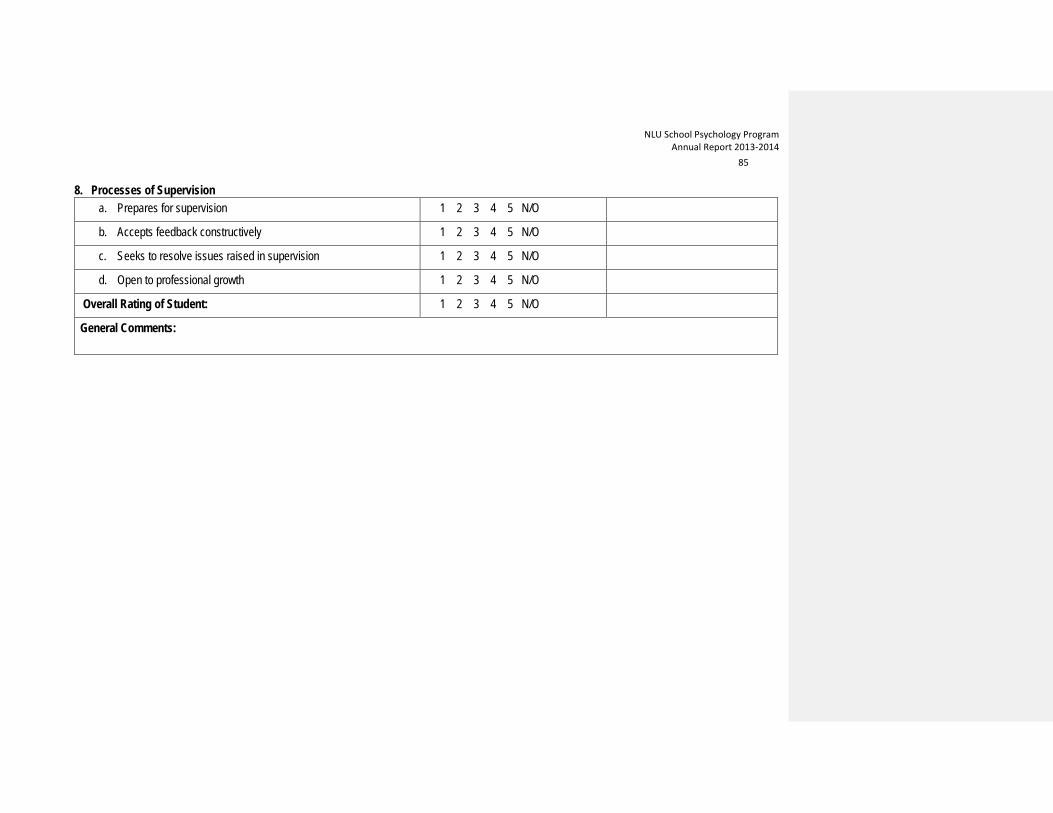
NLU School Psychology Program Annual Report 2013-2014
85
8. Processes of Supervision a. Prepares for supervision 1 2 3 4 5 N/O
b. Accepts feedback constructively 1 2 3 4 5 N/O
c. Seeks to resolve issues raised in supervision 1 2 3 4 5 N/O
d. Open to professional growth 1 2 3 4 5 N/O
Overall Rating of Student: 1 2 3 4 5 N/O
General Comments: