njcat technology verification · contech construction products ... sc.d., p.e., bcee technical ......
TRANSCRIPT

NJCAT TECHNOLOGY VERIFICATION
VORTECHS®
CONTECH CONSTRUCTION PRODUCTS Inc.
April 2011
2
TABLE OF CONTENTS
1. Introduction 5 1.1 NJCAT Program 5 1.2 Interim Certification 6 1.3 Applicant Profile 6 1.4 Key Contacts 7
2. The Vortechs Stormwater Treatment System 7
3. Technology System Evaluation: Project Plan 8
3.1 Introduction 8 3.2 Site and System Description 9 3.3 Sampling Design 11 3.4 Particle Size Distribution and Residual Solids Assessment Methods 13 3.5 Precipitation Measurement 14 3.6 Flow Measurement 16 3.7 Stormwater Data Collection Requirements 16
4. Technology System Performance 17
4.1 Data Analysis 17 4.2 Test Results 27 4.3 System Maintenance and Residual Solids Assessment Results 28 4.4 Summary 32
5. Performance Claim Verification 32
6. Net Environmental Benefit 33
7. References 34
Appendix A: Individual Storm Events 35
3
List of Tables
Table 1 Analytical methods used for analytical parameters of interest 12 Table 2 Instances of contaminated detection in equipment rinsate blank and equipment field blank samples 13 Table 3 Comparison of National Weather Service (NWS) cooperative station in Toms River, NJ rain gage monthly rainfall totals to normal monthly rainfalls 15 Table 4 Rainfall and runoff statistics for sampled events at the WAWA Market Route 37 study site 15 Table 5 Percentage of calculated rainfall volumes measured at the WAWA Market Route 37 study site 16 Table 6 Stormwater data collection requirements results 17 Table 7 Suspended Solids Event Mean Concentrations (EMCs) for the 18 events sampled at the WAWA Market Route 37 study site 18 Table 8 Total Volatile Suspended Solids Event Mean Concentration (EMCs) for the 18 events sampled at the WAWA Market Route 37 study site 19 Table 9 Calculated Parameters (mineral) Event Mean Concentrations (EMCs) for the 18 events sampled at the WAWA Market Route 37 study site 20 Table 10 Calculated percentages of material less than 500 µm and 50 µm for the 18 events sampled at the WAWA Market Route 37 study site……………………………………………..22 Table 11 Calculated percentages of combustible materials that are assumed to be organic in nature for the 18 events sampled at the WAWA Market Route 37 study site…………...………23 Table 12 Suspended Solids Event Sum of Loads (SOL) Efficiency Calculations for the 18 events sampled at the WAWA Market Route 37 study site 24 Table 13 Total Volatile Suspended Solids Event Sum of Loads (SOL) Efficiency Calculations for the 18 events sampled at the WAWA Market Route 37 study site 25 Table 14 Calculated Parameters (mineral) Event Sum of Loads (SOL) Efficiency Calculations for the 18 events sampled at the WAWA Market Route 37 study site 26 Table 15 Particle size distribution analysis results using ASTM D4464 for events sampled at the WAWA Market Route 37 study site 30

4
List of Figures
Figure 1 Standard Vortechs Stormwater Treatment System 8 Figure 2 Aerial view of WAWA Market Route 37 study site 9 Figure 3 View of south parking lot area of WAWA Market Route 37 study site 10 Figure 4 View of west parking lot area of WAWA Market Route 37 study site 10 Figure 5 View of the Mobile Monitoring Unit (MMU) installed at the WAWA Market Route 37
study site 11 Figure 6 Side view of cone splitter apparatus prior to sample splitting using sieves 13 Figure 7 Textural triangle showing particle size analysis of materials captured in the Vortechs system 29
Figure 8 Influent particle size distribution generated using serial filtration covering 6350µm to 1.5µm particle range; dashed line represents mean particle size distribution 30 Figure 9 Influent Particle size distribution generated using serial filtration covering 500µm to 1.5µm particle range; dashed line represents mean particle size distribution 31
Figure 10 Comparison of mean influent and effluent particle size distributions generated using serial filtration covering 6350µm to 1.5µm particle size range 31
Figure 11 Comparison of mean influent and effluent particle size distributions generated using serial filtration covering 500µm to 1.5µm particle size range 32

5
1. Introduction 1.1 New Jersey Corporation for Advanced Technology (NJCAT) Program NJCAT is a not-for-profit corporation to promote in New Jersey the retention and growth of technology-based businesses in emerging fields such as environmental and energy technologies. NJCAT provides innovators with the regulatory, commercial, technological and financial assistance required to bring their ideas to market successfully. Specifically, NJCAT functions to:
Advance policy strategies and regulatory mechanisms to promote technology commercialization;
Identify, evaluate, and recommend specific technologies for which the regulatory and commercialization process should be facilitated;
Facilitate funding and commercial relationships/alliances to bring new technologies to market and new business to the state; and
Assist in the identification of markets and applications for commercialized technologies.
The technology verification program specifically encourages collaboration between vendors and users of technology. Through this program, teams of academic and business professionals are formed to implement a comprehensive evaluation of vendor specific performance claims. Thus, suppliers have the competitive edge of an independent third party confirmation of claims. Pursuant to N.J.S.A. 13:1D-134 et seq. (Energy and Environmental Technology Verification Program) the New Jersey Department of Environmental Protection (NJDEP) and NJCAT have established a Performance Partnership Agreement (PPA) whereby NJCAT performs the technology verification review and NJDEP certifies that the technology meets the regulatory intent and that there is a net beneficial environmental effect of the technology. In addition, NJDEP/NJCAT work in conjunction to develop expedited or more efficient timeframes for review and decision-making of permits or approvals associated with the verified/certified technology. The PPA also requires that: The NJDEP shall enter into reciprocal environmental technology agreements concerning the
evaluation and verification protocols with the United States Environmental Protection Agency, other local required or national environmental agencies, entities or groups in other states and New Jersey for the purpose of encouraging and permitting the reciprocal acceptance of technology data and information concerning the evaluation and verification of energy and environmental technologies; and
The NJDEP shall work closely with the State Treasurer to include in State bid specifications,
as deemed appropriate by the State Treasurer, any technology verified under the Energy and Environment Technology Verification Program.
6
1.2 Interim Certification CONTECH Construction Products Inc. (CONTECH) is a leading provider of innovative, long-term, stormwater treatment solutions, offering a variety of products, maintenance, laboratory, and engineering support to meet stormwater management needs. CONTECH’s patented product, the Vortechs® (Vortechs) System, is a Best Management Practice (BMP) designed to meet federal, state, and local requirements for treating stormwater runoff in compliance with the Clean Water Act. The Vortechs system improves the quality of stormwater runoff before it enters receiving waterways through the use of hydrodynamic separation and settling to provide enhanced solids removal. (See Section 2 for an additional description of the technology.) CONTECH received New Jersey Corporation for Advanced Technology (NJCAT) Verification of the Vortechs System in May of 2004. The NJCAT Verification was used to support a Conditional Interim Certification issued in January of 2005 by the State of New Jersey Department of Environmental Protection (NJDEP). A major condition of this Conditional Interim Certification is the execution of a field evaluation in accordance with the TARP Tier II Stormwater Protocol (TARP, 2003) and the New Jersey Tier II Stormwater Test Requirements (NJDEP, 2006).
1.3 Applicant Profile CONTECH offers a range of stormwater treatment products including filtration, hydrodynamic separation, volumetric separation, detention/retention, screening, oil/water separation, and flow control technologies. A knowledgeable team of 200 professionals across the U.S. provide the engineering and customer service support to determine a project’s most appropriate stormwater treatment system that meets the requirements of the relevant permitting jurisdiction. At CONTECH’s state-of-the-art laboratories, engineers and scientists conduct ongoing research to further the understanding of non-point source pollution and develop practical product solutions. CONTECH helps its customers achieve their water quality goals by providing treatment technologies that remove a variety of pollutants from stormwater runoff. These stormwater treatment products are specifically designed to meet federal, state, and local regulations. Former CONTECH subsidiaries Vortechnics (2004) and Stormwater Management, Inc. (2005) combined to form Stormwater360 (2006), and later became CONTECH Stormwater Solutions, Inc. a division of CONTECH Construction Products Inc. In December 2006, CDS Technologies, Inc. was added into CONTECH’s product offerings. CONTECH has four primary regional offices that service their customers.
Ohio (Headquarters) Maryland 9025 Centre Pointe Drive, Suite 400 521 Progress Drive, Suite H West Chester, OH 45069 Lithicum, MD 21090 800-395-0608 866-740-3318

7
Maine Oregon California 200 Enterprise Drive 11835 NE Glenn Widing Dr 3777 Long Beach Blvd., Suite 400 Scarborough, ME 04074 Portland, OR 97220 Long Beach, CA 90807 207-885-9830 866-400-3180 562-264-0701
Key managers of CONTECH are James Lenhart – Chief Technical Officer, and Frank Birney – Vice President of Stormwater.
1.4 Key Contacts Richard S. Magee, Sc.D., P.E., BCEE Technical Director NJ Corporation for Advanced Technology Center for Environmental Systems Stevens Institute of Technology Castle Point on Hudson Hoboken, NJ 07030 201-216-8081 973-879-3056 cell [email protected]
Jim Lenhart, P.E. Chief Technology Officer CONTECH Construction Products, Inc. 11835 NE Glenn Widing Drive Portland, OR 97220 866-400-3180 [email protected]
Derek Berg Regional Regulatory Manager CONTECH Construction Products, Inc. 200 Enterprise Drive Scarborough, Maine 04074 207-885-9830 [email protected]
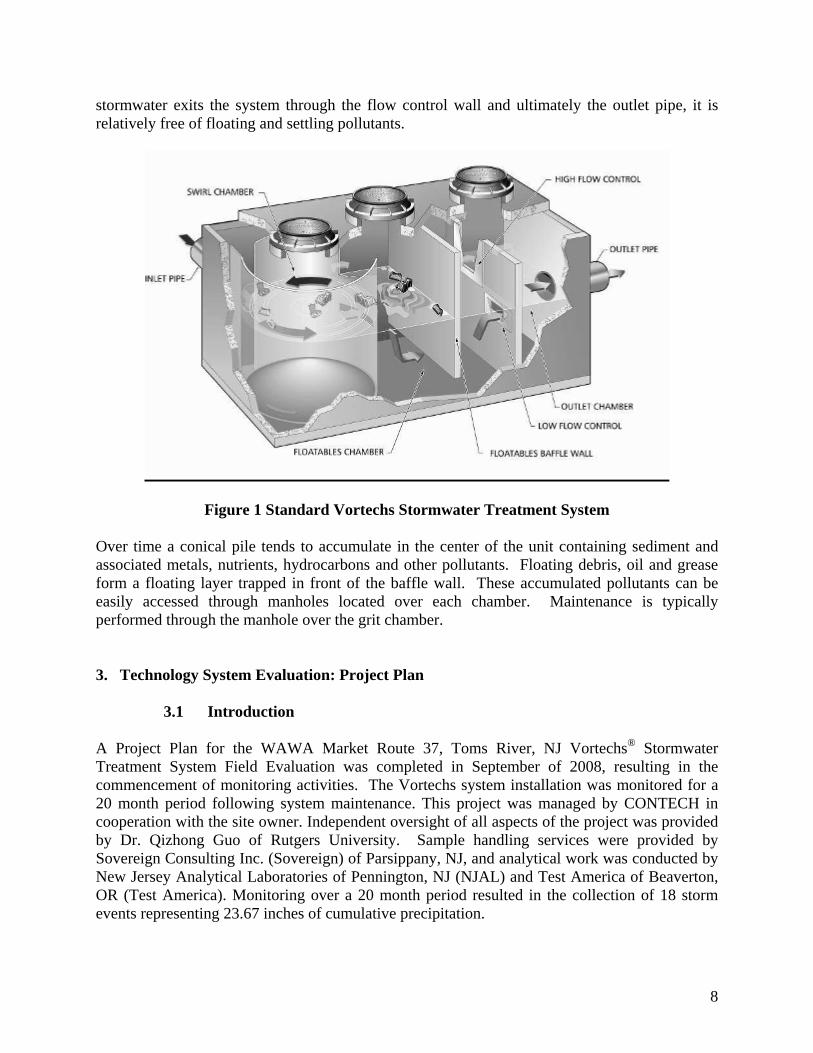
2. The Vortechs Stormwater Treatment System The Vortechs Stormwater Treatment System is a hydrodynamic separator designed to enhance gravitational separation of floating and settling materials from stormwater flows. Each unit has three basic components: 1) a circular grit chamber that promotes a gentle swirling motion of the incoming stormwater, 2) an oil baffle wall, and 3) a flow control wall for controlling high and low flows. An illustration of a standard Vortechs system is shown in Figure 1. Stormwater flows enter the unit tangentially to the grit chamber, which promotes a gentle swirling motion. As stormwater circles the grit chamber, pollutants migrate toward the center of the unit where velocities are the lowest. The majority of settlable solids are left behind as stormwater exits the grit chamber via two apertures on the perimeter of the chamber. Next, buoyant debris, oil and grease are separated from water as it flows under the baffle wall. A final flow control wall ensures optimal performance throughout the full range of system operation while abating turbulence at high flows to protect against resuspension and washout. As
8
stormwater exits the system through the flow control wall and ultimately the outlet pipe, it is relatively free of floating and settling pollutants.
Figure 1 Standard Vortechs Stormwater Treatment System Over time a conical pile tends to accumulate in the center of the unit containing sediment and associated metals, nutrients, hydrocarbons and other pollutants. Floating debris, oil and grease form a floating layer trapped in front of the baffle wall. These accumulated pollutants can be easily accessed through manholes located over each chamber. Maintenance is typically performed through the manhole over the grit chamber. 3. Technology System Evaluation: Project Plan 3.1 Introduction A Project Plan for the WAWA Market Route 37, Toms River, NJ Vortechs® Stormwater Treatment System Field Evaluation was completed in September of 2008, resulting in the commencement of monitoring activities. The Vortechs system installation was monitored for a 20 month period following system maintenance. This project was managed by CONTECH in cooperation with the site owner. Independent oversight of all aspects of the project was provided by Dr. Qizhong Guo of Rutgers University. Sample handling services were provided by Sovereign Consulting Inc. (Sovereign) of Parsippany, NJ, and analytical work was conducted by New Jersey Analytical Laboratories of Pennington, NJ (NJAL) and Test America of Beaverton, OR (Test America). Monitoring over a 20 month period resulted in the collection of 18 storm events representing 23.67 inches of cumulative precipitation.
9
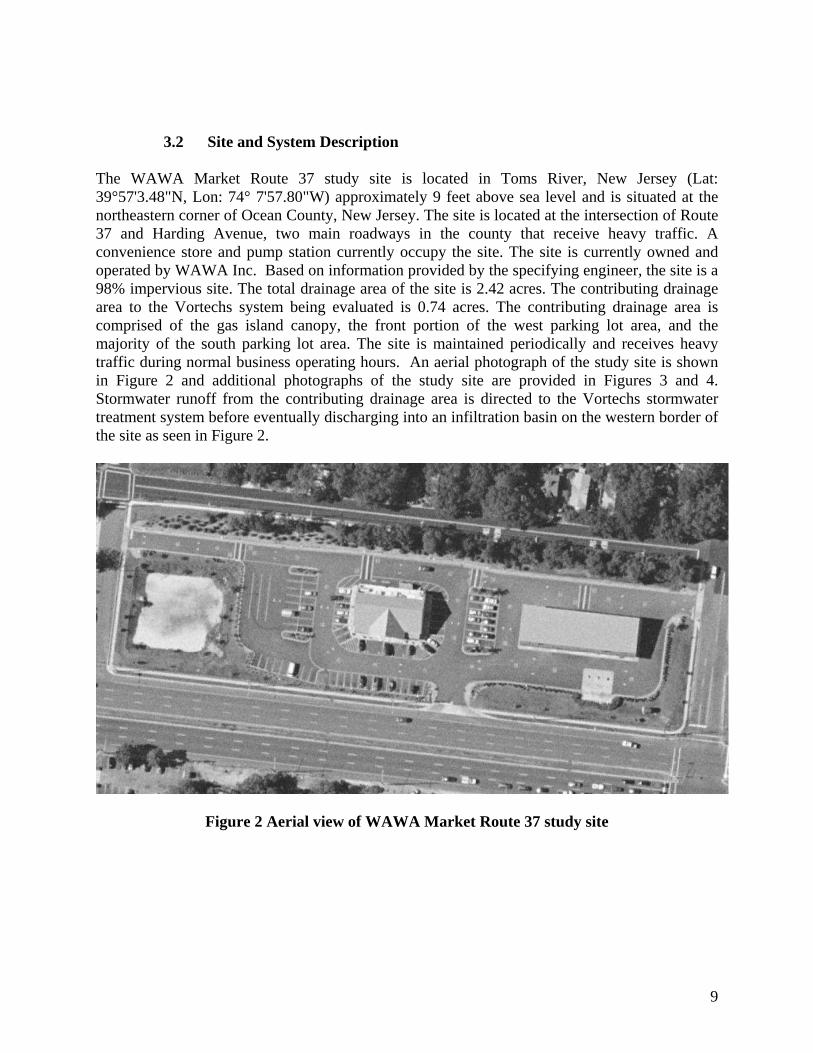
3.2 Site and System Description The WAWA Market Route 37 study site is located in Toms River, New Jersey (Lat: 39°57'3.48"N, Lon: 74° 7'57.80"W) approximately 9 feet above sea level and is situated at the northeastern corner of Ocean County, New Jersey. The site is located at the intersection of Route 37 and Harding Avenue, two main roadways in the county that receive heavy traffic. A convenience store and pump station currently occupy the site. The site is currently owned and operated by WAWA Inc. Based on information provided by the specifying engineer, the site is a 98% impervious site. The total drainage area of the site is 2.42 acres. The contributing drainage area to the Vortechs system being evaluated is 0.74 acres. The contributing drainage area is comprised of the gas island canopy, the front portion of the west parking lot area, and the majority of the south parking lot area. The site is maintained periodically and receives heavy traffic during normal business operating hours. An aerial photograph of the study site is shown in Figure 2 and additional photographs of the study site are provided in Figures 3 and 4. Stormwater runoff from the contributing drainage area is directed to the Vortechs stormwater treatment system before eventually discharging into an infiltration basin on the western border of the site as seen in Figure 2.
Figure 2 Aerial view of WAWA Market Route 37 study site

10
Figure 3 View of south parking lot area of WAWA Market Route 37 study site
Figure 4 View of west parking lot area of WAWA Market Route 37 study site
The Vortechs system is designed in an on-line configuration with respect to the stormwater conveyance pipe system. The Vortechs system is also designed for annual maintenance. The primary source of pollution on this site is expected to be from vehicular traffic. The peak water quality flow rate calculated by CONTECH based on information provided by the specifying

11
engineer for the Vortechs system is 2.13 cfs based on the 2004 NJDEP water quality design storm. The Vortechs system is rated to treat a maximum water quality flow rate of 2.4 cfs. The sediment storage capacity of the system is 2.4 yd3.
3.3 Sampling Design The equipment and sampling techniques used for this study are in accordance with the Project Plan (CONTECH, 2008) developed by CONTECH in consultation with NJDEP and NJCAT under the TARP Tier II Stormwater Protocol (TARP, 2003) and the New Jersey Tier II Stormwater Test Requirements—Amendments to TARP Tier II Protocol (NJDEP, 2006). CONTECH personnel were responsible for the installation, operation, and maintenance of the sampling equipment. Sovereign Consulting was utilized for sample retrieval, system reset, and sample submittal activities. Water sample processing and analysis was performed by NJAL and Test America. A Mobile Monitoring Unit (MMU) was provided, installed, maintained, and operated by CONTECH for sampling purposes. The MMU is a towable, fully enclosed, self-contained stormwater monitoring system specially designed and built by CONTECH for remote, extended-deployment stormwater monitoring. The design allows for remote control of sampling equipment, eliminates confined space entry requirements, and streamlines the sample pickup and data collection process. The MMU is shown in Figure 5.
Figure 5 View of the Mobile Monitoring Unit (MMU) installed at the WAWA Market Route 37 study site
Influent and effluent samples were collected using individual ISCO 6712 Portable Automated Samplers configured for standard, individual, round, wide-mouth HDPE bottles with sample bottles in the 1 through 12 positions for discrete sample collection. The samplers were connected to individual 12V DC, deep cycle power supplies recharged with a solar panel. The

12
effluent sampler was equipped with an ISCO 750 Area Velocity Flow Module with a Low Profile Area Velocity Flow Sensor for flow analysis and effluent sample pacing. Sample pacing was based upon effluent flow readings by using a paired sampler configuration though the use of an ISCO SPA 1026 cable. Each sampler was also connected to an ISCO SPA 1489 Digital Cell Phone Modem to allow for remote communication and data access. Rainfall was analyzed with 0.01-in resolution with a Texas Electronics TR-4 tipping bucket-type rain gauge. The sample intake from each automated sampler pump was connected to a stainless steel sample strainer (9/16” diameter, 6” length, with multiple ¼” openings) via a length of 3/8” ID Acutech Duality FEP/LDPE tubing. Sample strainers and the effluent flow sensor were mounted to the invert of the influent/effluent pipes using stainless steel spring rings. Samplers were programmed to enable the sampling program when flow conditions exceeded 5 gpm. Once enabled, the equipment collected samples on a volume-paced basis allowing the specified pacing volume to pass before taking a sample. The sample collection program input into each automated sampler was a two-part program developed to maximize the number of water quality samples collected as well as the coverage of the storm event. Influent and effluent sample collection programs were configured to collect two 500-mL aliquots per bottle spread between up to 12 1-L HDPE bottles. Due to the variability among precipitation events, the sample pacing and enabling specifications were variable on a continuous basis and determined in consultation with the most up-to-date precipitation forecasts. Upon the collection of samples following a precipitation event, CONTECH personnel remotely communicated with the automated sampling equipment to confirm sample collection and dispatch personnel from Sovereign to retrieve the samples and reset the automated sampling equipment. Samples were delivered to NJAL by Sovereign using cold transport and accompanied by chain-of-custody documentation. At the direction of CONTECH personnel, sample bottles were combined by NJAL to create composite samples through identification of those bottles best representing the storm event based upon the storm event hydrograph. Selected sample bottles were thoroughly shaken and emptied into a cone splitter with a 2000µm sieve on top to remove particles greater than 2000µm to ensure proper operation of the cone splitter (USGS, 1980). Analytical methods utilized for the water samples are shown in Table 1.
Table 1 Analytical methods used for analytical parameters of interest
Parameter Analytical Method
Suspended Sediment Conc. (SSC) ASTM D3977
Total Suspended Solids (TSS-SM) SM 2540D
Total Suspended Solids (TSS-EPA) EPA 160.2
Total Volatile Suspended Solids (TVSS) SM 2540G
Particle Size Distribution ASTM D4464
As per the Project Plan, the following quality control samples were used to assess the quality of both field sampling and analytical activities: equipment rinsate blanks, equipment field blanks, method blank, and duplicate analysis. Sample processing blank samples were not taken. Except for solids analyses that employ the use of the whole sample volume (SSC), all method blanks and duplicate analyses were handled by NJAL. Since solids analyses that employ the use of

13
whole sample volume (SSC) consume the entire sample volume, replicate samples were prepared using the cone splitter in place of duplicate samples and analyzed to allow the assessment of analytical accuracy. The results of equipment rinsate blanks, equipment blanks, and sample processing blanks for the two times data blanks were collected are shown in Table 2 accompanied by associated decisions and action items for instances of detection. Table 2 Instances of contaminant detection in equipment rinsate blank and equipment field
blank samples
Date Blank Type Detections Level (mg/L) Action % of Sample Pairs Affected
09/19/08 Rinsate ND None 0
04/09/10 Field ND None 0
3.4 Particle Size Distribution and Residual Solids Assessment Methods Two methods of evaluating influent particle size were used for this project. The first method, laser diffraction, was used in accordance with the TARP Tier II Protocol. The second method used was a serial filtration process that was utilized for every storm event sampled. The serial filtration method is a direct measurement of particle size by mass whereas indirect methods such as Laser Diffraction and the electrical sensing zone method (Coulter Principle) convert counted data points into mass by way of assumptions regarding particle shape and density (CONTECH, 2004). For each storm event sampled, samples were poured through a primary 2000µm sieve prior to being split with a cone splitter as seen in Figure 6. Subsamples intended for SSC (<50µm), SSC (<100µm), and SSC (<500um) analysis were passed through secondary 50µm, 100µm, and 500µm sieves respectively prior to analysis, as seen in Figure 6.
Figure 6 Side view of cone splitter apparatus prior to sample splitting using sieves

14
Results were obtained for SSC, SSC (>2000µm), SSC (<2000µm), SSC (<500µm), SSC (<100µm), and SSC (<50µm). Results for SSC (>2000µm) and SSC were calculated. SSC (>2000µm) was calculated using estimated volume of sample used for the composite and the mass of material retained by the 2000µm sieve. SSC was equal to the sum of SSC (>2000µm) and SSC (<2000µm). The use of 2000µm and 50µm sieves to bracket the sand fraction is based upon the USDA particle size distribution system. Residual solids captured by the system were assessed at the end of the 20-month monitoring phase of the project. The assessment involved the volume estimation of captured material found inside the system and the collection of a 20 liter composite sample of the residual solids. The composite sample of residual solids was homogenized by hand and representatively sampled for analysis. Subsamples were analyzed to determine moisture content, bulk density, and particle size distribution using hydrometer and sieve techniques. Results were used to characterize and determine the mass of captured residual solids.
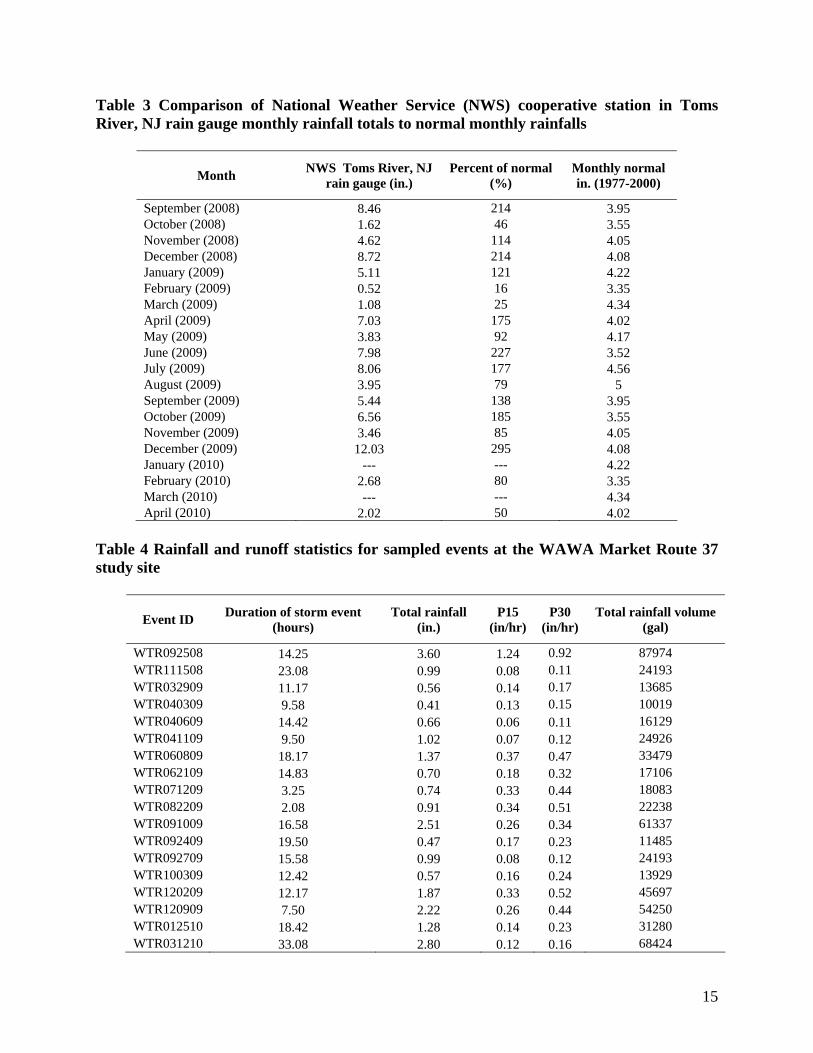
3.5 Precipitation Measurement Rainfall was analyzed with a Texas Electronics TR-4 tipping bucket-type rain gauge. The rain gauge was connected to an ISCO 6712 programmed to record the total number of tips (0.01 inch per tip) every 5 minutes. A comparison of rainfall data collected at the WAWA Market Route 37 study site during the monitoring period to preliminary (before the NWS internal screening process to ensure it was not recorded in error) rainfall data collected at the National Weather Service (NWS) cooperative station in Toms River, NJ indicated that the rain gauge was working properly during the monitoring period. A comparison of the NWS cooperative station in Toms River, NJ rain gauge monthly rainfall totals measured during the monitoring period to normal monthly rainfalls shows that rainfall in the area was below normal in October (2008), February (2009), March (2009), May (2009), August (2009), November (2009), February (2010), and April (2010). Rainfall was noticeably above normal in September (2008), December (2008), April (2009), June (2009), July (2009), October (2009), and December (2009), Table 3. Preliminary data were not available for January (2010) and March (2010) for comparison purposes. A total of 18 qualifying storm events were successfully sampled during the monitoring period between September of 2008 and April of 2010; individual storm reports are included in Appendix A. Collection of storm events commenced after the review of the Project Plan by NJCAT and CONTECH’s technical advisor for the project. Storm event durations ranged from 2.08 hours to 33.08 hours, rainfall depth for sampled events ranged from 0.41 to 3.60 inches, and 15 and 30 minute maximum intensities were 1.24 and 0.92 inches/hour respectively. Based on the drainage area provided by the specifying engineer of 0.74 acres the calculated total rainfall volume ranged from 10,019 to 87,974 gallons, Table 4.
15
Table 3 Comparison of National Weather Service (NWS) cooperative station in Toms River, NJ rain gauge monthly rainfall totals to normal monthly rainfalls
Month NWS Toms River, NJ
rain gauge (in.) Percent of normal
(%) Monthly normal in. (1977-2000)
September (2008) 8.46 214 3.95 October (2008) 1.62 46 3.55 November (2008) 4.62 114 4.05 December (2008) 8.72 214 4.08 January (2009) 5.11 121 4.22 February (2009) 0.52 16 3.35 March (2009) 1.08 25 4.34 April (2009) 7.03 175 4.02 May (2009) 3.83 92 4.17 June (2009) 7.98 227 3.52 July (2009) 8.06 177 4.56 August (2009) 3.95 79 5 September (2009) 5.44 138 3.95 October (2009) 6.56 185 3.55 November (2009) 3.46 85 4.05 December (2009) 12.03 295 4.08 January (2010) --- --- 4.22 February (2010) 2.68 80 3.35 March (2010) --- --- 4.34 April (2010) 2.02 50 4.02
Table 4 Rainfall and runoff statistics for sampled events at the WAWA Market Route 37 study site
Event ID Duration of storm event
(hours) Total rainfall
(in.) P15
(in/hr) P30
(in/hr) Total rainfall volume
(gal)
WTR092508 14.25 3.60 1.24 0.92 87974 WTR111508 23.08 0.99 0.08 0.11 24193 WTR032909 11.17 0.56 0.14 0.17 13685 WTR040309 9.58 0.41 0.13 0.15 10019 WTR040609 14.42 0.66 0.06 0.11 16129 WTR041109 9.50 1.02 0.07 0.12 24926 WTR060809 18.17 1.37 0.37 0.47 33479 WTR062109 14.83 0.70 0.18 0.32 17106 WTR071209 3.25 0.74 0.33 0.44 18083 WTR082209 2.08 0.91 0.34 0.51 22238 WTR091009 16.58 2.51 0.26 0.34 61337 WTR092409 19.50 0.47 0.17 0.23 11485 WTR092709 15.58 0.99 0.08 0.12 24193 WTR100309 12.42 0.57 0.16 0.24 13929 WTR120209 12.17 1.87 0.33 0.52 45697 WTR120909 7.50 2.22 0.26 0.44 54250 WTR012510 18.42 1.28 0.14 0.23 31280 WTR031210 33.08 2.80 0.12 0.16 68424

16
3.6 Flow Measurement
An ISCO 750 Area Velocity Flow Module with a Low Profile Area Velocity Flow Sensor was used to measure flow and pace sample collection. Level measurements were adjusted by applying corrections that reflected differences between recorded and measured water surface elevations in the effluent pipe where the ISCO flow sensor was installed. On average 83 percent of the calculated total rainfall volume was measured as runoff for the events monitored, Table 5. Table 5 Percentage of calculated rainfall runoff volumes measured at the WAWA Market Route 37 study site.
Event ID Event depth
(in) Measured influent volume
(gal) Estimated rainfall volume
(gal) Percent runoff*
(%)
WTR092508 3.60 76849 87974 87 WTR111508 0.99 9631 24193 40 WTR032909 0.56 10394 13685 76 WTR040309 0.41 5020 10019 50 WTR040609 0.66 12956 16129 80 WTR041109 1.02 15755 24926 63 WTR060809 1.37 33569 33479 100 WTR062109 0.70 15845 17106 93 WTR071209 0.74 14869 18083 82 WTR082209 0.91 23077 22238 104 WTR091009 2.51 53031 61337 86 WTR092409 0.47 10873 11485 95 WTR092709 0.99 18239 24193 75 WTR100309 0.57 11438 13929 82 WTR120209 1.87 49664 45697 109 WTR120909 2.22 64853 54250 120 WTR012510 1.28 21921 31280 70 WTR031210 2.80 56135 68424 82
* This is the percent of the total expected rainfall (assumes all rainfall ran off) measured by the flow meters. The data indicates the limitations of measuring flow in the field.
3.7 Stormwater Data Collection Requirements Of the 18 qualifying storm events sampled between September of 2008 and April of 2010; 1) the total rainfall was greater than 0.1 inches for all storm events sampled, 2) the minimum inter-event period was greater than 8 hours for all storm events sampled, 3) flow-weighted composite samples covered a minimum of 64% of total storm flow for all storm events sampled, 4) the minimum number of samples collected per storm event was 6 and the average number of samples collected per storm event was 13, 5) the total sampled rainfall was 23.67 inches, 6) two events exceeded 75% of the design treatment capacity, and 6) TSS-SM, TSS-EPA, and SSC data were collected for all storm events sampled. All events qualified to strict interpretation of the stormwater data collection requirements as per New Jersey Tier II Stormwater Test

17
Requirements—Amendments to TARP Tier II Protocol (NJDEP, 2006) and the NJDEP interpretation of TARP (2003), Table 6.
Table 6 Stormwater data collection requirements results
Event ID Coverage Number of
samples
Event depth (in.)
Antecedent dry period (hr)
Influent volume
(gal)
Peak flow
(gpm)
Percent of hyd. design
(%) WTR092508 74 19 3.60 59 76849 1047 97
WTR111508 93 6 0.99 34 9631 99 9
WTR032909 87 6 0.56 33 10394 285 26
WTR040309 80 8 0.41 32 5020 336 35
WTR040609 64 13 0.66 80 12956 96 9
WTR041109 89 14 1.02 113 15755 85 8
WTR060809 66 22 1.37 15 33569 663 62
WTR062109 76 12 0.70 8 15845 377 35
WTR071209 91 9 0.74 254 14869 561 52
WTR082209 87 10 0.91 8 23077 541 50
WTR091009 87 23 2.51 280 53031 471 44
WTR092409 83 9 0.47 15 10873 354 33
WTR092709 99 12 0.99 68 18239 160 15
WTR100309 79 9 0.57 102 11438 381 35
WTR120209 81 20 1.87 44 49664 641 59
WTR120909 74 20 2.22 75 64853 840 78
WTR012510 73 8 1.28 163 21921 326 30
WTR031210 93 13 2.80 219 56135 296 27
4. Technology System Performance
4.1 Data Analysis Of the 18 storm events captured between September of 2008 and April of 2010, data verification and validation did not lead to the outright disqualification of any events due to obvious monitoring, handling, or analytical errors, or the substantial exceedance of the design operating parameters. No instances were encountered that suggested the disqualification or separation of select analytical results from the data set. Disqualification of either an influent or effluent result would result in the elimination of the paired data from the final data set. Event mean concentrations (EMCs) from influent and effluent samples are summarized in Tables 7, 8, and 9.

18
Table 7 Suspended Solids Event Mean Concentrations (EMCs) for the 18 events sampled at the WAWA Market Route 37 study site
Event ID
TSS-SM
(<2000µm) (mg/l)
TSS-EPA
(<2000µm) (mg/l)
SSC
(mg/l)
SSC
(>2000µm) (mg/l)
SSC
(<2000µm) (mg/l)
SSC
(<500µm) (mg/l)
SSC
(<100µm) (mg/l)
SSC
(<50µm) (mg/l)
Influent Effluent Influent Effluent Influent Effluent Influent Effluent Influent Effluent Influent Effluent Influent Effluent Influent Effluent WTR092508 1810 19.7 376 22.7 2095 17.7 55.1 ND(0.2) 2040 17.5 240 11.5 NT NT 13.5 3.3 WTR111508 209.6 32 128.5 17 162 14 2.8 ND(0.1) 159.3 13.9 102.2 4.3 NT NT 3.2 1.9 WTR032909 238 120 192 114 815 125 33.6 ND(0.2) 781 125 290 109 122 101 69.7 64.6 WTR040309 186.3 126.5 186.8 137 229.3 132.3 13.7 1.3 215.6 131 126.9 107.8 84.6 93.5 28.7 46.8 WTR040609 51 32.5 60.6 36.8 68.1 30.3 2.3 ND(0.1) 65.8 30.2 54.6 21.3 30.3 19.8 20.3 11.3 WTR041109 73.5 15 101.5 13 53 16.4 13.8 ND(0.1) 39.2 16.3 29.1 15.1 26.1 11.6 22.5 10 WTR060809 199 46 146.4 43.5 391.7 50.4 67.7 0.5 324 49.9 285.5 37.9 84.7 30.4 52.1 12.1 WTR062109 42.9 10 50.4 9.4 46 8.9 ND(0.1) 1.4 45.9 7.5 15.3 4.4 8.1 4.3 4.2 1.2 WTR071209 201.7 44.9 416.2 54.6 169.8 32.9 39.1 1 130.7 31.9 113.2 14.7 76.3 12.3 34.7 6.3 WTR082209 56 9.1 154 12.8 317 13.1 47 0.2 270 12.9 225 12.5 43.5 7.9 25 5.3 WTR091009 92.4 6.5 137 10.7 302 9.3 79.3 ND(0.1) 223 9.2 124 8.6 46.7 7.3 18.8 4.4 WTR092409 30.8 3.8 29.3 5 39.5 6.1 6.8 0.1 32.7 6 21.5 3.8 7.5 3.5 7.1 0.9 WTR092709 102 35 141 34.3 314.6 37.4 54.6 2.1 260 35.3 154 34.6 59.4 31 41.8 13.9 WTR100309 81.7 24.1 62 27.1 255.7 27.3 49.7 ND(1.0) 206 27 116 24.8 38.1 19.4 27.7 10 WTR120209 48 7 119 7.5 164 11.7 21.5 1.14 142 10.6 64.6 9.4 20.4 5.5 7.8 3.8 WTR120909 128 12 225 17.6 292 12.7 17.1 0.18 275 12.5 100 10.8 27.3 8.7 14.6 5.3 WTR012510 161 39.1 290 50.7 531 42.2 50.6 0.12 480 42.1 319 29.5 144 33.6 281 28.8 WTR031210 113 35.5 233 38.1 325 37.6 80.6 ND(0.1) 244 37.5 129 35 59.5 29.6 37.8 22.1
Min 30.8 3.8 29.3 5.0 39.5 6.1 0.1 0.1 32.7 6.0 15.3 3.8 7.5 3.5 3.2 0.9 Max 1810.0 126.5 416.2 137.0 2095.0 132.3 80.6 2.1 2040.0 131.0 319.0 109.0 144.0 101.0 281.0 64.6
Median 107.5 28.1 143.7 24.9 273.9 22.5 36.4 0.2 219.3 22.3 120.0 14.9 45.1 15.9 23.8 8.2 Mean 212.5 34.4 169.4 36.2 365.0 34.8 35.3 0.6 329.7 34.2 139.4 27.5 54.9 26.2 39.5 14.0
ND = Non-detect NT = Not Tested

19
Table 8 Total Volatile Suspended Solids Event Mean Concentrations (EMCs) for the 18 events sampled at the WAWA Market Route 37 study site
Event ID TVSS
(>2000µm) (mg/l)
TVSS (<2000µm)
(mg/l)
TVSS (<500µm)
(mg/l)
TVSS (<100µm)
(mg/l)
TVSS (<50µm)
(mg/l)
TVSS (mg/l)
Influent Effluent Influent Effluent Influent Effluent Influent Effluent Influent Effluent Influent Effluent WTR092508 42.9 ND(0.2) 1765 6.8 35.3 3.9 NT NT 1.5 1.8 1807.9 7 WTR111508 2.6 ND(0.1) 22.7 6.4 8 1.9 NT NT 3.2 1.3 25.3 6.5 WTR032909 17.9 ND(0.2) 89.7 36.8 60.6 36.1 34.4 31.8 19.4 20.7 108 37 WTR040309 7.1 1.1 63.3 30.5 36.7 27.8 24.1 24 9.2 10.5 70.4 30.6 WTR040609 0.1 ND(0.1) 2.4 2.4 1.1 1.5 0.7 1.3 0.5 0.8 2.5 2.5 WTR041109 10.7 ND(0.1) 16.4 3.9 14.7 2.7 13.8 1.6 13.5 1 27.1 4 WTR060809 47.3 0.4 91.4 17.8 61.8 13.8 23 10.1 14.2 3.7 138.7 18.2 WTR062109 ND(0.1) 0.4 34.2 7.5 5.6 4.4 5.2 3.5 2.7 1.2 34.3 7.9 WTR071209 31.3 0.8 59.3 17.9 45 7 ND(1.2) 5.1 13.2 4 90.6 18.7 WTR082209 30.5 0.1 80.1 5.8 38.5 6.1 13.6 ND(1.2) 9 2.3 111 5.9 WTR091009 47.5 ND(0.1) 105 4.9 45.1 5.4 17.4 4.4 9.5 1.8 153 5 WTR092409 3.9 0.1 30.3 3.8 9.2 2.4 3.5 3.5 4.5 4.2 34.2 3.9 WTR092709 46.2 0.3 116 19.8 52.6 18.9 29.1 16.8 21 7.7 162.2 20.1 WTR100309 40.6 0.2 87.8 13.6 38.1 12.9 15.7 10.6 12 3.3 128.4 13.8 WTR120209 17.6 1.1 85.8 6 28.2 4.8 8.7 2.6 3.9 2.1 103 6.1 WTR120909 14.9 0.17 179.2 5.4 49.2 5.1 10.9 4.1 7.1 2.1 194 5.6 WTR012510 23.3 ND(0.1) 158 16.2 84.9 10.2 44.2 10.2 29.1 5.2 181 16.3 WTR031210 57.3 ND(0.1) 136 15.1 50.6 14.3 20.6 11.5 12.6 8.7 193 15.2
Min 0.1 0.1 2.4 2.4 1.1 1.5 0.7 1.2 0.5 0.8 2.5 2.5 Max 57.3 1.1 1765.0 36.8 84.9 36.1 44.2 31.8 29.1 20.7 1807.9 37.0
Median 20.6 0.2 86.8 7.2 38.3 5.8 14.8 4.8 9.4 2.8 109.5 7.5 Mean 24.5 0.3 173.5 12.3 37.0 10.0 16.6 8.9 10.3 4.6 198.0 12.5
ND = Non-detect NT = Not Tested

20
Table 9 Calculated Parameters (mineral) Event Mean Concentrations (EMCs) for the 18 events sampled at the WAWA Market Route 37 study site
Event ID
Coarse Solids (mineral)
(material >2000um) (mg/l)
Sand (mineral)
(material 2000um to 50um) (mg/l)
Silt (mineral)
(material <50um) (mg/l)
Influent Effluent Influent Effluent Influent Effluent WTR092508 12.20 ND(0.20) 263.00 9.20 12.00 ND(1.60) WTR111508 0.20 ND(0.10) 136.60 6.90 ND(1.00) 0.60 WTR032909 15.70 ND(0.20) 641.00 44.30 50.30 43.90 WTR040309 6.60 ND(0.20) 132.80 64.20 19.50 36.30 WTR040609 2.20 ND(0.10) 43.60 17.30 19.80 10.50 WTR041109 3.10 ND(0.10) 13.80 3.40 9.00 9.00 WTR060809 20.40 ND(0.10) 194.70 23.70 37.90 8.40 WTR062109 ND(0.10) 1.00 10.20 ND(1.20) 1.50 ND(1.20) WTR071209 7.80 0.20 49.90 11.70 21.50 2.30 WTR082209 16.50 0.10 173.90 4.10 16.00 3.00 WTR091009 31.80 ND(0.10) 108.70 1.70 9.30 2.60 WTR092409 2.90 ND(0.10) ND(1.20) 5.50 2.60 ND(1.20) WTR092709 8.40 1.80 123.20 9.30 20.80 6.20 WTR100309 9.10 ND(0.10) 102.50 6.70 15.70 6.70 WTR120209 3.90 ND(0.05) 52.30 2.90 3.90 1.70 WTR120909 2.20 ND(0.05) 88.30 3.90 7.50 3.20 WTR012510 27.30 ND(0.10) 70.10 2.30 251.90 23.60 WTR031210 23.30 ND(0.10) 82.80 9.00 25.20 13.40
Min 0.1 0.1 1.2 1.2 1.0 0.6 Max 31.8 1.8 641.0 64.2 251.9 43.9
Median 8.1 0.1 95.4 6.8 15.9 4.7 Mean 10.8 0.3 127.1 12.6 29.2 9.7
ND = Non-detect NT = Not Tested

21
Using SSC (<500 µm), SSC (<100 µm), and SSC (<50 µm) EMC results the percent of corresponding SSC (<2000 µm) EMC results was calculated. The calculated percentages of corresponding SSC (<2000µm) EMC results indicates the portions of material that are less than 500 µm, 100 µm, and 50 µm in size and are summarized in Table 10. Using TVSS EMC results the percent of corresponding TVSS results was calculated. The calculated percentages of corresponding TVSS (<2000µm) results indicates the portions of material that are less than 500 µm, 100 µm, and 50 µm in size and are summarized in Table 11. Appendix A details system performance on an individual storm basis (discrete removal efficiency) using the Washington State Department of Ecology “individual storm reduction in pollutant concentration” method (WADOE, 2002 method #1)—the performance of the system over the course of a single storm event based upon EMC. Hydrograph and rainfall data from the events are also shown in Appendix A. Performance was calculated using the summation of loads (SOL) method. The SOL method defines the efficiency as a percentage based on the ratio of the summation of all incoming loads to the summation of all outlet loads. The SOL method assumes; 1) monitoring data accurately represents the actual entire total loads in and out of the BMP for a period long enough to overshadow any temporary storage or export of pollutants and 2) any significant storm events that were not monitored had a ratio of inlet to outlet loads similar to the storm events that were monitored (URS/ EPA 1999). Sum of Loads (SOL) Efficiency Calculations for the 18 events sampled at the Wawa Market Route 37 study site are summarized in Tables 12, 13, and 14. Detectible concentrations were observed for all parameters analyzed except for SSC (>2000µm) for the WTR092508, WTR111508, WTR032909, WTR040609, WTR041109, WTR062109, WTR091009, WTR100309 and WTR031210 events; TVSS (>2000µm) for the WTR092508, WTR111508, WTR032909, WTR040609, WTR041109, WTR062109, WTR091009, WTR012510, and WTR031210 events; TVSS (<100µm) for the WTR071209 and WTR082209 events; Coarse Solids (mineral) for the WTR092508, WTR111508, WTR032909, WTR040309, WTR040609, WTR041109, WTR060809, WTR062109, WTR082209, WTR091009, WTR092409, WTR100309, WTR120209, WTR120909, WTR012510, and WTR031210 events; Sand (mineral) for the WTR062109 and WTR092409 events; and Silt (mineral) for the WTR092508, WTR111508, WTR062109, and WTR092409 events. For values that were reported as non-detect substitutions were made using the Method Reporting Limit (MRL) for statistical testing or calculation of event loads.

22
Table 10 Calculated percentages of material less than 500 µm and 50 µm for the 18 events sampled at the WAWA Market Route 37 study site
Event ID SSC (<500-um)/ SSC (<2000-um)
SSC (<50-um)/
SSC (<2000-um)
SSC (<100-um)/ SSC (<2000-um)
Influent Effluent Influent Effluent Influent Effluent
WTR092508 12% 66% 1% 19% NT NT WTR111508 64% 31% 2% 14% NT NT WTR032909 37% 87% 9% 52% 16% 81% WTR040309 59% 82% 13% 36% 39% 71% WTR040609 83% 71% 31% 37% 46% 66% WTR041109 74% 93% 57% 61% 67% 71% WTR060809 88% 76% 16% 24% 26% 61% WTR062109 33% 59% 9% 16% 18% 57% WTR071209 87% 46% 27% 20% 58% 39% WTR082209 83% 97% 9% 41% 16% 61% WTR091009 56% 93% 8% 48% 21% 79% WTR092409 66% 63% 22% 15% 23% 58% WTR092709 59% 98% 16% 39% 23% 88% WTR100309 56% 92% 13% 37% 18% 72% WTR120209 45% 89% 5% 36% 14% 52% WTR120909 36% 86% 5% 42% 10% 70% WTR012510 66% 70% 59% 68% 30% 80% WTR031210 53% 93% 15% 59% 24% 79%
Min 12% 31% 1% 14% 10% 39% Max 88% 98% 59% 68% 67% 88%
Median 59% 84% 13% 37% 23% 70% Mean 59% 77% 18% 37% 28% 68%

23
Table 11 Calculated percentages of combustible materials that are assumed to be organic in nature for the 18 events sampled at the WAWA Market Route 37 study site
Event ID TVSS (<2000-um)
(mg/l) / SSC (<2000-um) (mg/l)
TVSS (<500-um) (mg/l) / SSC
(<500-um) (mg/l)
TVSS (<50-um) (mg/l) / SSC (<50-
um) (mg/l)
TVSS (>2000-um) (mg/l) / SSC
(>2000-um) (mg/l)
TVSS (mg/l) / SSC(mg/l)
TVSS (<100-um) (mg/l) / SSC (<100-
um) (mg/l)
Influent Effluent Influent Effluent Influent Effluent Influent Effluent Influent Effluent Influent Effluent WTR092508 87% 39% 15% 34% 11% 55% 78% 100% 86% 40% NT NT WTR111508 14% 46% 8% 44% 100% 68% 93% 100% 16% 46% NT NT WTR032909 11% 29% 21% 33% 28% 32% 53% 100% 13% 30% 28% 31% WTR040309 29% 23% 29% 26% 32% 22% 52% 85% 31% 23% 28% 26% WTR040609 4% 8% 2% 7% 2% 7% 4% 100% 4% 8% 2% 7% WTR041109 42% 24% 51% 18% 60% 10% 78% 100% 51% 24% 53% 14% WTR060809 28% 36% 22% 36% 27% 31% 70% 80% 35% 36% 27% 33% WTR062109 75% 100% 37% 100% 64% 100% 100% 29% 75% 89% 64% 81% WTR071209 45% 56% 40% 48% 38% 63% 80% 80% 53% 57% 2% 41% WTR082209 30% 45% 17% 49% 36% 43% 65% 50% 35% 45% 31% 15% WTR091009 47% 53% 36% 63% 51% 41% 60% 100% 51% 54% 37% 60% WTR092409 93% 63% 43% 63% 63% 467% 57% 100% 87% 64% 47% 100% WTR092709 45% 56% 34% 55% 50% 55% 85% 14% 52% 54% 49% 54% WTR100309 43% 50% 33% 52% 43% 33% 82% 67% 50% 51% 41% 55% WTR120209 60% 57% 44% 51% 50% 55% 82% 96% 63% 52% 43% 47% WTR120909 65% 43% 49% 47% 49% 40% 87% 94% 66% 44% 40% 47% WTR012510 33% 38% 27% 35% 10% 18% 46% 83% 34% 39% 31% 30% WTR031210 56% 40% 39% 41% 33% 39% 71% 100% 59% 40% 35% 39%
Min 4% 8% 2% 7% 2% 7% 4% 14% 4% 8% 2% 7% Max 93% 100% 51% 100% 100% 467% 100% 100% 87% 89% 64% 100%
Median 44% 44% 34% 46% 41% 40% 74% 95% 51% 45% 36% 40% Mean 45% 45% 30% 45% 42% 66% 69% 80% 48% 44% 35% 43%

24
Table 12 Suspended Solids Event Sum of Loads (SOL) Efficiency Calculations for the 18 events sampled at the WAWA Market Route 37 study site
Event ID
TSS-SM
(<2000µm) (kg)
TSS-EPA (<2000µm)
(kg)
SSC (kg)
SSC
(>2000µm) (kg)
SSC (<2000µm)
(kg)
SSC
(<500µm) (kg)
SSC
(<100µm) (kg)
SSC
(<50µm) (kg)
Influent Effluent Influent Effluent Influent Effluent Influent Effluent Influent Effluent Influent Effluent Influent Effluent Influent Effluent
WTR092508 526.5 5.7 109.4 6.6 609.4 5.1 16.0 0.1 593.4 5.1 69.8 3.3 NT NT 3.9 1.0 WTR111508 7.6 1.2 4.7 0.6 5.9 0.5 0.1 0.0 5.8 0.5 3.7 0.2 NT NT 0.1 0.1 WTR032909 9.4 4.7 7.6 4.5 32.1 4.9 1.3 0.0 30.7 4.9 11.4 4.3 4.8 4.0 2.7 2.5 WTR040309 3.5 2.4 3.5 2.6 4.4 2.5 0.3 0.0 4.1 2.5 2.4 2.0 1.6 1.8 0.5 0.9 WTR040609 2.5 1.6 3.0 1.8 3.3 1.5 0.1 0.0 3.2 1.5 2.7 1.0 1.5 1.0 1.0 0.6 WTR041109 4.4 0.9 6.1 0.8 3.2 1.0 0.8 0.0 2.3 1.0 1.7 0.9 1.6 0.7 1.3 0.6 WTR060809 25.3 5.8 18.6 5.5 49.8 6.4 8.6 0.1 41.2 6.3 36.3 4.8 10.8 3.9 6.6 1.5 WTR062109 2.6 0.6 3.0 0.6 2.8 0.5 0.0 0.1 2.8 0.4 0.9 0.3 0.5 0.3 0.3 0.1 WTR071209 11.4 2.5 23.4 3.1 9.6 1.9 2.2 0.1 7.4 1.8 6.4 0.8 4.3 0.7 2.0 0.4 WTR082209 4.9 0.8 13.5 1.1 27.7 1.1 4.1 0.0 23.6 1.1 19.7 1.1 3.8 0.7 2.2 0.5 WTR091009 18.5 1.3 27.5 2.1 60.6 1.9 15.9 0.0 44.8 1.8 24.9 1.7 9.4 1.5 3.8 0.9 WTR092409 1.3 0.2 1.2 0.2 1.6 0.3 0.3 0.0 1.3 0.2 0.9 0.2 0.3 0.1 0.3 0.0 WTR092709 7.0 2.4 9.7 2.4 21.7 2.6 3.8 0.1 17.9 2.4 10.6 2.4 4.1 2.1 2.9 1.0 WTR100309 3.5 1.0 2.7 1.2 11.1 1.2 2.2 0.0 8.9 1.2 5.0 1.1 1.6 0.8 1.2 0.4 WTR120209 9.0 1.3 22.4 1.4 30.8 2.2 4.0 0.2 26.7 2.0 12.1 1.8 3.8 1.0 1.5 0.7 WTR120909 31.4 2.9 55.2 4.3 71.7 3.1 4.2 0.0 67.5 3.1 24.5 2.7 6.7 2.1 3.6 1.3 WTR012510 13.4 3.2 24.1 4.2 44.1 3.5 4.2 0.0 39.8 3.5 26.5 2.4 11.9 2.8 23.3 2.4 WTR031210 24.0 7.5 49.5 8.1 69.1 8.0 17.1 0.0 51.8 8.0 27.4 7.4 12.6 6.3 8.0 4.7
Total 706.2 46.2 385.0 51.1 1058.6 48.2 85.2 0.8 973.3 47.4 287.0 38.4 79.3 29.8 65.2 19.5 SOL
Efficiency 93 87 95 99 95 87 63 70
25
Table 13 Total Volatile Suspended Solids Event Sum of Loads (SOL) Efficiency Calculations for the 18 events sampled at the WAWA Market Route 37 study site
Event ID TVSS
(>2000µm) (kg)
TVSS (<2000µm)
(kg)
TVSS (<500µm)
(kg)
TVSS (<100µm)
(kg)
TVSS (<50µm)
(kg)
TVSS (kg)
Influent Effluent Influent Effluent Influent Effluent Influent Effluent Influent Effluent Influent Effluent WTR092508 12.5 0.1 513.4 2.0 10.3 1.1 NT NT 0.4 0.5 525.9 2.0 WTR111508 0.1 0.0 0.8 0.2 0.3 0.1 NT NT 0.1 0.0 0.9 0.2 WTR032909 0.7 0.0 3.5 1.4 2.4 1.4 1.4 1.3 0.8 0.8 4.2 1.5 WTR040309 0.1 0.0 1.2 0.6 0.7 0.5 0.5 0.5 0.2 0.2 1.3 0.6 WTR040609 0.0 0.0 0.1 0.1 0.1 0.1 0.0 0.1 0.0 0.0 0.1 0.1 WTR041109 0.6 0.0 1.0 0.2 0.9 0.2 0.8 0.1 0.8 0.1 1.6 0.2 WTR060809 6.0 0.1 11.6 2.3 7.9 1.8 2.9 1.3 1.8 0.5 17.6 2.3 WTR062109 0.0 0.0 2.1 0.4 0.3 0.3 0.3 0.2 0.2 0.1 2.1 0.5 WTR071209 1.8 0.0 3.3 1.0 2.5 0.4 0.1 0.3 0.7 0.2 5.1 1.1 WTR082209 2.7 0.0 7.0 0.5 3.4 0.5 1.2 0.1 0.8 0.2 9.7 0.5 WTR091009 9.5 0.0 21.1 1.0 9.1 1.1 3.5 0.9 1.9 0.4 30.7 1.0 WTR092409 0.2 0.0 1.2 0.2 0.4 0.1 0.1 0.1 0.2 0.2 1.4 0.2 WTR092709 3.2 0.0 8.0 1.4 3.6 1.3 2.0 1.2 1.4 0.5 11.2 1.4 WTR100309 1.8 0.0 3.8 0.6 1.6 0.6 0.7 0.5 0.5 0.1 5.6 0.6 WTR120209 3.3 0.2 16.1 1.1 5.3 0.9 1.6 0.5 0.7 0.4 19.4 1.1 WTR120909 3.7 0.0 44.0 1.3 12.1 1.3 2.7 1.0 1.7 0.5 47.6 1.4 WTR012510 1.9 0.0 13.1 1.3 7.0 0.8 3.7 0.8 2.4 0.4 15.0 1.4 WTR031210 12.2 0.0 28.9 3.2 10.8 3.0 4.4 2.4 2.7 1.8 41.0 3.2
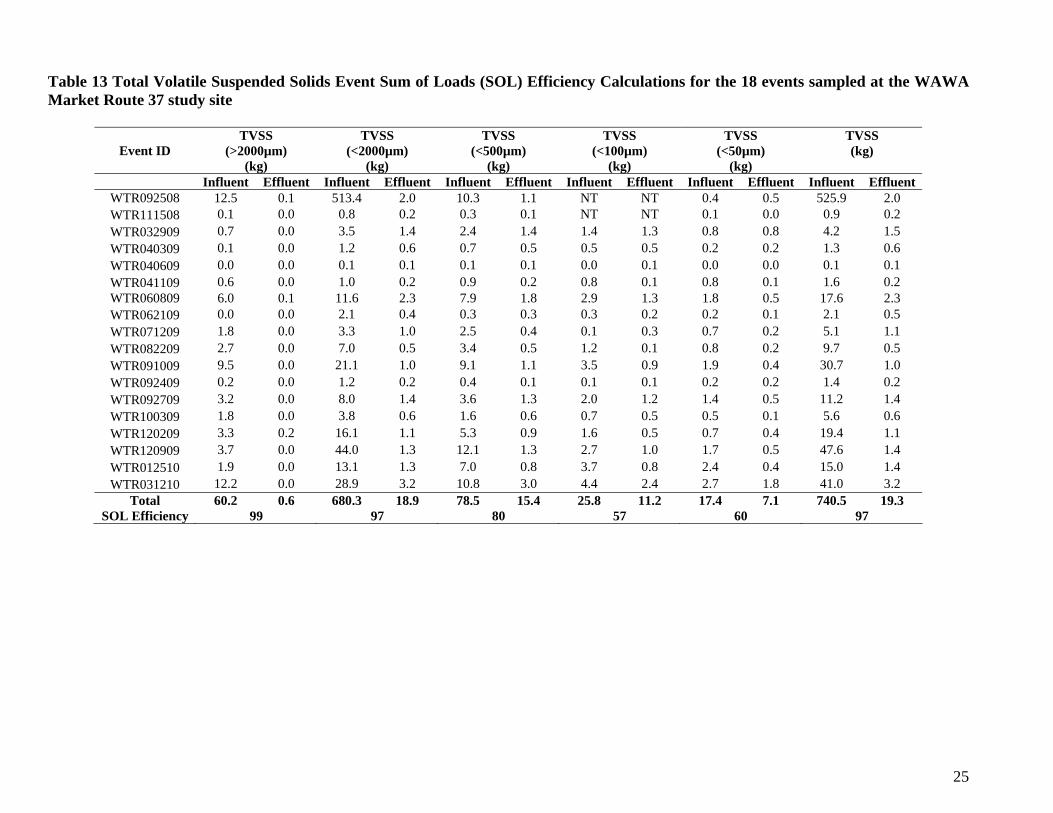
Total 60.2 0.6 680.3 18.9 78.5 15.4 25.8 11.2 17.4 7.1 740.5 19.3 SOL Efficiency 99 97 80 57 60 97

26
Table 14 Calculated Parameters (mineral) Event Sum of Loads (SOL) Efficiency Calculations for the 18 events sampled at the WAWA Market Route 37 study site
Event ID Coarse Solids
(mineral) (kg)
Sand (mineral)
(kg)
Silt (mineral)
(kg) Influent Effluent Influent Effluent Influent Effluent
WTR092508 3.5 0.1 76.5 2.7 3.5 0.4 WTR111508 0.0 0.0 5.0 0.3 0.0 0.0 WTR032909 0.6 0.0 25.2 1.7 2.0 1.7 WTR040309 0.1 0.0 2.5 1.2 0.4 0.7 WTR040609 0.1 0.0 2.1 0.8 1.0 0.5 WTR041109 0.2 0.0 0.8 0.2 0.5 0.5 WTR060809 2.6 0.0 24.7 3.0 4.8 1.1 WTR062109 0.0 0.1 0.6 0.1 0.1 0.1 WTR071209 0.4 0.0 2.8 0.7 1.2 0.1 WTR082209 1.4 0.0 15.2 0.4 1.4 0.3 WTR091009 6.4 0.0 21.8 0.3 1.9 0.5 WTR092409 0.1 0.0 0.0 0.2 0.1 0.0 WTR092709 0.6 0.1 8.5 0.6 1.4 0.4 WTR100309 0.4 0.0 4.4 0.3 0.7 0.3 WTR120209 0.7 0.0 9.8 0.5 0.7 0.3 WTR120909 0.5 0.0 21.7 1.0 1.8 0.8 WTR012510 2.3 0.0 5.8 0.2 20.9 2.0 WTR031210 5.0 0.0 17.6 1.9 5.4 2.8
Total 25.0 0.4 245.3 16.1 47.8 12.7 SOL Efficiency 98 93 74

27
4.2 Test Results
Suspended Solids Parameters Influent EMCs for TSS-SM (<2000µm) ranged from 30.8 mg/l to 1810.0 mg/l with a median of 107.5 mg/l and a mean of 212.5 mg/l. Corresponding effluent EMCs ranged from 3.8 mg/l to 126.5 mg/l with a median of 28.1 mg/l and a mean of 34.4 mg/l. Total event loadings for the study were 706.2 kg at the influent and 46.2 kg at the effluent sampling location, resulting in an overall removal efficiency of 93%. Influent EMCs for SSC (<2000µm) ranged from 32.7 mg/l to 2040.0 mg/l with a median of 219.3 mg/l and a mean of 329.7 mg/l. Corresponding effluent EMCs ranged from 6.0 mg/l to 132.3 mg/l with a median of 22.3 mg/l and a mean of 34.2 mg/l. Total event loadings for the study were 973.3 kg at the influent and 47.4 kg at the effluent sampling location, resulting in an overall removal efficiency of 95%. Influent EMCs for SSC (<500µm) ranged from 15.3 mg/l to 319.0 mg/l with a median of 120.0 mg/l and a mean of 139.4 mg/l. Corresponding effluent EMCs ranged from 3.8 mg/l to 109.0 mg/l with a median of 14.9 mg/l and a mean of 27.5 mg/l. Total event loadings for the study were 287.0 kg at the influent and 38.4 kg at the effluent sampling location, resulting in an overall removal efficiency of 87%. For each storm event the percent of SSC (<2000 µm) represented by SSC (<500 µm) was calculated. Influent and effluent median percentages of SSC (<2000µm) were, 59% and 84% respectively. The percentage of corresponding SSC (<2000µm) results indicates the portion of material that are less than 500µm in size. Influent EMCs for SSC (<100µm) ranged from 7.5 mg/l to 144.0 mg/l with a median of 45.1 mg/l and a mean of 54.9 mg/l. Corresponding effluent EMCs ranged from 3.5 mg/l to 101.0 mg/l with a median of 15.9 mg/l and a mean of 26.2 mg/l. Total event loadings for the study were 79.3 kg at the influent and 29.8 kg at the effluent sampling location, resulting in an over all removal efficiency of 63%. For each storm event the percent of SSC (<2000 µm) represented by SSC (<100 µm) was calculated. Influent and effluent median percentages of SSC (<2000µm) were, 23% and 70% respectively. The percentage of corresponding SSC (<2000µm) results indicates the portions of material that are less than 100µm in size. Influent EMCs for SSC (<50µm) ranged from 3.2 mg/l to 281.0 mg/l with a median of 23.8 mg/l and a mean of 39.5 mg/l. Corresponding effluent EMCs ranged from 0.9 mg/l to 64.6 mg/l with a median of 8.2 mg/l and a mean of 14.0 mg/l. Total event loadings for the study were 65.2 kg at the influent and 19.5 kg at the effluent sampling location, resulting in an overall removal efficiency of 70%. For each storm event the percent of SSC (<2000 µm) represented by SSC (<50 µm) was calculated. Influent and effluent median percentages of SSC (<2000µm) were, 13% and 37% respectively. The percentage of corresponding SSC (<2000µm) results indicates the portion of material that are less than 50µm in size. Influent and effluent median EMCs for TSS-EPA (<2000µm) were 143.7 mg/l and 24.9 mg/l respectively resulting in an overall removal efficiency of 87%. Influent and effluent median EMCs for SSC (>2000µm) were 36.4 mg/l and 0.2 mg/l respectively resulting in an overall removal efficiency of 99%. Influent and effluent median EMCs for SSC were 273.9 mg/l and 22.8 mg/l respectively resulting in an over all removal efficiency of 95%.

28
Volatile Suspended Solids Parameters Influent and effluent median EMCs for TVSS (<2000µm) were 86.8 mg/l and 7.2 mg/l respectively, resulting in an overall removal efficiency of 97%.For each storm event the percent of SSC (<2000 µm) represented by TVSS (<2000µm) was calculated. Influent and effluent median percentages of SSC (<2000µm) were, 44% and 44% respectively. Percentage of corresponding SSC (<2000µm) results indicates the percent of combustible materials that are assumed to be organic in nature. Influent and effluent median EMCs for TVSS (<500µm) were 38.3 mg/l and 5.8mg/l respectively, resulting in an overall removal efficiency of 80%. For each storm event the percent of SSC (<500 µm) represented by TVSS (<500µm) was calculated. Influent and effluent median percentages of SSC (<500µm) were 34% and 46% respectively. Percentage of corresponding SSC (<500µm) results indicates the percent of combustible materials that are assumed to be organic in nature. Influent and effluent median EMCs for TVSS (<100µm) were 14.8 mg/l and 4.8 mg/l respectively, resulting in an overall removal efficiency of 57%. For each storm event the percent of SSC (<100 µm) represented by TVSS (<100µm) was calculated. Influent and effluent median percentages of SSC (<100µm) were 36% and 40% respectively. Percentage of corresponding SSC (<100µm) results indicates the percent of combustible materials that are assumed to be organic in nature. Influent and effluent median EMCs for TVSS (<50µm) were 9.4 mg/l and 2.8 mg/l respectively, resulting in an overall removal efficiency of 60%. For each storm event the percent of SSC (<50µm) represented by TVSS (<50µm) was calculated. Influent and effluent median percentages of SSC (<50µm) were 41% and 40% respectively. Percentage of corresponding SSC (<50µm) results indicates the percent of combustible materials that are assumed to be organic in nature. Influent and effluent median EMCs for TVSS (>2000µm) were 20.6 mg/l and 0.2 mg/l respectively, resulting in an overall removal efficiency of 99%. For each storm event the percent of SSC (>2000 µm) represented by TVSS (>2000µm) was calculated. Influent and effluent median percentages of SSC (>2000µm) were 74% and 95% respectively. Percentage of corresponding SSC (>2000µm) results indicates the percent of combustible materials that are assumed to be organic in nature. For each storm event the percent of SSC represented by TVSS was calculated. Influent and effluent median percentages of SSC were 51% and 45% respectively. Percentage of corresponding SSC results indicates the percent of combustible materials that are assumed to be organic in nature. Additional Parameters Influent and effluent median EMCs for Coarse Solids (mineral) were 8.1 mg/l and 0.1 mg/l respectively, resulting in an overall removal efficiency of 98%. Influent and effluent median EMCs for Sand (mineral) were 95.4 mg/l and 6.8 mg/l respectively, resulting in an overall removal efficiency of 93%. Influent and effluent median EMCs for Silt (mineral) were 15.9 mg/l and 4.7 mg/l respectively, resulting in an overall removal efficiency of 74%.
4.3 System Maintenance and Residual Solids Assessment Results In an effort to verify the capture of materials by the Vortechs system over the course of the 20-month monitoring period a qualitative assessment of materials captured by the system was performed during the maintenance event conducted at the conclusion of the project. In order to safely enter the system a vactor truck was used to dewater the system. Following the dewatering of the system, a sediment sample
29
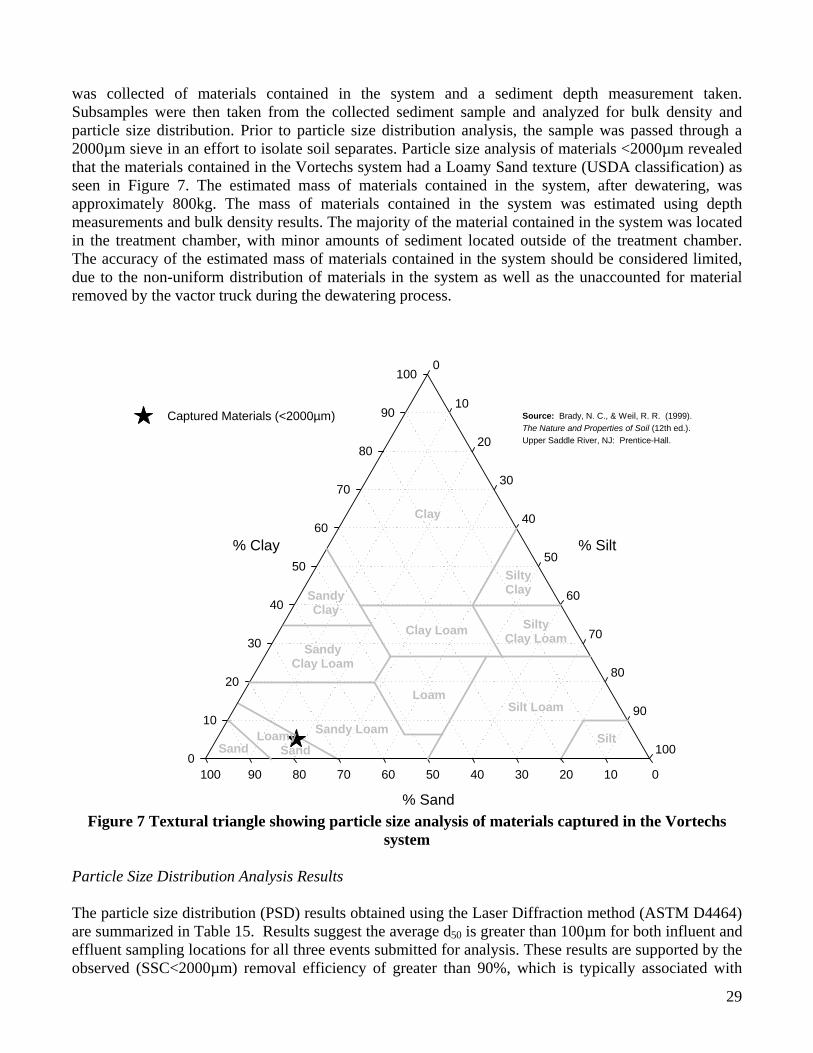
was collected of materials contained in the system and a sediment depth measurement taken. Subsamples were then taken from the collected sediment sample and analyzed for bulk density and particle size distribution. Prior to particle size distribution analysis, the sample was passed through a 2000µm sieve in an effort to isolate soil separates. Particle size analysis of materials <2000µm revealed that the materials contained in the Vortechs system had a Loamy Sand texture (USDA classification) as seen in Figure 7. The estimated mass of materials contained in the system, after dewatering, was approximately 800kg. The mass of materials contained in the system was estimated using depth measurements and bulk density results. The majority of the material contained in the system was located in the treatment chamber, with minor amounts of sediment located outside of the treatment chamber. The accuracy of the estimated mass of materials contained in the system should be considered limited, due to the non-uniform distribution of materials in the system as well as the unaccounted for material removed by the vactor truck during the dewatering process.
Sand
% Silt
0
10
20
30
40
50
60
70
80
90
100
% Clay
0
10
20
30
40
50
60
70
80
90
100
% Sand
0102030405060708090100
Captured Materials (<2000µm)
Clay
SandyClay
SiltyClay
Clay Loam SiltyClay Loam
SandyClay Loam
LoamSilt Loam
SiltSandy Loam
Loamy Sand
Source: Brady, N. C., & Weil, R. R. (1999).
The Nature and Properties of Soil (12th ed.).
Upper Saddle River, NJ: Prentice-Hall.
Figure 7 Textural triangle showing particle size analysis of materials captured in the Vortechs
system Particle Size Distribution Analysis Results The particle size distribution (PSD) results obtained using the Laser Diffraction method (ASTM D4464) are summarized in Table 15. Results suggest the average d50 is greater than 100µm for both influent and effluent sampling locations for all three events submitted for analysis. These results are supported by the observed (SSC<2000µm) removal efficiency of greater than 90%, which is typically associated with

30
coarser solids with a d50 greater than 100µm. However, given that variations in particle density are not considered by the Laser Diffraction method the precision of the PSD results obtained using the Laser Diffraction method should be viewed as limited as compared to the serial filtration method. Table 15 Particle size distribution analysis results using ASTM D4464 (Laser Diffraction) for events sampled at the WAWA Market Route 37 study site
Event ID SAND (%) SILT (%) CLAY (%) d50 (microns) Influent Effluent Influent Effluent Influent Effluent Influent Effluent
WTR091009 79.43 96.33 20.15 3.67 0.42 0.00 504.13 1129.99 WTR111508 81.05 50.42 18.39 46.76 0.56 2.62 337.78 76.09 WTR120209 96.71 100.00 3.29 0.00 0.00 0.00 1238.51 1217.28
Median 81.05 96.33 18.39 3.67 0.42 0.00 504.13 1129.99 Mean 85.73 82.25 13.94 16.81 0.33 0.87 693.47 807.79
Influent PSD obtained using the serial filtration method covering the 6350µm to 1.5µm particle size range suggests that the average d50 (~500µm) is greater than 100µm for all of the events captured to date, as shown in Figure 8. The upper size limit of 6350µm is approximately equal to the sample strainer opening. It is assumed that particles larger then the opening will not be sampled. The lower size limit of 1.5µm is equal to the pore size of filters used by the Analytical Laboratory for SSC analysis. Particle size distribution results are supported by observed SSC (<2000µm) removal efficiency rates of greater than 90%
Particle Diameter (µm)
0.1 1 10 100 1000 10000
Pe
rce
nt
Sm
all
er
Th
an
Siz
e I
nd
ica
ted
0
10
20
30
40
50
60
70
80
90
100
110
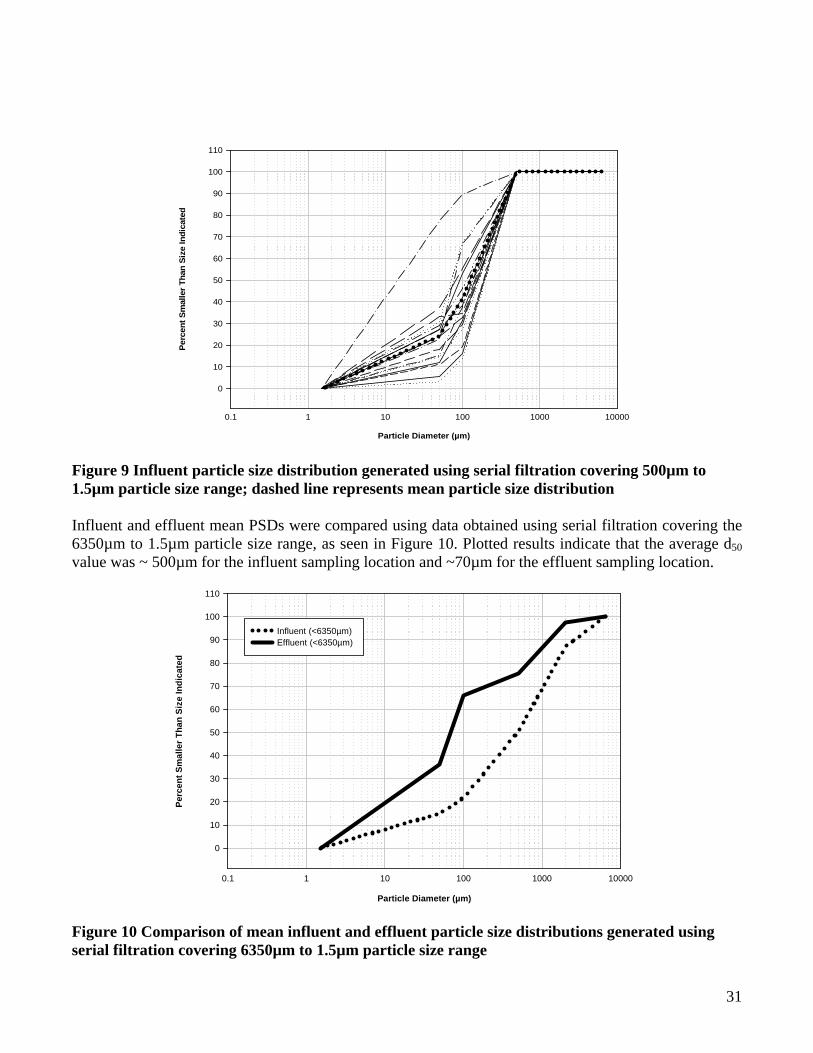
Figure 8 Influent particle size distribution generated using serial filtration covering 6350µm to 1.5µm particle size range; dashed line represents mean particle size distribution Influent PSD obtained using the serial filtration method covering the 500µm to 1.5µm particle size range reflect an average d50 that is slightly more than 100µm (~125µm) for all the events captured to date, as seen in Figure 9.
31
Particle Diameter (µm)
0.1 1 10 100 1000 10000
Perc
en
t S
mal
ler
Th
an S
ize In
dic
ated
0
10
20
30
40
50
60
70
80
90
100
110
Figure 9 Influent particle size distribution generated using serial filtration covering 500µm to 1.5µm particle size range; dashed line represents mean particle size distribution Influent and effluent mean PSDs were compared using data obtained using serial filtration covering the 6350µm to 1.5µm particle size range, as seen in Figure 10. Plotted results indicate that the average d50 value was ~ 500µm for the influent sampling location and ~70µm for the effluent sampling location.
Particle Diameter (µm)
0.1 1 10 100 1000 10000
Per
cen
t S
ma
lle
r T
ha
n S
ize
Ind
icat
ed
0
10
20
30
40
50
60
70
80
90
100
110
Influent (<6350µm) Effluent (<6350µm)
Figure 10 Comparison of mean influent and effluent particle size distributions generated using serial filtration covering 6350µm to 1.5µm particle size range
32
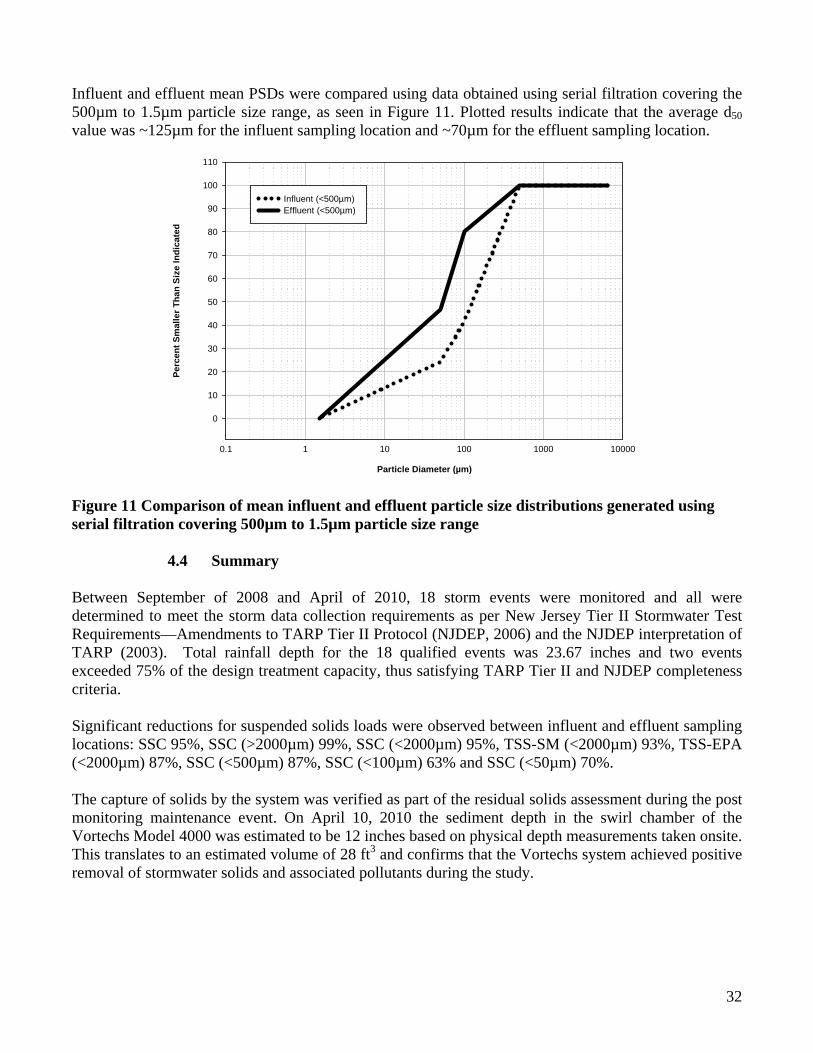
Influent and effluent mean PSDs were compared using data obtained using serial filtration covering the 500µm to 1.5µm particle size range, as seen in Figure 11. Plotted results indicate that the average d50 value was ~125µm for the influent sampling location and ~70µm for the effluent sampling location.
Particle Diameter (µm)
0.1 1 10 100 1000 10000
Pe
rcen
t S
mal
ler
Th
an S
ize
In
dic
ated
0
10
20
30
40
50
60
70
80
90
100
110
Influent (<500µm) Effluent (<500µm)
Figure 11 Comparison of mean influent and effluent particle size distributions generated using serial filtration covering 500µm to 1.5µm particle size range
4.4 Summary Between September of 2008 and April of 2010, 18 storm events were monitored and all were determined to meet the storm data collection requirements as per New Jersey Tier II Stormwater Test Requirements—Amendments to TARP Tier II Protocol (NJDEP, 2006) and the NJDEP interpretation of TARP (2003). Total rainfall depth for the 18 qualified events was 23.67 inches and two events exceeded 75% of the design treatment capacity, thus satisfying TARP Tier II and NJDEP completeness criteria. Significant reductions for suspended solids loads were observed between influent and effluent sampling locations: SSC 95%, SSC (>2000µm) 99%, SSC (<2000µm) 95%, TSS-SM (<2000µm) 93%, TSS-EPA (<2000µm) 87%, SSC (<500µm) 87%, SSC (<100µm) 63% and SSC (<50µm) 70%. The capture of solids by the system was verified as part of the residual solids assessment during the post monitoring maintenance event. On April 10, 2010 the sediment depth in the swirl chamber of the Vortechs Model 4000 was estimated to be 12 inches based on physical depth measurements taken onsite. This translates to an estimated volume of 28 ft3 and confirms that the Vortechs system achieved positive removal of stormwater solids and associated pollutants during the study.

33
5. Performance Claim Verification Given that the performance standard is based on TSS-SM and TSS-SM removal efficiency results for this study are associated with suspended solids with a d50 greater than 100µm, the review of additional data was required to further understand removal efficiency results. In general removal efficiency results in excess of 90% are not typical for a flow through gravity separation technology but are within the realm of expected performance associated with observed influent TSS-SM EMCs with a d50 greater than 100µm. In an effort to isolate suspended sediment removal efficiency based on specific particle size ranges, SSC samples were sieved prior to analysis. The particle size ranges that were isolated for this study include 6350µm to 1.5µm, 2000µm to 1.5µm, 500µm to 1.5µm, 100µm to 1.5µm, and 50µm to 1.5µm. The isolation of suspended solids removal efficiency based on particles 500µm to 1.5µm with a d50 slightly greater than 100µm, particles between 100µm and 1.5 µm with a d50 less than 100µm, and particles between 50µm and 1.5 µm with a d50 less than 50µm resulted in overall removal efficiencies of 87%, 63%, and 70% respectively. The use of these results is proposed in order to satisfy the site selection requirements as per New Jersey Tier II Stormwater Test Requirements—Amendments to TARP Tier II Protocol (NJDEP, 2006) and the NJDEP interpretation of TARP (2003). Recognizing the potential for bias towards the sampling of coarse mineral solids using accepted sampling techniques, removal efficiency based on finer mineral particles smaller than 50µm was isolated. Finer mineral particles smaller than 50µm (Silt (mineral)) are generally expected to be more or less uniformly distributed throughout the water column. Silt (mineral) results were calculated by subtracting the volatile suspended solids results (TVSS <50µm) composed of combustible materials assumed to be organic in nature from the total suspended results (SSC <50µm). Removal efficiency based on Silt (mineral) results resulted in an over all removal efficiency of 74% which compares favorably with the 70% removal of SSC <50µm. In addition to providing a much more conservative removal efficiency result, research by (Rutgers/ NJDEP, 2006) suggests the difference between TSS and SSC results becomes smaller as the particle size of the material analyzed becomes finer. Recognizing the potential of a limited number of storm events to dominate sum of loads performance efficiency calculations, storm events with TSS-SM (<2000µm) EMCs less than 500 mg/l were segregated from the data set and evaluated (Note: This involved removing only one sampling event – WTR092508.). Significant reductions for suspended solids loads were observed between influent and effluent sampling locations: TSS-SM (<2000µm) 77%, TSS-EPA (<2000µm) 84%, SSC 90%, SSC (>2000µm) 99%, SSC (<2000µm) 89 %, SSC(<500µm) 84%, SSC (<100µm) 63%, SSC (<50µm) 70%, Coarse solids (mineral) 98%, Sand (mineral) 92%, and Silt (mineral) 72%. The primary purpose of this project was to document Vortechs system performance with respect to suspended solids removal and quantify performance in accordance with the TARP Protocol for Stormwater Best Management Practice Demonstrations and NJDEP Tier II monitoring requirements. The Vortechs Stormwater Treatment System Model 4000 installed online at the Wawa Market Route 37 study site sized based on the New Jersey Water Quality Design Storm to treat a maximum water quality flow rate of 2.13 cfs and a peak flow of 2.4 cfs demonstrated suspended solids removal greater than 60% of particles with a d50 less than 100µm. The Vortechs Stormwater Treatment System Model 4000 also demonstrated the ability to remove greater than 80% of stormwater solids when the influent PSD is predominantly sand sized particles (50-2000 microns).

34
6. Net Environmental Benefit The Vortechs Stormwater Treatment System requires no input of raw materials, has no moving parts and therefore uses no water or energy other than that provided by stormwater runoff. During the 20-month monitoring period the mass of materials captured and retained by the Vortechs system was approximately 800 kg (1760 lbs). This material would otherwise have been released to the environment during runoff producing rain events. 7. References CONTECH Stormwater Solutions Inc. (CONTECH) (2008). Quality Assurance Project Plan for the Wawa Market Route 37 Vortechs Model 4000 Field Evaluation Portland, Oregon. New Jersey Department of Environmental Protection (NJDEP) (2006). New Jersey Tier II Stormwater Test Requirements—Amendments to TARP Tier II Protocol. Trenton, New Jersey. Available online: http://www.state.nj.us/dep/dsr/bscit/NJStormwater_TierII.pdf Technology Acceptance and Reciprocity Partnership (TARP) (2003). The Technology Acceptance Reciprocity Partnership Protocol for Stormwater Best Management Practice Demonstrations. Harrisburg, Pennsylvania. Available online: http://www.dep.state.pa.us/dep/deputate/pollprev/techservices/tarp/pdffiles/Tier2protocol.pdf United States Environmental Protection Agency (USEPA) (2002). Urban Stormwater BMP Performance Monitoring: A Guidance Manual for Meeting the National Stormwater BMP Database Requirements (EPA-821-B-02-001). Washington, D.C.: Available Online: http://epa.gov/waterscience/stormwater/montcomplete.pdf U.S. Geological Survey (USGS) (1980). Water Resources Division by Office of Water Quality (OWQ) Technical Memorandum No. 80.17 U.S. Geological Survey (USGS). (1991) U.S. Geological Survey, Techniques of Water-Resources Investigations Reston, Virginia. D.R. Helsel and R.M. Hirsch CONTECH Stormwater Solutions Inc. .(CONTECH) (2004) A Comparison of Methods to Determine the Particle Size Distribution of Solids in Stormwater Samples. Portland, Oregon. URS Greiner Woodward Clyde, Urban Drainage and Flood Control District, Urban Water Resources Research Council (UWRRC) of ASCE, Office of Water US Environmental Protection Agency (URS/EPA) (1999). Development of Performance Measures Task 3.1 – Technical Memorandum Determining Urban Stormwater Best Management Practice (BMP) Removal Efficiencies. Washington, D.C. Rutgers, The State University of New Jersey Department of Civil and Environmental Engineering, New Jersey Department of Environmental Protection Division of Science, Research and Technology. (Rutgers/NJDEP) (2006). Correlation of Total Suspended Solids (TSS) and Suspended Sediment Concentration (SSC) Test Methods: Trenton, Oregon: Qizhong (George) Guo.
35
APPENDIX A
INDIVIDUAL STORM REPORTS

36
General Information Site: Wawa Market Route 37 , ( Project #11517), Toms River, NJSystem Description: Vortechs 4000, 28 ft2 sediment storage capacity, design 2.40cfsEvent Date: 9/25/08Date of Last Maintenance: 9/19/08Antecedent Conditions: 59 hours since last rain event, 0.28”
Hydrology Total Precipitation (in): 3.60Peak Flow (gpm): 1047.00 (97% of design)Total Runoff Volume (gal): 76849.00 Vol. Coverage: 74%
Event Hydrograph
0
108
216
324
432
540
648
756
864
972
1080
9/25/0817:00
9/25/0819:00
9/25/0821:00
9/25/0823:00
9/26/081:00
9/26/083:00
9/26/085:00
9/26/087:00
9/26/089:00
9/26/0811:00
9/26/0813:00
9/26/0815:00
9/26/0817:00
Time (date hh:mm)
Q (
gp
m)
0.00
0.10
0.20
0.30
0.40
0.50
0.60
0.70
0.80
0.90
1.00
Pre
cip
ita
tio
n (
in)
Effluent Q Sample Set Taken 75% of design Precipitation
Analytical
Number of Aliquots: Influent EMC Effluent EMC MRL Dup. RPDIN/ EFF: 19 Coarse solids (mineral) 12 ND 0.2 20% 98%
Sand (mineral) 263 9 1.6 20% 97%Silt (mineral) 12.0 ND 1.6 20% 87%SSC 2095 17.7 1.6 3.37% 99%
TVSS 1800 11 0.2 20% 99%SSC (>2000-um) 55.1 ND 0.2 3.37% 100%SSC (<2000-um) 2040 17.5 1.6 3.37% 99%SSC (<500-um) 240 11.5 1.6 3.37% 95%
. SSC (<50-um) 13.5 3.3 1.6 3.37% 76%TVSS(>2000-um) 42.9 ND 0.2 3.37% 100%TVSS (<2000-um) 1765.0 6.8 1.6 20% 100%TVSS (<500-um) 35 3.9 1.6 20% 89%TVSS (<50-um) 1.5 1.8 1.6 20% undeterminableTSS (SM) 1810.0 19.7 4.0 9.7% 99%TSS (EPA) 376.0 22.7 4.0 12.2% 94%
Parameter Discrete Removal Efficiency
Concentrations (mg/L)
Notes
Peak flow and total runoff volume based on effluent flow measurements. Shaded RPD values defaulted to 20% standard due to QC complications. All samples passed through a 2000-um sieve prior to splitting. Underlined parameters are calculated: SSC defined as sum of SSC (>2000-um) and SSC (<2000-um); Sand defined as between 2000-um and 50-um; Silt defined as <50-um; SSC (>2000-um) calculated using estimated volume of sample used for composite (visual estimate of actual aliquot volume) and mass of material retained by the 2000-um sieve; mineral fraction determined through subtraction of volatile from total results.
37
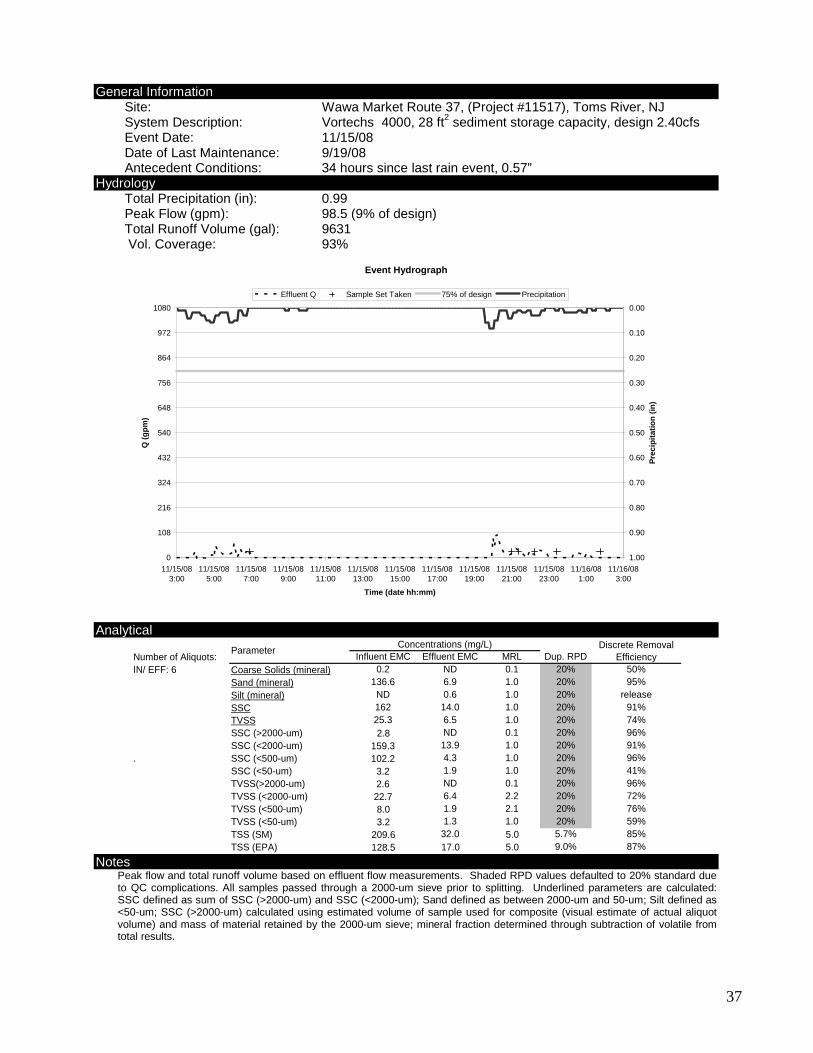
General Information Site: Wawa Market Route 37, (Project #11517), Toms River, NJ System Description: Vortechs 4000, 28 ft2 sediment storage capacity, design 2.40cfs Event Date: 11/15/08 Date of Last Maintenance: 9/19/08 Antecedent Conditions: 34 hours since last rain event, 0.57”
Hydrology Total Precipitation (in): 0.99 Peak Flow (gpm): 98.5 (9% of design) Total Runoff Volume (gal): 9631 Vol. Coverage: 93%
Analytical
Number of Aliquots: Influent EMC Effluent EMC MRL Dup. RPDIN/ EFF: 6 Coarse Solids (mineral) 0.2 ND 0.1 20% 50%
Sand (mineral) 136.6 6.9 1.0 20% 95%Silt (mineral) ND 0.6 1.0 20% releaseSSC 162 14.0 1.0 20% 91%
TVSS 25.3 6.5 1.0 20% 74%SSC (>2000-um) 2.8 ND 0.1 20% 96%SSC (<2000-um) 159.3 13.9 1.0 20% 91%
. SSC (<500-um) 102.2 4.3 1.0 20% 96%SSC (<50-um) 3.2 1.9 1.0 20% 41%TVSS(>2000-um) 2.6 ND 0.1 20% 96%TVSS (<2000-um) 22.7 6.4 2.2 20% 72%TVSS (<500-um) 8.0 1.9 2.1 20% 76%TVSS (<50-um) 3.2 1.3 1.0 20% 59%TSS (SM) 209.6 32.0 5.0 5.7% 85%TSS (EPA) 128.5 17.0 5.0 9.0% 87%
ParameterDiscrete Removal
EfficiencyConcentrations (mg/L)
Notes
Peak flow and total runoff volume based on effluent flow measurements. Shaded RPD values defaulted to 20% standard due to QC complications. All samples passed through a 2000-um sieve prior to splitting. Underlined parameters are calculated: SSC defined as sum of SSC (>2000-um) and SSC (<2000-um); Sand defined as between 2000-um and 50-um; Silt defined as <50-um; SSC (>2000-um) calculated using estimated volume of sample used for composite (visual estimate of actual aliquot volume) and mass of material retained by the 2000-um sieve; mineral fraction determined through subtraction of volatile from total results.
Event Hydrograph
0
108
216
324
432
540
648
756
864
972
1080
11/15/083:00
11/15/085:00
11/15/087:00
11/15/089:00
11/15/0811:00
11/15/0813:00
11/15/0815:00
11/15/0817:00
11/15/0819:00
11/15/0821:00
11/15/0823:00
11/16/081:00
11/16/083:00
Time (date hh:mm)
Q (
gp
m)
0.00
0.10
0.20
0.30
0.40
0.50
0.60
0.70
0.80
0.90
1.00
Pre
cip
itat
ion
(in
)
Effluent Q Sample Set Taken 75% of design Precipitation

38
General Information Site: Wawa Market Route 37, (Project #11517), Toms River, NJ System Description: Vortechs 4000, 28 ft2 sediment storage capacity, design 2.40cfs Event Date: 03/29/09 Date of Last Maintenance: 9/19/08 Antecedent Conditions: 33 hours since last rain event, 0.25”
Hydrology Total Precipitation (in): 0.56 Peak Flow (gpm): 285 (26% of design) Total Runoff Volume (gal): 10394 Vol. Coverage 87%
Analytical
Number of Aliquots: Influent EMC Effluent EMC MRL Dup. RPDIN/EFF: 6 Coarse solids (mineral) 16 ND 0.2 20% 99%
Sand (mineral) 641 44 1.6 20% 93%Silt (mineral) 50 44 1.6 20% undeterminableSSC 815 125 1.8 11.9% 85%
TVSS 108 37 1.8 20% 66%SSC (>2000-um) 33.6 ND 0.2 11.9% 99%SSC (<2000-um) 781 125 1.8 11.9% 84%SSC (<500-um) 290 109 1.8 11.9% 62%
. SSC (<100-um) 122 101 1.8 11.9% 17%SSC (<50-um) 69.7 64.6 1.8 11.9% undeterminableTVSS(>2000-um) 17.9 ND 0.2 20% 99%TVSS (<2000-um) 89.7 36.8 2.1 20% 59%TVSS (<500-um) 60.6 36.1 2.1 20% 40%TVSS (<100-um) 34.4 31.8 2.2 20% undeterminableTVSS (<50-um) 19.4 20.7 2.1 20% undeterminableTSS (SM) 238 120 5.0 20% 50%TSS (EPA) 192 114 5.0 20% 41%
ParameterDiscrete Removal
EfficiencyConcentrations (mg/L)
Notes
Peak flow and total runoff volume based on effluent flow measurements. Shaded RPD values defaulted to 20% standard due to QC complications. All samples passed through a 2000-um sieve prior to splitting. Underlined parameters are calculated: SSC defined as sum of SSC (>2000-um) and SSC (<2000-um); Sand defined as between 2000-um and 50-um; Silt defined as <50-um; SSC (>2000-um) calculated using estimated volume of sample used for composite (visual estimate of actual aliquot volume) and mass of material retained by the 2000-um sieve; mineral fraction determined through subtraction of volatile from total results.
Event Hydrograph
0
108
216
324
432
540
648
756
864
972
1080
3/29/090:00
3/29/091:00
3/29/092:00
3/29/093:00
3/29/094:00
3/29/095:00
3/29/096:00
3/29/097:00
3/29/098:00
3/29/099:00
3/29/0910:00
3/29/0911:00
3/29/0912:00
Time (date hh:mm)
Q (
gp
m)
0.00
0.10
0.20
0.30
0.40
0.50
0.60
0.70
0.80
0.90
1.00
Pre
cip
itat
ion
(in
)
Effluent Q Sample Set Taken 75% of design Precipitation

39
General Information Site: Wawa Market Route 37, (Project #11517), Toms River, NJ System Description: Vortechs 4000, 28 ft2 sediment storage capacity, design 2.40cfs Event Date: 04/03/09 Date of Last Maintenance: 9/19/08 Antecedent Conditions: 32 hours since last rain event, 0.38”
Hydrology Total Precipitation (in): 0.41 Peak Flow (gpm): 336 (31% of design) Total Runoff Volume (gal): 5020 Vol. Coverage: 80%
Analytical
Number of Aliquots: Influent EMC Effluent EMC MRL Dup. RPDIN/EFF: 8 Coarse solids (mineral) 6.6 ND 0.2 20% 97%
Sand (mineral) 132.8 64.2 1.6 20% 52%Silt (mineral) 19.5 36.3 1.6 20% releaseSSC 229.3 132.3 0.8 20% 42%
TVSS 70.4 31.6 0.8 20% 55%SSC (>2000-um) 13.7 1.3 0.1 20% 91%SSC (<2000-um) 215.6 131.0 0.8 20% 39%SSC (<500-um) 126.9 107.8 0.8 20% undeterminable
. SSC (<100-um) 84.6 93.5 0.8 20% undeterminableSSC (<50-um) 28.7 46.8 0.8 20% releaseTVSS(>2000-um) 7.1 1.1 0.1 20% 85%TVSS (<2000-um) 63.3 30.5 1.3 20% 52%TVSS (<500-um) 36.7 27.8 1.3 20% 24%TVSS (<100-um) 24.1 24.0 1.3 20% undeterminableTVSS (<50-um) 9.2 10.5 1.3 20% undeterminableTSS (SM) 186.3 126.5 5.0 15.3% 32%TSS (EPA) 186.8 137.0 4.0 16.3% 27%
ParameterDiscrete Removal
EfficiencyConcentrations (mg/L)
Notes
Peak flow and total runoff volume based on effluent flow measurements. Shaded RPD values defaulted to 20% standard due to QC complications. All samples passed through a 2000-um sieve prior to splitting. Underlined parameters are calculated: SSC defined as sum of SSC (>2000-um) and SSC (<2000-um); Sand defined as between 2000-um and 50-um; Silt defined as <50-um; SSC (>2000-um) calculated using estimated volume of sample used for composite (visual estimate of actual aliquot volume) and mass of material retained by the 2000-um sieve; mineral fraction determined through subtraction of volatile from total results.
Event Hydrograph
0
108
216
324
432
540
648
756
864
972
1080
4/3/092:00
4/3/093:00
4/3/094:00
4/3/095:00
4/3/096:00
4/3/097:00
4/3/098:00
4/3/099:00
4/3/0910:00
4/3/0911:00
4/3/0912:00
4/3/0913:00
4/3/0914:00
4/3/0915:00
Time (date hh:mm)
Q (
gp
m)
0.00
0.10
0.20
0.30
0.40
0.50
0.60
0.70
0.80
0.90
1.00
Pre
cip
itat
ion
(in
)
Effluent Q Sample Set Taken 75% of design Precipitation

40
General Information Site: Wawa Market Route 37, (Project #11517), Toms River, NJ System Description: Vortechs 4000, 28 ft2 sediment storage capacity, design 2.40cfs Event Date: 04/06/09 Date of Last Maintenance: 9/19/08 Antecedent Conditions: 80 hours since last rain event, 0.41”
Hydrology Total Precipitation (in): 0.66 Peak Flow (gpm): 96 (9% of design) Total Runoff Volume (gal): 12956 Vol. Coverage: 64%
Analytical
Number of Aliquots: Influent EMC Effluent EMC MRL Dup. RPDIN/ EF: 13 Coarse solids (mineral) 2.2 ND 0.1 20% 95%
Sand (mineral) 43.6 17.3 0.8 20% 60%Silt (mineral) 19.8 10.5 0.8 20% 47%SSC 68.1 30.3 0.8 20% 56%
TVSS 2.5 2.5 0.8 20% undeterminableSSC (>2000-um) 2.3 ND 0.1 7.2% 96%
. SSC (<2000-um) 65.8 30.2 0.8 7.2% 54%SSC (<500-um) 54.6 21.3 0.8 7.2% 61%SSC (<100-um) 30.3 19.8 0.8 7.2% 35%SSC (<50-um) 20.3 11.3 0.8 7.2% 44%TVSS(>2000-um) 0.1 ND 0.1 20% undeterminableTVSS (<2000-um) 2.4 2.4 0.8 20% undeterminableTVSS (<500-um) 1.1 1.5 0.8 20% releaseTVSS (<100-um) 0.7 1.3 0.8 20% releaseTVSS (<50-um) 0.5 0.8 0.8 20% releaseTSS (SM) 51.0 32.5 5.0 6.2% 36%TSS (EPA) 60.6 36.8 4.0 20% 39%
ParameterDiscrete Removal
EfficiencyConcentrations (mg/L)
Notes
Peak flow and total runoff volume based on effluent flow measurements. Shaded RPD values defaulted to 20% standard due to QC complications. All samples passed through a 2000-um sieve prior to splitting. Underlined parameters are calculated: SSC defined as sum of SSC (>2000-um) and SSC (<2000-um); Sand defined as between 2000-um and 50-um; Silt defined as <50-um; SSC (>2000-um) calculated using estimated volume of sample used for composite (visual estimate of actual aliquot volume) and mass of material retained by the 2000-um sieve; mineral fraction determined through subtraction of volatile from total results.
Event Hydrograph
0
108
216
324
432
540
648
756
864
972
1080
4/6/096:00
4/6/097:00
4/6/098:00
4/6/099:00
4/6/0910:00
4/6/0911:00
4/6/0912:00
4/6/0913:00
4/6/0914:00
4/6/0915:00
4/6/0916:00
4/6/0917:00
4/6/0918:00
4/6/0919:00
4/6/0920:00
4/6/0921:00
4/6/0922:00
4/6/0923:00
4/7/090:00
Time (date hh:mm)
Q (
gp
m)
0.00
0.10
0.20
0.30
0.40
0.50
0.60
0.70
0.80
0.90
1.00
Pre
cip
itat
ion
(in
)
Effluent Q Sample Set Taken 75% of design Precipitation

41
General Information Site: Wawa Market Route 37, (Project #11517), Toms River, NJ System Description: Vortechs 4000, 28 ft2 sediment storage capacity, design 2.40cfs Event Date: 04/11/09 Date of Last Maintenance: 9/19/08 Antecedent Conditions: 113 hours since last rain event, 0.66”
Hydrology Total Precipitation (in): 1.02 Peak Flow (gpm): 85 (8% of design) Total Runoff Volume (gal): 15755 Vol. Coverage: 89%
Analytical
Number of Aliquots: Influent EMC Effluent EMC MRL Dup. RPDIN/ EFF: 14 Coarse solids (mineral) 3.1 ND 0.1 20% 97%
Sand (mineral) 13.8 3.4 1.6 20% 75%Silt (mineral) 9.0 9.0 2.5 20% undeterminableSSC 53.0 16.4 0.6 8% 69%
TVSS 27.1 4.0 2.5 20% 85%SSC (>2000-um) 13.8 ND 0.1 8% 99%SSC (<2000-um) 39.2 16.3 0.6 8% 58%SSC (<500-um) 29.1 15.1 0.6 8% 48%
. SSC (<100-um) 26.1 11.6 0.6 8% 56%SSC (<50-um) 22.5 10.0 2.5 8% 56%TVSS(>2000-um) 10.7 ND 0.1 20% 99%TVSS (<2000-um) 16.4 3.9 0.6 20% 76%TVSS (<500-um) 14.7 2.7 0.6 20% 82%TVSS (<100-um) 13.8 1.6 0.6 20% 88%TVSS (<50-um) 13.5 1.0 0.6 20% 93%TSS (SM) 73.5 15.0 2.5 15.0% 80%TSS (EPA) 101.5 13.0 2.5 20% 87%
ParameterDiscrete Removal
EfficiencyConcentrations (mg/L)
Notes
Peak flow and total runoff volume based on effluent flow measurements. Shaded RPD values defaulted to 20% standard due to QC complications. All samples passed through a 2000-um sieve prior to splitting. Underlined parameters are calculated: SSC defined as sum of SSC (>2000-um) and SSC (<2000-um); Sand defined as between 2000-um and 50-um; Silt defined as <50-um; SSC (>2000-um) calculated using estimated volume of sample used for composite (visual estimate of actual aliquot volume) and mass of material retained by the 2000-um sieve; mineral fraction determined through subtraction of volatile from total results.
Event Hydrograph
0
108
216
324
432
540
648
756
864
972
1080
4/11/090:00
4/11/092:00
4/11/094:00
4/11/096:00
4/11/098:00
4/11/0910:00
4/11/0912:00
4/11/0914:00
4/11/0916:00
4/11/0918:00
4/11/0920:00
Time (date hh:mm)
Q (
gp
m)
0.00
0.10
0.20
0.30
0.40
0.50
0.60
0.70
0.80
0.90
1.00
Pre
cip
itat
ion
(in
)
Effluent Q Sample Set Taken 75% of design Precipitation

42
General Information Site: Wawa Market Route 37, (Project #11517), Toms River, NJ System Description: Vortechs 4000, 28 ft2 sediment storage capacity, design 2.40cfs Event Date: 6/08/09 Date of Last Maintenance: 9/19/08 Antecedent Conditions: 15 hours since last rain event, 0.09”
Hydrology Total Precipitation (in): 1.37 Peak Flow (gpm): 663 (62% of design) Total Runoff Volume (gal): 33569 Vol. Coverage: 66%
Analytical
Number of Aliquots: Influent EMC Effluent EMC MRL Dup. RPDIN/EFF: 22 Coarse solids (mineral) 20.4 ND 0.1 20% 100%
Sand (mineral) 194.7 23.7 2.5 20% 88%Silt (mineral) 37.9 8.4 2.5 20% 78%SSC 391.7 50.4 0.6 0.8% 87%
TVSS 138.7 18.2 0.6 20% 87%SSC (>2000-um) 67.7 0.5 0.1 0.8% 99%SSC (<2000-um) 324.0 49.9 0.6 0.8% 85%SSC (<500-um) 285.5 37.9 0.6 0.8% 87%
. SSC (<100-um) 84.7 30.4 0.6 0.8% 64%SSC (<50-um) 52.1 12.1 2.5 0.8% 77%TVSS(>2000-um) 47.3 0.4 0.1 20% 99%TVSS (<2000-um) 91.4 17.8 0.6 20% 81%TVSS (<500-um) 61.8 13.8 0.6 20% 78%TVSS (<100-um) 23.0 10.1 0.6 20% 56%TVSS (<50-um) 14.2 3.7 0.6 20% 74%TSS (SM) 199.0 46.0 2.5 20% 77%TSS (EPA) 146.4 43.5 2.5 20% 70%
ParameterDiscrete Removal
EfficiencyConcentrations (mg/L)
Notes
Peak flow and total runoff volume based on effluent flow measurements. Shaded RPD values defaulted to 20% standard due to QC complications. All samples passed through a 2000-um sieve prior to splitting. Underlined parameters are calculated: SSC defined as sum of SSC (>2000-um) and SSC (<2000-um); Sand defined as between 2000-um and 50-um; Silt defined as <50-um; SSC (>2000-um) calculated using estimated volume of sample used for composite (visual estimate of actual aliquot volume) and mass of material retained by the 2000-um sieve; mineral fraction determined through subtraction of volatile from total results.
Event Hydrograph
0
108
216
324
432
540
648
756
864
972
1080
6/8/0914:00
6/8/0916:00
6/8/0918:00
6/8/0920:00
6/8/0922:00
6/9/090:00
6/9/092:00
6/9/094:00
6/9/096:00
6/9/098:00
6/9/0910:00
6/9/0912:00
6/9/0914:00
Time (date hh:mm)
Q (
gp
m)
0.00
0.10
0.20
0.30
0.40
0.50
0.60
0.70
0.80
0.90
1.00
Pre
cip
itat
ion
(in
)
Effluent Q Sample Set Taken 75% of design Precipitation
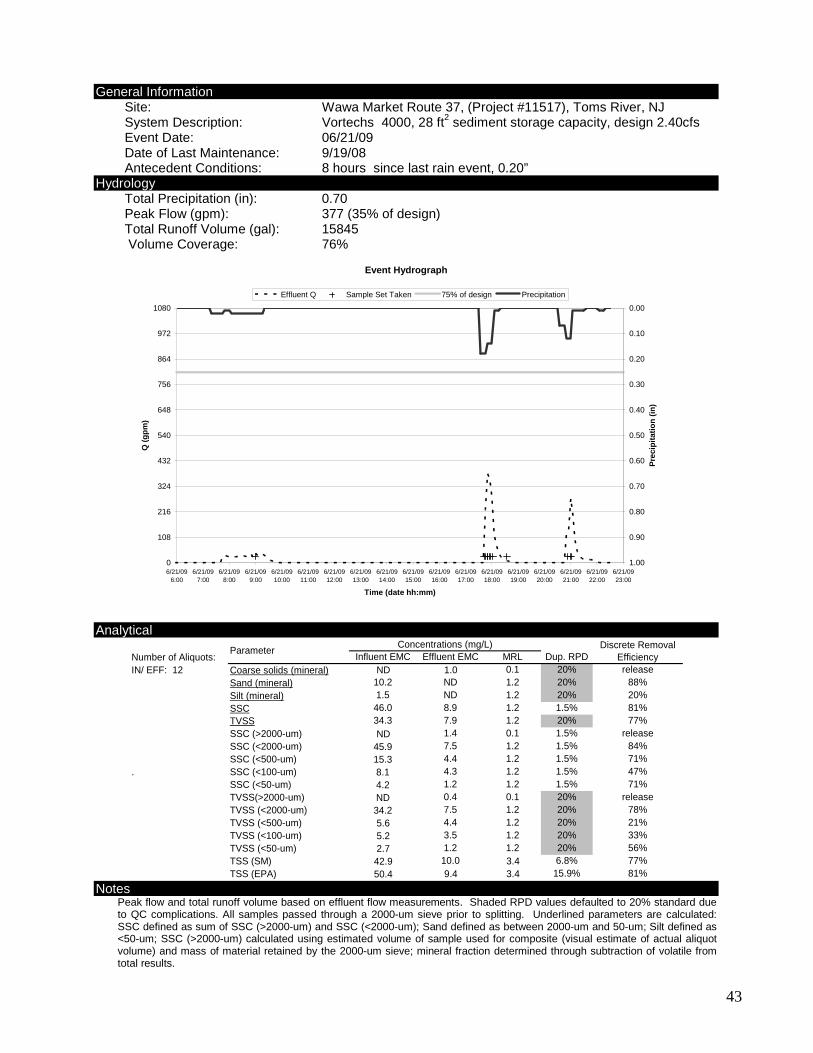
43
General Information Site: Wawa Market Route 37, (Project #11517), Toms River, NJ System Description: Vortechs 4000, 28 ft2 sediment storage capacity, design 2.40cfs Event Date: 06/21/09 Date of Last Maintenance: 9/19/08 Antecedent Conditions: 8 hours since last rain event, 0.20”
Hydrology Total Precipitation (in): 0.70 Peak Flow (gpm): 377 (35% of design) Total Runoff Volume (gal): 15845 Volume Coverage: 76%
Analytical
Number of Aliquots: Influent EMC Effluent EMC MRL Dup. RPDIN/ EFF: 12 Coarse solids (mineral) ND 1.0 0.1 20% release
Sand (mineral) 10.2 ND 1.2 20% 88%Silt (mineral) 1.5 ND 1.2 20% 20%SSC 46.0 8.9 1.2 1.5% 81%
TVSS 34.3 7.9 1.2 20% 77%SSC (>2000-um) ND 1.4 0.1 1.5% releaseSSC (<2000-um) 45.9 7.5 1.2 1.5% 84%SSC (<500-um) 15.3 4.4 1.2 1.5% 71%
. SSC (<100-um) 8.1 4.3 1.2 1.5% 47%SSC (<50-um) 4.2 1.2 1.2 1.5% 71%TVSS(>2000-um) ND 0.4 0.1 20% releaseTVSS (<2000-um) 34.2 7.5 1.2 20% 78%TVSS (<500-um) 5.6 4.4 1.2 20% 21%TVSS (<100-um) 5.2 3.5 1.2 20% 33%TVSS (<50-um) 2.7 1.2 1.2 20% 56%TSS (SM) 42.9 10.0 3.4 6.8% 77%TSS (EPA) 50.4 9.4 3.4 15.9% 81%
ParameterDiscrete Removal
EfficiencyConcentrations (mg/L)
Notes
Peak flow and total runoff volume based on effluent flow measurements. Shaded RPD values defaulted to 20% standard due to QC complications. All samples passed through a 2000-um sieve prior to splitting. Underlined parameters are calculated: SSC defined as sum of SSC (>2000-um) and SSC (<2000-um); Sand defined as between 2000-um and 50-um; Silt defined as <50-um; SSC (>2000-um) calculated using estimated volume of sample used for composite (visual estimate of actual aliquot volume) and mass of material retained by the 2000-um sieve; mineral fraction determined through subtraction of volatile from total results.
Event Hydrograph
0
108
216
324
432
540
648
756
864
972
1080
6/21/096:00
6/21/097:00
6/21/098:00
6/21/099:00
6/21/0910:00
6/21/0911:00
6/21/0912:00
6/21/0913:00
6/21/0914:00
6/21/0915:00
6/21/0916:00
6/21/0917:00
6/21/0918:00
6/21/0919:00
6/21/0920:00
6/21/0921:00
6/21/0922:00
6/21/0923:00
Time (date hh:mm)
Q (
gp
m)
0.00
0.10
0.20
0.30
0.40
0.50
0.60
0.70
0.80
0.90
1.00
Pre
cip
itat
ion
(in
)
Effluent Q Sample Set Taken 75% of design Precipitation

44
General Information Site: Wawa Market Route 37, (Project #11517), Toms River, NJ System Description: Vortechs 4000, 28 ft2 sediment storage capacity, design 2.40cfs Event Date: 07/12/09 Date of Last Maintenance: 9/19/08 Antecedent Conditions: 254 hours since last rain event, 0.20”
Hydrology Total Precipitation (in): 0.74 Peak Flow (gpm): 561 (52% of design) Total Runoff Volume (gal): 14869 Vol. Coverage: 91%
Analytical
Number of Aliquots: Influent EMC Effluent EMC MRL Dup. RPDIN/ EFF: 9 Coarse solids (mineral) 7.8 0.2 0.1 20% 97%
Sand (mineral) 49.9 11.7 1.2 20% 77%Silt (mineral) 21.5 2.3 1.2 20% 89%SSC 169.8 32.9 1.2 18.8% 81%
TVSS 90.6 18.7 1.2 20% 79%SSC (>2000-um) 39.1 1.0 0.1 18.8% 97%SSC (<2000-um) 130.7 31.9 1.2 18.8% 76%SSC (<500-um) 113.2 14.7 1.2 18.8% 87%
. SSC (<100-um) 76.3 12.3 1.2 18.8% 84%SSC (<50-um) 34.7 6.3 1.2 18.8% 82%TVSS(>2000-um) 31.3 0.8 0.1 20% 97%TVSS (<2000-um) 59.3 17.9 1.2 20% 70%TVSS (<500-um) 45.0 7.0 1.2 20% 84%TVSS (<100-um) NA 5.1 1.2 20% ---TVSS (<50-um) 13.2 4.0 1.2 20% 70%TSS (SM) 201.7 44.9 7.9 19.4% 78%TSS (EPA) 416.2 54.6 5.0 7.6% 87%
ParameterDiscrete Removal
EfficiencyConcentrations (mg/L)
Notes
Peak flow and total runoff volume based on effluent flow measurements. Shaded RPD values defaulted to 20% standard due to QC complications. All samples passed through a 2000-um sieve prior to splitting. Underlined parameters are calculated: SSC defined as sum of SSC (>2000-um) and SSC (<2000-um); Sand defined as between 2000-um and 50-um; Silt defined as <50-um; SSC (>2000-um) calculated using estimated volume of sample used for composite (visual estimate of actual aliquot volume) and mass of material retained by the 2000-um sieve; mineral fraction determined through subtraction of volatile from total results.
Event Hydrograph
0
108
216
324
432
540
648
756
864
972
1080
7/11/0920:00
7/11/0921:00
7/11/0922:00
7/11/0923:00
7/12/090:00
7/12/091:00
7/12/092:00
7/12/093:00
7/12/094:00
7/12/095:00
7/12/096:00
7/12/097:00
7/12/098:00
Time (date hh:mm)
Q (
gp
m)
0.00
0.10
0.20
0.30
0.40
0.50
0.60
0.70
0.80
0.90
1.00
Pre
cip
itat
ion
(in
)
Effluent Q Sample Set Taken 75% of design Precipitation

45
General Information Site: Wawa Market Route 37, (Project #11517), Toms River, NJ System Description: Vortechs 4000, 28 ft2 sediment storage capacity, design 2.40 cfs Event Date: 08/22/09Date of Last Maintenance: 9/19/08Antecedent Conditions: 8 hours since last rain event, 0.43”
Hydrology Total Precipitation (in): 0.91Peak Flow (gpm): 541 (50% of design) Total Runoff Volume (gal): 23077 Vol. Coverage: 87%
Analytical
Number of Aliquots: Influent EMC Effluent EMC MRL Dup. RPDIN/EFF: 10 Coarse solids (mineral) 16.5 ND 0.1 20% 99%
Sand (mineral) 173.9 4.1 1.2 20% 98%Silt (mineral) 16.0 3.0 1.2 20% 81%SSC 317 13 1.2 20% 96%
TVSS 111 6 1.2 20% 95%SSC (>2000-um) 47 0.2 0.1 20% 100%SSC (<2000-um) 270 12.9 1.2 20% 95%SSC (<500-um) 225 12.5 1.2 20% 94%
. SSC (<100-um) 43.5 7.9 1.2 20% 82%SSC (<50-um) 25 5.3 1.2 20% 79%TVSS(>2000-um) 30.5 0.1 0.1 20% 100%TVSS (<2000-um) 80.1 5.8 1.2 20% 93%TVSS (<500-um) 38.5 6.1 1.2 20% 84%TVSS (<100-um) 13.6 NT 1.2 20% ---TVSS (<50-um) 9.0 2.3 1.2 20% 74%TSS (SM) 56 9.1 7.9 20% 84%TSS (EPA) 154 12.8 5.0 20% 92%
Parameter Discrete Removal Efficiency
Concentrations (mg/L)
Notes
Peak flow and total runoff volume based on effluent flow measurements. Shaded RPD values defaulted to 20% standard due to QC complications. All samples passed through a 2000-um sieve prior to splitting. Underlined parameters are calculated: SSC defined as sum of SSC (>2000-um) and SSC (<2000-um); Sand defined as between 2000-um and 50-um; Silt defined as <50-um; SSC (>2000-um) calculated using estimated volume of sample used for composite (visual estimate of actual aliquot volume) and mass of material retained by the 2000-um sieve; mineral fraction determined through subtraction of volatile from total results.
Event Hydrograph
0
108
216
324
432
540
648
756
864
972
1080
8/21/0922:00
8/21/0923:00
8/22/090:00
8/22/091:00
8/22/092:00
8/22/093:00
8/22/094:00
8/22/095:00
8/22/096:00
8/22/097:00
8/22/098:00
8/22/099:00
8/22/0910:00
Time (date hh:mm)
Q (
gp
m)
0.00
0.10
0.20
0.30
0.40
0.50
0.60
0.70
0.80
0.90
1.00
Pre
cip
itat
ion
(in
)
Effluent Q Sample Set Taken 75% of design Precipitation

46
General Information Site: Wawa Market Route 37, (Project #11517), Toms River, NJ System Description: Vortechs 4000, 28 ft2 sediment storage capacity, design 2.40 cfs Event Date: 09/10/09 Date of Last Maintenance: 09/19/08 Antecedent Conditions: 280 hours since last rain event, 0.92”
Hydrology Total Precipitation (in): 2.51 Peak Flow (gpm): 471 (44% of design) Total Runoff Volume (gal): 53031 Vol. Coverage: 87%
Analytical
Number of Aliquots: Influent EMC Effluent EMC MRL Dup. RPDIN/ EFF: 23 Coarse solids (mineral) 31.8 ND 0.1 20% 100%
Sand (mineral) 108.7 1.7 1.2 20% 98%Silt (mineral) 9.3 2.6 1.2 20% 72%SSC 302 9.3 1.2 3.1% 97%
TVSS 153 5.0 1.2 20% 97%SSC (>2000-um) 79.3 ND 0.1 3.1% 100%SSC (<2000-um) 223 9.2 1.2 3.1% 96%SSC (<500-um) 124 8.6 1.2 3.1% 93%
. SSC (<100-um) 46.7 7.3 1.2 3.1% 84%SSC (<50-um) 18.8 4.4 1.2 3.1% 77%TVSS(>2000-um) 47.5 ND 0.1 20% 100%TVSS (<2000-um) 105 4.9 1.2 20% 95%TVSS (<500-um) 45.1 5.4 1.2 20% 88%TVSS (<100-um) 17.4 4.4 1.2 20% 75%TVSS (<50-um) 9.5 1.8 1.2 20% 81%TSS (SM) 92.4 6.5 7.9 20% 93%TSS (EPA) 137 10.7 5.0 19.1% 92%
ParameterDiscrete Removal
EfficiencyConcentrations (mg/L)
Notes
Peak flow and total runoff volume based on effluent flow measurements. Shaded RPD values defaulted to 20% standard due to QC complications. All samples passed through a 2000-um sieve prior to splitting. Underlined parameters are calculated: SSC defined as sum of SSC (>2000-um) and SSC (<2000-um); Sand defined as between 2000-um and 50-um; Silt defined as <50-um; SSC (>2000-um) calculated using estimated volume of sample used for composite (visual estimate of actual aliquot volume) and mass of material retained by the 2000-um sieve; mineral fraction determined through subtraction of volatile from total results.
Event Hydrograph
0
108
216
324
432
540
648
756
864
972
1080
9/10/0914:00
9/10/0916:00
9/10/0918:00
9/10/0920:00
9/10/0922:00
9/11/090:00
9/11/092:00
9/11/094:00
9/11/096:00
9/11/098:00
9/11/0910:00
9/11/0912:00
Time (date hh:mm)
Q (
gp
m)
0.00
0.10
0.20
0.30
0.40
0.50
0.60
0.70
0.80
0.90
1.00
Pre
cip
ita
tio
n (
in)
Effluent Q Sample Set Taken 75% of design Precipitation

47
General Information Site: Wawa Market Route 37, (Project #11517), Toms River, NJ System Description: Vortechs 4000, 28 ft2 sediment storage capacity, design 2.40 cfs Event Date: 09/24/09 Date of Last Maintenance: 09/19/08 Antecedent Conditions: 15 hours since last rain event, 0.06”
Hydrology Total Precipitation (in): 0.47 Peak Flow (gpm): 354 (33% of design) Total Runoff Volume (gal): 10873 Vol. Coverage: 83%
Analytical
Number of Aliquots: Influent EMC Effluent EMC MRL Dup. RPDIN/EFF: 9 Coarse solids (mineral) 2.9 ND 0.1 20% 97%
Sand (mineral) ND 5.5 1.2 20% releaseSilt (mineral) 2.6 ND 1.2 20% 54%SSC 39.5 6.1 1.2 2.8% 85%
TVSS 34.2 3.9 1.2 20% 89%SSC (>2000-um) 6.8 0.1 0.1 2.8% 99%SSC (<2000-um) 32.7 6.0 1.2 2.8% 82%SSC (<500-um) 21.5 3.8 1.2 2.8% 82%
. SSC (<100-um) 7.5 3.5 1.2 2.8% 53%SSC (<50-um) 7.1 0.9 1.2 2.8% 87%TVSS(>2000-um) 3.9 0.1 0.1 20% 97%TVSS (<2000-um) 30.3 3.8 1.2 20% 87%TVSS (<500-um) 9.2 2.4 1.2 20% 74%TVSS (<100-um) 3.5 3.5 1.2 20% undeterminableTVSS (<50-um) 4.5 4.2 1.2 20% undeterminableTSS (SM) 30.8 3.8 7.9 20% 88%TSS (EPA) 29.3 5.0 5.0 3.1% 83%
ParameterDiscrete Removal
EfficiencyConcentrations (mg/L)
Notes
Peak flow and total runoff volume based on effluent flow measurements. Shaded RPD values defaulted to 20% standard due to QC complications. All samples passed through a 2000-um sieve prior to splitting. Underlined parameters are calculated: SSC defined as sum of SSC (>2000-um) and SSC (<2000-um); Sand defined as between 2000-um and 50-um; Silt defined as <50-um; SSC (>2000-um) calculated using estimated volume of sample used for composite (visual estimate of actual aliquot volume) and mass of material retained by the 2000-um sieve; mineral fraction determined through subtraction of volatile from total results.
Event Hydrograph
0
108
216
324
432
540
648
756
864
972
1080
9/23/0920:00
9/23/0921:00
9/23/0922:00
9/23/0923:00
9/24/090:00
9/24/091:00
9/24/092:00
9/24/093:00
9/24/094:00
9/24/095:00
9/24/096:00
9/24/097:00
9/24/098:00
Time (date hh:mm)
Q (
gp
m)
0.00
0.10
0.20
0.30
0.40
0.50
0.60
0.70
0.80
0.90
1.00
Pre
cip
itat
ion
(in
)
Effluent Q Sample Set Taken 75% of design Precipitation
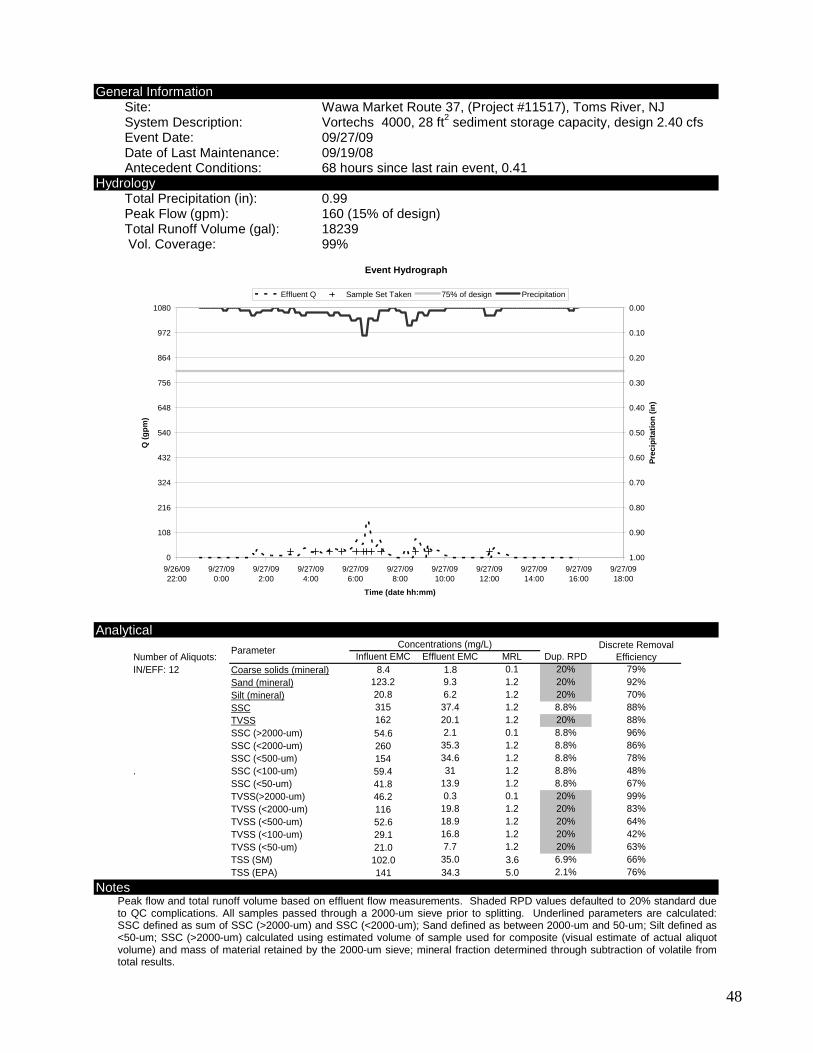
48
General Information Site: Wawa Market Route 37, (Project #11517), Toms River, NJ System Description: Vortechs 4000, 28 ft2 sediment storage capacity, design 2.40 cfs Event Date: 09/27/09 Date of Last Maintenance: 09/19/08 Antecedent Conditions: 68 hours since last rain event, 0.41
Hydrology Total Precipitation (in): 0.99 Peak Flow (gpm): 160 (15% of design) Total Runoff Volume (gal): 18239 Vol. Coverage: 99%
Analytical
Number of Aliquots: Influent EMC Effluent EMC MRL Dup. RPDIN/EFF: 12 Coarse solids (mineral) 8.4 1.8 0.1 20% 79%
Sand (mineral) 123.2 9.3 1.2 20% 92%Silt (mineral) 20.8 6.2 1.2 20% 70%SSC 315 37.4 1.2 8.8% 88%
TVSS 162 20.1 1.2 20% 88%SSC (>2000-um) 54.6 2.1 0.1 8.8% 96%SSC (<2000-um) 260 35.3 1.2 8.8% 86%SSC (<500-um) 154 34.6 1.2 8.8% 78%
. SSC (<100-um) 59.4 31 1.2 8.8% 48%SSC (<50-um) 41.8 13.9 1.2 8.8% 67%TVSS(>2000-um) 46.2 0.3 0.1 20% 99%TVSS (<2000-um) 116 19.8 1.2 20% 83%TVSS (<500-um) 52.6 18.9 1.2 20% 64%TVSS (<100-um) 29.1 16.8 1.2 20% 42%TVSS (<50-um) 21.0 7.7 1.2 20% 63%TSS (SM) 102.0 35.0 3.6 6.9% 66%TSS (EPA) 141 34.3 5.0 2.1% 76%
ParameterDiscrete Removal
EfficiencyConcentrations (mg/L)
Notes
Peak flow and total runoff volume based on effluent flow measurements. Shaded RPD values defaulted to 20% standard due to QC complications. All samples passed through a 2000-um sieve prior to splitting. Underlined parameters are calculated: SSC defined as sum of SSC (>2000-um) and SSC (<2000-um); Sand defined as between 2000-um and 50-um; Silt defined as <50-um; SSC (>2000-um) calculated using estimated volume of sample used for composite (visual estimate of actual aliquot volume) and mass of material retained by the 2000-um sieve; mineral fraction determined through subtraction of volatile from total results.
Event Hydrograph
0
108
216
324
432
540
648
756
864
972
1080
9/26/0922:00
9/27/090:00
9/27/092:00
9/27/094:00
9/27/096:00
9/27/098:00
9/27/0910:00
9/27/0912:00
9/27/0914:00
9/27/0916:00
9/27/0918:00
Time (date hh:mm)
Q (
gp
m)
0.00
0.10
0.20
0.30
0.40
0.50
0.60
0.70
0.80
0.90
1.00
Pre
cip
itat
ion
(in
)
Effluent Q Sample Set Taken 75% of design Precipitation

49
General Information Site: Wawa Market Route 37, (Project #11517), Toms River, NJ System Description: Vortechs 4000, 28 ft2 sediment storage capacity, design 2.40 cfs Event Date: 10/03/09 Date of Last Maintenance: 09/19/08 Antecedent Conditions: 102 hours since last rain event, 0.05”
Hydrology Total Precipitation (in): 0.57 Peak Flow (gpm): 381 (35% of design) Total Runoff Volume (gal): 11439 Vol. Coverage: 79%
Analytical
Number of Aliquots: Influent EMC Effluent EMC MRL Dup. RPDIN/ EFF: 9 Coarse solids (mineral) 9.1 ND 1 20% 89%
Sand (mineral) 102.5 6.7 1.2 20% 93%Silt (mineral) 15.7 6.7 1.2 20% 57%SSC 256 28.0 1.1 12.4% 89%
TVSS 128 13.8 1.2 20% 89%SSC (>2000-um) 49.7 ND 1.0 12.4% 98%SSC (<2000-um) 206 27.0 1.1 12.4% 87%SSC (<500-um) 116 24.8 1.1 12.4% 79%
. SSC (<100-um) 38.1 19.4 1.1 12.4% 49%SSC (<50-um) 27.7 10.0 1.1 12.4% 64%TVSS(>2000-um) 40.6 0.2 0.1 20% 100%TVSS (<2000-um) 87.8 13.6 1.2 20% 85%TVSS (<500-um) 38.1 12.9 1.2 20% 66%TVSS (<100-um) 15.7 10.6 1.2 20% 32%TVSS (<50-um) 12.0 3.3 1.2 20% 73%TSS (SM) 81.7 24.1 3.6 20% 71%TSS (EPA) 62 27.1 3.6 20% 56%
Parameter Discrete Removal Efficiency
Concentrations (mg/L)
Notes
Peak flow and total runoff volume based on effluent flow measurements. Shaded RPD values defaulted to 20% standard due to QC complications. All samples passed through a 2000-um sieve prior to splitting. Underlined parameters are calculated: SSC defined as sum of SSC (>2000-um) and SSC (<2000-um); Sand defined as between 2000-um and 50-um; Silt defined as <50-um; SSC (>2000-um) calculated using estimated volume of sample used for composite (visual estimate of actual aliquot volume) and mass of material retained by the 2000-um sieve; mineral fraction determined through subtraction of volatile from total results.
Event Hydrograph
0
108
216
324
432
540
648
756
864
972
1080
10/3/090:00
10/3/091:00
10/3/092:00
10/3/093:00
10/3/094:00
10/3/095:00
10/3/096:00
10/3/097:00
10/3/098:00
10/3/099:00
10/3/0910:00
10/3/0911:00
10/3/0912:00
Time (date hh:mm)
Q (
gp
m)
0.00
0.10
0.20
0.30
0.40
0.50
0.60
0.70
0.80
0.90
1.00
Pre
cip
itat
ion
(in
)
Effluent Q Sample Set Taken 75% of design Precipitation

50
General Information Site: Wawa Market Route 37, (Project #11517), Toms River, NJ System Description: Vortechs 4000, 28 ft2 sediment storage capacity, design 2.40cfs Event Date: 12/02/09 Date of Last Maintenance: 9/19/08 Antecedent Conditions: 44 Hours since last rain event, 0.30”
Hydrology Total Precipitation (in): 1.87 Peak Flow (gpm): 641 (59% of design) Total Runoff Volume (gal): 49664 Vol. Coverage: 81%
Analytical
Number of Aliquots: Influent EMC Effluent EMC MRL Dup. RPDIN/ EFF: 20 Coarse solids (mineral) 3.9 ND 0.05 20% 99%
Sand (mineral) 52.3 2.9 0.5 20% 94%Silt (mineral) 3.9 1.7 0.5 20% 56%SSC 164 11.7 0.5 6.5% 93%
TVSS 103 6.1 0.5 20% 94%SSC (>2000-um) 21.5 1.14 0.05 6.5% 95%SSC (<2000-um) 142 10.6 0.5 6.5% 93%SSC (<500-um) 64.6 9.4 0.5 6.5% 85%
. SSC (<100-um) 20.4 5.5 0.5 6.5% 73%SSC (<50-um) 7.8 3.8 0.5 6.5% 51%TVSS(>2000-um) 17.6 1.10 0.05 20% 94%TVSS (<2000-um) 85.8 6 0.5 20% 93%TVSS (<500-um) 28.2 4.8 0.5 20% 83%TVSS (<100-um) 8.7 2.6 0.5 20% 70%TVSS (<50-um) 3.9 2.1 0.5 20% 46%TSS (SM) 48.0 7.0 3.1 10.4% 85%TSS (EPA) 119 7.5 3.1 2.5% 94%
ParameterDiscrete Removal
EfficiencyConcentrations (mg/L)
Notes
Peak flow and total runoff volume based on effluent flow measurements. Shaded RPD values defaulted to 20% standard due to QC complications. All samples passed through a 2000-um sieve prior to splitting. Underlined parameters are calculated: SSC defined as sum of SSC (>2000-um) and SSC (<2000-um). SSC (>2000-um) calculated using estimated volume of sample used for composite (visual estimate of actual aliquot volume) and mass of material retained by the 2000-um sieve.
Event Hydrograph
0
108
216
324
432
540
648
756
864
972
1080
12/2/0916:00
12/2/0918:00
12/2/0920:00
12/2/0922:00
12/3/090:00
12/3/092:00
12/3/094:00
12/3/096:00
12/3/098:00
12/3/0910:00
12/3/0912:00
Time (date hh:mm)
Q (
gp
m)
0.00
0.10
0.20
0.30
0.40
0.50
0.60
0.70
0.80
0.90
1.00
Pre
cip
itat
ion
(in
)
Effluent Q Sample Set Taken 75% of design Precipitation

51
General Information Site: Wawa Market Route 37, (Project #11517), Toms River, NJ System Description: Vortechs 4000, 28 ft2 sediment storage capacity, design 2.40cfs Event Date: 12/09/09 Date of Last Maintenance: 9/19/08 Antecedent Conditions: 75 Hours since last rain event, 0.95”
Hydrology Total Precipitation (in): 2.22 Peak Flow (gpm): 840 (78% of design) 20 64853 Vol. Coverage: 77%
Analytical
Number of Aliquots: Influent EMC Effluent EMC MRL Dup. RPDIN/EFF: 20 Coarse solids (mineral) 2.2 ND 0.05 20% 98%
Sand (mineral) 88.3 3.9 0.5 20% 96%Silt (mineral) 7.5 3.2 0.5 20% 57%SSC 292 12.7 0.5 3.7% 96%
TVSS 194 5.6 0.5 20% 97%SSC (>2000-um) 17.1 0.18 0.05 3.7% 99%SSC (<2000-um) 275 12.5 0.5 3.7% 95%SSC (<500-um) 100 10.8 0.5 3.7% 89%
. SSC (<100-um) 27.3 8.7 0.5 3.7% 68%SSC (<50-um) 14.6 5.3 0.5 3.7% 64%TVSS(>2000-um) 14.9 0.17 0.05 20% 99%TVSS (<2000-um) 179.2 5.4 0.5 20% 97%TVSS (<500-um) 49.2 5.1 0.5 20% 90%TVSS (<100-um) 10.9 4.1 0.5 20% 62%TVSS (<50-um) 7.1 2.1 0.5 20% 70%TSS (SM) 128.0 12.0 3.6 8.6% 91%TSS (EPA) 225 17.6 3.6 21.3% 92%
Parameter Discrete Removal Efficiency
Concentrations (mg/L)
Notes
Peak flow and total runoff volume based on effluent flow measurements. Shaded RPD values defaulted to 20% standard due to QC complications. All samples passed through a 2000-um sieve prior to splitting. Underlined parameters are calculated: SSC defined as sum of SSC (>2000-um) and SSC (<2000-um); Sand defined as between 2000-um and 50-um; Silt defined as <50-um; SSC (>2000-um) calculated using estimated volume of sample used for composite (visual estimate of actual aliquot volume) and mass of material retained by the 2000-um sieve; mineral fraction determined through subtraction of volatile from total results.
Event Hydrograph
0
108
216
324
432
540
648
756
864
972
1080
12/9/090:00
12/9/091:00
12/9/092:00
12/9/093:00
12/9/094:00
12/9/095:00
12/9/096:00
12/9/097:00
12/9/098:00
12/9/099:00
12/9/0910:00
12/9/0911:00
12/9/0912:00
Time (date hh:mm)
Q (
gp
m)
0.00
0.10
0.20
0.30
0.40
0.50
0.60
0.70
0.80
0.90
1.00
Pre
cip
itat
ion
(in
)
Effluent Q Sample Set Taken 75% of design Precipitation

52
General Information Site: Wawa Market Route 37, (Project #11517), Toms River, NJ System Description: Vortechs 4000, 28 ft2 sediment storage capacity, design 2.40 cfs Event Date: 01/25/10 Date of Last Maintenance: 09/19/08 Antecedent Conditions: 163 hours since last rain event, 1.37”
Hydrology Total Precipitation (in): 1.28 Peak Flow (gpm): 326 (30% of design) Total Runoff Volume (gal): 21921 Vol. Coverage: 73%
Analytical
Number of Aliquots: Influent EMC Effluent EMC MRL Dup. RPDIN/ EFF:8 Coarse solids (mineral) 27.3 ND 0.10 20% 100%
Sand (mineral) 70.1 2.3 1.0 20% 97%Silt (mineral) 251.9 23.6 1.0 20% 91%SSC 531 42.2 1.0 5.6% 92%
TVSS 181 16.3 1.0 20% 91%SSC (>2000-um) 50.6 0.12 0.10 5.6% 100%SSC (<2000-um) 480 42.1 1.0 5.6% 91%SSC (<500-um) 319 29.5 1.0 5.6% 91%
. SSC (<100-um) 144 33.6 1.0 5.6% 77%SSC (<50-um) 281 28.8 1.0 5.6% 90%TVSS(>2000-um) 23.3 ND 0.10 20% 100%TVSS (<2000-um) 158 16.2 1.0 20% 90%TVSS (<500-um) 84.9 10.2 1.0 20% 88%TVSS (<100-um) 44.2 10.2 1.0 20% 77%TVSS (<50-um) 29.1 5.2 1.0 20% 82%TSS (SM) 161 39.1 3.6 3.1% 76%TSS (EPA) 290 50.7 3.6 16.6% 83%
ParameterDiscrete Removal
EfficiencyConcentrations (mg/L)
Notes
Peak flow and total runoff volume based on effluent flow measurements. Shaded RPD values defaulted to 20% standard due to QC complications. All samples passed through a 2000-um sieve prior to splitting. Underlined parameters are calculated: SSC defined as sum of SSC (>2000-um) and SSC (<2000-um); Sand defined as between 2000-um and 50-um; Silt defined as <50-um; SSC (>2000-um) calculated using estimated volume of sample used for composite (visual estimate of actual aliquot volume) and mass of material retained by the 2000-um sieve; mineral fraction determined through subtraction of volatile from total results.
Event Hydrograph
0
108
216
324
432
540
648
756
864
972
1080
1/25/106:00
1/25/107:00
1/25/108:00
1/25/109:00
1/25/1010:00
1/25/1011:00
1/25/1012:00
1/25/1013:00
1/25/1014:00
1/25/1015:00
1/25/1016:00
1/25/1017:00
1/25/1018:00
1/25/1019:00
1/25/1020:00
Time (date hh:mm)
Q (
gp
m)
0.00
0.10
0.20
0.30
0.40
0.50
0.60
0.70
0.80
0.90
1.00
Pre
cip
itat
ion
(in
)
Effluent Q Sample Set Taken 75% of design Precipitation
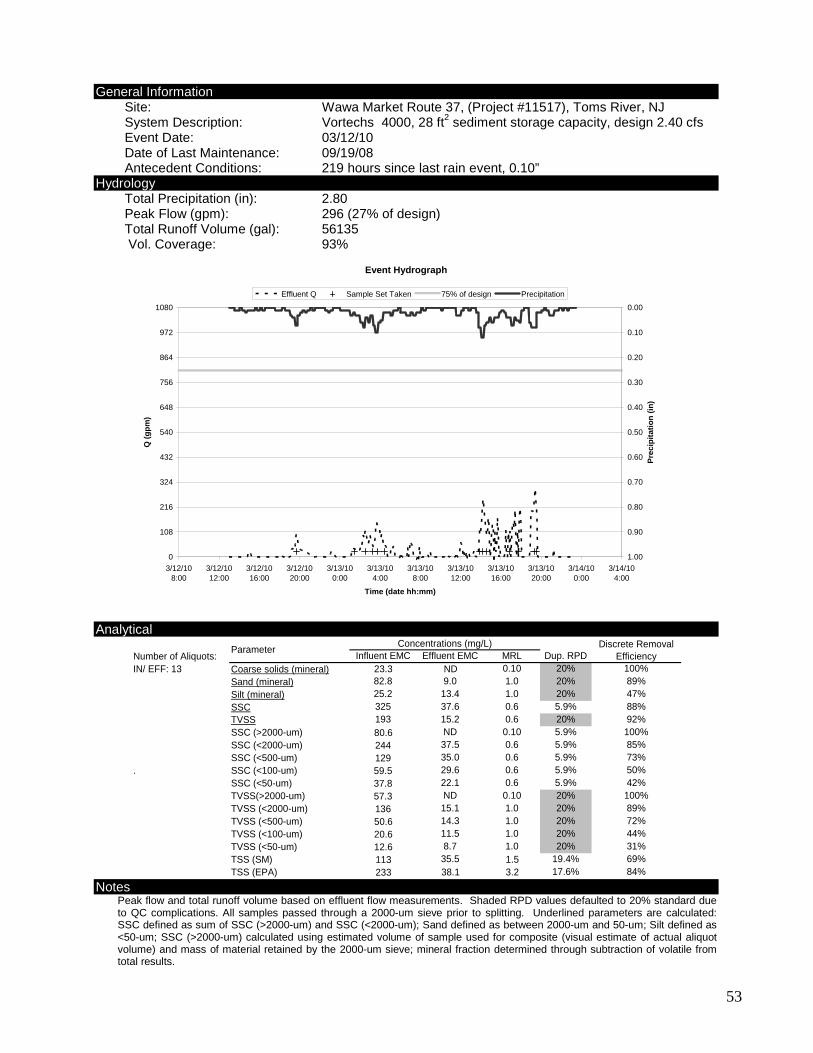
53
General Information Site: Wawa Market Route 37, (Project #11517), Toms River, NJ System Description: Vortechs 4000, 28 ft2 sediment storage capacity, design 2.40 cfs Event Date: 03/12/10 Date of Last Maintenance: 09/19/08 Antecedent Conditions: 219 hours since last rain event, 0.10”
Hydrology Total Precipitation (in): 2.80 Peak Flow (gpm): 296 (27% of design) Total Runoff Volume (gal): 56135 Vol. Coverage: 93%
Analytical
Number of Aliquots: Influent EMC Effluent EMC MRL Dup. RPDIN/ EFF: 13 Coarse solids (mineral) 23.3 ND 0.10 20% 100%
Sand (mineral) 82.8 9.0 1.0 20% 89%Silt (mineral) 25.2 13.4 1.0 20% 47%SSC 325 37.6 0.6 5.9% 88%
TVSS 193 15.2 0.6 20% 92%SSC (>2000-um) 80.6 ND 0.10 5.9% 100%SSC (<2000-um) 244 37.5 0.6 5.9% 85%SSC (<500-um) 129 35.0 0.6 5.9% 73%
. SSC (<100-um) 59.5 29.6 0.6 5.9% 50%SSC (<50-um) 37.8 22.1 0.6 5.9% 42%TVSS(>2000-um) 57.3 ND 0.10 20% 100%TVSS (<2000-um) 136 15.1 1.0 20% 89%TVSS (<500-um) 50.6 14.3 1.0 20% 72%TVSS (<100-um) 20.6 11.5 1.0 20% 44%TVSS (<50-um) 12.6 8.7 1.0 20% 31%TSS (SM) 113 35.5 1.5 19.4% 69%TSS (EPA) 233 38.1 3.2 17.6% 84%
ParameterDiscrete Removal
EfficiencyConcentrations (mg/L)
Notes
Peak flow and total runoff volume based on effluent flow measurements. Shaded RPD values defaulted to 20% standard due to QC complications. All samples passed through a 2000-um sieve prior to splitting. Underlined parameters are calculated: SSC defined as sum of SSC (>2000-um) and SSC (<2000-um); Sand defined as between 2000-um and 50-um; Silt defined as <50-um; SSC (>2000-um) calculated using estimated volume of sample used for composite (visual estimate of actual aliquot volume) and mass of material retained by the 2000-um sieve; mineral fraction determined through subtraction of volatile from total results.
Event Hydrograph
0
108
216
324
432
540
648
756
864
972
1080
3/12/108:00
3/12/1012:00
3/12/1016:00
3/12/1020:00
3/13/100:00
3/13/104:00
3/13/108:00
3/13/1012:00
3/13/1016:00
3/13/1020:00
3/14/100:00
3/14/104:00
Time (date hh:mm)
Q (
gp
m)
0.00
0.10
0.20
0.30
0.40
0.50
0.60
0.70
0.80
0.90
1.00
Pre
cip
itat
ion
(in
)
Effluent Q Sample Set Taken 75% of design Precipitation