nitrogen nutrition of rice plants measured by growth and
TRANSCRIPT

Neth. J. agric. Sei. 20 (1972) 133—144
Nitrogen nutrition of rice plants measured by growth and nutrient content in pot experiments. 3. Changes during growth
W. Dijkshoorn and M. Ismunadji1
Institute for Biological and Chemical Research on Field Crops and Herbage, Wagenin-gen, the Netherlands
Received: 24 March 1972
Summary
Young rice plants in flooded sand culture grew better with ammonium than with nitrate as the N source. Difference in yield was initiated by a higher rate of tillering and leaf expansion in ammonium nutrition during the first stage of exponential growth. When the foliage canopy was full, and the further gain in dry matter was linearly related to growth duration, nitrate was less readily assimilated than ammonium. But then growth rate was the same for both forms of N in the supply, because it was mainly controlled by the closed crop surface and nutrient supply, rather than by leaf area, form of available N, and concentration of N in the tissues.
Restoration of N to a depleted culture of well developed plants showed that ammonium effected an earlier renewal of growth so that on ammonium medium the plants yielded more at the same date than on nitrate medium, although they finally regained the same rate of linear growth.
On nitrate medium the plants contained more carboxylate than on ammonium medium, irrespective of age and temporary shortage of N.
Introduction
In a previous experiment (Ismunadji and Dijkshoorn, 1971) growth duration was 35 days and yield of whole plants ranged from 20 to 30 g DM/pot (4 plants per pot). Judged visually, the foliage canopy was incomplete for most of the time. Light penetrated to the underlying ground, and the leaves of new tillers were presumably enabled to contribute to photosynthesis. With the increase in plant size growth was enhanced, and plant size increased with time exponentially.
This continued until the totalled shoot length was 8 m/plant, or 32 m/pot. From then, a break in the curve for log shoot length against time indicated a fall in relative growth rate.
To translate shoot length into dry weight, DM proportions in harvestable parts were estimated. The results were: for tops 0.4 g DM/m; for whole plants 0.8 g DM/m; for shoots 0.6 g DM/m of totalled shoot length.
The suggestion was that when, for instance the yield of shoots was 32 X 0.6 =
1 Present address: Central Research Institute for Agriculture, Bogor, Indonesia.
133

W. DIJKSHOORN AND M. ISMUNADJI
about 20 g DM/pot, the relative rate of growth fell through self-shading due to completion of the foliage canopy.
The present work deals with the effect of ammonium and nitrate in subsequent stages of growth continuing into the later phase where plant size changed the light climate, DM gain was linearly related to growth duration, tillering stopped, and material partitioned to storage tissues in the stems.
Experimental
Conversion of ammonium into nitrate in the medium was prevented by keeping the sand permanently waterlogged. Loss of nitrate by denitrification was not involved since the used sand was free from organic matter (Ismunadji and Dijkshoorn, 1971).
If 40 meq N/pot was applied at one time, about 30 meq remained available to the plants and the remainder was consumed by algae. This will permit growth of only 12 g DM of adequate N concentration. If more nutrients were added to satisfy the later need of larger and older plants, the young plants appeared to suffer from osmotic stress. A great improvement was effected by adding stepwise nutrient salts each time the supply was nearly exhausted. With sequential harvests of replicates, records of dry weights combined with presumed values of adequate nutrient concentration in the plant material permitted rough estimates of the requirements at each instant. By replacing every time as much as the plants might have removed by uptake, and some excess to account for consumption by algae, the plants could be kept in a steady state of supply. Plant analysis at the conclusion of the trial showed that the nutrients supplied replaced the losses by uptake.
Young rice seedlings were more sensitive than older ones to higher osmotic concentrations of nutrients. If grown for more than one week after sowing it was necessary to nurse them with a nutrient solution. Otherwise, the starved seedlings did not grow well when transferred to the experimental pots.
The following practical procedures were indicated by the findings above. Seeds of the variety IR-5 were soaked in water for two days and germinated in moist sand. After one week, the sand was subirrigated with a dilute Hoagland solution with nitrate as the N-source. When two weeks old the seedlings were selected for uniformity and transplanted to the experimental pots.
The pots (diameter 20 cm) were filled with 7.5 kg of coarse sand free from organic
Table 1. Supply of nutrient ions in meq/pot; a: added before planting f: totalled successive supplements.
Nitrate Ammonium
a f a f
NH4 + K + 40
20 20 40 20 23
200 100 470 470
40 260
40 40 20 20
470 200 100 40
Mg + + Ca + + NO:)-H2PO4-so4= 20
100 40
770
134 Neth, J. agric. Sei. 20 (1972)
NITROGEN NUTRITION OF RICE PLANTS. 3
matter. Measured amounts of normal solutions of the nutrient salts and trace elements were added with enough water to saturate the sand. Another 1 kg of sand was placed on top of the fertilised sand, and more water was added to 0.5 cm above the sand.
This advance application of nutrient ions is listed in Table 1 under column a. In column f it is totalled with the later supplements made stepwise during growth of the plants.
Each pot received four similar-sized seedlings. The pots were placed in rows, alternating between ammonium and nitrate nutrition and spaced at 10 cm, in a greenhouse thermostated between 25° and 30° C. By frequent watering the sand was kept submerged, and with the increase in plant size the water level was raised to 3 cm above the sand.
Thirty-two days after transplanting sufficient pots were harvested to obtain at least 15 g DM for analysis. The pots were selected by drawing lots in order to effect a random sampling. Other pots were harvested at one-week intervals up to 102 days after transplanting. Each time the pots were rearranged to maintain spacing.
The plants were divided into shoots and roots by cutting near the root base. The shoots differed from the tops harvested in the previous experiment by their greater proportion of stem tissue.
The roots were washed in tap water, but the dried samples often contained much sand (up to 60 %) so that they did not call for detailed interpretation. Corrected for sand, they contained about 25 °/o of the DM in whole plants.
For N a modified Kjeldahl method was used to include all nitrate-N. Organic N wan obtained by subtracting meq nitrate from total N expressed as meq of the nitrogenous ion absorbed, and is expressed as meq organic N.
Results and discussion
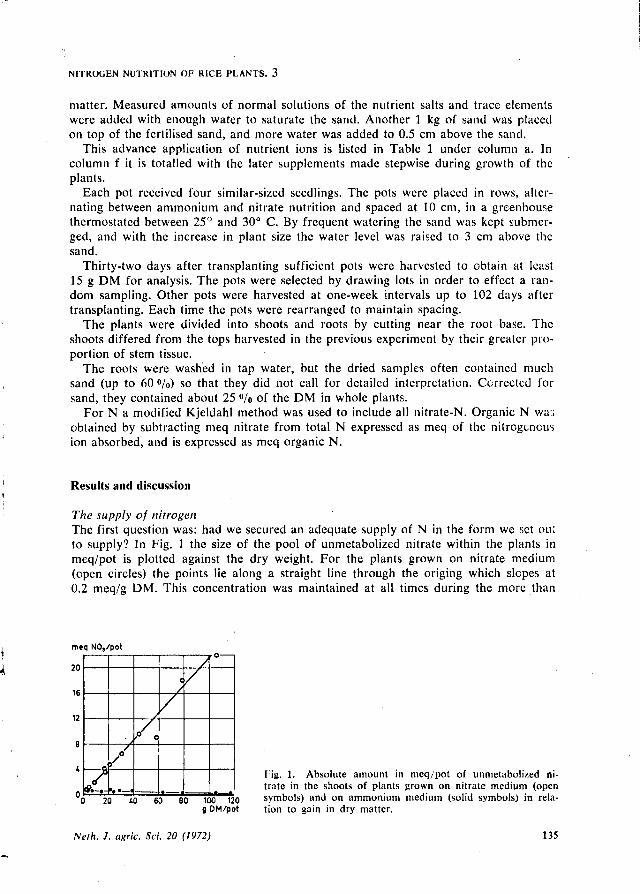
The supply of nitrogen The first question was: had we secured an adequate supply of N in the form we set ou; to supply? In Fig. 1 the size of the pool of unmetabolized nitrate within the plants in meq/pot is plotted against the dry weight. For the plants grown on nitrate medium (open circles) the points lie along a straight line through the origing which slopes at 0.2 meq/g DM. This concentration was maintained at all times during the more than
meq NOj/pot
/ •0
<
A / / /] X
n
0 20 40 60 80 100 120 g DM/pot
Fig. 1. Absolute amount in meq/pot of unmetabolized nitrate in the shoots of plants grown on nitrate medium (open symbols) and on ammonium medium (solid symbols) in relation to gain in dry matter.
Neth. J. agric. Sei. 20 (1972) 135

W. DIJKSHOORN AND M. 1SMUNADJI
twenty-fold increase in DM. Apparently, nitrate consumed by metabolism was continuously restored by uptake, and the supply was surplus to the need of the plants at all stages of growth.
The plants on ammonium medium contained nitrate furnished by the nutrient solution used to raise the seedlings. Their nitrate pool diminished when synthesis of organic N was further delegated to uptake and consumption of ammonium, but rather slowly because ammonium could readily supply the metabolic demand for nitrogen and was economizing on assimilation of the residual nitrate within the plants.
As expected in the light of earlier work, there was no indication of nitrification, and no detectable loss of nitrate by denitrification.
Growth characteristics Records were kept of plant height and tiller number. Again, the product (m/pot) was used as a rough measure of plant size, and is further called total shoot length. Its relation to DM was graphically evaluated, and the slope of the curves showed that at first whole plants contained 0.8 g DM/m. But the older plants gained much more in DM than in shoot length.
From the relation between tiller count and DM it was concluded that ammonium yielded more tillers and more DM, but increased tillering relatively more than DM production compared with nitrate. The graphs could be split up into two zones: an earlier one of structural growth with increase in tiller number, and a later one of storage with increase in tiller dry weight. Their transition was marked by a considerable change in the slope of the curves located at a shoot weight of about 25 g DM/pot.
On nitrate medium tillers were fewer and heavier than in ammonium nutrition because unexposed developing tillers remained packed in the leaf sheaths for a longer time on nitrate, and were not counted until segregated from the stems.
There was a more rapid exposure of young tillers when ammonium was supplied instead of nitrate. If grown for a time on the treated pots, the plants on ammonium medium displayed a greater leaf area and gained more in DM than those on nitrate medium.
The growth curves (Fig. 2), plotted as g dried shoots against growth duration, were at
g DM/pot 160
1— / 1—
/ / y )
Jl / 7 ' / y
/ / / C / v y v Ar
/ • / /
•
? kv; ? D 1
32 46 60 74 102 days
Fig. 2. Growth curves in nitrate nutrition (open circles) and in ammonium nutrition (solid circles), in g DM/pot (4 plants per pot). Open squares: same for single plants (g DM/ pot; one plant per pot) grown at wider spacing on Hoagland nutrient solution. All data for shoots from sequential harvests of replicates, time in days after transplanting of two-week old seedlings to the experimental pots. Judged visually all plants remained in the vegetative stage, no shooting was observed.
136 Neth. J. agric. Sei. 20 (1972)

NITROGEN NUTRITION OF RICE PLANTS. 3
first in the form of ascending curves, indicating that the heavier the plants got the greater was the weight increment per unit time. But in older plants with more than 30 g DM/pot the further gain in DM was linearly related to growth duration.
From the graph it appeared that the difference between treatments was established during the first period of structural growth until' at 30 g DM/pot, self-shading of the leaves must have imposed a limitation, and form of N was no longer of importance to the rate of growth. The curves suggest that with still longer growth duration yield response to form of N would have diminished to an unmeasurable size relative to plant weight. This would confirm scattered evidence that, as a nutrient, ammonium is superior to nitrate only for young rice plants.
The influence of plant density is well illustrated by the open squares in Fig. 22. They represent increase in DM of single more widely spaced plants in larger pots with a continued supply of Hoagland soltion with nitrate as the N source. The wider spacing permitted the plants to make many more tillers during a longer period of structural growth. The close dependence of growth on the light-intercepting efficiency of the leaf area resulted in the single plants in nitrate nutrition yielding more per plant than the four plants together in ammonium nutrition in sand culture and the much closer spacing. When at 30 g DM/pot the foliage canopy was closed, growth continued linearly at the same rate, irrespective of substrate, plant number, spacing, and source of N, as shown by the parallel straight sections of the curves.
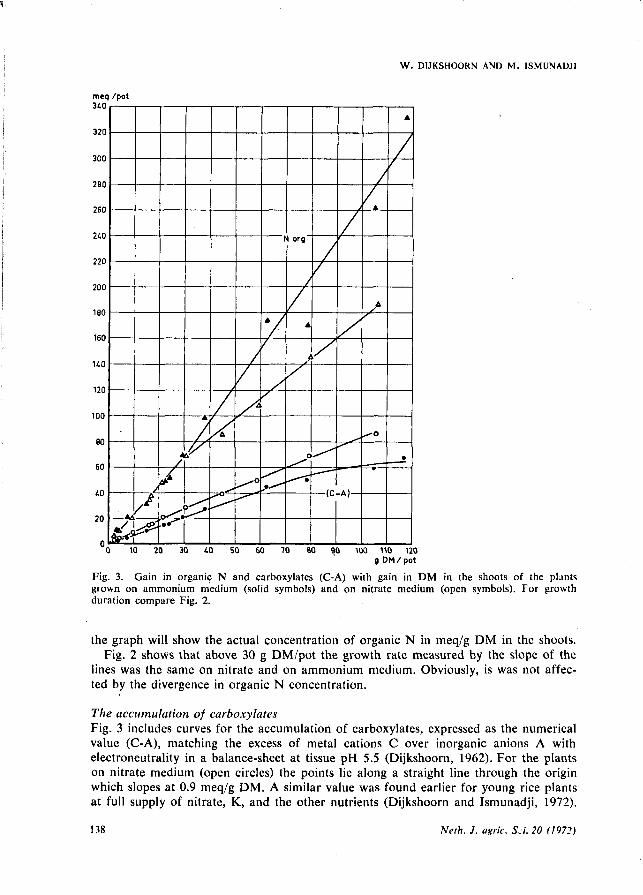
The production of organic nitrogen Accumulation of organic N and DM is presented in Fig. 3. The solid symbols are of the ammonium medium, the open symbols of the nitrate medium. Near the origin the points lie along the same concentration line of 2.4 meq/g DM. At first, plants in ammonium nutrition contained more DM, but also proportionately more organic N when compared with nitrate at the same growth duration, so that concentration of organic N
' in the dry matter was independent of form of N in the supply. This situation continued until the yield was 30g DM/pot. From then, a marked decrease in the rate of nitrate assimilation caused a fall in the slope of the curve for gain in organic N from absorbed nitrate (open triangles in Fig. 3). The changed slope then indicated 1.6 meq/g DM for further synthesis of organic N from absorbed nitrate for new growth. The rate of incorporation of ammonium remained unchanged at 2.4 meq/g DM. The slight increase in the slope of the line is too small in relation to measurement errors (solid triangles) to be considered as a true departure from linearity.
How can this fall in relative rate of nitrate metabolism be explained? From the foregoing evidence shortage in supply had to be exculded. Apparently, self-shading imposed a greater limitation to nitrate assimilation than to net photosynthesis, and the further
» gain in organic N was diminished relative to DM production. If this amounts to what k the curves show, the fall in rate of nitrate metabolism should be regarded as another
effect of self-shading due to completion of the foliage canopy. In the case of ammonium, light would affect its utilization only via net photosynthe
sis. Here, gain in organic N would be entirely controlled by gain in DM, independent of change in light climate by self-shading.
This seems to fit in well with scattered findings of higher N concentrations in plants supplied with ammonium instead of nitrate.
The relationship of Fig. 3 illustrates a continuous fall in the concentration of organic N when the yield had risen to above 30 g DM/pot on nitrate medium. For each stage the slope of a straight line drawn through the corresponding point and the origin of
Neth. J. agric. Sei. 20 (1972) 137
W. DIJKSHOORN AND M. ISMUNAÜJ1
Fig. 3. Gain in organic N and carboxylates (C-A) with gain in DM in the shoots of the plants grown on ammonium medium (solid symbols) and on nitrate medium (open symbols). For growth duration compare Fig. 2.
the graph will show the actual concentration of organic N in meq/g DM in the shoots. Fig. 2 shows that above 30 g DM/pot the growth rate measured by the slope of the
lines was the same on nitrate and on ammonium medium. Obviously, is was not affected by the divergence in organic N concentration.
The accumulation of carboxylates Fig. 3 includes curves for the accumulation of carboxylates, expressed as the numerical value (C-A), matching the excess of metal cations C over inorganic anions A with electroneutrality in a balance-sheet at tissue pH 5.5 (Dijkshoorn, 1962). For the plants on nitrate medium (open circles) the points lie along a straight line through the origin which slopes at 0.9 meq/g DM. A similar value was found earlier for young rice plants at full supply of nitrate, K, and the other nutrients (Dijkshoorn and Ismunadji, 1972).
138 Neih. J. auric. S.i. 20 (1972)

NITROGEN NUTRITION OF RICE PLANTS. 3
Above 30 g DM/pot accumulation was slightly retarded, and the small change in the slope, hardly visible on the scale of the graph, coincided on the DM scale with the break in the curve for organic N.
In nitrate nutrition carboxylates originate from metabolic consumption of nitrates and sulphates of the metal cations transferred to the leaves by the xylem system. This implies that each nitrate anion equivalent consumed by metabolism is replaced by one carboxylate anion equivalent. Compared with nitrate, sulphate metabolism contributes to only 6 °/o, so that it seems justified to assume that organic N, if expressed as meq nitrate consumed for its production, is the direct measure of production of carboxylates (Dijkshoorn, 1970).
In gramineous plants about half of the carboxylates produced by the leaves goes to the roots by phloem transfer and is there decarboxylated and released to the medium as bicarbonate. The gain in titratable alkalinity in the medium (measured by back-titra-tion of standard acid added in excess) should be equal to the difference between meq organic N produced and meq (C-A) retained by the plants. This difference is the overproduction of carboxylates, released to the medium in the form of bicarbonates of metal cations.
In Fig. 4 accumulation of (C-A) in the plants is plotted against meq organic N produced during growth. In the nitrate plants a ratio of 0.45 was maintained over the wide range of nitrate assimilation. Hence the close relation between (C-A) and organic N illustrated by Fig. 3.
With ammonium there is no direct relation between organic N and carboxylate production. Metal cations C plus ammonium are absorbed in great excess of the nutrient anions chloride, phosphate and sulphate. Uptake of bicarbonate along with the ions from the medium could easily account for electroneutrality of transfer of the great excess of nutrient cations moving into the plant.
The balance sheet of uptake of cations and anions in ammonium nutrition showed a cation excess great enough to accommodate the bicarbonate required to completely
meq (C-A)/pot HO
120
100
80
60
£0
20
0 0 £0 80 120 160 200 240 280 320 360 £00 U0 £80
meq N org /pot
Fig. 4. Relation between accumulation of carboxylates (C-A) and of organic N during growth on ammonium medium (solid symbols) and on nitrate medium (open symbols).
/ o /
/
/ •
/
••
Neth, J. agiic. Sei. 20 (1972) 139

W. DIJKSHOORN AND M. JSMUNADJI
neutralise the H+ released by conversion of ammonium into organic N, wirtten as (NHs) to indicate that in a chemical sense organic N is substituted ammonia: NH4+ + HCÖ7-*- (NHs) + H20 + C02
and, in addition, to balance part of the metal cations C left positive by metabolism and converted into carboxylates: K+ + HCOl + RH -* K+ + RCOO~+ HaO where RH is some metabolite subject to carboxylation. This would be the metabolic source of carboxylates when ammonium acts as the N source.
Little thought may bring to light other possible mechanisms which are less dependent on available bicarbonate. The reasoning above has the advantage of one-way traffic of the ions involved. It implies that bicarbonate uptake equals organic N plus (C-A). The bicarbonate is furnished by dissociation of carbonic acid in the medium. If NH4CI was nutrient salt, and NH4+ absorbed along with HCO3-, the H+ from the weak carbonic acid would be left in the medium in balance with the unabsorbed Ch Thus the weak carbonic acid is replaced by the strong hydrochloric acid. The same reasoning can be applied to the mixture of salts of the stronger mineral acids applied as a nutrient solution, and leads to the conclusion that the titratable acidity accumulating in a medium containing ammonium should be equal to organic N plus (C-A) within the plants grown on it, if sulphate metabolism is again neglected.
The relationship between plant composition and the magnitude of the external alkaline effect with nitrate or the external acidic effect with ammonium as the N-source will be the same for any other proposed mechanism if the rules for electroneutrality of ion uptake and metabolism are applied in the right manner. We have simply taken the facts and tried to use them in the construction of a convenient model.
Fig. 3 shows that on nitrate medium the plants had at all times a higher (C-A) concentration than on ammonium medium. During the initial phase (C-A) was 0.9 meq/g DM with nitrate and 0.7 meq/g DM with ammonium. It seems improbable that this small difference in (C-A) would be the direct cause of the difference in growth. The observations suggest that the yield effect will have to be looked for in that region of plant metabolism which controls the rate of tillering and leaf expansion.
The change in the level of metal cations On current assumptions the uptake system for cations is an adsorption system restricted in number of adsorption sites and capacity of transfer from the medium into the plant. Accessible to all cations it will adsorb one kind of cation more readily than another, and will transfer more of it than of the one which is less readily adsorbed.
If a cation is added of still higher affinity there will be less chance that the other cations will find waiting for them unoccupied sites, and their rate of uptake will be disproportionately diminished.
This model is often applicable to uptake of metal cations where one substitutes for the other in the medium with no change in the total quantity absorbed (de Wit et al., 1963).
In the present experiment uptake of total cations from the medium containing nitrate rose to 140 meq/pot. From the ammonium medium absorption of cations, including ammonium, rose to 460 meq/pot at the conclusion of the experiment (Fig. 4 and 5). When nitrate was replaced by ammonium, cation uptake increased three-fold.
To rescue the model from this difficulty it is usual to assume a second system. In the present case this would be a system specific for ammonium and inactive in its absence.
140 Neth. J. agric. Sei. 20 (1972)

NITROGEN NUTRITION OF RICE PLANTS. 3
Fig. 5. Quantity of metal cations (C = K + Na + Mg + Ca) and of DM in the shoots for ammonium (solid symbols) and for nitrate (open symbols) as the N source. The crosses show accumulation of inorganic anions (A = NO3 + Cl + H2PO4 + SOi) left negative by metabolism. Form of N in the medium had no influence on sum of anions A.
Fig. 5 shows that substitution of ammonium for nitrate reduced uptake of metal cations C by about 15 °/o when compared at the same yield of DM, meaning a reduction in concentration of C in the dried shoots of 15 %. Compared at the same data of harvesting, absorption was equal but the plants on ammonium medium contained more DM.
0 20 40 60 80 100 120 HO 160 180 200 m«q C/pot
Fig. 6. Accumulation of K and Mg in the shoots against totalled metal cations C during growth on ammonium (solid symbols) and nitrate (open symbols) containing media.
Neth. J. agiic. Sei. 20 (1972) 141
W. DIJKSHOORN AND M. ISMUNADJI
An attempt to account for this would be to state that some ammonium had shared the other uptake system with the metal cations C, and reduced their uptake by competition. Among the cations concerned, ammonium and K are allied and there is scattered evidence on competition between the two. From this it would seem that K would be mainly involved. If only K should compete with ammonium, uptake of K would have decreased by 15 meq at the uptake level of 100 meq C with increased uptake of other metal cations. But Fig. 6 shows that substitution of ammonium for nitrate as the N source caused no measurable change in proportion of metal cations. Therefore, it seems more reasonable to relate the increased concentration of metal cations C in the plants grown on nitrate medium via the cation-anion balance to their much greater uptake of nutrient anions which increased three-fold when nitrate replaced ammonium as the N-source.
On nitrate medium unmetabolised nitrate contributed to the inorganic anions A in the plants. Its absence in the plants grown on ammonium medium was balanced by an increased accumulation of sulphate and phosphate with no change in the concentration of inorganic anions A in the dry matter (Fig. 5).
Temporary shortage of nitrogen At the time of the first restoration of the nutrient supply (45 days after transplanting) a number of pots were arranged in another block of rows, and received no supplement of nutrients until 81 days after transplanting. All that had been supplied was the 40 meq N/pot (with the other nutrients in the proportion of Table 1, column a) of which 20 meq was presumably available to the tops of the plants if partition of N within the plants and consumption by algae was accounted for (Ismunadji and Dijkshoorn, 1971).
Yield was low, growth had stopped and yield response to form of N was no longer measurable, since shortage of N as such was a major limitation to growth. The tops of the plants contained 17 meq N/pot at the low concentration of 0.9 meq N/g DM, and no nitrate. Some bottom leaves had died off from starvation and were removed before sampling.
At that time, viz 81 days after transplanting, the nutrient supply was restored by adding 140 meq N/pot, and 19 days later, another 140 meq N/pot. Form of N and proportion of other nutrients were the same as applied in advance.
From then pots were harvested at short intervals of two or four days. In this series, tops were harvested by cutting at a height of 7 cm above the sand, instead of collecting shoots as in Fig. 3. Tops contained about 65 % of DM in shoots.
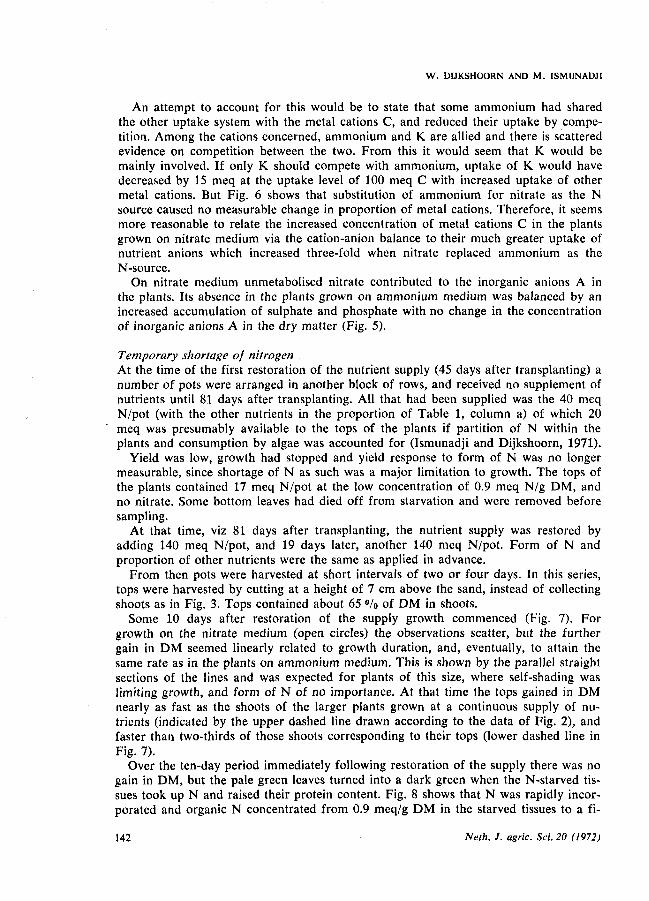
Some 10 days after restoration of the supply growth commenced (Fig. 7). For growth on the nitrate medium (open circles) the observations scatter, but the further gain in DM seemed linearly related to growth duration, and, eventually, to attain the same rate as in the plants on ammonium medium. This is shown by the parallel straight sections of the lines and was expected for plants of this size, where self-shading was limiting growth, and form of N of no importance. At that time the tops gained in DM nearly as fast as the shoots of the larger plants grown at a continuous supply of nutrients (indicated by the upper dashed line drawn according to the data of Fig. 2), and faster than two-thirds of those shoots corresponding to their tops (lower dashed line in Fig. 7).
Over the ten-day period immediately following restoration of the supply there was no gain in DM, but the pale green leaves turned into a dark green when the N-starved tissues took up N and raised their protein content. Fig. 8 shows that N was rapidly incorporated and organic N concentrated from 0.9 meq/g DM in the starved tissues to a fi-
142 Nelh. J. agric. Sei. 20 (1972)

NITROGEN NUTRITION OF RICE PLANTS. 3
g DM/pot
/
/ /
s/ /
/ »
/
/ / /
/ •
v' t / /
/ 0 /
/ /
« / / /
/ I G/°
/
81 91 101 111 121 131 days
Fig. 7. Gain in dry matter of tops of N-starved plants following restoration of supply with ammonium (solid symbols) or nitrate (open (symbols). Supply was restored 81 days after transplanting when growth had stopped from starvation. The dashed line s refers to shoots of plants with continuous supply of ammonium, taken from Fig. 2, the dashed line t is two-thirds of s to illustrate growth of tops at steady supply.
Fig. 8. Accumulation of organic N and carboxylates (C-A) in meq/pot in the tops of the previously N-starved plants following the restoration of ammonium (solid symbols) and nitrate (open symbols), against yield in g DM/pot. Triangles: organic N; circles: (C-A). The dashed proportionality lines of constant concentrations refer to the final state found for the other form of N, and are drawn to facilitate comparison.
Neth. J. agric. Sei. 20 (1972) 143

W. DIJKSHOORN AND M. 1SMUNADJI
nal concentration of 2.4 meq N/g DM on ammonium medium, and 2.0 meq N/g DM on nitrate medium. From then, growth acquired a steady state yielding organic N and DM in proportion at constant concentration in the dried tops.
Although the nature of the growth was somewhat obscured by dispersion of the points for growth on nitrate medium (Fig. 7), the higher organic-N concentration effected by ammonium seemed of no influence on the final growth rate when the growth curves were linear in form and parallel to each other. But the slower response to supplying N-starved plants with nitrate made that, later, these plants yielded less DM than the plants on ammonium medium at the same date of harvesting.
Immediately following the restoration of nitrate the concentration of carboxylates (C-A) rose to 0.9 meq/g DM and this concentration was further maintained. On ammonium medium the plants continued to accumulate (C-A) at the low concentration of 0.5 meq/g DM (Fig. 8). Between forms of N in the supply a similar difference in plant composition was established as found for continuous supply, but with no effect on the final rate of growth because this was controlled by the same proportions of total available light that were completely intercepted by the closed, similar-sized canopies of leaves on both media.
References
Dijkshoorn, W., 1962. Metabolic regulation of the alkaline effect of nitrate utilization in plants. Nature, Land. 194: 165—167.
Dijkshoorn, W., 1970. Partition of ionic constituents between organs. Proc. 6th Int. Colloq. PL Anal. Fertil. Prob}. (Tel-Aviv) 447—476.
Dijkshoorn, W. & M. Ismunadji, 1972. Nitrogen nutrition of rice plants measured by growth and nutrient content in pot experiments. 2. Uptake of ammonium and nitrate from a waterlogged soil. Neth. J. agric. Sei. 20: 44—57.
Ismunadji, M. & W. Dijkshoorn, 1971. Nitrogen nutrition of rice plants measured by growth and nutrient content in pot experiments. 1. Ionic balance and selective uptake. Neth. J. agric. Sei. 19: 223—236.
Wit, C. T. de, W. Dijkshoorn & J. C. Noggle, 1963. Ionic balance and growth of plants. Agric. Res. Rep., Wageningen 69. 15: pp. 68.
144 Neth. J. agric. Sei. 20 (1972)