nitrogen concentration responses to drought in …...biologically available nitrogen could result in...
TRANSCRIPT
Bud Dillard Nitrogen Responses to Drought Spring 2015
1
Nitrogen Concentration Responses to Drought in Sagehen Creek, California
Bud Dillard
ABSTRACT
Nitrogen is a limiting nutrient in freshwater systems. Relative concentrations of nitrogen species
can determine the productivity of local and downstream ecosystems. In this study, I explored how
total nitrogen concentrations and combined nitrate and nitrite concentrations responded to drought
conditions in an upland creek. To do this, I compared the temporal variability of nitrogen
concentrations during drought years and in years with adequate precipitation levels. I performed
an analysis of covariance to determine if data grouped by drought and non-drought conditions were
significantly different. While total nitrogen concentrations did not significantly change between
drought years and non-drought years, I found nitrate and nitrate concentration trends to be
significantly altered during drought conditions. Specifically, I observed an increase in the
variability in nitrogen concentrations, with maximum concentrations reaching as high as double
the maximum of nitrate and nitrite during non-drought years. To determine dominant predictors of
nitrate and nitrate concentrations, I performed multivariable linear regression. The results indicated
that gage height and water temperature were significant predictor variables of nitrate and nitrite
concentrations in the system. Contrary to established literature, I found that elevated nitrate and
nitrate concentrations occurred in cold water temperatures and low flow conditions. This finding
suggests that inhibited microbial denitrification coupled with decreased flow and disrupted stream
connectivity could result in elevated nitrate and nitrite concentrations. As the occurrence and
severity of droughts could increase, low flow conditions may become more frequent, thereby
disturbing stream nutrient dynamics and ecosystem productivity.
KEYWORDS
nitrogen cycling, water quality, multivariable regression, solute chemistry, freshwater ecology
Bud Dillard Nitrogen Responses to Drought Spring 2015
2
INTRODUCTION
Solute nutrients are vital components for primary productivity in freshwater ecosystems
(Hecky and Kilham 1988, Elser et al. 2007). Nitrogen is essential for the health of freshwater
streams. Nitrogen-dependent algae are primary producers in stream ecosystems upon which
species of higher trophic levels depend on for nourishment. Sudden changes in nitrogen
availability can dramatically alter the stability and productivity of stream ecosystems. A lack of
biologically available nitrogen could result in relocation or extinction of plant and fish species
(Smith 1984). Excess nitrogen could result in eutrophication, hypoxia, disruption of plant and soil
dynamics, soil acidification, and increase nitrous oxide emissions (Rhyther J.H. & Dunstan 1971),
(Fenn et al. 1998). The loss of biological activity in freshwater ecosystems could create a demand
for stream ecosystem restoration management to ensure stability. The health of a stream’s
ecosystem ultimately depends on mechanisms regulated by precipitation, temperature, and
groundwater chemistry such as sufficient lateral transport of nitrogen in soils, groundwater to
surface water ratios, and regular upstream flow conditions (Fenn et al. 1998). Droughts decrease
precipitation levels, and alter these mechanisms. With this in mind, the nature and occurrences of
California droughts must be considered when discussing changes in nitrogen concentrations and
freshwater ecosystem productivity.
Droughts cause a decrease in precipitation levels. This results in a series of changes that
can alter the chemical and ecological stability of freshwater ecosystems. Nitrogen concentrations
in an upland creek are determined by several factors. Stream connectivity and flow rates are
fundamental components of freshwater hydrology (Lake 2003). During dry periods, nitrogen
stocks in soils located within watersheds can increase due to buildup of litter-fall (Jackson et. al
1988). At average precipitation levels, inorganic nitrogen is physically trans-located by leaching.
Without adequate precipitation, trans-location is limited, and excess nitrogen accumulates in soils.
This excess nitrogen is released into streams upon a major precipitation event, and elevated
nitrogen levels are expected. Plants and microbial organisms sequester nitrogen through metabolic
processes (Jackson et. al 1988). During a drought, nitrogen sequestration and overall plant
productivity decreases due to decreased soil moisture and decreased species richness (Peñuelas et
al. 2007). Decreased translocation can lead to excess nitrogen in soils, which can result in a pulse
in nitrogen in aquatic systems following a significant precipitation event. By altering mechanisms
Bud Dillard Nitrogen Responses to Drought Spring 2015
3
necessary for physical and metabolic nitrogen processing, nitrogen cycling in streams becomes
disrupted, and ecosystem dynamics are altered.
Studies have been focused on the effects on drought conditions on nitrogen availability in
flowing freshwater systems, although the number of these types of studies is limited (Lake 2003).
To understand the effects of drought on nitrogen availability in freshwater streams, analyses of
past hydro-chemical data must be conducted. To create a more comprehensive model of Earth’s
freshwater nutrient supply systems, more research on the effects of drought on nitrogen levels
needs to be conducted.
The objective of this research was to answer the question “How does drought affect the
amount of nitrogen in freshwater aquatic systems”. The purpose was to statistically describe and
model the patterns of nitrogen concentrations during years that experienced drought conditions.
The spatial relationship between precipitation and nitrogen availability was examined and
analyzed using a time-series based multivariable regression model. I hypothesized that both
inorganic and organic nitrogen concentrations during drought periods would change significantly
in comparison with years with adequate precipitation.
METHODS
Study Site
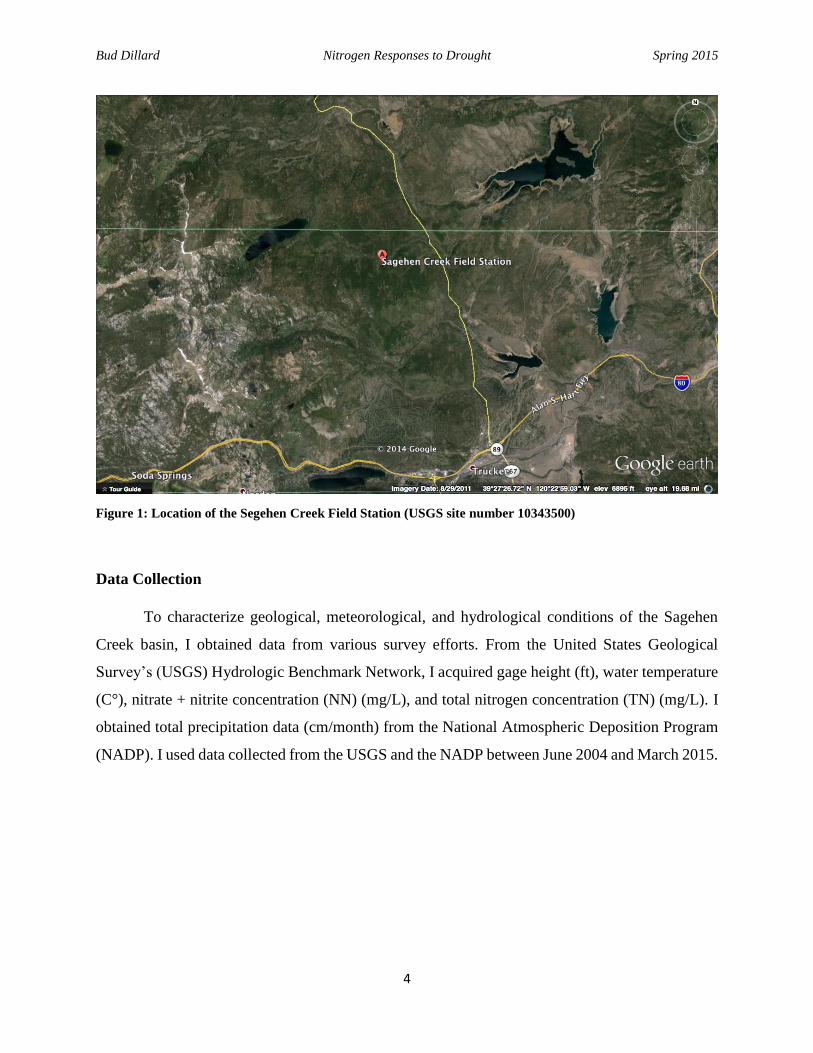
Sagehen Creek is located in the northeastern Sierra Nevada about 20 miles north of Lake
Tahoe. It is a tributary to the Truckee River in Nevada County, California (Markstrom et al., 2012).
The drainage basin spans 27 km2, and elevations range from approximately 1,600 meters to 2,600
meters (Markstrom et al., 2012). Air temperatures vary greatly throughout the basin, and are highly
dependent on elevations. Average annual precipitation at lower elevations is about 86 centimeters
(Markstrom et al., 2012). Most precipitation is stored in snowpack and is released in mid-late
spring. Vegetation in the Segehen Creek Basin is primarily coniferous. The geology of the bedrock
within the Sagehen Creek Basin consists mostly of granitic and volcanic rock (Markstrom et al.,
2012).
Bud Dillard Nitrogen Responses to Drought Spring 2015
4
Figure 1: Location of the Segehen Creek Field Station (USGS site number 10343500)
Data Collection
To characterize geological, meteorological, and hydrological conditions of the Sagehen
Creek basin, I obtained data from various survey efforts. From the United States Geological
Survey’s (USGS) Hydrologic Benchmark Network, I acquired gage height (ft), water temperature
(C°), nitrate + nitrite concentration (NN) (mg/L), and total nitrogen concentration (TN) (mg/L). I
obtained total precipitation data (cm/month) from the National Atmospheric Deposition Program
(NADP). I used data collected from the USGS and the NADP between June 2004 and March 2015.

Bud Dillard Nitrogen Responses to Drought Spring 2015
5
Data analysis
Analysis of covariance
To establish supportive evidence of the alternative hypothesis of a significant difference
between longterm trends in nitrogen concentrations (TN) and combined nitrate and nitrite (NN)
concentrations between drought years and non-drought years, I ran an ANCOVA using MATLAB
R2014A (Appendix). I created a dummy variable to separate drought years and non-drought years.
I classified drought years as years that received less than 10 cm below the average annual
precipitation for the Sagehen Creek basin (85 cm). P-values < 0.05 were considered statistically
significant.
Significance of Predictor Variables and Multivariable regression model
To determine which variables were the most significant predictor variables in predicting
nitrate and nitrite concentrations, I used multivariable linear regressionin MATLAB R2014A
(Appendix). To model total nitrogen in the study site, I created a multivariable regression model
using significant predictor variables and their respective β coefficients in MATLAB R2014A
(Appendix).
RESULTS
Analysis of covariance
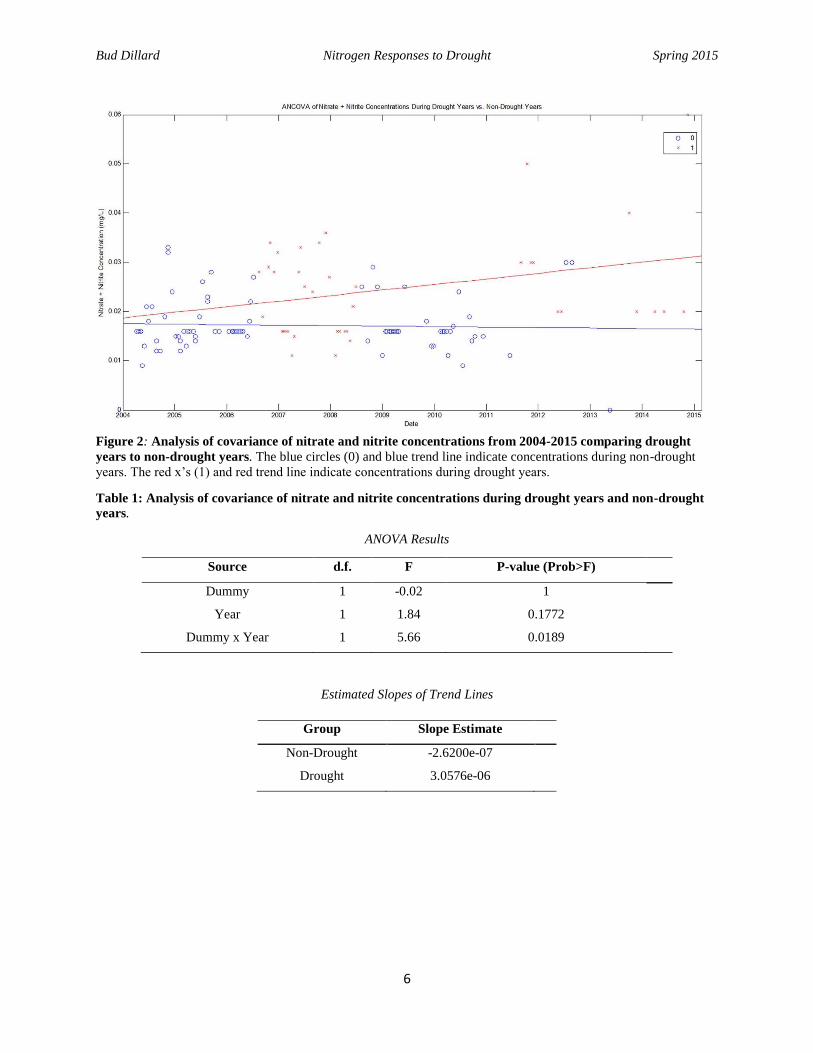
While combined nitrate and nitrite concentrations in Sagehen Creek were found to
relatively constant from 2004-2015 during non-drought years, NN concentrations increased during
drought years (Figure 2). There was a significant difference between the trend line slopes between
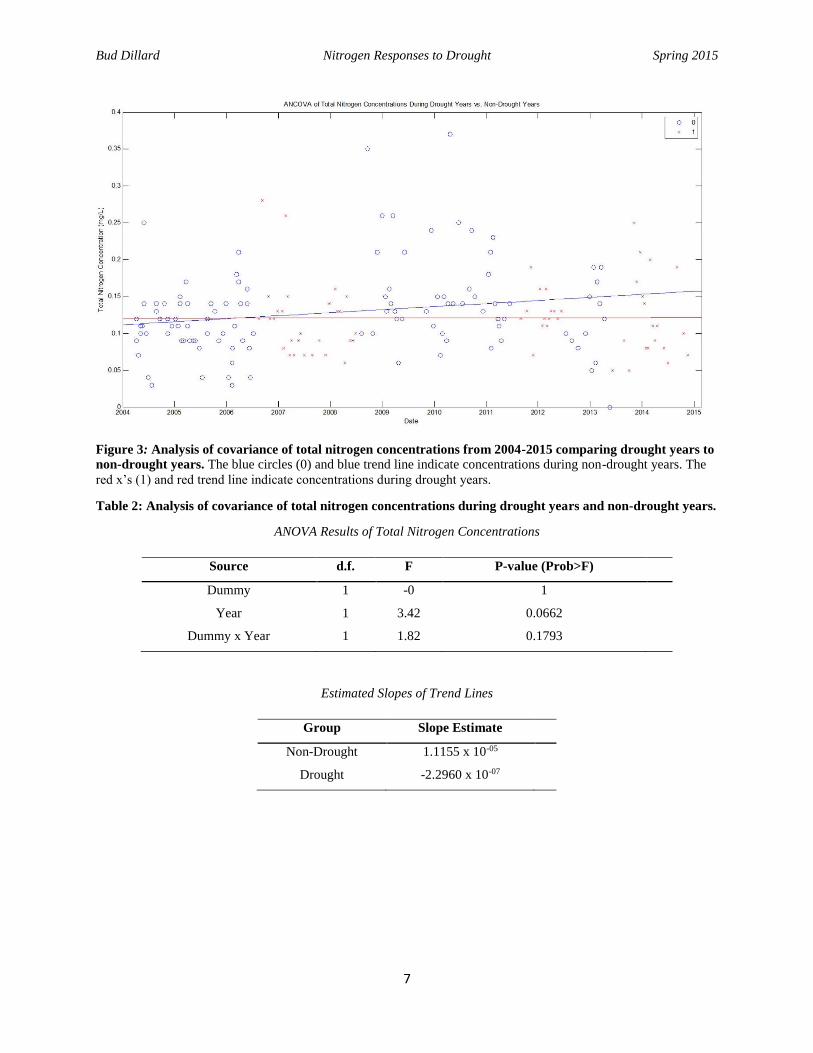
drought years and non-drought years. (p = 0.0189) (Table 1). From 2004-2015, I found that there
was no significant difference between total nitrogen concentrations during drought years and non-
drought years (p = 0.1793) (Figure 3, Table 2).
Bud Dillard Nitrogen Responses to Drought Spring 2015
6
Figure 2: Analysis of covariance of nitrate and nitrite concentrations from 2004-2015 comparing drought
years to non-drought years. The blue circles (0) and blue trend line indicate concentrations during non-drought
years. The red x’s (1) and red trend line indicate concentrations during drought years.
Table 1: Analysis of covariance of nitrate and nitrite concentrations during drought years and non-drought
years.
ANOVA Results
Source d.f. F P-value (Prob>F)
Dummy 1 -0.02 1
Year 1 1.84 0.1772
Dummy x Year 1 5.66 0.0189
Estimated Slopes of Trend Lines
Group Slope Estimate
Non-Drought -2.6200e-07
Drought 3.0576e-06
Bud Dillard Nitrogen Responses to Drought Spring 2015
7
Figure 3: Analysis of covariance of total nitrogen concentrations from 2004-2015 comparing drought years to
non-drought years. The blue circles (0) and blue trend line indicate concentrations during non-drought years. The
red x’s (1) and red trend line indicate concentrations during drought years.
Table 2: Analysis of covariance of total nitrogen concentrations during drought years and non-drought years.
ANOVA Results of Total Nitrogen Concentrations
Source d.f. F P-value (Prob>F)
Dummy 1 -0 1
Year 1 3.42 0.0662
Dummy x Year 1 1.82 0.1793
Estimated Slopes of Trend Lines
Group Slope Estimate
Non-Drought 1.1155 x 10-05
Drought -2.2960 x 10-07
Bud Dillard Nitrogen Responses to Drought Spring 2015
8
Multivariable regression and model
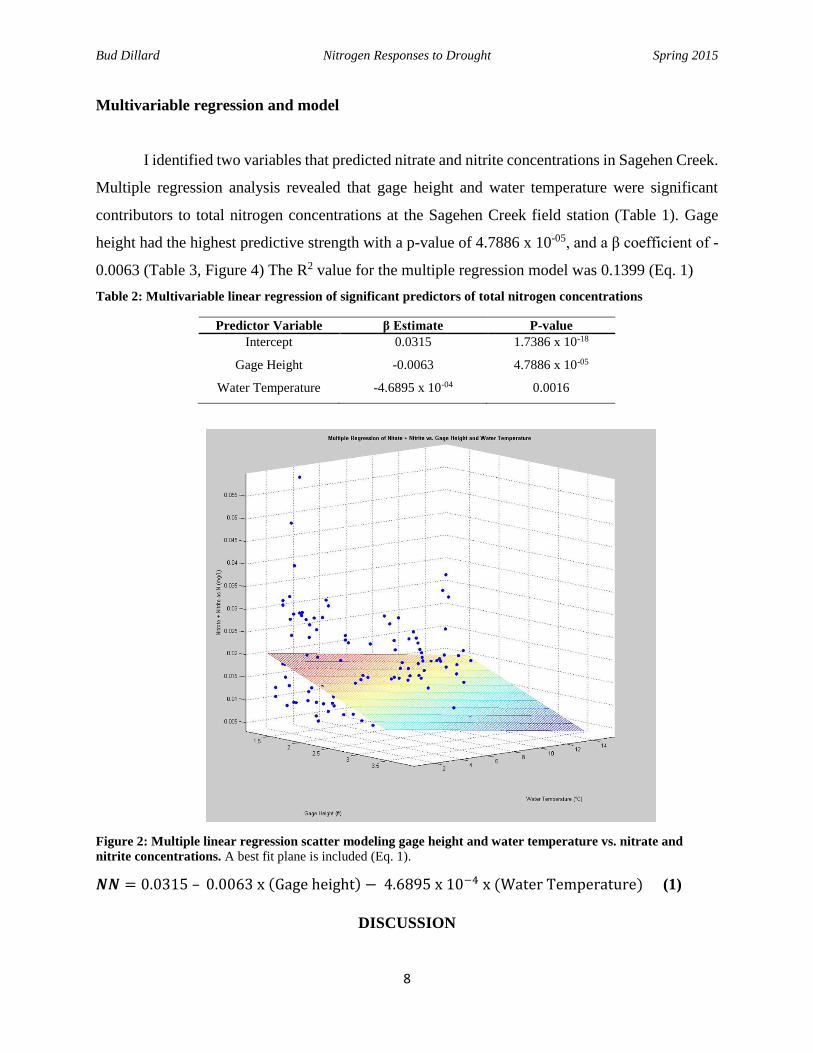
I identified two variables that predicted nitrate and nitrite concentrations in Sagehen Creek.
Multiple regression analysis revealed that gage height and water temperature were significant
contributors to total nitrogen concentrations at the Sagehen Creek field station (Table 1). Gage
height had the highest predictive strength with a p-value of 4.7886 x 10-05, and a β coefficient of -
0.0063 (Table 3, Figure 4) The R2 value for the multiple regression model was 0.1399 (Eq. 1)
Table 2: Multivariable linear regression of significant predictors of total nitrogen concentrations
Predictor Variable β Estimate P-value Intercept 0.0315 1.7386 x 10⁻¹⁸
Gage Height -0.0063 4.7886 x 10-05
Water Temperature -4.6895 x 10-04 0.0016
Figure 2: Multiple linear regression scatter modeling gage height and water temperature vs. nitrate and
nitrite concentrations. A best fit plane is included (Eq. 1).
𝑵𝑵 = 0.0315 – 0.0063 x (Gage height) − 4.6895 x 10⁻⁴ x (Water Temperature) (1)
DISCUSSION
Bud Dillard Nitrogen Responses to Drought Spring 2015
9
Nitrogen concentrations in freshwater systems are important indicators of the state of
aquatic ecology and water quality. Because nitrogen concentrations are not always directly
monitored, it is useful to model nitrogen concentrations in creeks and streams, as these waterways
serve as health indicators for local and downstream aquatic systems. In this study, I determined
that nitrate and nitrite concentrations increased significantly in Sagehen Creek during drought
years. While the multivariable regression model was only able to predict total nitrogen within a
limited range of accuracy (R2 = 0.1399), analytical techniques identified correlations between gage
height, water temperature, and nitrate and nitrite concentrations. With the use of this model, the
overall health of Sagehen Creek can be gauged and appropriate management and restoration
practices can be implemented. My findings in this study imply that nitrate and nitrite
concentrations are correlated with drought conditions, which, in light of forecasted continuation
of drought conditions in California, could have negative ecological implications. While the
complexity of natural systems limits the effectiveness of simple models in predicting total nitrogen
levels, analytic techniques can reveal long-term trends and important biogeochemical factors.
Analysis of covariance
Combined nitrate and nitrite concentration patterns were significantly different during
years with drought compared to non-drought years (p = 0.0189). Years that experienced drought
conditions experienced an increase in nitrate and nitrite concentrations. These periods of elevated
NN concentrations were during cold and dry periods of the year. Interestingly, this finding
challenges other studies performed in other locations (Walling & Foster 1977), (Baldwin et al.
2005). According to other research, a pulse in NN is expected after the first substantial
precipitation event in late fall. (Walling & Foster 1977). I found that NN concentrations were
highest in January and February, at low gage heights and low water temperatures. Under drought
conditions, decreased riparian species richness can result in decreased nitrate and nitrate
sequestration (Peñuelas et al. 2007). This could reduce the abundance of denitrifying microbial
communities in the system (Zak et al. 2003). In cold and dry conditions, microbial denitrification
can be slowed or halted during cold periods due to low temperatures (Nedwell, 1999). Reduced
microbial activity can limit the removal of nitrate and nitrite by reducing inorganic nitrogen to
Bud Dillard Nitrogen Responses to Drought Spring 2015
10
nitrogen gas (Stanford et al. 1975). This mechanism coupled with limited hydrologic flow in
drought years could cause a buildup of nitrate and nitrite in Sagehen Creek. I observed low flow
patterns in the data during drought years. This observation suggests that low flow could contribute
to elevated NN concentrations. Prolonged droughts could result in a more extreme reduction in
flow and could increase nitrate and nitrite concentrations in the system (Lake 2003). Long-term
total nitrogen concentration patterns did not change between drought years and years that
experienced adequate precipitation (p = 0.1793). This finding suggests that drought conditions in
this region may not have a significant effect on the total nitrogen concentrations in this type of
system.
Multivariable regression analysis and model
To predict NN concentration in Sagehen Creek, I identified significant contributive
variables. Gage height was the most significant predictor of NN concentration in Sagehen Creek
(p = 4.79 x 10-05). With a one unit (ft.) decrease in gage height, NN concentration is expected to
rise by about 0.006 mg/L. Water temperature was another significant predictor variable for NN in
the study system (p = 0.0016). For a one unit decrease in water temperature (C°), NN concentration
is expected to increase by 4.69 x 10-04 mg/L. By performing a multiple regression analysis, I was
able to develop the predictive multivariable regression model.
While the multivariable linear regression model only accounted for about 14% of the
variability in NN concentration, it is a useful to for attaining an estimation of NN concentration in
Sagehen Creek. The stochastic nature of hydrologic systems deems them difficult to represent in
a model. Despite the difficulty in creating a predictive model for NN concentration in Sagehen
Creek, outputs from the model are not without value. Estimations of NN concentrations can be
used as indicators to determine overall long-term health trends in unmonitored stretches of
Sagehen Creek during. Specifically, the model could be useful in determining nitrate and nitrate
concentrations in Sagehen Creek during periods with extreme water temperatures and gage
heights. The model helps identify important variables to consider when monitoring NN
concentration, and it can help generate hypotheses about future NN concentrations and drought
dynamics.
Bud Dillard Nitrogen Responses to Drought Spring 2015
11
Limitations and future directions
The results of this study provide an insightful look into how drought could affect nitrate
and nitrite concentrations in Sagehen Creek. The model developed in this study could be used to
predict NN concentrations in other headwater streams with similar environmental characteristics
as Sagehen Creek. During the process of conducting this research, I encountered several limiting
factors that could have significant impacts on the results. Sagehen Creek Field Station is relatively
close to the headwaters of the system. That is, although there were significant changes in NN
dynamics during drought years, overall NN concentrations were low in comparison to those of a
downstream reach where there are more opportunities for NN inputs. Such low concentrations can
affect the accuracy of detection instruments (Reiger et al. 2008). To increase detection accuracy,
it would be beneficial for future studies to perform this analysis on a downstream reach where NN
concentrations are higher on average.
Rapid changes in temperature, precipitation patterns, and soil characteristics and dynamics
contribute to the difficulty of predicting solute concentrations in hydrological systems. Variability
in hydrological characteristics between reaches of aquatic systems can change rapidly (Dent &
Grimm 1999). This suggests that there could have been pulses or drops in NN concentrations that
were not accounted for in the data. Future studies could focus on a system that has more frequently
sampled data.
Variables used in the multivariable regression model could display multicollinearity. For
example, changes in gage height could influence changes in water temperature. Although this
would not affect the output of the multivariate linear regression model, it would influence the
degree to which gage height and water temperature contribute to NN concentrations in Sagehen
Creek (Friedman & Wall 2005). Variables that were not tested in this study such as groundwater
NN concentration, soil permeability, and seasonal effects could serve as significant predictor
variables for NN concentrations. The lack of data recording important factors such as rainfall to
snowfall ratio made it difficult to identify the amount of time it took for a precipitation event to
affect nitrate and nitrite concentrations in the system.
Broader implications
Bud Dillard Nitrogen Responses to Drought Spring 2015
12
The findings of this study could have substantial implications in water quality studies,
management of rivers, streams, and reservoirs, as well as in the fishing industry. Headwater creeks
such as Sagehen Creek serve as tributaries to larger systems that supply water to reservoirs. With
increased NN concentrations in Sagehen Creek, NN there could be an excess of NN downstream.
Downstream excess NN could, in turn, increase algae and plant growth. Increased algal and plant
growth could result in hypoxia and downstream species relocation (Smith 1984). Additionally,
increased NN concentrations could subsequently increase the need for water treatment methods.
With elevated NN concentrations during drought conditions, river and stream restoration
management techniques could be introduced to restore overall health to Sagehen Creek and other
systems. Increasing flow rates by creating channels would decrease the residence times of solutes.
To increase sequestration, riparian plant varieties that are adapted to cold temperatures could be
introduced to the system.
Fish communities rely on stable solute chemistry in their habitats. A change in solute
chemistry can relocate a species and can cause local extinction (Smith 1984). Such events can have
devastating effects ecologically as well as economically as fish species provide ecosystem services
to the system (Holmlund & Hammer 1999).
While the findings of this study have suggested that modeling stochastic systems such as
stream solute concentrations in a flowing freshwater system provides a general estimation at best,
they have also provided significant evidence that NN concentrations in Sagehen Creek increased
during drought years. The modeling exercise in this study was not able to fully capture the
variability in NN concentrations. The results from this exercise emphasizes the difficulties and
complexities involved in modeling natural systems such as Sagehen Creek. However, the trend of
increased NN concentrations during drought conditions has ecological, societal, and economic
implications. The expected increase in the frequency and severity of droughts due to climate
change suggests that water quality in natural systems should continue to be the subject of future
studies to ensure ecological and economic stability. This study as well as future studies will provide
the tools necessary to become better equipped to anticipate potential problems in the future.
ACKNOWLEDGEMENTS
Bud Dillard Nitrogen Responses to Drought Spring 2015
13
Thank you to Patina Mendez, Kurt Spreyer, and Joe Kantenbacher for helping me solidify
my analysis techniques for helping me see the whole process through. Erik Oerter for entertaining
the idea of analyzing such a complex system. David Sedlak for allowing me to continue pursuing
my interests in water quality in his lab. Samantha Beardsley for allowing me to assist with her
research in the Sedlak Lab, as well as for helping with the interpretation of results. Dayton
Marchese, Pascal Polonik, Andy Wong, for all of their review efforts and help along the way.
Krista Pannell for her support throughout my academic career and life in general. Finally, I thank
my family, for their love and support no matter what I pursue.
REFERENCES
Dent, C. L., and N. B. Grimm. 1999. Spatial heterogeneity of stream water nutrient
concentrations over successional time. Ecology 80:2283-2298.
Elser, J. J., M. E. S. Bracken, E. E. Cleland, D. S. Gruner, W. S. Harpole, H. Hillebrand, J. T.
Ngai, E. W. Seabloom, J. B. Shurin, and J. E. Smith. 2007. Global analysis of nitrogen
and phosphorus limitation of primary producers in freshwater, marine and terrestrial
ecosystems. Ecology Letters 10:1135-1142.
Fenn, M. E., M. A. Poth, J. D. Aber, J. S. Baron, B. T. Bormann, D. W. Johnson, A. D. Lemly, S.
G. McNulty, D. F. Ryan, and R. Stottlemyer. 1998. Nitrogen excess in North American
ecosystems: predisposing factors, ecosystem responses, and management strategies.
Ecological Applications 8:706-733.
Friedman, L., and M. Wall. 2005. Graphical views of suppression and multicollinearity in
multiple linear regression. The American Statistician 59:127-136.
Hecky, R., and P. Kilham. 1988. Nutrient limitation of phytoplankton in freshwater and marine
environments: a review of recent evidence on the effects of enrichment. Limnology and
Oceanography 33:796-822.
Holmlund, C. M., and M. Hammer. 1999. Ecosystem services generated by fish populations.
Ecological Economics 29:253-268.
Jackson, L., R. Strauss, M. Firestone, and J. Bartolome 1988. Plant and soil nitrogen dynamics in
California annual grassland. Plant and Soil 110:9-17.
Keyantash, J. A., and J. A. Dracup. 2004. An aggregate drought index: Assessing drought
severity based on fluctuations in the hydrologic cycle and surface water storage. Water
Resources Research 40.
Bud Dillard Nitrogen Responses to Drought Spring 2015
14
Lake, P. S. 2003. Ecological effects of perturbation by drought in flowing waters. Freshwater
Biology 48:1161-1172.
Markstrom, S. L., L. E. Hay, and R. S. Regan. 2012. Watershed scale response to climate
change—Sagehen Creek Basin, California. US Geological Survey Fact Sheet 2011 3121
Nedwell, D. 1999. Effect of low temperature on microbial growth: lowered affinity for substrates
limits growth at low temperature. FEMS Microbiology Ecology 30:101-111.
Peñuelas, J., P. Prieto, C. Beier, C. Cesaraccio, P. De Angelis, G. de Dato, B. A. Emmett, M.
Estiarte, J. Garadnai, and A. Gorissen. 2007. Response of plant species richness and
primary productivity in shrublands along a north–south gradient in Europe to seven years
of experimental warming and drought: reductions in primary productivity in the heat and
drought year of 2003. Global Change Biology 13:2563-2581.
Rieger, L., G. Langergraber, D. Kaelin, H. Siegrist, and P. Vanrolleghem. 2008. Long-term
evaluation of a spectral sensor for nitrite and nitrate. Water Science and Technology
57:1563-1570.
Ryther, J. H., and W. M. Dunstan. 1971. Nitrogen, phosphorus, and eutrophication in the coastal
marine environment. Science 171:1008-1013.
Smith, S. 1984. Phosphorus versus nitrogen limitation in the marine environment. Limnology
29:1149-1160.
Stanford, G., S. Dzienia, and R. A. Vander Pol. 1975. Effect of temperature on denitrification
rate in soils. Soil Science Society of America Journal 39:867-870.
Vitousek, P. M., J. D. Aber, R. W. Howarth, G. E. Likens, P. A. Matson, D. W. Schindler, W. H.
Schlesinger, and D. G. Tilman. 1997. Human alteration of the global nitrogen cycle:
sources and consequences. Ecological Applications 7:737-750.
Zak, D. R., W. E. Holmes, D. C. White, A. D. Peacock, and D. Tilman. 2003. Plant diversity,
soil microbial communities, and ecosystem function: are there any links? Ecology
84:2042-2050.
Bud Dillard Nitrogen Responses to Drought Spring 2015
15
APPENDIX
MATLAB Code:
%% Import Excel Dates + Nitrogen Time Series Scatter
T; datecol = 1; T(:,datecol) = T(:,datecol) + datenum('30-Dec-1899'); plot(T,TN); xlabel('Time'); ylabel('Gage Height (ft)'); zlabel('Total Nitrogen');
%% N+N Multiple Regression (Gage, Dummy, and N) x1 = Gageh; x2 = watert; y1 = NN; y2 = TN; x1(x1==0) = nan; x2(x2==0) = nan; NNadj = y1; NNadj(NNadj==0.0100) = nan; NNadj(NNadj==0.0080) = nan; X = [ones(size(x1)) x1 x2]; X2 = [x1 x2]; X3 = [X3 dummy]; b = regress(y1,X3); b; b2 = regress(y1,X); scatter3(x1,dummy,y1,'filled'); hold on; x1fit = min(x1):0.2:max(x1); dummyfit = 0:0.2:1; [X1FIT,dummyFIT] = meshgrid(x1fit,dummyfit); YFITD = b(1) + b(2)*X1FIT + b(3)*dummyFIT; mesh(X1FIT,dummyFIT,YFITD); xlabel('Gage Height (ft)'); ylabel('Drought = 1 (Precipiation < 10cm below average)'); zlabel('Nitrate + Nitrite as N (mg/L)'); t2 = title('Multiple Linear Regression of Nitate + Nitrite vs. Gage Height
and Drought Variable'); set(t2,'FontWeight','bold'); %% Plot NN vs. dummy plot(dummy,NN,'*k'); %% Linear Regression of NN vs. Dummy
p = polyfit(dummy,NN,1); p; yfit = p(1)*dummy + p(2); yresid = NN - yfit; SSresid = sum(yresid.^2); SStotal = (length(NN)-1)*var(NN); rsq = 1 - SSresid/SStotal;
Bud Dillard Nitrogen Responses to Drought Spring 2015
16
rsq;
%% N+N Multiple Regression Plot scatter3(x1,x2,y1,'filled','b') hold on x1fit = min(x1):0.2:max(x1); x2fit = min(x2):0.2:max(x2); [X1FIT,X2FIT] = meshgrid(x1fit,x2fit); YFIT = b2(1) + b2(2)*X1FIT + b2(3)*X2FIT; mesh(X1FIT,X2FIT,YFIT); xlabel('Gage Height (ft)'); ylabel('Water Temperature (°C)'); zlabel('Nitrate + Nitrite as N (mg/L)'); t = title('Multiple Linear Regression of Nitate + Nitrite vs. Gage Height and
Water Temperature'); set(t,'FontWeight','bold'); view(50,10); %% Rsquared of Model [bstat,bint,r,rint,stats] = regress(X,y1); %% Multicollinearity Test collinearity = collintest(X2);
%% TN Mult Regression bTN = regress(y2,X); bTN; scatter3(x1,x2,y2,'filled'); %% TN Mult Regression Scatter scatter3(x1,x2,y2,'filled','b') hold on x1fit = min(x1):0.2:max(x1); x2fit = min(x2):0.2:max(x2); [X1FIT,X2FIT] = meshgrid(x1fit,x2fit); YFIT2 = b2(1) + b2(2)*X1FIT + b2(3)*X2FIT; mesh(X1FIT,X2FIT,YFIT2); xlabel('Gage Height'); ylabel('Water Temperature'); zlabel('Total Nitrogen'); view(50,10); %% Total Nitrogen vs. Nitrate + Nitrite plot scatter(y1,y2);
%% N+N ANCOVA ANCOVA = aoctool(T,NNadj,dummy);
%% Total N ANCOVA ANCOVA = aoctool(T,TN,dummy);