nitrification in sandy soils of the atlantic coastal …
TRANSCRIPT
NITRIFICATION IN SANDY SOILS OF THE ATLANTIC COASTAL PLAIN AND ITS
RELATIONSHIP TO THE DEVELOPMENT OF SUBSOIL ACIDITY
by
JASON E. MOWRER
(Under the Direction of David E. Kissel)
ABSTRACT
The process of nitrification is known to exacerbate the development of soil and subsoil acidity,
particularly in weathered and coarsely textured soils such as those often found in the Atlantic
Coastal Plain in the Southeastern United States. The purpose of this research was to elucidate
the relationship between typical soil properties in this region and the pattern of nitrification. The
research shows that nitrification rates in these soils were found to be at or near the low end of the
scale as compared with other reported rates. Lengths of lag phases were found to be at or near
the high end of the scale. Rates and lag phases were closely related to both soil CEC and
relative water content. This study also shows that the relationship between nitrification and
change in soil pH is not simple and that buffering mechanisms related to the pattern of pH
change in these soils need further study.
INDEX WORDS: Nitrification, subsoil acidity, ammoniacal fertilizer
NITRIFICATION IN SANDY SOILS OF THE ATLANTIC COASTAL PLAIN AND ITS
RELATIONSHIP TO THE DEVELOPMENT OF SUBSOIL ACIDITY
by
JASON E. MOWRER
B.S.E.H., University of Georgia 1995
A Thesis Submitted to the Graduate Faculty of The University of Georgia in Partial Fulfillment
of the Requirements for the Degree
MASTER OF SCIENCE
ATHENS, GEORGIA
2009

© 2009
Jason E. Mowrer
All Rights Reserved
NITRIFICATION IN SANDY SOILS OF THE ATLANTIC COASTAL PLAIN AND ITS
RELATIONSHIP TO THE DEVELOPMENT OF SUBSOIL ACIDITY
by
JASON E. MOWRER
Major Professor: David E. Kissel
Committee: Miguel Cabrera William Miller
Electronic Version Approved: Maureen Grasso Dean of the Graduate School The University of Georgia May 2009

iv
DEDICATION
This thesis is dedicated first to my wife Martha and our children, Olen and Ana. Without their
support, I would not have found the strength or discipline to pursue this degree. Also, I am
indebted to my grandparents, Herman and Lottie Kimmich for buying my books.
v
ACKNOWLEDGEMENTS
Thank you to Dr. David E. Kissel for sharing his wealth of knowledge and perspective on soil
science with me. His immense stature in the field is enough in itself to lend credibility to my
future pursuits in soil chemistry. I can only hope to return the favor by making my own small
contribution to the field as I mature as a scientist and researcher. Thank you also to the entire
staff at the University of Georgia Soil, Plant, and Water Testing Laboratory and the Agricultural
and Environmental Services Laboratories. Thank you to Dr. Miguel Cabrera for his patience
with frequent questions. Thank you also to Dr. Harry Mills and his entire family for their
support during this process.
vi
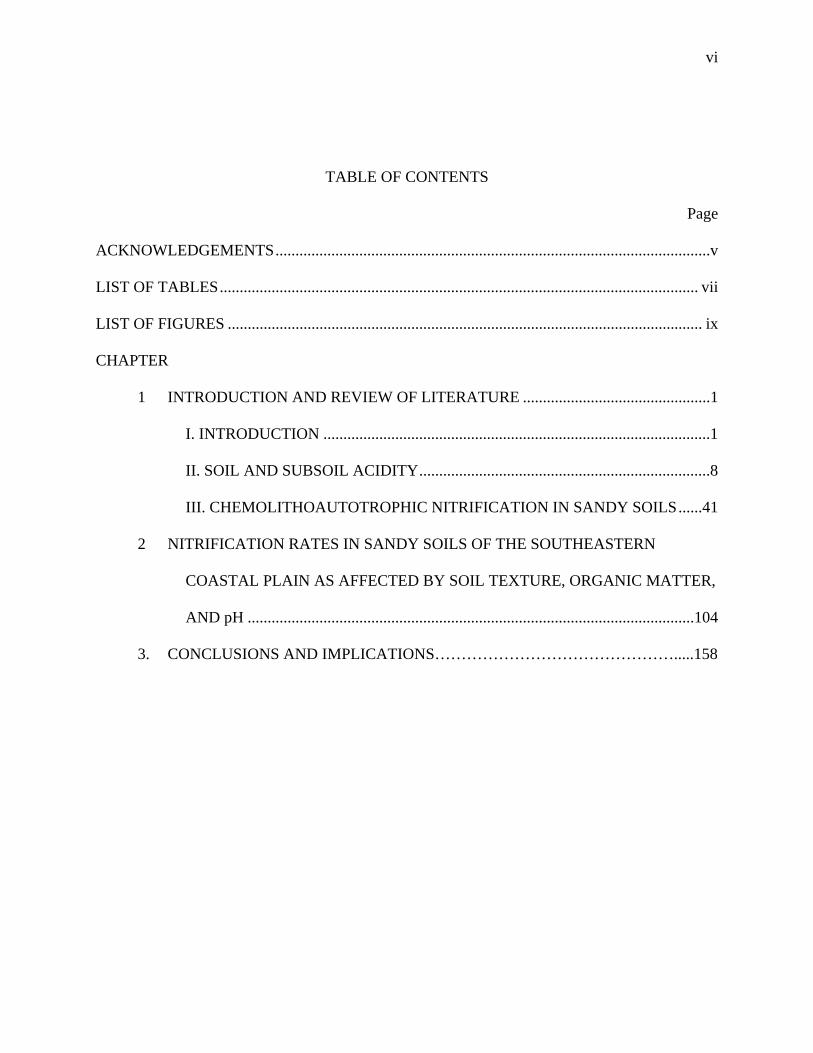
TABLE OF CONTENTS
Page
ACKNOWLEDGEMENTS.............................................................................................................v
LIST OF TABLES........................................................................................................................ vii
LIST OF FIGURES ....................................................................................................................... ix
CHAPTER
1 INTRODUCTION AND REVIEW OF LITERATURE ...............................................1
I. INTRODUCTION .................................................................................................1
II. SOIL AND SUBSOIL ACIDITY.........................................................................8
III. CHEMOLITHOAUTOTROPHIC NITRIFICATION IN SANDY SOILS......41
2 NITRIFICATION RATES IN SANDY SOILS OF THE SOUTHEASTERN
COASTAL PLAIN AS AFFECTED BY SOIL TEXTURE, ORGANIC MATTER,
AND pH ................................................................................................................104
3. CONCLUSIONS AND IMPLICATIONS……………………………………….....158
vii
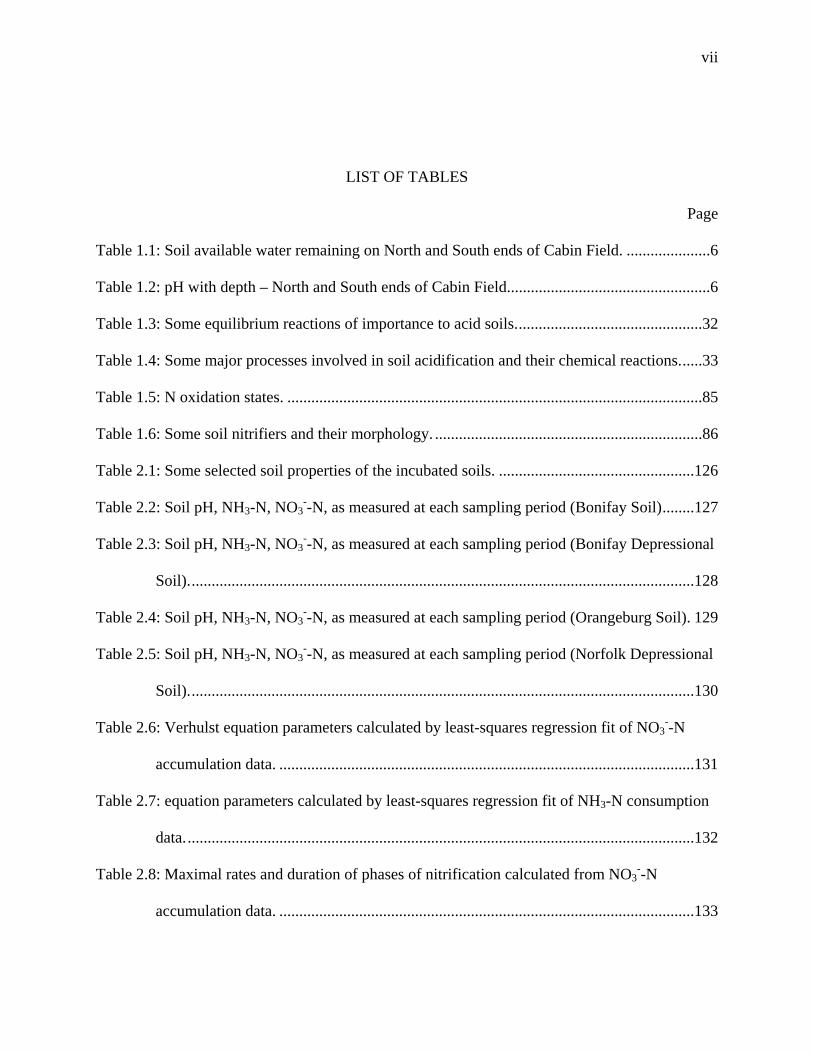
LIST OF TABLES
Page
Table 1.1: Soil available water remaining on North and South ends of Cabin Field. .....................6
Table 1.2: pH with depth – North and South ends of Cabin Field...................................................6
Table 1.3: Some equilibrium reactions of importance to acid soils...............................................32
Table 1.4: Some major processes involved in soil acidification and their chemical reactions......33
Table 1.5: N oxidation states. ........................................................................................................85
Table 1.6: Some soil nitrifiers and their morphology. ...................................................................86
Table 2.1: Some selected soil properties of the incubated soils. .................................................126
Table 2.2: Soil pH, NH3-N, NO3--N, as measured at each sampling period (Bonifay Soil)........127
Table 2.3: Soil pH, NH3-N, NO3--N, as measured at each sampling period (Bonifay Depressional
Soil)...............................................................................................................................128
Table 2.4: Soil pH, NH3-N, NO3--N, as measured at each sampling period (Orangeburg Soil). 129
Table 2.5: Soil pH, NH3-N, NO3--N, as measured at each sampling period (Norfolk Depressional
Soil)...............................................................................................................................130
Table 2.6: Verhulst equation parameters calculated by least-squares regression fit of NO3--N
accumulation data. ........................................................................................................131
Table 2.7: equation parameters calculated by least-squares regression fit of NH3-N consumption
data................................................................................................................................132
Table 2.8: Maximal rates and duration of phases of nitrification calculated from NO3--N
accumulation data. ........................................................................................................133

viii
Table 2.9: Maximal rates and duration of phases of nitrification calculated from NH3-N
consumption data. .........................................................................................................134
Table 2.10: Percent water filled pore space and relative nitrifier activity for
experimental soils. .......................................................................................................................135
Table 2.11: Kmax (NO3--N) values adjusted to 100% relative nitrifier activity. ........................135
Table 2.12: Exchangeable cations................................................................................................136
Table 2.13: Model parameters from multiple regression analysis: response of nitrification rate
parameters to soil factors . ............................................................................................137

ix
LIST OF FIGURES
Page
Figure 1.1: Calcium required for plant root cell elongation ..........................................................34
Figure 1.2: Enzymatic pathway for the oxidation of ammonia to nitrite.......................................87
Figure 1.3: Three distinct phases of nitrification in soils following the addition of substrate
(NH3-N) .........................................................................................................................88
Figure 1.4: Nitrification in type I pattern soils ..............................................................................89
Figure 1.5: Nitrification in type II pattern soils. ............................................................................90
Figure 1.6: Nitrification in type III pattern soils............................................................................91
Figure 1.7: Influence of soil moisture tension on the moisture rate index (RM) in Midwestern silty
clay loam and silty loam soils @ 25°C .........................................................................92
Figure 1.8: Influence of soil moisture tension on the moisture rate index (RM) in two soils
incubated @ 20°C..........................................................................................................93
Figure 1.9: Influence of soil moisture tension on the moisture rate index (RM) in four soils
incubated @ 30°C..........................................................................................................94
Figure 2.1: NO3--N accumulation (Bonifay Soil) ........................................................................138
Figure 2.2: NO3--N accumulation (Bonifay Depressional Soil) ..................................................139
Figure 2.3: NO3--N accumulation (Orangeburg Soil) ..................................................................140
Figure 2.4: NO3--N accumulation (Norfolk Depressional Soil)...................................................141
Figure 2.5: NH3-N Consumption (Bonifay Soil) .........................................................................142
Figure 2.6: NH3-N Consumption (Bonifay Depressional Soil) ...................................................143

x
Figure 2.7: NH3-N Consumption (Orangeburg Soil)...................................................................144
Figure 2.8: NH3-N Consumption (Norfolk Depressional Soil) ...................................................145
Figure 2.9: pH change during incubation (Bonifay Soil - NO3--N data) .....................................146
Figure 2.10: pH change during incubation (Bonifay Soil - NH3-N data) ....................................147
Figure 2.11: pH change during incubation (Bonifay Depressional Soil - NO3--N data) .............148
Figure 2.12: pH change during incubation (Bonifay Depressional Soil - NH3-N data) ..............149
Figure 2.13: pH change during incubation (Orangeburg Soil - NO3--N data) .............................150
Figure 2.14: pH change during incubation (Orangeburg Soil - NH3-N data)..............................151
Figure 2.15: pH change during incubation (Norfolk Depressional Soil - NO3--N data)..............152
Figure 2.16: pH change during incubation (Norfolk Depressional Soil - NH3-N data) ..............153
1
CHAPTER 1
INTRODUCTION AND REVIEW OF LITERATURE
I. Introduction
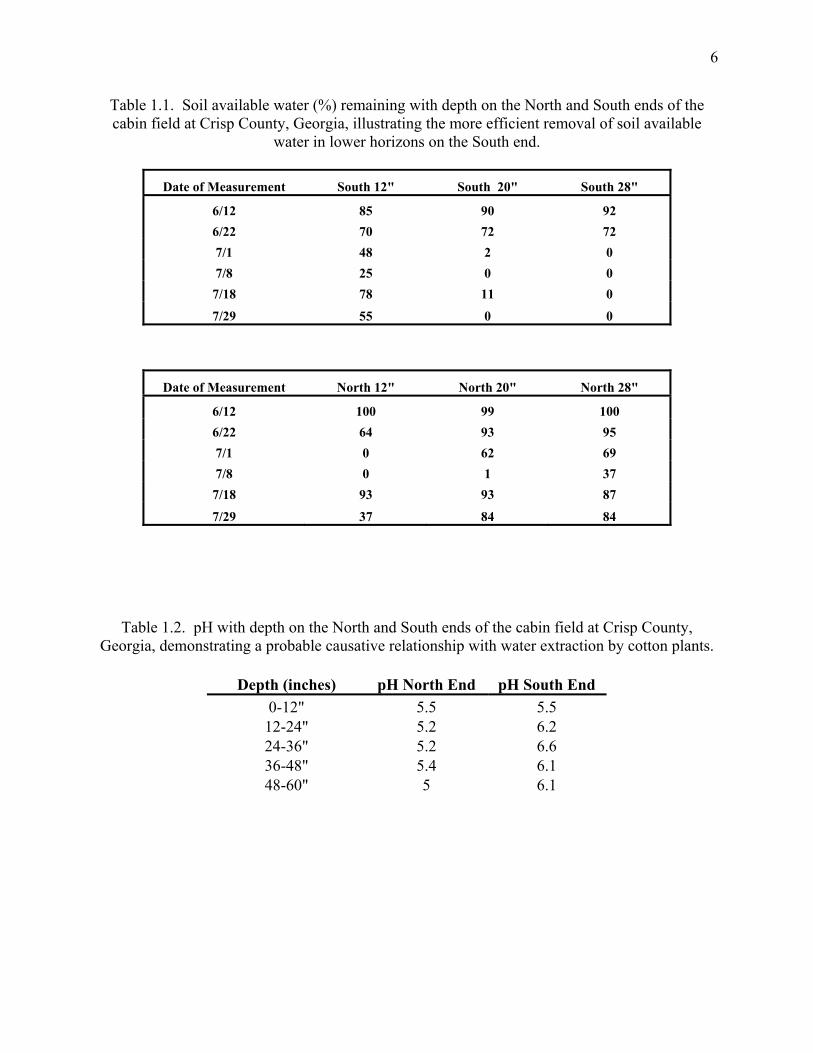
In a study of cotton plants grown on the cabin field in Crisp county Georgia, it was
determined that plants on the North side of the field were unable to efficiently extract soil water
at depths greater than 20”, whereas identical plants on the South side of the same field were
significantly better able to access all available water to depths of 28” (Table 1.1). The cotton
plant tops reflected this restrictive situation with respect to plant available soil water and
exhibited less plant mass above ground on the North side of the field than observed on the plants
at the South end (personal communication, Kissel, D.E.). After eliminating nematodes and
subsoil compaction as the causative agents, it was determined that an acidic subsoil condition
was most likely responsible for the reduction in plant water uptake (Table 1.2).
Subsoil acidity is a widely identified problem limiting crop yields in agricultural
production. It can reduce a plant’s ability to explore subsoil horizons for water and nutrients by
constraining root growth due to conditions that promote aluminum toxicity and/or reduced
calcium availability. In addition, low pH can have direct effects on the availability of other
nutrients even when Al toxicity is not a growth limiting factor. For instance, while iron and
other micronutrients may become more available at lower pH values, phosphorus and
molybdenum are examples of essential nutrients that less available under acid conditions. Soil
acidity is most frequently countered with applications of liming agents. These may include
agricultural lime, a calcium carbonate product obtained by mining and crushing limestone or
dolomitic limestone, calcium hydroxide, etc. The effects of liming are not far reaching, though,
as surface applications of liming agents not incorporated into the soil have been shown to be
2
most effective in the top few centimeters of soil. This is due to a combination of factors: 1) the
slow rate of dissolution of calcium carbonate and 2) the rapidity of reaction of dissolved
bicarbonate anions with protons in solution. Correction of subsoil acidity, however, has often
been approached with prohibitively costly deep incorporation methods. In light of this, some
research has shown that given sufficient time, subsoil acidity can be positively affected simply
through regular surface applications of lime (Gascho and Parker, 2001). Unfortunately, this
process can take many years to raise subsoil pH to desired levels.
Sumner and Noble (2003), assert that ammoniacal fertilizers provide the major acidifying
input to soils under intensive agricultural production. Ammoniacal fertilizers include products
such as urea, anhydrous ammonia, urea-ammonium-nitrate, and various other ammonium salts.
These are popular nitrogen sources as they are less expensive than nitrate salts, yet are oxidized
to NO3- by microorganisms ubiquitous in soils. This is important as it has been shown that plants
supplied with both NH4+ and NO3
- produce higher yields than those receiving only one or the
other (Haynes, R.J., 1986b).
The two-stage process by which ammonium is oxidized ultimately to nitrate is
termed nitrification. Nitrification is carried out in soils largely by two types of
chemolithoautotrophic bacteria. One group (Nitroso- spp.) derives energy from the oxidation of
NH4+ to NO2
-, while another group (Nitro- spp.) derives energy from the oxidation of NO2- to
NO3-. In these two reactions, a total of two moles of acidity (H+) are produced for every mole of
ammonium oxidized. The general chemical reaction is classically summarized as follows:
NH4+ + 2O2 → NO3
- + H2O + 2H+
Depending upon the acid buffering capacity of a soil, acidification resulting from this
process can progress rapidly. If these reactions proceed at a relatively vigorous rate, nearly all of
3
the ammonium will be oxidized in the tillage zone of the soil where the acid products can be
more easily ameliorated with surface application of lime. If the nitrification rate is slow,
however, ammonium may be allowed to migrate downwards and the reaction can lessen pH
values in lower horizons where it is not so easily countered by conventional liming.
While the mobility of ammonium is not considered significant in soils that contain 2:1
clays, the coarse sandy soils of Georgia’s Coastal Plain are more susceptible to ammonium
leaching. Additionally, excessive plant uptake of cations (NH4+) must be accompanied by the
uptake of an equivalent anion or otherwise must result in the release of protons or organic acids
as a method of maintaining cellular electrochemical balance. Subsoil acidity is further promoted
when NO3- is leached below the root zone resulting in a permanent charge imbalance (Bouman,
1995). As long as nitrate remains in the root zone, however, there exists the potential for its
uptake and subsequent release of bicarbonate which can counteract acidification. Finally, tillage
practices have been shown to influence a soil’s ability to reduce ammonium mobility as no-till
soils promote increased immobilization of mineral nitrogen over conventionally tilled soils
(Kitur et al., 1984).
Factors that most influence the rate of nitrification in soils when substrate is not limiting
have been identified by investigators as temperature, soil moisture content, pH, soil texture,
osmotic potential, and aeration. Additionally, it has been shown that there are geographical
and/or climatic correlations with optimum temperature as well as interactions between optimum
soil moisture and temperature.
With respect to the problem observed with the growth of cotton plants in the cabin field,
the question would seem to be: How does subsoil acidity develop on one side of a field and not
another when relatively uniform management practices have been in place for many years? We
4
know that naturally occurring, within-field variability accounts for a wide range of values for
various soil physical and chemical properties. Therefore, uniform applications on a field scale of
fertilizers and liming agents based on test results for composite soil samples will result in some
portions of a field receiving deficient amounts of amendment while other areas receive excessive
amounts.
Within-field variability of topography, soil physical, chemical, and biological properties
will affect the physical, chemical, and biological fate of ammoniacal fertilizers following
application. For example, coarser soil will allow for more rapid downward transport of
ammonium (NH4+). Differences in soil pH buffering capacity on the field scale will also result
in differential responses to pH affecting inputs such as the aforementioned ammoniacal fertilizers
and liming agents.
Thus, our goal should be to facilitate the evolution of agricultural management practices
along with our understanding of field scale variability to include less uniform application of
inputs. As it has been shown that maintenance of topsoil pH at a level of 6.0 or above can
prevent the development and even facilitate a gradual remediation of subsoil acidity (Gascho and
Parker, 2001) precision agriculture approaches will lead to better targeting of sub-field scale soil
fertility requirements and a realization of that goal.
The data I have collected from soils typical of those under intensive cropping in the
Coastal Plain will hopefully shed some light on the factors affecting nitrification rates in these
soils. Analysis of the data may further suggest management practices, particularly in the area of
tillage, liming, and application of ammoniacal fertilizers, which can most effectively ameliorate
and prevent acidification of the subsoil in the Coastal Plain of Georgia.

5
The purpose of the review that follows is to provide empirical evidence for the
description of a model wherein the development of subsoil acidity results from the application
and subsequent nitrification of ammoniacal fertilizers with particular attention paid to more
coarsely textured soils such as those typically found under intensive row crop production in the
Southeastern Coastal Plain of the United States. Responses of chemolithoautotrophic nitrifiers
included in the framework of this model with respect to activity, ecology, and enzymology will
be considered in detail as necessitated by the central role these organisms are proposed to fulfill
within the system.
6
Table 1.1. Soil available water (%) remaining with depth on the North and South ends of the cabin field at Crisp County, Georgia, illustrating the more efficient removal of soil available
water in lower horizons on the South end.
Date of Measurement South 12" South 20" South 28"
6/12 85 90 92 6/22 70 72 72 7/1 48 2 0 7/8 25 0 0 7/18 78 11 0
7/29 55 0 0
Date of Measurement North 12" North 20" North 28"
6/12 100 99 100 6/22 64 93 95 7/1 0 62 69 7/8 0 1 37 7/18 93 93 87
7/29 37 84 84
Table 1.2. pH with depth on the North and South ends of the cabin field at Crisp County, Georgia, demonstrating a probable causative relationship with water extraction by cotton plants.
Depth (inches) pH North End pH South End
0-12" 5.5 5.5 12-24" 5.2 6.2 24-36" 5.2 6.6 36-48" 5.4 6.1 48-60" 5 6.1
7
References
Bouman, O.T., D. Curtin, C.A. Campbell, V.O. Biederbeck, and H. Ukrainetz. 1995. Soil acidification from long-term use of anhydrous ammonia and urea. Soil Sci. Soc. Am. J. 59:1488-1494.
Gascho, G.J., and M.B. Parker. 2001. Long-term liming effects on coastal plain soils and crops. Agron. J. 93:1305-1315.
Haynes, R.J. 1986a. Nitrification. In Mineral Nitrogen in the Plant-Soil System (Kozlowski, T.T. ed.), pp. 127-157. Academic Press, Inc. Orlando.
Haynes, R.J. 1986b. Uptake and assimilation of mineral nitrogen by plants. In Mineral Nitrogen in the Plant-Soil System (Kozlowski, T.T. ed.), pp. 303-358. Academic Press, Inc. Orlando.
Kitur, B.K., M.S. Smith, R.L. Blevins, and W.W. Frye. 1984. Fate of 15N-depleted nitrate applied to no-tillage and conventional tillage corn. Agron. J. 76:240-242
Sumner, M.E., and A.D. Noble. 2003. Soil Acidification: The World Story. In Handbook of Soil Acidity (Rengel, Z., ed.), pp. 1-28. Marcel Dekker, Inc. New York.
8
II. Soil and Subsoil Acidity
Overview
Acid soil conditions have long been recognized as being detrimental to agricultural crop
yields and are characterized by pH values < 7.0, with most crops expressing symptoms of stress
at values below pH 5.5 (Vitorello et al, 2005; Islam, et al. 1980). It is estimated that 40% of the
world’s arable land contains acidic soils (von Uexküll and Mutert, 1995). Soils may naturally
become acid as a result of parent materials originally deficient in base cations such as calcium
(Ca2+), magnesium (Mg2+), and potassium (K+) or may similarly result from prolonged
weathering wherein the same base cations are removed via leaching by normal rainfall (Foy,
1984). Anthropogenic sources of soil acidity include the combustion of fossil fuels which
acidify rainfall, the application of elemental sulfur-containing and/or ammoniacal fertilizers, and
the loss of base cations through crop plant material removal.
If left untreated, the development of soil acidity will render land unfit for agricultural
production. Treatment most often involves the application of agricultural liming agents such as
crushed calcitic or dolomitic limestone, though symptoms of acid stress in crops have been
alleviated with the application of gypsum (Toma et al. 1999; Farina et al. 2000) and organic
materials such as manures or composts (Hue and Licudine, 1999; Inoue et al. 2001). It has been
demonstrated that applications of agricultural lime can as much as double crop yields over those
produced on unlimed soil (Gascho and Parker, 2001; Sumner et al. 1986).
Application of agricultural lime is typically achieved by incorporating the material into
the topsoil layer, although in the case of no- or minimal-tillage practices, surface application is
necessitated. Both methods are effective at ameliorating acidity and/or maintaining a topsoil pH
appropriate for crop production (Sumner and Yamada, 2002). However, remediation of subsoil
9
acidity may require methods that are more costly in terms of money, energy, and time. These
approaches include (but need not be confined to) deep mechanical incorporation and deep
injection of liming agents (Farina and Channon, 1988; Edmeades and Ridley, 2003; Sumner et
al. 1986). Given time, though, it has been shown that a proper maintenance of topsoil pH
(Gascho and Parker, 2001) and the accumulation of organic matter (Foy, 1984; Hue and
Licudine, 1999) can prevent or even effect a slow positive change in subsoil horizons with
respect to acidity.
The fertility of acid soils is reduced primarily due to a combination of 1) the toxicities of
aluminum, manganese, and iron, and 2) deficiencies of calcium, magnesium, phosphorus,
molybdenum, and potassium (von Uexküll and Mutert, 1995; Foy, 1984). These mineral
toxicities and deficiencies will result in depressed crop yields and diminished whole plant health.
When considering the effects on plant growth specific to acid subsoils, however, it is a severe
constraint on the ability of roots to proliferate throughout lower horizons that dominates the list
of issues. If prevented from exploring lower horizons, a vast storehouse of potentially available
nutrients and water will remain out of reach for the plant. This scenario then becomes one in
which a crop will be less able to weather drought and other stresses throughout the growing
season. Larger and more frequent inputs will be required to maintain the viability of the land for
agricultural production as the volume of soil utilized by the plants will be confined to the
uppermost horizons.
Depth of Root Penetration
Maximum rooting depths for herbaceous and crop plants have been reported as being
approximately 2 meters (Canadell et al. 1996). Herron et al. (1971), found corn (Zea mays) roots
as deep as 1.5 m. Li et al. (2001) measured cotton (Gossypium hirsutum L.) root penetration to a
10
depth of 0.9 m in a sandy soil (sand content = 810 g kg-1) with the main distribution of root
material occurring in the top 0.3 m. This asymmetrical distribution is very common as topsoil is
typically much richer in mineral nutrients than subsoil, although some nutrients such as the
anionic nitrate (NO3-) are known to be highly mobile in soil profiles. Conversely, and
particularly in between rainfall or irrigation events, the bulk of the water will be found in subsoil
horizons. An ability to explore these depths allows a plant some advantage in times when water
supply is restricted.
There is considerable ecological significance attached to the ability to set deep roots in
the areas of water, carbon, and nutrient cycling. Gregory et al. (1978) reported that the 3% of the
total root weight of winter wheat found below 1 m supplied 20% of the transpired water during
dry periods. Caldwell and Richards (1989) showed that hydraulic lift, a process wherein deep
rooted plants take up water from lower soil layers and release it from shallow roots back into
upper soil layers, was responsible for as much as a 50% increase in daytime canopy water flux
that in turn supplied water to less deeply rooted neighbors. Deep roots are also critical in the
recovery of nitrate from lower profiles. Access to stores of NO3- below 30 cm prevents
contamination of groundwater supplies and economic waste from lost nitrogen input. Finally,
deep rooting places carbonaceous organic matter into the lower horizons. Acidic subsoils have
the potential therefore to prevent recovery of nitrate, sequestration of carbon, and utilization of
water otherwise available to the entire canopy.
Inhibition of Root Growth
In contrast to the plethora of mineral toxicities and nutrient deficiencies responsible for
the decreased fertility of acid soils affecting whole plant health and crop yields, the mechanisms
by which root growth specifically is inhibited are confined almost entirely to aluminum toxicity
11
and/or calcium deficiency (Adams and Moore, 1983, Adams and Hathcock, 1984, Howard and
Adams, 1965). It should be noted that calcium deficiencies are rarer in managed soils than
aluminum toxicity. Nonetheless, there exists a potential for calcium leached below the root zone
in acid subsoils even under managed conditions.
Root injury as a direct result of H+ concentration in soil is expected for most plants only
at pH values at or below 3.3 (Islam et al., 1980). Some more sensitive species have been shown
to be inhibited by H+ at pH 4.0 (Howard and Adams, 1965). Islam et al. (1980) reported that
hydrogen ion-injured root morphology is characterized by short, thickened roots that are
comparatively few in number and discolored brown or dull grey. Lateral root growth under these
conditions was severely inhibited. These researchers further reported that at a pH value of 4.8, in
solution culture absent of aluminum toxicity, roots exhibited no signs of injury. Root
morphology was normal with a fine, light colored and profusely branched structure. It is fair to
say, however, that pH levels in the range of 3.3 to 4.0 represent severe extremes in agricultural
and natural soil systems and so will not be explored further within this review.
Aluminum in Soil
Aluminum comprises about 7 percent of the Earth’s mass (Delhaize and Ryan, 1995). It
is the most abundant metal and the third most abundant element in the Earth’s crust, the bulk of
which occurs as aluminosilicate soil minerals (Rengel, 1992; Kochian, 1995). At neutral pH
values, aluminum is primarily in the form of insoluble aluminosilicate, hydroxy-aluminum, or
aluminum oxide minerals (Kochian, 1995), but under acid conditions aluminum in soil is made
soluble and mobile in levels that adversely affect root and plant growth.
The primary form of aluminum thought to be responsible for toxicity to plant root tissue
has been the focus of much study. There is a general agreement that it is the mononuclear
12
species of aluminum that are the most phytotoxic. One interesting suggestion has been that the
trivalent cationic form Al3+ may be the primary phytotoxic species to monocots (Kinraide, 1991;
Parker et al. 1988) while dicots are more susceptible to the Al(OH)2+ and Al(OH)2+ forms (Alva
et al.1986; Kinraide and Parker, 1990). From a solution chemistry standpoint, this information
would lead one to believe that dicots would experience symptoms of aluminum stress at higher
soil solution pH levels than monocots. Unfortunately, the existing literature does not provide a
basis for supporting such a broad and convenient statement.
To put this into perspective, in solutions of pH < 5.0 aluminum exists as the octahedral
hexahydrate (Al(H2O))63+ which is conventionally symbolized as Al3+. The high ionic charge
associated with aluminum (z = 3+) coupled with the small ionic radius (r = 0.054 nm) strongly
polarizes water molecules in its hydration shell (Vitorello et al. 2005). As pH rises, Al(H2O)63+
undergoes successive deprotonations to form Al(OH)2+, Al(OH)2+, and Al(OH)3 at neutral pH
(equations 1 – 3, Table 1.3). It should be clear from equations 1 – 3 that free aluminum in soil
solutions represents a profound source resistance that must be overcome prior to imposing an
effective positive change in soil pH.
Polymeric aluminum has also been reported to exert some inhibitory effects on plant root
growth in pure solution culture; although its significance in the soil systems has been
downplayed (Bertsch and Parker, 1996; Parker et al. 1988) as the high charge associated with
polymeric species results in an enhanced affinity for negatively charged soil particles.
Furthermore, polymeric species may be too large to gain access to the interior of the root cell and
are thought to simply exist as intermediates in the formation of gibbsite that do not persist for
long periods of time. Free aluminum activity in soil solution is known to be significantly
affected by the activities of several inorganic anions such as sulfate (SO42-), fluoride (F-),

13
phosphate (PO42-), and silicate (SiO4
4-) by precipitation and/or complexation (Menzies, 2003).
Complexation may also occur between monomeric aluminum species and organic acids due to
strong interactions with oxygen donor ligands (Kochian, 1995; Hargrove and Thomas, 1981).
Mechanisms of Al Toxicity
Much work has been performed in the area of uncovering the specific mechanism/s by
which aluminum exerts inhibitory effects on plant roots. Hecht-Buchholz and Foy (1981)
characterized aluminum toxicity as resulting in stunted brown root tips, inhibition of newly
emerging lateral roots, destruction of root cap cells, and swelling and destruction of epidermis
and cortex cells. Adams and Lund (1965) established a relationship between root length and
molar activity of aluminum in solution. Generally speaking, aluminum is known to interfere
with the cell wall, the plasma membrane, and the cytoskeletal structure of plant root cells
(Vitorello et al. 2005). This leads to the potential efflux of cellular solutes and increased access
for aluminum to intracellular target sites.
Clarkson (1965) was the first investigator to show the correlation between aluminum
inhibition of root elongation and cessation of mitotic Figures in the root meristem. In this study,
he explained the aluminum induced morphological abnormalities of Allium cepa (garden onion)
roots as arising from a constraint on either cell division or cell extension. These abnormalities
were observed to include (1) a reduction or inhibition of the growth of the main axis of the root
and (2) initiation of numerous lateral roots, the growth of which were subsequently reduced or
inhibited. He showed that other metals from the same column of the periodic table (i.e. same 3+
valence charge) such as gallium, indium, and lanthanum produced similar results. Clarkson
concluded from this study that some mechanism associated with cell division is highly sensitive

14
to aluminum and is permanently damaged by short exposures. Furthermore, he noted that the
observable effect of aluminum exposure in Allium Cepa roots was rapid.
In a study of the influence of aluminum ions on sugarbeet roots, Keser et al. (1975)
observed extraneous material in the apical meristem, root cap, and cortical region of roots
exposed to aluminum that were not observed in normal roots. The apical regions did not exhibit
a typical organization and cells divided in an irregular pattern. Keser detailed the differences
between normal and abnormal roots in this study. In normal roots, the root cap and epidermis
arose from a single tier of initials 5 to 7 cells wide, while abnormal roots developed larger cells
in the area between the root cap and epidermis that contained a red staining precipitate composed
of Al(PO4), a substance thought to interfere with cell division. In normal cells, the tissue
structure of lateral roots was similar to primary root structure and was initiated in the pericycle.
In abnormal roots, the root cap and cortex disintegrated and nuclei were not observed.
Furthermore, the root cap separated with time and cells divided with an irregular pattern in which
the root tip was curved. A higher number of lateral roots that ceased to grow soon after
emergence was a phenomenon once again reported as being a result of aluminum exposure.
These were explained to be initiated at or near the apical region of the primary root. One
interesting note resulting from this study is that some plants grew better at minor levels of
aluminum in solution than when aluminum was completely absent, an observation supported by
Hackett (1962).
The effects of aluminum on cell elongation and expansion has been attributed to a
reduction in cell wall extensibility in wheat roots (Ma et al. 2004). These authors confirmed the
rapidity of effect for Al on root elongation. Inhibition occurred within hours and most of the

15
aluminum was bound to the cell wall. Longer exposures allowed for greater infiltration of Al
into other cell structures.
Aluminum uptake mechanisms and effects at the sub-cellular level have been
documented by several researchers. Though negatively charged outer surfaces of plasma
membranes will attract positively charged ions, trivalent cations such as aluminum are virtually
insoluble in lipid bilayers and are therefore unable to cross the plasma membrane through
passive transport. However, aluminum was reported by Delhaize and Ryan (1995) as being
present in the symplasm of root apices shortly after exposure. It has been suggested that
aluminum may cross the plasma membrane via active transport channels as Al3+ (r = 0.054 nm)
has a similar ionic radius to other biologically important cations such as Fe3+ (r = 0.065 nm) and
Mg2+ (r = 00.072 nm) (Sigel and Sigel, 1988).
Rengel (1992) noted that aluminum need not enter the cytoplasm for toxic effects to
occur. Free aluminum has been shown to inhibit initial adsorption of calcium on negatively
charged surfaces of root cells by competitive reduction of short term Ca2+ uptake. Also, root hair
formation in leguminous species is reduced in the presence of free aluminum, subsequently
inhibiting the initial nodulation step of rhizobial attachment. Smit et al. (1987) demonstrated that
calcium binding proteins (e.g. rhicadhesin) are necessary for adsorption of Rhizobia to root hairs
in peas.
Al-Ca Interactions
Interactions between calcium availability and aluminum toxicity have been reported
within plant root cells as well as external surfaces. Ryan et al. (1993) placed the site of Al3+ root
growth inhibition at the meristem and root cap by comparing exposures of only the root cap to Al
with exposure to the remaining portion of the root. However, Schofield et al. (1998) measured

16
aluminum and calcium distribution in root tips via PIXE (particle-induced X-ray emission) in a
study that compared root growth with and without the root cap structure in the presence of toxic
concentrations of aluminum. They showed that aluminum was present only in fractional
amounts when compared to calcium and concluded that aluminum does not directly inhibit
growth in the interior of the apical root meristem as the root growth rate was unaffected by root
cap removal. The authors instead suggested that growth inhibition by aluminum was mediated
by a signal initiated or disrupted by excess Al3+ in the periphery of the meristem and was related
to calcium distribution in the cell.
Aluminum disruption of the root plasma membrane interferes with such essential cellular
processes as the regulation of transmembrane potential and pH gradients and may possibly result
in the formation of non-bilayer lipids (Hargrove and Thomas, 1981). Calmodulin, a small acidic
protein present at high levels in root caps, regulates intracellular calcium concentrations,
integrates calcium-dependent processes, and has been shown to be adversely affected by
aluminum present in the interior of plant root cells (Haug and Caldwell, 1985). Membrane
bound ATPases are involved in the transport of calcium ions in plant cells. Complexes between
these enzymes and aluminum are key lesions in the syndrome of aluminum toxicity, as the
protein is denatured and rendered incapable of exercising its regulatory properties.
Other mechanisms important to the phytotoxicity of aluminum discussed in the available
literature include binding to the phosphate groups of DNA molecules and the imposition of
oxidation stress (Vitorello et al. 2005). The latter must be an indirect effect as aluminum is a non
redox-reactive metal, and may involve some influence on the substrates of oxidation. Finally,
Delhaize and Ryan (1995) summed their study on aluminum toxicity and tolerance in plants with
speculations that interactions between aluminum and the cell wall include possible binding to
17
pectic residues or proteins that decrease extensibility, displacement of other cations from critical
sites on the cell wall and/or membrane, binding to membrane-bound proteins involved in nutrient
transport, or disruption of intracellular metabolism by triggering secondary messenger pathways.
It is clear then that the soil solution aluminum-plant root interface sub-system of a model
describing subsoil acidity effects is complex and includes interactions both within and without
the root cell. These reactions may be classed under any of the following broadly defined
mechanisms: those affecting physical root expansion and division, those affecting the
transcription and/or signaling of DNA, RNA, or mRNA, disruption of the plasma membrane, cell
wall, or cytoskeleton, those that interfere with the uptake and/or intracellular regulation of
calcium, oxidative stress, and those external processes related to interface with the soil
environment including mychorrizal attachment and the availability of essential cations for plant
nutrition. Understanding the important mechanisms involved not just at the soil solution level,
but also at the cellular and sub-cellular level, will help in predicting plant responses, choosing
the most appropriate ameliorative program, and selecting the most aluminum tolerant cultivars
for agricultural production.
Calcium in Soil
Calcium accounts for roughly 3.5% of the Earth’s crust with typical ranges in non-
calcareous soils around 0.7% to 1.5% (Havlin et al. 2005). Expected fates of calcium in or
applied to soils include; 1) leaching by drainage water, 2) absorption/immobilization by soil
organisms, 3) adsorption to cation exchange sites, and 4) precipitation as secondary calcium
compounds. Only that calcium existing as the cationic form (Ca2+) in solution or adsorbed phase
is considered plant available. Typical temperate region soils (non-calcareous) exhibit soil
18
solution concentrations of 30 to 300 ppm while a paltry 15 ppm (375 µM) is considered
sufficient to supply growth (Havlin et al. 2005).
As previously noted, calcium deficiency is less common in managed soils than aluminum
toxicity. However, in highly weathered soils in humid regions with soils formed from low
calcium containing parent materials, the possibility of deficiency is very real, and so its inclusion
into a model describing the development and effects of subsoil acidity must be considered. The
coarse sandy soils often found under agricultural production in the Southeastern U.S. Coastal
Plain fit this description and have been documented as being deficient in plant available calcium
(Howard and Adams, 1965; Adams and Moore, 1983). In acid examples of these soils, the
potential for calcium deficiency is markedly increased either through increased dissolution
coupled with percolation and loss through the root zone (Terry and McCants, 1970) or induced
by interactions between free aluminum and calcium uptake by roots (Schofield et al. 1998;
Rengel, 1992). Loss of Ca2+ may be countered by lime which raises the pH and provides
exchangeable calcium. However, the low solubility of lime unfortunately confines its zone of
effectiveness to the topsoil. Acid subsoils will require other approaches to increase available
calcium at depth to promote subsoil penetration by crop plant roots. These approaches may
include the physical placement of lime at depth via deep incorporation or deep injection, and/or
alternative inputs such as gypsum or organic manures, which contain more soluble forms of
calcium (Hue and Licudine, 1999; Alva et al. 1990). The two latter examples of inputs will
increase subsoil exchangeable calcium more rapidly, though without directly addressing the
problem with pH.
19
Role of Calcium in Plant Roots
Calcium is classified as an essential macronutrient and has many functions in plants.
These functions include contributions to cell elongation and division as well as cell wall
membrane integrity and permeability. Calcium is also necessary for the translocation of sugars
and starches throughout the plant. While the whole plant effects of aluminum toxicity are mainly
expressed as a limitation of nutrient and water uptake due to constrained root growth, calcium is
involved in many physiological functions and effects of root inhibition are compounded by
reduced uptake of calcium as a nutrient.
Calcium starved roots exhibit an abnormal morphology characterized by straight, small-
diameter primary roots with brown tips (Howard and Adams, 1965). Recent research confirms
the role of calcium in root cell elongation and growth. Much of this work was done with
Arabidosis thaliana, or Thale Cress, often used as a model organism in plant biology. Šamaj et
al. (2004) reported that signaling enzymes such as NADPH oxidase and pholpholipase D are
crucial for root hair growth and development by activating calcium ion channels in the apical
plasma membrane leading to a tip-focused calcium gradient. The behavior of this gradient was
studied by Bibikova et al. (1997). These investigators induced a forced redirection of root hair
tip growth by rapidly producing a localized Ca2+ gradient. Their results demonstrated that some
sensing mechanism in root hair tips can signal for a change in root hair growth. Removal of the
gradient source resulted in the restoration of root hair growth oriented parallel to the root. This
behavior must aid plants in the uptake of non-homogenously distributed, more localized supplies
of calcium.
Calcium as a nutrient (Ca2+) may not cross suberized tissue in plants (Havlin et al. 2005),
and so uptake by roots is limited to meristematic areas where a continuous endoderm has not yet

20
formed. The root apex has significantly higher rates of cell division, cell elongation, and calcium
uptake relative to the mature root (Beemster and Baskin, 1998). Kiegle et al. (2000) identified
calcium specific hyper-polarization activated uptake channels that may play a large role in the
supply of Ca2+ received by the plant. These channels were identified only in the elongation zone
of roots, where cells are rapidly growing at the root apex and were shown to be activated at
membrane potentials of less than -120mV. Interestingly, the authors reported that these channels
were irreversibly inhibited by small concentrations of Al3+. Demidchick et al. (2002) described
voltage-independent, non-selective cation uptake channels that coexist with the hyper-
polarization activated uptake channels. These were found to be inhibited by the trivalent cations
Gd3+ and La3+, though effects specific to aluminum were not mentioned. They proposed a
calcium acquisition system for plant roots in which the non-selective cation uptake channels
dominate in more mature epidermal cells while the hyper-polarization activated Ca2+ selective
channels predominate in the rapidly expanding cells of the root apex where a more rapid influx
of calcium is needed to stabilize cells and facilitate elongation.
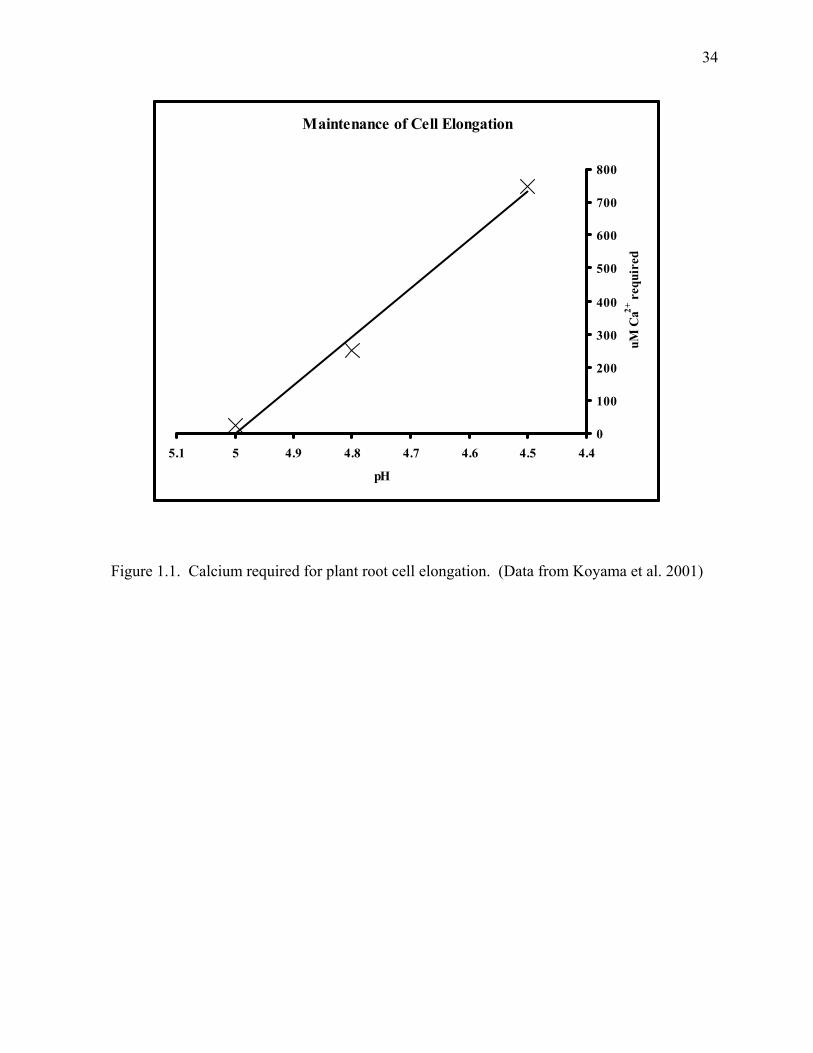
Koyama et al, (2001) studied the growth of A. thaliana roots in Al-free acidic solution
culture. At pH ~4.5, they found that the elongation zone of growing roots lost viability within 1
to 2 hours. This damage was reported to be irreversible after only 1 hour. Growing lateral roots
were similarly affected but non-growing lateral roots remained entirely viable, an observation
that strengthens the concept of meristematic tissue as the locus of sensitivity to soil acidity-
induced calcium deficiency. In this study it was determined that, at pH 5.0, growing roots
required 25 µM of calcium to maintain elongation. At pH 4.8 and pH 4.5, the growing roots
required 250 µM and 750 µM respectively (Figure 1.1). Havlin et al. (2005) set the
concentration in soil solution necessary to provide sufficient levels for whole plant nutrition at
21
375 µM under non-stress conditions. Damage done by hydronium ions in solution was found to
be ameliorated by divalent cations in the order Ba2+ (r = 1.34 Å) ≈ Sr2+ (r = 1.12 Å) ≥ Ca2+ (r =
0.99 Å) > Mg2+ (r = 0.66 Å). In this study, potassium (K+) was ineffective at ameliorating proton
damage. This order not only follows the order of ionic radii from largest to smallest in efficacy
of ameliorating proton damage, but also the order of selectivity coefficients for pectin from
largest to smallest. This relationship led the authors to conclude that the primary target of proton
toxicity may be linked to a disturbance in the stability of the pectic polysaccharide network,
where calcium fulfills a key role in plant roots.
What should be clear from the existing research is a general condition wherein calcium is
an essential requirement for whole plant function, but especially necessary for new growth and
stability of root cells. Trivalent cations (primarily Al3+) are directly and indirectly phytotoxic
through a number of mechanisms, all of which seem to target the most sensitive meristematic
tissue. Probable direct effects include destruction of cell walls, plasma membranes, and
cytoskeletons, and interference with the normal function of DNA and crucial enzymatic
processes such as nutrient transport and regulation of trans-membrane potentials. Indirect effects
include competitive inhibition at nutrient uptake sites, displacement of cationic nutrients
adsorbed to extracellular walls, and inhibition of mychorrizal and rhizobial attachment. Divalent
base cations have been shown to ameliorate these effects. Increases in soil organic matter or
application of inorganic salts containing Ca2+ or Mg2+ provide good sources for such
ameliorative materials.
Overcoming Subsoil Acidity
Raising the pH (> 5.5) of soil by application of liming agents will ameliorate the toxic
effects of aluminum by causing it to precipitate out of solution as gibbsite (equations 1 – 3, Table

22
1.3). Unless deeply incorporated at great cost, however, the effect of carbonaceous liming
materials will be slow to affect exchangeable aluminum in subsoils. Successful amelioration of
aluminum toxicity following surface-applied or topsoil-incorporated gypsum is well documented
(Caires et al. 2002; Carvalho and van Raijj, 1997; Alva et al. 1990). Gypsum is much more
soluble than agricultural lime and will move downward through the soil profile much more
rapidly. This approach is explained to be more successful by Alva et al (1990) in soils
dominated by pH dependent charge, such as the soils of the Southeastern Coastal Plain, than in
those dominant in permanent charge characteristics and its effect is imposed by increasing
exchangeable calcium, and decreasing exchangeable aluminum.
Cation amelioration of the effects of aluminum on plant roots has been described in the
literature as well. Kinraide and Parker (1987) showed that increased calcium in the presence of a
static concentration of aluminum in solution resulted in an increase in root growth. The
mechanism the authors suggested in this study was improved calcium competition for external
cellular binding sites. This mechanism was also suggested by Rengel (1992) as being the result
of competition at the apoplasmic mouth of Ca2+ channels. Rengel (1992) also described an effect
of decreased ionic strength of aluminum in solution as other (base) cations become more
concentrated. Hue and Licudine (1999) attributed this ionic strength phenomenon to the
reduction in aluminum toxicity following the application of organic manures.
Additions of certain anions may also reduce the toxic effects of aluminum. Root
elongation of sunflower (helianthus annuus L.), soybean (glysice max Merr.), subterranean
clover (trifolium subterraneum L.), and alfalfa (medicago sativa L.) was shown to increase with
increases in the molar ration of phosphorus/aluminum (Alva et al. 1986). Sulfate induced
surface charge development in variable charge soils is credited by Alva et al. (1990) with the
23
reduction in free aluminum in soil solutions following application of gypsum. The presence of
fluoride and phosphate can remove aluminum from solution by precipitation, although use of
fluoride is not recommended due to its own phytotoxic properties.
Finally, it has been shown in many studies that soil organic materials are effective at
removing aluminum from soil solution. Haug and Caldwell (1985) and Adams and Moore
(1983) described chelation and immobilization of Al3+ by soil humiferous substances rich in
carboxylate ligands. Plant exudates that can chelate Al3+ in the rhizosphere such as malic acid
and citric acid are a natural defense against aluminum toxicity (Delhaize et al. 1993; Miyasaka et
al. 1991). Hecht-Buchholz and Foy (1984) ascribed Al resistance in barley to a mucigellic
substance covering the root cap cell. The effect of organic acid exudates and other defense
mechanisms should be considered to be extremely localized and not significant in the pH
improvement of the larger soil volume. Perhaps selection of cultivars that are similarly resistant
and/or exhibit an increased ability to generate exudates will be a successful approach to
overcoming aluminum toxicity, particularly in areas where vast tracts of land and/or remote
locations make lime applications a less feasible option.
Modeling Subsoil Acidity
The system of interest in an agricultural soil acidity model can be thought of to
include all living and dead plant material above, as well as the partial pressure of all gases in
contact with the soil surface as the upper boundary extending downward to include the entire
volume of soil and all its components to a depth that corresponds to the maximum rooting depth
of the plant species growing in that soil as the lower boundary. The scale of this model may be
adjusted to fit a plot, field or watershed of interest.
24
Not all inputs, exports, and/or accumulations that could be considered in this system will
contribute to the production (or consumption) of acidity. The list of processes pertinent to the
development of subsoil acidity, though not small, is reasonably finite and includes some
components of the carbon, nitrogen, and sulfur cycles as well as certain redox reactions
involving iron and manganese. Helyar and Porter (1989) asserted that soil acids are largely
derived from the carbon and nitrogen cycles as effects from the oxidation of sulfur are minimal
in comparison while the effects of Fe and Mn redox reactions are more important on a geological
time scale. De Vries and Breeuwsma (1987) stressed that actual acidification is result of the
weathering of soils, specifically the leaching of cations (regulated by the mobility of some major
anions) from the soil. Reconciling these two views is not difficult if one considers that it is the
openness of the system of interest as defined above with respect to the loss or exportation of
materials (existing and input) that leads to the uncoupling of the nitrogen and carbon cycles and
subsequent proton accumulation.
That the carbon and nitrogen cycles, as well as the cation cycle described by De Vries
and Breeuwsma (1987), contain the important processes accounting for nearly all of the soil acid
production/consumption in an agricultural system over the course of a growing season is
supported by Helyar and Porter (1989), Donnelly et al, (1997), and Verburg et al, (2003). This
review will therefore confine itself to discussion of those processes within the carbon, nitrogen,
and cation cycles that contribute to the change in soil pH germane to the range of agricultural
production practices common to the Southeastern U.S. Coastal Plain soils. A comprehensive
subsoil acidity model should also consider differential rates of pH change from horizon to
horizon and so must account for mass flow and diffusion of protons, aluminum, base cations, and
mobile anions as well as the influence of root uptake and excretion on the system with depth.
25
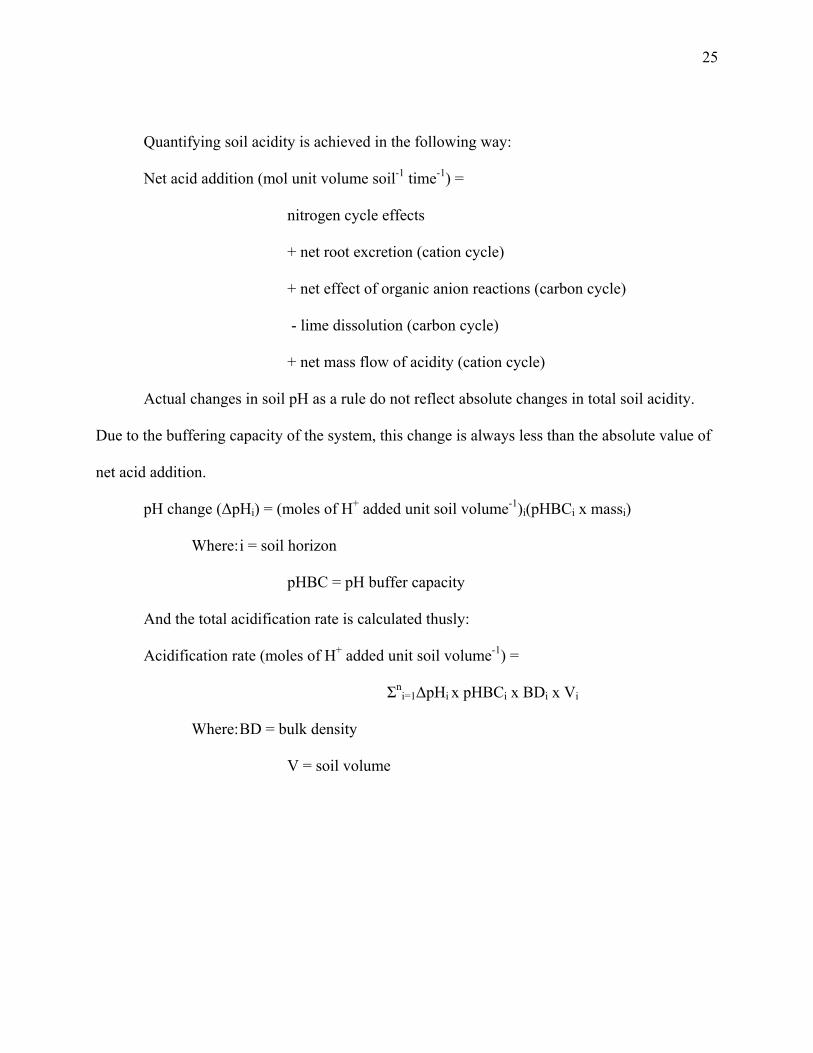
Quantifying soil acidity is achieved in the following way:
Net acid addition (mol unit volume soil-1 time-1) =
nitrogen cycle effects
+ net root excretion (cation cycle)
+ net effect of organic anion reactions (carbon cycle)
- lime dissolution (carbon cycle)
+ net mass flow of acidity (cation cycle)
Actual changes in soil pH as a rule do not reflect absolute changes in total soil acidity.
Due to the buffering capacity of the system, this change is always less than the absolute value of
net acid addition.
pH change (ΔpHi) = (moles of H+ added unit soil volume-1)i(pHBCi x massi)
Where: i = soil horizon
pHBC = pH buffer capacity
And the total acidification rate is calculated thusly:
Acidification rate (moles of H+ added unit soil volume-1) =
Σni=1ΔpHi x pHBCi x BDi x Vi
Where: BD = bulk density
V = soil volume

26
The Carbon Cycle
Soil water contains carbonic acid (H2CO3) in equilibrium with CO2 in the soil air
(Equation 1, Table 1.4). The partial pressure of CO2 in soil air varies from 0.0015 to 0.0065 atm
(Russel, 1973). Bicarbonate (HCO3-) and H+ are the dissociation products when this reaction
involves absorption of CO2 into the soil system and so acid accumulation results. In the reverse
situation (i.e. the reaction trends toward liberation of CO2), protons are consumed. Helyar and
Porter (1989) minimized the role of bicarbonate fluxes in acid soils without high rates of
leaching.
In the Coastal Plain, soils are known to undergo high rates of leaching and solute
movement (Terry and McCant, 1970) yet the rapidity with which bicarbonates react with protons
may limit the movement of these particular anions. For instance, carbonates released into the
soil solution following the application of agricultural lime will consume protons in a soil volume
located very near the initial placement of the material. The rate of lime dissolution is variable
(De Vries and Breeuwsma, 1987) and will depend on the amount applied, temperature, water
flow, and soil pH. Furthermore, Stevens and Blanchar (1992) have demonstrated a difference in
the solubility of and pH gradients surrounding particles of calcitic and dolomitic sources of lime
which may prove important to modeling efforts.
Organic anions similarly influence the development of acidity (Equation 2, Table 1.4).
Association/dissociation reactions can be involved in the production or consumption of acidity
and as such contribute strongly to soil pH buffer capacity. Additionally, complexation/chelation
of free aluminum by organic anions is a mechanism by which soil acidity can be reduced
(Equation 3, Table 1.4). In fact, soil organic matter reactions are credited as playing the largest
role in soil pH buffer capacity in soils containing 2:1 clay minerals (Magdoff and Bartlett, 1985).
27
However, when considering sandy subsoils of the Southeastern U.S. Coastal Plain, soil organic
matter contents are generally low.
Nitrogen Cycle
Nitrogen may be taken up by plants in either of two forms: the anionic nitrate (NO3-) or
the cationic ammonium (NH4+). Mineral nitrogen is introduced into the soil system in
meaningful amounts either through the mineralization of organic matter, or application as
fertilizer. Small amounts may be included in normal precipitation events as NH4NO3. The
importance of rainfall deposition in lands under agricultural production is likely dwarfed by the
contributions of ammonification and the application of nitrogenous fertilizers. It should be noted
that the practice of applying nitrate salts to agricultural lands is prohibitively expensive and
therefore highly uncommon.
The hydrolysis of organic nitrogen compounds leads to the consumption of one proton
per mole of ammonium produced, as will the application of fertilizers containing anhydrous
ammonia or urea (Equations 4, 7, & 12, Table 1.4). Ammonia resulting from these processes or
applied as ammonium salts will then likely, though not always, be converted to nitrate via a
bacterially mediated oxidation process termed nitrification. In this process, two moles of acidity
are produced for every mole of ammonium oxidized. No matter the source of ammoniacal
nitrogen, it should be clear that some amount of acidity will result from its introduction into the
soil system.
This net production of acidity can be reversed, however, if the nitrate produced from
nitrification is taken up by plant roots (Equation 10, Table 1.4). Because nitrogen is the mineral
nutrient taken up in the greatest amounts by plants, the form taken up (NH4+ or NO3
-) will likely
hold the greatest sway over the contribution to soil acidity provided by plant roots. Typical

28
concentrations of nitrogen in plants average around 1.5%. Potassium (K+) is second at around
1% of plant tissue by weight. Calcium (Ca2+) follows at 0.5%. Phosphorus (PO42-), magnesium
(Mg2+), and sulfur (SO42-) average 0.2% of plant weight each (Havlin et al, 2005). If one were to
exclude nitrogen uptake, it is clear that cations dominate the electrolytic distribution of nutrient
uptake by plants. Plants must maintain an electrochemical balance at the cellular and organism
levels, so excessive cation uptake (i.e. uptake of nitrogen as NH4+) will result in root excretion of
protons into the soil in the interest of maintaining this balance (Equation 9, Table 1.4). However,
if nitrate is the largest form of nitrogen taken up, then the potential exists to reverse this process
either through the accompanying uptake of protons or the excretion of hydroxyl (OH-) or
bicarbonate (HCO3-) ions. Adams and Pearson (1969) demonstrated this effect with the
application of calcium nitrate (Ca(NO3)2) and ammonium nitrate (NH4NO3) as nitrogen sources.
Subsoil acidity was corrected to depths of 60-80 cm with Ca(NO3)2 within 4 years in the
presence of active root uptake whereas lime application to the surface had only a marginal effect
in the 15-30 cm range. It is the loss of nitrate through leaching below the root zone that
uncouples this cycle and allows the rapid acidification of subsoils.
Other processes that may play a small role in the nitrogen cycle as it applies to soil
acidity are immobilization by soil organisms and denitrification. Immobilization leads to the
release of one proton per mole of nitrogen absorbed while denitrification of nitrate to gaseous
nitrogen (N2) consumes one proton per mole of nitrate. Denitrification however, is unlikely to
play a significant role within the soil system as defined due to the necessitation of anaerobic
conditions. Such conditions most often exist below the root zone in coarse, well drained soils,
placing its effects outside the system.
29
Cation Cycle
The cation cycle described by De Vries and Breeuwsma (1987) is regulated by the
activities and mobilities of primarily the following anions: HCO-, RCOO-, NO3-, and SO4
2-, and
actual soil acidification is largely imposed by the leaching of base cations form the soil.
H+ consumption (cation cycle) = M+out – M+
in + M+uptake.
Where: M+ refers to any base cation
Out is exported out of the system
In is input into the system
Uptake refers to plant uptake
According to these authors, removal of vegetation also causes soil acidification because it leads
to a continuous removal of cations from the soil. Furthermore, removal of vegetation
temporarily leads to proton production when mineralization is not balanced by uptake.
Cations that are evenly distributed throughout the profile in this model were considered
to be taken up by roots in proportion to the mass of roots within a given horizon. In the case,
however, where a nutrient is distributed in a more localized fashion, this assumption should not
be employed. This may lead to a localization of acid production or consumption which should
be addressed by the model. Marschner and Römheld (1983) demonstrated this phenomenon in a
beautifully designed split-root experiment involving 4 different species of plants (maize, wheat,
chickpea and white clover). All plants were grown in soil containers with separated
compartments into which different forms of nitrogen were supplied. The experiments clearly
showed that NH4+-N uptake and uptake by N2 fixation decreased the rhizosphere soil pH by as
much as 2 units while NO3--N uptake resulted in a 1.5 pH unit increase. As only the soil pH in
30
the respective compartments was affected, the authors concluded that plant root excretion of acid
or alkali components was localized and not expressed throughout the root system.
The Role of Roots in Subsoil Acidification
Studies by Marschner and Römheld (1983) and Adams and Pearson (1969) have
previously been cited as examples in which plant roots can affect their soil environment with
respect to pH in highly significant ways. Nitrate is normally incorporated into crops in greater
amounts than any other anionic nutrient and so its uptake prior to its leaching through the root
zone is of paramount importance to preventing the development of subsoil acidity. If this can be
affected in the lower portion of the root zone without incurring significant losses, the potential
for an increase in subsoil pH exists. Implementation of a winter cover crop program is
recommended to maximize this potential (Verburg et al., 2003; Helyar and Porter, 1989).
Uptake of nitrate may be inhibited in the presence of ammonium (Ayling, 1993; Howitt and
Udvardi, 2000) and this fact should not be ignored in modeling uptake when both N-sources are
available. Other studies have shown root excretions of protons in response to the uptake of
calcium (Demidchick et al. 2002; Kiegle et al. 2000) or to phosphorus deficiency (Neumann and
Römheld, 1999) or as a result of simple normal root growth (Versel and Mayor, 1985;
Weisenseel et al. 1979).
Summary
The development of acid subsoils (and acid soil in general) probably reflects the natural
trend of soils to weather with age and exposure to water. This progression is hastened by the use
of land for agricultural production mainly through the increased removal of base cations through
plant uptake and leaching as well as the input of ammoniacal fertilizers. Acid subsoils should be
31
of particular concern in soils that are already weathered to some degree and/or experience high
rates of leaching through the entire profile.
The main effect of acid subsoils on crop production is to diminish root proliferation to
lower horizons where water and nutrients are more available in times of water stress. This
inhibition of root growth is primarily caused by aluminum toxicity and/or calcium deficiency.
Of the two, aluminum toxicity more frequently causes inhibition of root growth in managed soils
that receive periodic lime treatments. Treatment of subsoil acidity has traditionally been
approached in the short term by deep incorporation or injection of liming agents. These methods
involve high costs and specialized machinery and could be prevented through simple long-term
management practices. Some acid subsoils have responded favorably to treatments involving
gypsum, which is more soluble than lime. Although it is another expensive option, fertilization
with nitrate salts has proven effective in the relatively short term.
As soils are not a homogenous medium spatially, temporally, or with respect to depth, it
may be unwise to treat them as such when modeling response to acid and alkali inputs. There
are many components to the soil system involved in soil acidity models. These include
elemental cycles, mass flow of solutes, and plant soil interactions. Two software-based soil
acidity models, GRAZPLAN and AP-SIM (Donnelly et al. 1997: McCown et al. 1996) have
been published in recent years. Verburg et al. (2005) have compared the success of each of these
models’ components and approaches.

32
Table 1.3. Some equilibrium reactions of importance to acid soils.
Equilibrium Reaction (25°C) K (stability constant) Hydrolysis of Al3+
(1)1 Al3+ + H2O ↔ AlOH2+ + H+ 9.55 x 10⁻⁶
(2)1 Al3+ + 2H2O ↔Al(OH)2+ +2H+ 5.01 x 10⁻¹⁰
(3)1 Al3+ + 3H2O ↔ Al(OH)30 +3H+ 1.02 x 10⁻¹⁵
Solubility of Gibbsite
(4)1 Al(OH)30 +3H+ ↔ Al3+ + 3H2O 1.10 x 10⁸
Aluminum Complexes
(5)1 Al3+ +F- ↔ AlF2+ 9.55 x 10⁶
(6)1 Al3+ + SO42- ↔ AlSO4
- 1.58 x 10³
(7)4 Al3+ + HPO42- ↔ AlHPO4
+ 1 x 10⁸ (8)2 Al3+ + Citric Acid ↔ Al-Citrate 7.41 x 10⁷ (9)2 Al3+ + Malic Acid ↔ Al-Malate 1 X 10⁶
(10)3 Al3+ + ATP ↔ Al-ATP 6.31 x 10⁹ (11)3 Al3+ + EDTA ↔ Al-EDTA 1.35 x 10¹⁶
Solubility of Calcium Minerals
(12)1 CaSO4·2H2O (gypsum) + H2O ↔ Ca2+ + SO42- + 2H2O 2.29 x 10⁻⁵
(13) CaCO3 (calcite)+ H2O ↔ Ca2+ + CO2(g) 3.8 x 10⁻⁹
1 Lindsay, W.L., Chemical Equilibria in Soils, 1979. John Wiley & Sons, NY. 2 Jones, D.L., 1998. Organic acids in the rhizosphere - a critical review. Plant and Soil 205:25-44. 3 Furia, T.E., 1972. Sequestrents in Foods. In CRC Handbook of food additives, 2nd ed. CRC Press. 4 Stumm, W., Morgan, J.J., 1981. Aquatic Chemistry, ed 2. John Wiley & Sons, NY.
33
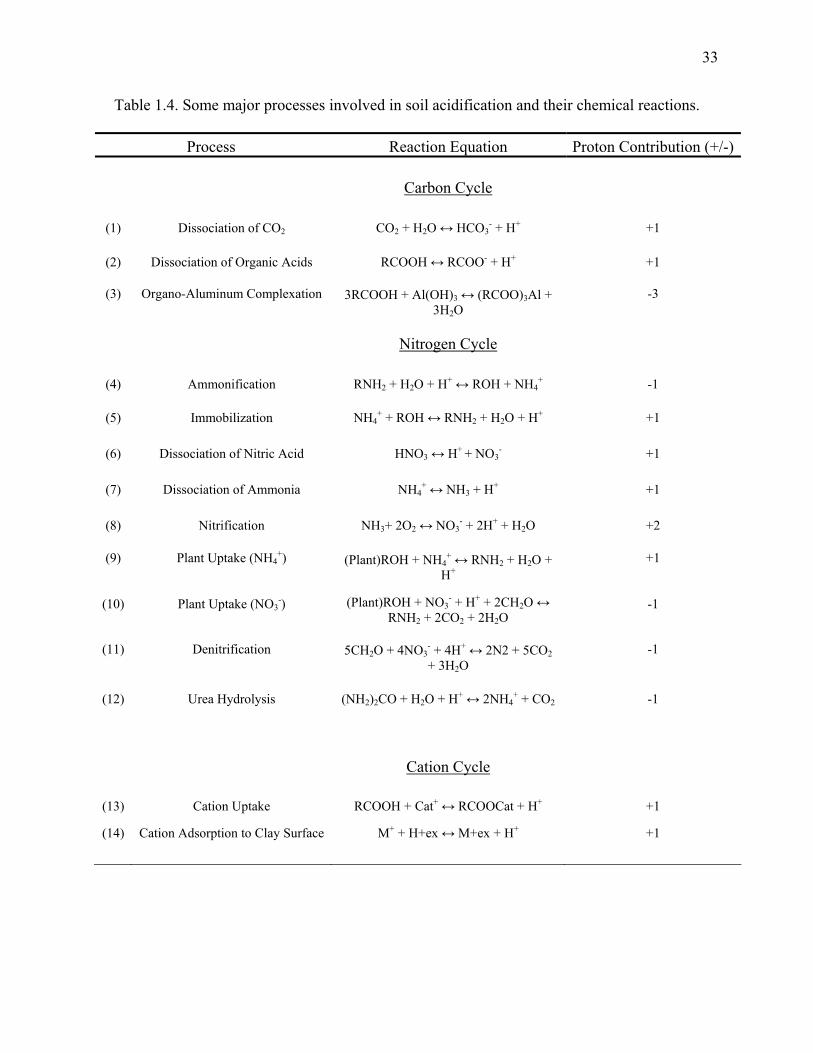
Table 1.4. Some major processes involved in soil acidification and their chemical reactions.
Process Reaction Equation Proton Contribution (+/-) Carbon Cycle
(1) Dissociation of CO2 CO2 + H2O ↔ HCO3- + H+ +1
(2) Dissociation of Organic Acids RCOOH ↔ RCOO- + H+ +1
(3) Organo-Aluminum Complexation 3RCOOH + Al(OH)3 ↔ (RCOO)3Al + 3H2O
-3
Nitrogen Cycle
(4) Ammonification RNH2 + H2O + H+ ↔ ROH + NH4+ -1
(5) Immobilization NH4+ + ROH ↔ RNH2 + H2O + H+ +1
(6) Dissociation of Nitric Acid HNO3 ↔ H+ + NO3- +1
(7) Dissociation of Ammonia NH4+ ↔ NH3 + H+ +1
(8) Nitrification NH3+ 2O2 ↔ NO3- + 2H+ + H2O +2
(9) Plant Uptake (NH4+) (Plant)ROH + NH4
+ ↔ RNH2 + H2O + H+
+1
(10) Plant Uptake (NO3-) (Plant)ROH + NO3
- + H+ + 2CH2O ↔ RNH2 + 2CO2 + 2H2O
-1
(11) Denitrification 5CH2O + 4NO3- + 4H+ ↔ 2N2 + 5CO2 + 3H2O
-1
(12) Urea Hydrolysis (NH2)2CO + H2O + H+ ↔ 2NH4+ + CO2 -1
Cation Cycle
(13) Cation Uptake RCOOH + Cat+ ↔ RCOOCat + H+ +1
(14) Cation Adsorption to Clay Surface M+ + H+ex ↔ M+ex + H+ +1
34
Maintenance of Cell Elongation
0
100
200
300
400
500
600
700
800
4.44.54.64.74.84.955.1
pH
uM C
a2+ r
equi
red
Figure 1.1. Calcium required for plant root cell elongation. (Data from Koyama et al. 2001)
35
References
Adams F., and Z.F. Lund. 1965. Effect of chemical activity of soil solution aluminum on cotton root penetration of acid subsoils. Soil Sci. 101:193-198.
Adams, F., and P.J. Hathcock. 1984. Aluminum toxicity and calcium deficiency in acid subsoil horizons of two coastal plains soil series. Soil Sci. Soc. Am. J. 48:1305-1309.
Adams F., and B.L. Moore. 1983. Chemical factors affecting root growth in subsoil horizons of coastal plain soils. Soil Sci. Soc. Am. J. 47:99-102.
Adams, F., and R.W. Pearson. 1969. Neutralizing soil acidity under bermudagrass sod. Soil Sci. Soc. Amer. Proc. 33:737-742.
Alva, A.K., D.G. Edwards, C.J. Asher, and F.P. Blamey. 1986. Relationships between root length of soybean and calculated activities of aluminum monomers in nutrient solution. Soil Sci. Soc. Am. J. 50:959-962.
Alva, A.K., M.E. Sumner, and W.P. Miller. 1990. Reactions of gypsum or phosphogypsum in highly weathered acid subsoils. Soil Sci. Soc. Am. J. 54:993-998.
Ayling, S.M. 1993. The effect of ammonium ions on membrane potential and anion flux in roots of barley and tomato. Plant, Cell and Environment 16:297-303.
Beemster, G., and T. Baskin. 1998. Analysis of cell division and cell elongation underlying the developmental acceleration of root growth in Arabidosis thaliana. Plant Phys. 116:1515-1526.
Bertsch, P., and D.R. Parker. 1996. Aqueous polynuclear aluminium species. In the Environmental Chemistry of Aluminum. (Sposito, G., ed.) Lewis Publishers, Boca Raton, Fl. Pp117-168.
Bibikova, T.M., A. Zhigilei, and S. Gilroy. 1997. Root hair growth in Arabidopsis thaliana is directed by calcium and an endogenous polarity. Planta 203:495-505.
Caires, E.F., I.C. Feldhaus, G. Barth, and F.J. Garbulo. 2002. Lime and gypsum application of the wheat crop. Scientia Agricola 59:357-364.
Caldwell M.M., and J.H. Richards. 1989. Hydraulic lift: water efflux from upper roots improves effectiveness of water uptake by deep roots. Oecologia 19:1-5.
Canadell, J., R.B. Jackson, J.R. Ehleringer, H.A. Mooney, O.E. Sala, and E.D. Schulze. 1996. Maximum rooting depth of vegetation types at the global scale. Oecologia 108:583-595.
Carvalho, M.C.S., and B. van Raij. 1997. Calcium sulphate, phosphogypsum and calcium carbonate in the amelioration of acid subsoils for root growth. Plant and Soil 192:37-48.
36
Clarkson, D.T. 1965. The effect of aluminium and some other trivalent metal cations on cell division in the root apices of allium cepa. Annals of Botany, N.S. 29:309-315.
De Vries, W., A. Breeuwsma. 1987. The relation between soil acidification and element cycling. Water, Air, and Soil Pollution 35:293-310.
Delhaize, E., P.R. Ryan, and P.J. Randall. 1993. Aluminum tolerance in wheat (triticum aestivum l.) II. Aluminum-stimulated excretion of malic acid from root apices. Plant Physiol. 103:695-702.
Delhaize, E., and P.R. Ryan. 1995. Aluminum toxicity and tolerance in plants. Plant Physiol. 107:315-321.
Demidchik, V., H.C. Bowen, F.J.M. Maathuis, S.N. Shabala, M.A. Tester, P.J. White, and J.M. Davies. 2002. Arabidopsis thaliana root non-selective cation channels mediate calcium uptake an are involved in growth. The Plant Journal 32:799-808.
Donnelly, J.R., A.D. Moore, and M. Freer. 1997. GRAZPLAN: decision support systems for Australian grazing enterprises. I. Overview of the GRAZPLAN project, and a description of the MEtAccess and LambAlive DSS. Agric. Syst. 54:57-76.
Edmeades, D.C., and A.M. Ridley. 2003. Using Lime to ameliorate topsoil and subsoil acidity. In Handbook of soil acidity (Rengel, Z., ed.) Marcel Dekker, Inc. New York.
Farina, M.P.W., and P. Channon. 1988. Acid-subsoil amelioration: I. A comparison of several mechanical procedures. Soil Sci. Soc. Am. J. 52:169-175.
Farina, M.P.W., P. Channon, and G.R. Thibaud. 2000. A comparison of strategies for ameliorating subsoil acidity: I. Long-term growth effects. Soil Sci. Soc. Am. J. 64:646-651.
Foy, C.D. 1984. Physiological effects of hydrogen, aluminum, and manganese toxicities in acid soil. In Soil Acidity and Liming (Adams, F. ed.) 2nd ed. Agron. Monogr. 12 SSSA, Madison, Wi.
Furia, T.E. 1972. Sequestrents in Foods. In CRC Handbook of food additives, 2nd ed. CRC Press, Orlando.
Gascho, G.J., and M.B. Parker. 2001. Long-term liming effects on coastal plain soils and crops. Agron. J. 93:1305-1315.
Gregory, P.J., M. McGowan, P.V. Biscoe, and B. Hunter. 1978. Water relations of winter wheat. I. Growth of the root system. J. Agric. Sci. 91:91-103>
Hackett, C. 1962. Stimulative effects of aluminum on plant growth. Nature 195:471-472.
Hardy, D.H., C.D. Raper, Jr., and G.S. Miner. 1990. Chemical restrictions of roots in ultisol subsoils lessened by long-term management. Soil Sci. Soc. Am. J. 54:1657-1660.
37
Hargrove, W.L., and G.W. Thomas. 1981. Effect of organic matter on exchangeable aluminum and plant growth in acid soils. ASA Spec. Publ. (Chem. Soil Environ.) 40:151-166.
Haug, A.R., and C.R. Caldwell. 1985. Aluminum toxicity in plants: The role of the root plasma membrane and calmodulin. In Frontiers of membrane research in agriculture, 359-381. St. John, et al (eds.) Rowman & Allanheld, Totowa, N.J.
Havlin, J.L., J.D. Beaton, S.L. Tisdale, and W.L. Nelson. 2005. Soil Fertility and Fertilizers, an Introduction to Nutrient Management 7th ed. Pearson/Prentice Hall, Upper Saddle River, NJ.
Hecht-Buchholz, C.H., and C.D. Foy. 1981. Effect of aluminium toxicity on root morphology of barley. In Structure and Function of Plant Roots, 343-345. R.Bouwer et al. (eds.) Martinus Nijhoff/Dr W. Junk Publishers, The Hague/Boston/London.
Helyar, K.R., and W.M. Porter. 1989. Soil acidification, its measurement and the processes involved, In Soil Acidity and Plant Growth (Robson, A.D., ed.) Academic Press, Sydney. pp. 61-101.
Herron, G.M., A.F. Dreier, A.D. Flowerday, W.L. Colville, and R.A. Olson. 1971. Residual mineral N accumulation in soil and its utilization by irrigated corn, Agron. J. 63:322-327.
Howard, D.D., and F. Adams. 1965. Calcium requirement for penetration of subsoils by primary cotton roots. 29:558-562.
Howitt, S.M., and M.K. Udvardi. 2000. Structure, function and regulation of ammonium transporters in plants. Biochimica et Biophysica Acta 1465:152-170.
Hue, N.V., and D.L. Licudine. 1999. Amelioration of subsoil acidity through surface application of organic manures. J. Environ. Qual. 28:623-632.
Inoue, K., S. Kondo, Y. Tamano, and H. Yokota. 2001. Amelioration of subsoil acidity in a nonallophanic andosol by surface application of organic calcium salts. Soil Sci. Plant Nutr. 47:113-122.
Islam, A.K.M.S., D.G. Edwards, and C.J. Asher. 1980. pH optima for crop growth. Plant and Soil 54:339-357.
Jones, D.L. 1998. Organic acids in the rhizosphere - a critical review. Plant and Soil 205:25-44.
Keser, M., B. F. Neubauer, and F.E. Hutchinson. 1975. Influence of Aluminum Ions on Developmental Morphology of Sugarbeet Roots. Agron. J. 67:84-88.
Kiegle, E., M. Gilliham, J. Haseloff, and M. Tester. 2000. Hyperpolarisation-activated calcium currents found only in cells from the elongation zone of Arabidopsis thaliana roots. The Plant Journal 21:225-229.
Kinraide, T.B. 1991. Identity of the rhiz-toxic aluminium species. Plant Soil 134:167-178.
38
Kinraide, T.B., and D.R. Parker. 1990. Apparent phytoxicity of mononuclear hydroxy-aluminum to four dicotyledonous species. Physio. Plant. 79:283-288.
Kochian, L.V. 1995. Cellular mechanisms of aluminum toxicity and resistance in plants. Annual review of plant physiology and plant molecular biology. 46:237-260.
Koyama, H., T. Toda, and T. Hara. 2001. Brief exposure to low-pH stress causes irreversible damage to the growing root in Arabidopsis thaliana: pectin Ca interaction may play an important role in proton rhizotoxicity. Journal of Experimental Botany 52:361-368.
Li, H., R.J. Lascano, J. Booker, T.L. Wilson, and K.F. Bronson. 2001. Cotton lint yield variability in a heterogeneous soil at a landscape scale. Soil and Tillage Research 58:245-258.
Lindsay, W.L. 1979. Chemical Equilibria in Soils. John Wiley & Sons, NY.
Ma, J.F., R. Shen, S. Nagao, and E. Tanimoto,. 2004. Aluminum targets elongating cells by reducing cell wall extensibility in wheat roots. Plant Cell Physiol. 45:583-589.
Magdoff, F.R., and R.J. Bartlett. 1985. Soil pH buffering revisited. Soil Sci Soc. Am J. 49:145-148.
Marschner, H., and V. Römheld. 1983. In vivo measurement of root-induced pH changes at the soil-root interface: Effect of plant species and nitrogen source. Z. Pflanzenphysiol. Bd. 111:241-251.
McCown, R.L., G.L. Hammer, J.N.G. Hargreaves, D.L. Holzworth, and D.M. Freebairn. 1996. AP-SIM: a novel software system for model development, model testing, and simulation in agricultural systems research. Agric. Syst. 50:255-271.
Menzies, N.W. 2003. Toxic elements in acid soils: chemistry and measurement. In Handbook of Soil Acidity (Rengel, Z., ed.), pp. 1-28. Marcel Dekker, Inc. New York.
Miyasaka, S.C, J.G. Buta, R.K. Howell, and C.D. Foy. 1991. Mechanism of aluminum tolerance in snapbeans. Root exudation of citric acid. Plant Physiol. 96:737-743.
Neumann, G., and V. Römheld. 1999. Root excretion of carboxylic acids and protons in phosphorus-deficient plants. Plant and Soil 211:121-130.
Parker, D.R., T.B. Kinraide, and L.W. Zelazny. 1988. Aluminum speciation and phytotoxicity in dilute hydroxyl-aluminum solutions. Soil Sci. Soc. Am. J. 52:438-444.
Rengel, Z. 1992. Role of calcium in aluminium toxicity. New Phytol. 121:433-413.
Russell, E.W. 1973. Soil conditions and plant growth. 10th ed. Longman, London.
Ryan, P.R., J.M. Ditomaso, and L.V. Kochian. 1993. Aluminium toxicity in roots: an investigation of spatial sensitivity and the role of the root cap. J. Exp. Bot. 44:437-446.
39
Šamaj, J., F. Baluška, and D. Menzel. 2004. New signalling molecules regulating root hair tip growth. Trends in Plant Science 9:217-220.
Schofield, R.M.S., J. Pallon, G. Fiskesjö, G. Karlsson, and K.G. Malmqvist. 1998. Aluminum and calcium distribution patterns in aluminum-intoxicated roots of Allium cepa do not support the calcium-displacement hypothesis and indicate signal-mediated inhibition of root growth. Planta 205:175-180.
Sigel, H., and A. Sigel. eds. 1988. Metal ions in biological systems: aluminum and its role in biology, Vol. 24. New York: Marcel Dekker.
Smit, G., J.W. Kijne, and B.J.J. Lugtenberg. 1987. Involvement of both cellulose fibrils and a Ca-dependent adhesion in the attachment of rhizobium leguminosarum to pea root hair tips. Journal of Bacteriology 169:4294-4301.
Stevens J.J., and R.W. Blanchar. 1992. Soil pH gradients near calcite and dolomite particles. Soil Sci Soc. Am. J. 56:967-972.
Stumm, W., and J.J. Morgan. 1981. Aquatic Chemistry, ed 2. John Wiley & Sons, NY.
Sumner, M.E., H. Shahandeh, J. Bouton, and J.E. Hammel. 1986. Amelioration of an acid soil profile through deep liming and surface application of gypsum. Soil Sci. Soc. Am. J. 50:1254-1258.
Sumner, M.E., and T. Yamada. 2002. Farming with acidity. Comm. in Soil Sci. and Plant Anal. 33:15-18.
Terry, D.L., and C.B. McCants. 1970. Quantitative prediction of leaching in field soils. Soil Sci. Soc. Am. Proc. 34:271-276.
Toma, M., M.E. Sumner, G. Weeks, and M. Saigusa. 1999. Long-term effects of gypsum on crop yield and subsoil chemical properties. Soil Sci. Soc. Am. J. 39:891-895.
Verburg, K., J. Braschkat, Z. Hochman, A.D. Moore, K.R. Helyar, N.E. Prober, J.N.G. Hargreaves, and R.J. Simpson. 2003. Modeling acidification processes in agricultural systems. In Handbook of Soil Acidity (Rengel, Z., ed.), pp. 135-187 Marcel Dekker, Inc. New York.
Versel, J-M. and G. Mayor. 1985. Gradients in maize roots: Local elongation and pH. Planta 164:96-100.
Vitorello, V.A., F.R. Capaldi, V.A. Stanuto. 2005. Recent advances in aluminum toxicity and resistance in higher plants. Braz. J. Plant Physiol. 17:129-143.
von Uexküll, H.R., and E. Mutert. 1995. Global extent, development and economic impact of acid soils. Plant Soil 171:1-15.

40
Weisenseel, M.H., A. Dorn, and L.F. Jaffe. 1979. Natural H+ currents traverse growing roots and root hairs of barley (Hordeum vulgare L.) Plant Physiol. 64:512-518.

41
III. Chemolithoautotrophic Nitrification in Sandy Soils
Overview
Nitrification is the term used to describe the biologically mediated oxidation of ammonia
to nitrate, a conversion from the most reduced to the most oxidized form of nitrogen (see table
1.5). This process is largely performed by chemolithoautotrophic bacteria in soil and aquatic
environments and is central to the global nitrogen cycle. Other documented pathways for the
oxidation of ammonia include heterotrophic bacteria, fungi, and actinomycetes (Tate, 2000;
Haynes, 1986), methanotrophs (De Boer, and Kowalchuk, 2001; Bedard and Knowles, 1989) and
the anaerobic oxidation of ammonium directly to N2 (annamox) by plantomycetes (Thamdrup et
al., 2006). Archaeal organisms similar to bacteria but given their own domain are also currently
being studied for their contribution to ammonia oxidation (Leininger et al. 2006; Tourna et al.,
2008). Chemical photooxidation has also been proposed as a possible pathway (Bartlett, 1981).
Under the range of conditions encountered in soils under agricultural production in the
Southeastern U.S. Coastal Plain, however, none of these alternative pathways are expected to
make meaningful contributions to the overall oxidation of ammonia. In fact, it is only under
extreme conditions which severely restrict or inhibit the activity of soil chemolithoautotrophic
nitrifiers (i.e. substrate limitation, pH < 4.5, the presence of inhibitory allelopathic substances,
anaerobic environment, etc.) that any of these alternative pathways becomes significant in
oxidizing mineral nitrogen. The scope of this review will therefore remain confined to the
subject of chemolithoautotrophic nitrification and its importance with respect to coarse textured
sandy soils such as those common to the Southeastern U.S. Coastal Plain.
Chemolithoautotrophs, so named because of their utilization of mineral ammonia (NH3)
as the sole source of energy (chemotrophy) and reductant (lithotrophy) and the use of CO2 as the
42
sole carbon source (autotrophy), fulfill a monumentally important role in the global nitrogen
cycle. These organisms are the primary reason that the Earth’s atmosphere, rather than its litho-
or hydrosphere, is the global sink for nitrogen. Without the oxidation of ammonia to nitrate,
ammonia/ammonium concentrations would continue to rise without providing substrate for
denitrification and subsequent production of gaseous nitrogen (N2, N20, etc.). Some well known
adverse environmental effects that have driven much of the research into nitrification are the
acidification of soils and the accumulation and leaching of nitrates into groundwater. The former
can lead to a decline in soil fertility while the latter is associated with human and animal health
concerns. In acknowledgement of this fact, the U.S. Environmental Protection Agency has
limited the permissible level of nitrates in water to 10 ppm NO3--N (40 CFR 141.11). Infiltration
of nitrate into freshwater systems may also lead to eutrophication of aquatic environments and
stimulation of phototrophic and/or heterotrophic organisms resulting in decreased biodiversity
and anoxification of the ecosystem.
The oxidation of ammonia by soil nitrifiers has been classically summarized by equation
[1].
NH3 + 2O2 → NO3- + H+ + H2O [1]
This equation can be broken down into two separate steps carried out by two phylogenetically
distinct groups of bacteria that collectively complete the process. The first group is often termed
ammonia-oxidizing bacteria (AOB). The organisms that belong to this group obtain their energy
by catabolizing ammonia (Suzuki et al., 1974; Hyman and Wood, 1985) and in soils include the
genera Nitrosomonas, Nitrosospira, Nitrosococcus, Nitrosolobus, and Nitrosovibrio (Table 1.6.
Nitrifiers and Morphology). The end product of the utilization of ammonia for energy by AOB
43
is nitrite. The second group is designated as nitrite-oxidizing bacteria (NOB) and contains the
single genus Nitrobacter.
All of the aforementioned genera of nitrifiers belong to the family Nitrobacteraceae, a
designation based on physiological properties such as the use of ammonia or nitrite oxidation as
an energy source and fixation of CO2 for organic carbon (Prosser, 1989). They are prokaryotic
organisms of the beta subclass Proteobacteria. All members of the family Nitrobacteraceae are
gram negative, yet exhibit a wide range of morphologies (Table 1.6). They share a common and
narrow phylogeny, probably originating from a single ancestor in common with methanotrophs
(Bedard and Knowles, 1989), and although some Nitrobacter spp. may be facultative anaerobes,
nitrification is an obligately aerobic process.
Enzymology of Ammonia Oxidation
The overall oxidation of ammonia to nitrate as given by equation [1] above is partitioned
between the two groups of bacteria as follows.
AOB NH3 + 1½O2 → NO2- + H2O + H+ + 84 kcal mol-1 [2]
NOB NO2- +½O2 → NO3
- + 17.8 kcal mol-1 [3]
Equation [2] produces roughly 4 times the amount of energy as equation [3] and involves a
compound reaction wherein a hydroxylamine intermediate is produced and further oxidized to
nitrite. The process described by equation [2] requires two separate enzymes, ammonia mono-
oxygenase (AMO) and hydroxylamine oxygenase (HAO) (Figure 1.2). AMO is a membrane-
bound copper protein that initiates ammonia catabolism by oxidizing ammonia to
hydroxylamine. Hydroxylamine produced in reaction [4] is delivered to HAO, which operates in
the periplasm.
44
AMO NH3 + O2 + 2H+ + 2e-→ NH2OH + H2O + 0.7 kcal mol-1 [4]
HAO NH2OH + H2O → NO2- +5H+ + 4e- + 83.3 kcal mol-1 [5]
According to Arp et al. (2007), the core metabolic process is the extraction of electrons
from hydroxylamine to generate proton-motive force and reductant in AOB. The extension of
AMO provides a mechanism to feed this process using ammonia and oxygen but produces a
negligible amount of power in and of itself. Four specialized proteins have been identified as
being required to facilitate the aerobic use of ammonia as the sole source of energy and
reductant. These are AMO, HAO, and cytochromes c554 and cM552. Two of the electrons
produced in reaction [5] are returned to AMO via a reduced c554 to regenerate the enzyme. The
remaining two electrons pass down the electron-transport chain (ETC) via cM552 generating a
proton motive force (PMT) (Prosser, 1989). Two of the protons produced in reaction [5] are
returned to the electron donor resulting in a net of 1 mole H+ produced per mole of NH3
consumed (Figure 1.2). Hooper et al., (1997) suggested that, as other known monooxygenases
activate oxygen (rather than the substrate) by reaction with a 2 electron-reduced metal containing
enzyme followed by release of water, this is probably the mechanism by which AMO also
operates.
Hydroxylamine can serve directly as a reduced substrate for the production of energy for
biosynthesis but it is toxic at fairly low concentrations. When ammonia is absent and only
hydroxylamine is present, ATP will continue to be synthesized and energy dependent transport
activity will continue. In a study designed to separate the two steps in the oxidation of ammonia
to nitrite performed by AOB, Frijlink et al. (1992) reported that the maximal rates of ammonia
and hydroxylamine oxidation were very similar. These authors suggested that the rate limiting
step must be the cytochrome mediated electron transport back to AMO. The same authors also
45
reported the discovery that hydroxylamine oxidation may occur at much lower pH values (< 5.0)
than the oxidation of ammonia. Hydroxylamine (as an intermediate in the oxidation of
ammonia) was not observed to accumulate under acid conditions. This is important as it is well
known that nitrifiers are highly sensitive to acidic environments (De Boer and Kowalchuk, 2001;
Darrah et al., 1986b; Morrill and Dawson, 1967). In light of the report on the properties of
hydroxylamine oxidation, this sensitivity may well be due to some form of acid inhibition to
reaction [4].
Enzymology of Nitrite Oxidation
In contrast to the oxidation of ammonia to nitrite by AOB, the oxidation of nitrite to
nitrate by NOB is a simple one-step reaction (equation [3]). Nitrate production from nitrite in
NOB is catalyzed by the soluble, molybdenum-containing protein nitrite oxidoreductase (NXR)
(Starkenburg et al., 2006; Hooper, 1989). This enzyme is apparently reversible, allowing for
anaerobic growth of NOB by dissimilatory nitrate reduction (Freitag et al., 1987). In the
oxidation reaction (equation [3]) nitrite functions as an electron donor for the reduction of NAD
via reverse electron flow and the generation of ATP by oxidative phosphorylation. 2 moles of
electrons are produced per mole of nitrite oxidized in this fashion. Unfortunately, much more
research currently exists concerning the enzymology, electron transport, and energy generation
of AOB than exists for NOB.
Habitat and Ecology of Soil Nitrifiers
In soils, nitrifiers (AOB and NOB) are typically found in the greatest numbers in the top
few centimeters nearest the surface, though nitrification activity has been documented to occur in
the subsoil at depths as low as 230 cm below the surface (Swensen and Bakken, 1997).
Nitrification is photo-inhibited, and so the exposed surface of the soil itself will not provide a
46
growth-conducive environment as copper-containing proteins such as AMO have been proven to
be inactivated in the presence of UV light (Bedard and Knowles, 1989).
In soils under agricultural production, these organisms exist in an environment
characterized by cycles involving periods of high substrate availability accompanied by robust
growth and activity followed by periods of starvation and rest. Temporal variations in soil water
potential, soil solution pH, temperature, and osmotic pressure are also environmental ‘norms’ for
nitrifiers that impact their patterns of growth and activity. For instance, Singh and Kashyap
(2007) documented the seasonal population dynamics of AOB and NOB at several sites that
varied in soil properties and seasonal rainfall. These authors reported a correlation between soil
moisture and nitrification rates resulting from a higher number of free-living cells of nitrifying
bacteria during the wet period as compared to the dry period. They found further correlations
between sites with the highest amount of year round moisture and overall nitrifier populations as
well as positive relationships between increased AOB and NOB populations. The concept of
seasonal variability in nitrifier activity is supported by Breuer et al. (2002) and Badía (2000).
Nitrifiers are also reported in this study as being among the soil microorganisms most sensitive
to moisture stress.
Soil nitrifiers are, in fact, more sensitive than most other soil bacteria to many types of
environmental stresses. The low thermodynamic favorability and relative inefficiency of the
oxidation reactions carried out by AOB and NOB (equations [4] and [5]) for metabolic energy
makes them poor competitors with heterotrophs for substrate and habitat (Verhagen and
Laanbroek, 1991). Their growth rate is slower and their activity is lower than most other
prokaryotic bacteria. Total numbers have been measured as constituting less than 0.01% of the
total population of soil bacteria (Phillips et al., 2000). Despite these seemingly unfavorable
47
properties, or perhaps because of the relatively unique ecological niche occupied by
chemolithoautotrophic nitrifiers, they are reported as being ubiquitous wherever supplies of
ammonium or nitrate are found (Walker, 1975).
Such ubiquity, when considered against the range of climate and soil types nitrifiers have
been observed to proliferate in, may be attributed to the ability or quality of these organisms to
adapt (albeit slowly) to environmental change. Many investigators have noted either the
presence of multiple strains of chemolithoautotrophic nitrifiers or the adaption of an existing
population to changing environmental conditions over time (Avrahami and Bohannan, 2007;
Avrahami and Conrad, 2003; Hankinson and Schmidt, 1989; De Boer et al., 1989). It is
suggested here that the population ecology of soil nitrifiers is complex enough with respect to
strains of both AOB and NOB that a range of optimum conditions may exist such that, as
environmental conditions change, a more suitably adapted strain of nitrifier will slowly
predominate both in numbers and activity. This concept may well apply to many of the factors
known to affect nitrification rates.
Generally speaking, greater numbers of AOB and NOB (both in the growing and resting
states) are known to exist in soils that contain higher contents of clay (Hoffman et al., 2007;
Smith, 1964; McDowell and Smith, 1958) and organic matter (Chu et al., 2008; Weier and
Gilliam, 1986). This phenomenon is a result of increased capacity of clay particles (< 2µm) over
larger soil constituents to adsorb ammonium through cation exchange, increased surface area for
nitrifier attachment, and a greater amount of micro-pore space less than 2 µm. That soil bacteria
inhabit soil pore spaces is well established (Foster, 1988; Hattori and Hattori, 1976). This ability
in nitrifiers provides protection against predation by protozoa (Rutherford and Juma, 1991).
Pore space openings of < 2µm present the restrictive limit for entrance by the smallest of

48
protozoa. Nitrifiers, however, are smaller than many other prokaryotic organisms and are better
able to occupy these smaller pores. For instance, the reported sizes for Nitrosomonas sp. are
around 0.5 µm in diameter and Nitrobacter sp. are placed in the range 0.6 – 0.8 µm wide and 1.0
µm in length with a pear-like shape (Tate, 2000; Hankinson and Schmidt, 1989).
The most favorable environment may well be the small diameter pores in soil aggregates
that also retain water longer in a drying soil, thereby providing additional protection against
desiccation. Hoffman et al. (2007) elaborated on this concept by reporting the results of micro-
scale measurements of nitrification rates in soil aggregates. In their study, it was determined that
the external surface layers of the aggregates showed higher potential nitrification rates than the
interior fractions of the aggregates. Observed differences were more pronounced in clayey soils
than in sandy soils leading the authors to suggest that oxygen and nutrient diffusion may be more
efficient in coarsely textured soils and limiting in soils that are more finely textured. The
conclusions reached in this study included a statement that, overall, nitrifiers in the interior of
aggregates contributed little to the measurable nitrification rates. Also, the authors indicated that
there were a significantly lower number of nitrifiers in the aggregate interior as compared to the
exterior. This was determined by physically separating the aggregates with a scalpel and
performing assays on slurries containing these portions. It is possible however, that this rapid
assay may have suffered from a lag time effect leading to less than concretely conclusive results.
Had the assay been of a longer duration, the population of the interior may have had a chance to
overcome its resting state and establish a more robust level of activity.
Organic matter in soils leads to increased aggregation and also provides increased pore
space, water holding capacity and exchange capacity. Even in coarsely textured sandy soils,
such as those found in the Southeastern U.S. Coastal Plain, increases in organic matter are
49
associated with an increased capacity to support soil bacteria. Hissett and Gray (1976) showed
that in a sandy soil, 64% of the bacteria were associated with organic particles even though these
comprised a mere 15% of the total soil volume. This is certainly also a result of the increase in
organic substrate for decomposition by soil organisms.
It is known that reduced and no-till practices have a profound effect on the amount of
organic matter content, soil aggregation and microbial ecology of the topsoil under agricultural
management. Accordingly, a great deal of research exists contrasting nitrification in
conservation and conventional tillage regimes. In general, it is agreed upon that nitrifier
numbers and activities are higher in no-till and reduced-till soils as compared to soils that are
turned over and mixed (Carpenter-Boggs et al., 2003; Malhi et al., 2006). Stearman and
Matocha (1992) have reported higher numbers of nitrifying organisms in no-till soils supplied
with fertilizer during the course of , though not immediately prior to the growing season.
Phillips et al., (2000) demonstrated that AOB diversity and nitrification rates are reduced in
conventionally-tilled soils. These authors suggested that, as no-till soils maintain pore structure
and continuity, greater hydraulic conductivity and infiltration rates, they may support more stable
and active AOB communities than tilled soils. This supports the conclusions of Rice and Smith
(1983) and Groffman (1985) who noted that the physical properties of no-till soils allow for
greater water holding capacity.
The above findings must be tempered with the knowledge that almost all of the microbial
activity, organic matter, and placement of substrate occur in the topmost centimeters of the
profile of no-till managed soils. Kandeler and Böhm (1996) found that overall potential
nitrification (0-30 cm) was not significantly different between conventional and minimum-till
treatment plots, but the location of the respective highest activities was. In the minimum-till soil,
50
activity was far higher in the 0-10 cm depth range while the conventionally tilled treatment
exhibited higher nitrification rates in the 20-30 cm range. Both were reported to be equivalent at
the intermediate 10-20 cm depths. Similar results have been described by Groffman (1985) and
Fuentes et al. (2006). The combination of high microbial activity, organic material, and substrate
concentration in such a small volume of soil portends some interesting patterns unique to soils
under conserved and no-tillage management. This volume of soil will be more buffered against
pH change due to the high organic matter content, yet it will be subjected to more rapid changes
in pH due to increased nitrification and location of NH4+-N substrate. However, the localization
of changes in soil pH allows for more effective treatment with lime. Furthermore, there may
exist a reduced potential for nitrate to leach below the root zone, particularly in cases where
conservation tillage is coupled with the planting of winter cover crops.
Nitrifiers as Community Organisms
Nitrifiers may be found free in soil solution but find many advantages to attached and
aggregated growth, including protection from environmental stress and predation by larger soil
organisms as well as improved physical proximity to substrate (Foster, 1988; Rutherford and
Juma, 1992; De Boer et al., 1991). Aggregation and surface attachment of nitrifiers to soil
surfaces may in fact provide both AOB and NOB with advantages in times of ‘feast’ and in times
of ‘famine’. Albrecht and McCalla (1937) demonstrated very early on that ammonium adsorbed
to colloidal clay is preferentially nitrified to nitrite and that calcium adsorbed to soil colloidal
material stimulated nitrification. Lees and Quastel (1946) later presented the results of a series
of controlled experiments concerning the concept that adsorbed NH4+ is preferentially oxidized
by AOB over free solution ammonium. By controlling the amount of adsorbed ammonium
through cation competition or increased exchange capacity, they arrived at the following

51
conclusions. (1) Nitrification in soils occurs on surfaces and not in solution. (2) The rate of
nitrification in soil is proportional to the fraction of the total NH4+ adsorbed on exchange
complexes independent of soil solution concentration and increases when adsorbed ammonium
concentration increases. (3) The rate of nitrification can be increased by the addition of sterile
soil proportional to the base exchange capacity of the added soil. This implies that AOB are able
to increase use of space by proliferating onto surfaces that offer increased adsorbed substrate.
Addition of sand did not increase nitrification rates in the study. Finally, soils that have been
enriched with nitrifying bacteria prior to the addition of substrate fail to exhibit a lag period, and
as long as substrate is not limiting, will instead show a linear rate of NO3- accumulation. In
contrast to the study by Albrecht and McCalla (1937), Lees and Quastel (1946) found that
adsorbed calcium resulted in a decrease in nitrification rates and attributed this to a reduction in
available substrate (i.e. adsorbed ammonium) due to competitive adsorption by calcium.
Underhill and Prosser (1987) reported that AOB (N. europaea) colonized much more
extensively on negatively charged exchange resins while NOB (Nitrobacter) colonized almost
exclusively on anion exchange resins. Results also showed that attachment of nitrifiers to
charged resin beads was associated only with growth and not with stationary phase cultures as
significant adsorption onto ion exchange resins was always associated with substrate oxidation.
These researchers concluded that a major factor affecting colonization is the site of substrate
adsorption. However, typical agricultural soils offer far more cation exchange capacity than
anion exchange capacity. If substrate location is the determining factor then it may be that NOB
operate better than AOB in solution.
De Boer et al. (1991) discovered that NOB existed as single cells and as aggregates in
soil. Aggregates were characterized as being spherical in appearance with a diameter of 3 to 20
52
µm. Some aggregated communities of nitrifiers contained both Nitrosospira and Nitrobacter sp.,
though the different organisms occupied separate portions of the aggregate complex without
‘intermingling’. Such close proximity between the two organisms on soil surfaces would
facilitate access by NOB to nitrite produced by AOB. This observation is supported by Stein and
Arp (1998) who suggested that nitrite toxicity to AOB would also be alleviated by physical
proximity between the two populations. Additionally, De Boer et al. (1991) reported evidence of
a stabilizing polymer matrix holding the aggregates together.
Batchelor et al. (1997) attributed the prolonged growth of nitrifiers under limiting
conditions such as low pH or the presence of inhibitors to the production of extracellular
polymeric substances (EPS) which also protect against desiccation. The authors suggest that
EPS contain anionic components which may adsorb ammonium to be released gradually within
the biofilm, maintaining cells at low levels of activity. This study showed that starved biofilm
populations recovered much more rapidly than freely suspended cells. Recovery of activity by
suspended cells following starvation (absence of substrate) was markedly improved upon
treatment with N-(3-Oxohexanoyl)-L-homoserine lactone (OHHL), a synthesized lactone similar
to the naturally produced N-acyl-homoserine lactone (AHL), even at the lowest dose tested.
These investigators concluded that a signaling system termed ‘quorum sensing’ may be involved
in community response to severe substrate limitation and subsequent recovery. The mechanisms
of this signaling system are reported to be dependent on the accumulation of signal molecules
such as AHL. The results of this study provide evidence that cell density signaling mediated by
AHL has a role in activating cell growth in biofilms.
It may be that extracellular polymeric material allows surface attached nitrifiers to remain
active longer than suspended cells in acid soil conditions. Allison and Prosser (1993) induced a
53
decrease in pH from 6 to pH 5 and reported a gradual decrease in activity rather than an abrupt
cessation. This finding is in contrast with the general impression that nitrification is very often
not initiated or severely depressed in soils exhibiting a pH <5.5 (De Boer and Kowalchuk, 2000;
Morrill and Dawson, 1961). Such a slow decrease in activity may represent the consumption of
metabolic energy for cell maintenance and the cessation of growth, even as the oxidation of
ammonia continues. The authors also suggested that cells do not rely on passive diffusion but
use active transport to absorb NH4+.
Urea Hydrolysis by AOB
Urea hydrolysis by ammonia oxidizers has been reported by Swensen and Bakken (1997)
and Burton and Prosser (2001). The study performed by Burton and Prosser (2001) examined
the growth of Nitrosospira sp. in a poorly buffered liquid media supplied with urea at pH values
ranging from 4 to 7.5. Growth was observed at all pH values. Hydrolysis of the supplied urea
was followed by an exponential increase in ammonium and nitrite which subsequently stopped
after exhaustion of the urea supply. Lag phases were reported as being shorter than those
observed when ammonium was supplied as the nitrogen source. This indicates that at least some
AOB are urealytic. It is possible that the observed shorter lag phase would support a model in
which neutral internal cellular pH must be maintained (at the expense of metabolic energy) to
oxidize ammonia. If a chemical reaction such as the one given by equation [6] enhances this
mechanism then the organism spends less of its own energy on the process of pH maintenance
and lag times are thus shortened. In this case the consumption of one proton during hydrolysis
would provide considerable ‘enhancement’.
Urea Hydrolysis (NH2)2CO + H2O + H+ ↔ 2NH4+ + CO2 [6]

54
Inhibition of Nitrification
Nitrification is known to be inhibited whenever necessary conditions veer into the
severely sub-optimal range. This applies to highly acidic (or alkaline) soil conditions, extremely
dry environments, and/or prolonged periods of extreme heat or cold. High salt concentrations
contributing to elevated osmotic potentials have been demonstrated to inhibit nitrification
(Rosenberg et al., 1986; Darrah et al., 1987). Inhibition has been suggested to occur as the result
of naturally-occurring allelopathic substances found particularly in acid forest soils (Rice, 1984).
The list of potential allelopathic inhibitors includes phenolic acids, flavonoids and terpenoids,
antibiotic compounds (De Boer and Kowalchuk, 2000). Monoterpenes have been included in the
group of allelopathic substances known to inhibit nitrification (White, 1994). Monoterpenes are
volatile compounds that share some commonalities with other known AMO inhibitors such as
nitrapyrin.
Nitrapyrin (N-serve) is an example of a substance often deliberately applied to
agricultural soils to inhibit nitrification. Other commercially available inhibitors include
thiourea, dicyandiamide (DNDN), and the reformulated nitrapyrin product Stay-N 2000 (Rovita
and Killorn, 2007; Hauck, 1980). Also, many currently available herbicides, fungicides and
insecticides are known to inhibit nitrification (Hauck, 1980). The reason for such application is
to prevent the loss of applied N fertilizer over the winter months. This practice takes advantage
of the adsorption of ammonium by clays and organic matter to prevent the leaching of applied N
by inhibiting the production of the much more highly mobile nitrate.
In the Southeastern U.S. however, due to the warm climate, deep and easily drained
sandy soils in the Coastal Plain, and high rainfall in the spring, the use of nitrification inhibitors
is not generally recommended as a method of improving N efficiency in agri-production.
55
Comparatively warm winter temperatures can stimulate nitrification even in the presence of
common inhibitors such as nitrapyrin, which itself degrades as a function of time and
temperature (Touchton and Boswell, 1980). Fall-applied anhydrous ammonia has been shown to
completely nitrify by January, well ahead of planting (Kyverga et al., 2004). In deep sandy soils,
a single 2.5 cm rainfall event can result in the downward movement of nitrates as much as 30 cm
(Touchton and Boswell, 1980).
Measuring Nitrification
Rates of nitrification in soils may be characterized as the amount of substrate (NH4+-N or
NO2--N) oxidized or as amount of product (NO2
--N or NO3--N) formed per unit soil per unit
time. This is most often expressed as mg N kg-1 soil time-1. Under most conditions, differences
between substrate disappearance and product accumulation rates have been reported as being
very small (Hadas et al., 1986; Weier and Gilliam, 1986). As measurement in situ is nearly
impossible at this point due to the need to perform measurements in laboratory settings on soil
material that is often prepared in some way (drying, crushing, sieving, etc.) to minimize
heterogeneity, quantifications of nitrification rates are often based on laboratory experiments that
allow for greater control by the experimenter but relate little to realities in the field. It should be
noted that Eno (1960) described a method to measure rates in situ using polyethylene bags buried
in the field that is still in use today (Singh and Kashyap , 2007). In this way, the experimenter is
allowed to expose the treatments to the same environmental temperature fluctuations as the
surrounding soil of interest, while maintaining isolation from other chemical and physical
interactions.
Several approaches to laboratory measurement of nitrification rates have emerged in the
last century. As a result, the term ‘nitrification potential’ has generally come to be accepted as
56
the descriptor of choice to label net rates as measured under a set of operationally defined
experimental conditions set forth by a researcher or researchers (Hart et al., 1994). Net rates are
often very similar to gross rates under conditions when interfering processes such as competition
for substrate or product (i.e. heterotrophic immobilization and/or nitrification by non-autotrophic
organisms), denitrification, or interlayer clay mineral fixation are minimal. Some of the most
commonly used laboratory approaches to the measurement of nitrification rates include soil
perfusion columns (McLaren, 1971; Lees and Quastel, 1946), incubated soil slurries (Wheatley
et al., 2001; Low et al., 1997), and aerobic soil incubations (Rovita and Killorn, 2007; Robertson
and Vitousek, 1981; McDowell and Smith, 1958). Any of these may be used in combination
with N15 tracer techniques (Russell et al., 2002, Sahrawat, 1985) or reaction specific inhibitors
(De Boer and Kowalchuk, 2000). Such combined approaches are most useful when the aim of
the researcher is to separate effects of interferences on the measurement of gross nitrification
rates or when it is the aim to eliminate individual component(s) of the overall process of
nitrification by AOB and NOB.
Hart et al. (1994) recommend the use of soil slurries over other methods to characterize
potential nitrification rates. These authors cite a superior ease in interpretation and
reproducibility over other types of nitrification assays as well as a relative linearity in
approximating the maximum nitrification rate (Vmax) under the stated conditions over a relatively
short period (≤ 24 hrs). This seems an excellent suggestion when only maximum rates are of
interest. However, maximum rates under any set of conditions are at best only a fraction of the
overall activity of nitrifiers when measured over time. As outlined earlier, soil nitrifiers exist in
an environment characterized by fluctuations in temperature, moisture, substrate availability, etc.
The nitrifying population in soil is relatively small but it increases rapidly upon addition of
57
substrate (NH3) to the soil (Hadas et al., 1986). The increase in nitrifier numbers leads to an
increase in the rate of substrate decomposition and/or product accumulation. As the depletion of
substrate nears, rates and organism numbers decline. The sum of these processes yields a
sigmoidal curve when cumulative nitrate production is plotted against time (Figure 1.3).
This sigmoidal curve has been described by many researchers as displaying three distinct
phases (Sabey et al., 1959; Morrill and Dawson, 1967; Hadas et al., 1986; Laubscher et al.,
1990). The first is the initial ‘lag phase’ wherein nitrifier numbers are low but increasing due to
a recent increase in substrate or alleviation of some inhibiting factor. The second is the
‘maximal rate phase’ in which the rate of nitrification can be said to be relatively linear for some
period of time following the end of the lag phase and prior to the onset of the effects of substrate
limitation. The final phase is the ‘retarded’ or ‘reduced rate’ phase wherein rates decline to near
zero as the availability of substrate declines sharply. Observation of the differential response of
each of these phases when making comparisons across soil types or as a function of some
environmental condition such as pH or soil moisture potential on a single soil over time is more
appropriately achieved when perfusion columns or aerobic incubations are the laboratory method
employed. There are difficulties and advantages reported in using either method. Soil perfusion
columns require the attainment of steady state (or accounting for non-steady state) conditions
before conclusions can be drawn concerning measurements, but allow for the measurement of
solute transport characteristics (McLaren, 1971; Grundmann et al., 1995). Aerobic incubations
require attention and maintenance of soil moisture potential and aeration status in experimental
units throughout the duration of the study, but can be set up more easily than perfusion columns
and results may be easier to interpret and compare to field studies (Shi and Norton, 2000; Weier
and Gilliam, 1986; Laubscher et al., 1990).
58
A recent call was made (Sahrawat, 2008) for a more systematic way of comparing
nitrification potentials in differing soils as a function of the factors that influence nitrification. A
characterization of all three phases of nitrification following the introduction of substrate must be
provided in any such system. It has been shown that each of the three phases can be closely
correlated with one or more of the physical and chemical soil factors that affect soil nitrification
potentials (Sabey et al., 1959; Sabey et al., 1969; Morrill and Dawson, 1967; Laubscher et al.,
1990; Rovita and Killhorn, 2007). In the interest of providing a more complete understanding of
the process of nitrification, it is recommended here that aerobic incubations be employed toward
this end. Experimental conditions are easier to control than with perfusion columns and more
experimental units can be observed per treatment combination allowing for greater statistical
interpretation of results. It is believed that results will be more closely related to field conditions
as well. The need for such an improved understanding is important and has been reiterated often
(Subbarao et al., 2006, Hadas et al., 1986; Malhi and McGill, 1982), especially in reference to
agricultural systems that receive very high inputs of fertilizer nitrogen. The potential for loss in
agricultural systems can be massive and depends largely on the process of nitrification. Recent
estimates of nitrogen fertilizer use efficiency have placed losses at or near 70% of applied
fertilizer-N through nitrification and associated processes (Glass, 2003). The need for a better
understanding and systematic way of interpreting potentials is apparent and has rightly made the
process of nitrification in agricultural soils a subject of ongoing investigation. However, when
solute transport is an area of interest, then aerobic incubations cannot provide the same insight as
soil perfusion columns.
59
Factors Affecting Nitrification Potential in Soils
There are a number of environmental factors known to affect all bacteria in soil. As
previously stated, soil nitrifiers (AOB and NOB) are unusually sensitive to most of these.
Environmental factors that have been identified by researchers as affecting nitrification
potentials in agricultural soils include some physical, climatic, chemical, and geographic
conditions. The factors considered to be the most important to the process of nitrification in
agricultural soils have been reported in the existing literature as: pH, soil moisture potential,
temperature, substrate availability, osmotic potential, aeration, soil texture, and soil organic
matter (concentration and C/N ratio). The influence of each of these factors is complex and
often interactive with some or all other factors during any given time interval. The response of
nitrification potentials to changes in most of these factors often resembles a bell shaped curve
where nitrification ceases at some low and high extreme and approaches a maximum at some
factor level in between. What follows is intended to be a thorough discussion of the effect of
each factor on nitrification potential with respect to all three phases of the nitrification process as
outlined previously.
Factors: Substrate Effects
Without substrate (NH3) there can be no production of nitrite by AOB, and without nitrite
there can be no production of nitrate by soil nitrifiers. At very low concentrations, substrate can
be said to be limiting and nitrate accumulation usually proceeds at a linear rate. For a population
of nitrifiers to experience growth, substrate must be supplied in amounts that result in a
production of metabolic energy in excess of that necessary for maintenance requirements (Shi
and Norton, 2000). When supplied in sufficient amounts, substrate utilization, nitrifier numbers,
and nitrate accumulation increase exponentially until substrate nears exhaustion and activity

60
slows resulting in the characteristic sigmoidal curve. As substrate concentrations increase
beyond sufficiency, no increase in activity is observed and inhibition eventually occurs (Bouman
et al., 1995; Malhi and McGill, 1985; Boon and Laudelot, 1962; Justice and Smith, 1962). In
agricultural soils, it is not only the concentration but the source of fertilizer-N (e.g. ammonium
sulfate, urea, anhydrous ammonia, MAP, DAP, organic manures, and animal wastes) that has
been documented to affect nitrification rates as well (Russell et al., 2002; Shi and Norton, 2000;
Whitehouse and Leslie, 1973; Eno and Blue 1954).
Inhibition at high substrate concentrations has been attributed to toxic levels of ammonia
at high pH and nitrous acid at low pH (Anthonisen et al., 1976; Malhi and McGill, 1985; Justice
and Smith, 1962), osmotic inhibition (Darrah et al., 1987; Malhi and McGill, 1985; Laura, 1977),
and pH changes imposed by the form of fertilizer-N. Urea and anhydrous ammonia are known
to initially raise the soil solution pH resulting in inhibitory pH values and/or toxic levels of
ammonia while ammonium sulfate depresses the soil pH. Eno and Blue (1954) found that
ammonium sulfate lead to more rapid nitrification rates in neutral sandy soils (as compared to
anhydrous ammonia) while anhydrous ammonia applications resulted in higher rates in acidic
sandy soils. These authors also noted a lethal effect of anhydrous ammonia to bacteria and fungi
within the retention zone. Whitehouse and Leslie (1973), however, reported that in a clayey soil
(alkaline black earth) ammonium sulfate nitrified more slowly than anhydrous ammonia. These
authors concluded that the possibility of restricted diffusion and greater concentration of acidic
effect produced in clay soil was the reason for the contradictory results.
Some optimum concentrations of nitrogen sources found in the literature are as follows.
Bouman et al. (1995) reported that 90 kg N ha-1 (112 mg N kg-1 soil) resulted in the highest rates
of nitrification in a field study with no increase in nitrate accumulation at twice that rate supplied
61
as anhydrous ammonia and/or urea. Justice and Smith (1962) reported a maximum rate of nitrate
accumulation when 150 mg N kg-1 soil was supplied as (NH4)2SO4. However, substrate
depletion and nitrite accumulation were more rapid at the 450 mg N kg-1 soil treatment
suggesting inhibition of NOB by ammonia and or osmotic pressure at this level. Malhi and
McGill (1985) documented a rapid nitrification rate when 200 mg N kg-1 soil was supplied as
(NH4)2SO4 with inhibition occurring at 300 mg N kg-1. These authors reported no nitrite
accumulation at either level. Finally, NOB have been reported to be inhibited at nitrite solution
concentrations exceeding 14.5 mM (667 mg NO2- L-1; 203 mg NO2
--N L-1) and limited below
this value (Boon and Laudelout, 1962).
Factors: pH
The response of nitrification potentials as a function of pH is one of the factors that
follow a bell shaped curve. Ranges for minimum soil pH values at which nitrification will occur
have been reported as being pH 3.5 - 5.5 (Frederick and Boadbent, 1965; Frijlink et al., 1990;
Hankinson and Schmidt, 1989). Maximum values at which overall process of nitrification will
occur have been reported between pH 8.5 - 9.6 (Frederick and Boadbent, 1965; Morrill and
Dawson, 1967; Boon and Laudelout, 1962). Optimal pH values have been placed between pH
5.5 – 8.8 (Hankinson and Schmidt, 1989; Darrah et al., 1986b; Rosenberg et al., 1986; Quastel
and Scholefield, 1951).
There are differences in response to pH between ammonia oxidation by AOB and nitrite
oxidation by NOB. Nitrite oxidizers are generally more sensitive to pH changes than ammonium
oxidizers and occupy a more narrow range of pH values within which activity has been
documented. These differences with respect to pH between AOB and NOB were illustrated very
well by Morrill and Dawson (1967) in a strong presentation of experimental data which should

62
always be considered whenever attempting to draw conclusions based on results of nitrification
assays. In this paper, four reasonably distinct patterns were observed and described concerning
the results of assays on 116 soil samples ranging in pH from 4.4 to 8.8 (Figures 1.4 – 1.6).
Pattern I: (pH range = > 7.3) at the highest pH values observed, ammonium is rapidly
oxidized to nitrite which accumulated for some time before eventually being oxidized to
nitrate.
Pattern II: (pH range = 4.5 – 7.3) Ammonium is rapidly oxidized with some small
amount of nitrite accumulation early on which is then rapidly oxidized to nitrate with no
further detectible nitrite.
Pattern III: (pH range = 4.5 – 6.4) Ammonium is more slowly oxidized to nitrate with
no nitrite accumulation.
Pattern IV: (pH range = < 4.5 – 5.9) No ammonium oxidation is observed by either
nitrite or nitrate formation at the lowest pH values observed.
The above patterns were highly correlatable with pH and pH related soil properties
including Calcium, Iron, and Aluminum content. Correlation coefficients relating growth rate
constants with soil properties are as follows: r2 pH = 0.768; r2 Calcium = 0.679; r2 pH and Calcium =
0.782. The authors reported the results of organism number studies in this experiment. Patterns
I (highest pH) and II both show very high activities for Nitrosomonas sp. Pattern I exhibits a
longer lag time for Nitrobacter sp. than Pattern II, though the relative maximum rates are similar
until substrate (NO2-) becomes limited by the reduced activity of AOB. Low numbers of
Nitrosomonas sp. were measured in Pattern III soils which in turn controlled NOB populations.
Pattern IV soils (lowest pH) tended to support little or no measurable nitrifier numbers from
either AOB or NOB.
63
An attempt was made by these researchers to account for the mechanism by which these
patterns were established. They reported that type II and III could be converted to exhibit type I
patterns via upward adjustment of soil pH through CaCO3 additions. Also, a type I pattern soil
was converted to a type II pattern soil by pre-percolating the perfusion column with nitrite to
“pre-activate” the Nitrobacter sp. present. This approach was more successful than inoculating
the column with NOB contained in the perfusion solution. The authors’ interpretation that this
change was affected by an increase in NOB population (which circumvented the lag time
otherwise necessary to establish high active organism numbers) rather than a change in pH seems
very plausible. Another interpretation of this phenomenon might be that pH has less to do with
NOB maximum rates than it does with optimum growth conditions. Metabolic processes
associated with cell growth, reproduction, and maintenance may be the pH-restricted reactions
that limit overall nitrite oxidation. It should be understood also that some if not most of the lag
time associated with the growth and activity of nitrite oxidizers across all pattern types in this
study can be attributed to their dependence on the product of ammonia oxidation for substrate.
Morrill and Dawson (1967) further concluded that NH3 has an inhibitory effect on NOB that
results in an initial accumulation of nitrite and that NOB can be affected by the presence of
nitrite (NO2-N) and nitrate (NO3-N), and by pH independently of the pH effect on ammonia
concentration.
That the highest rates of oxidation of ammonia to nitrite by AOB occur in higher pH soils
than the highest rates of nitrite oxidation to nitrate by NOB has been supported by other
investigators. Eno and Blue (1954) noted an inhibitory effect of high pH in their study
concerning ammoniacal fertilizer source effects on nitrification. They reported that neutral soils
exhibited higher rates of nitrification when supplied with (NH4)2SO4 while acid soils responded
64
better to applications of anhydrous ammonia. The pH elevating effects of anhydrous ammonia
were credited with both results. The inhibitory effect of high pH on nitrification (both AOB and
NOB) has been credited to the increased presence of NH3 in soil solution resulting from its
equilibrium relationship with NH4+ (Anthonisen et al., 1976). This inhibition was reported to be
impermanent in that its effects were overcome following adjustment of pH or dilution of NH3
concentrations. It is interesting to note that the findings of Anthonisen et al. (1976) illuminated a
major difference in the sensitivities of AOB and NOB to inhibition by ammonia. AOB inhibition
by ammonia was observed at solution concentrations from 10 to 150 mg l-1 while NOB inhibition
can was observed at concentrations from 0.1 to 1.0 mg l-1.
Dancer et al. (1973) observed that a general increase in soil pH was associated with a
decrease in the length of delay period and an increase in maximum rate of nitrate accumulation.
They calculated a linear relationship between pH and nitrate accumulation after 15 days as y =
41.5x – 168.5 (r2 = 0.92) and concluded that the data support previous observations that there is
an inverse relationship between initial numbers of nitrifiers and delay or lag period. Kyverga et
al. (2004) reported that high pH values stimulated nitrification even in the presence of very low
temperatures and inhibitory substances. These investigators also observed a good linear
relationship between increased pH and rates of nitrification. Justice and Smith (1962) reported
very high rates of nitrate accumulation in a calcareous loamy soil (pH = 7.8) at 22°C and 1 to 0.3
bars soil moisture tension. At all levels of NH4-N added (0 – 450 mg N kg-1 soil) the amount of
NO3-N accumulated met or exceeded the same amount after 21 days. Such rapid nitrification
rates should be expected in calcareous soils that feature high pH values and tremendous acid
buffering capacity. Broadbent et al. (1957) reported rates as high as 350 ppm NO3-N produced
per week in a calcareous Salinas clay (pH = 8.1).
65
The generally positive linear aspect to the relationship between soil pH and nitrification
rates (up to the point of inhibition) has continued to be supported by more recent studies (Weier
and Gilliam, 1986; Page et al., 2002; Islam et al., 2006). The nature of this relationship
mandates that nitrification may not proceed or may proceed only very slowly in soils with low
pH values. This scenario is potentially detrimental to plant nutrition and can promote soil
acidification through the unbalanced uptake of nitrogen primarily in the cationic form (NH4+)
and in sandy or gravelly soils may lead to the leaching loss of ammonium. The adverse effect of
low pH on nitrification is compounded by the fact that the oxidation of ammonium to nitrite
produces acidity. In poorly buffered soils, the production of protons as a natural byproduct of
nitrification can have a dynamic impact on the expected sigmoidal shape of the nitrate
accumulation curve. A continually diminishing nitrification potential as a result of decreasing
soil pH has been successfully addressed and predicted by Darrah et al. (1986b) in their attempts
at modeling nitrification in soils. They reported an improved predictive accuracy over a model
that does not include a term accounting for pH change resulting from nitrification. If the buffer
capacity of a soil is known, and a total of 1 mole of H+ are produced per mole of ammonia (NH3)
oxidized following dissociation of one proton from ammonium (NH4+), then the pH change can
be calculated. A reduction of the µmax term in Monod kinetics was applied via a fourth order
function (equation [7]).
RNRpH = 35.019 – 24.538 pH +6.147 pH2 – 0.647pH3 + 2.435 x 10⁻² pH4 [7]
Anthonisen et al. (1976) asserted that the inhibition of nitrite oxidizers at low pH may be
largely due to the increased presence of nitrous acid (HNO2). Their study observed inhibition of
NOB to be initiated at solution concentrations between 0.22 and 2.8 mg l-1. Though the
profound depression of nitrification potentials at low soil pH values has long been reported in the
66
existing literature (Hall et al., 1908; Morrill and Dawson, 1967; Weier and Gilliam, 1986), some
research from the last two decades reports the findings of unexpectedly high rates of nitrification
in low pH soils. These findings have been attributed to protection afforded by aggregation (De
Boer et al., 1991; Allison and Prosser, 1993), the ability of some AOB to hydrolyze urea (Burton
and Prosser, 2001) and the existence of ‘microsites’ (Hankinson and Schmidt, 1989: Burton and
Prosser, 2001) arising from the natural heterogeneity of a soil or from tiny regions of soil that
may be protected somehow from the chemical influence of the surrounding soil such as is the
case with micro-pores or other areas that experience stagnant flow. Islam et al. (2006) dismissed
the influence of microsites and suggested instead that the phenomenon of nitrification in acid
soils is more likely the result of adaptation of (or structural change in the composition of) the
AOB population. However, Hankinson and Schmidt (1989) also described the discovery of an
acidophilic strain of Nitrobacter sp. isolated along with a neutrophilic strain from the same acid
forest soil. The pH optimum for nitrite oxidation by the acidophilic strain was reported to be 5.5,
well below the pH 7.2 optimum of the neutrophile. The existence of acid tolerant strains of both
AOB and NOB is supported by De Boer et al. (1989).
Factors: Soil Water Potential
Nitrifiers are perhaps more sensitive to small changes in soil water potential than to any
other factor affecting their growth and activity. Sabey (1969) showed that small reductions in
water potential (< - 0.02 MPa) substantially reduced the rate of nitrification. Changes in soil
water affect the availability of substrate and osmotic potential through changes in diffusive
tortuosity and dilution/concentration of soil solution respectively (Papendick and Campbell,
1978). Soil water content effects on nitrification rates have also been shown to be temperature
dependent (Grundmann et al., 1995; Macduff and White, 1985). When one considers that
67
fluctuations in soil water content can be rather extreme and may occur very rapidly due to
precipitation, irrigation, and evaporation/transpiration, it should be clear that the response of
chemolithoautotrophic nitrifiers to such changes can be complex and difficult to correctly
interpret. Further complicating the issue is the fact that soil water content has been expressed in
many ways. These include soil water potential (Ψ), soil water content (determined either
gravimetrically or volumetrically), and percent of water-filled pore space (%WFP). The
relationship between these different approaches to expressing soil water content is inconsistent
and often dependent upon soil texture and organic matter content. For instance, matric potential
at any given relative water content is a function of soil pore space. Coarse textured soils range in
porosity from 0.3 to 0.4 (volume pore space volume soil-1), while more clayey soils and organic
soils may exhibit porosities in excess of 0.6 (Papendick and Campbell, 1978).
Soil water potential is the sum of the matric potential (including both adsorption and
capillary effects) and osmotic potential (Papendick and Campbell, 1978). Both are always
negative. Nitrification rates, when plotted against soil water potential, do not appear as a neat
bell shaped curve as is found with other factors that affect rates. Such plots are frequently
presented with soil water potential as the independent variable (x-axis) on a logarithmic scale
and the response of nitrification rates on the y-axis. The general trend is for rates to increase
from non-detectible at or below the permanent wilting point (often set at -15 bar tension) to a
maximum somewhere around the field capacity (-0.1 to -0.5 bar) of a given soil (Miller and
Johnson, 1964, Sabey, 1969; Sabey and Johnson, 1971; Malhi and McGill, 1982; Macduff and
White, 1985, Rodrigo et al., 1997).
Theoretically, the expression of soil water content in terms of matric or soil water
potential allows for the comparison of soils of differing textures. However, Papendick and
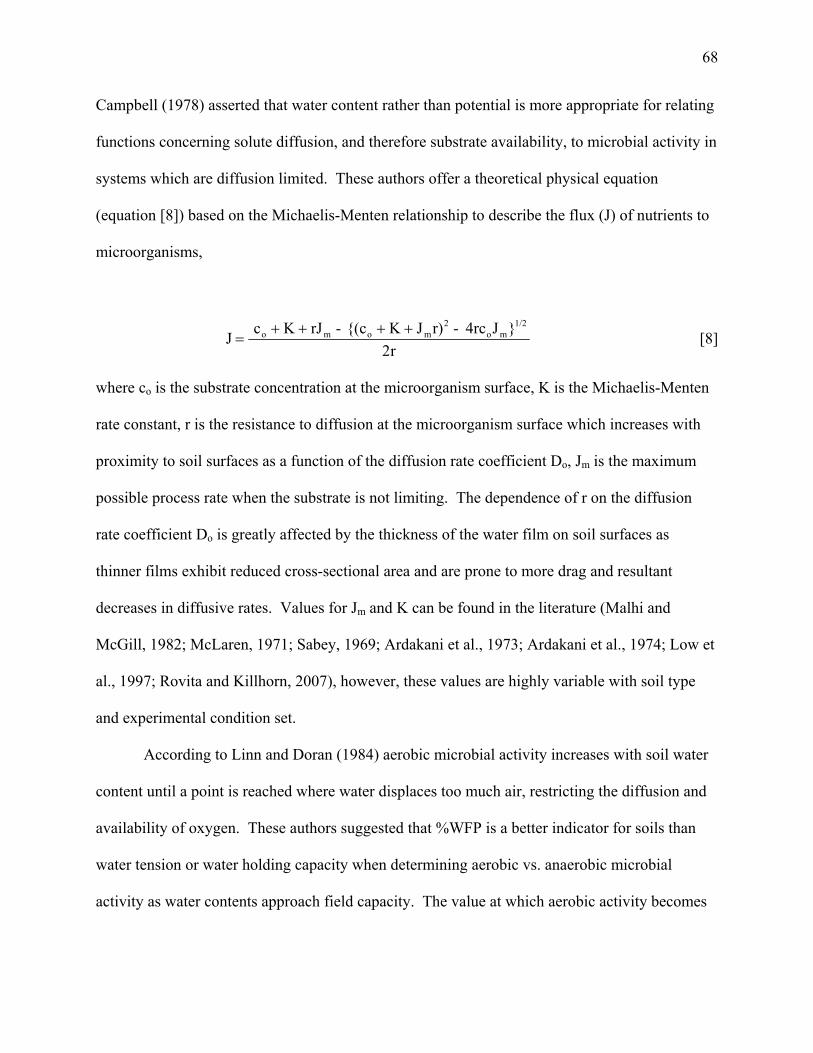
68
Campbell (1978) asserted that water content rather than potential is more appropriate for relating
functions concerning solute diffusion, and therefore substrate availability, to microbial activity in
systems which are diffusion limited. These authors offer a theoretical physical equation
(equation [8]) based on the Michaelis-Menten relationship to describe the flux (J) of nutrients to
microorganisms,
r2}J4rc - r)J K {(c - rJ K c J
1/2mo
2momo ++++
= [8]
where co is the substrate concentration at the microorganism surface, K is the Michaelis-Menten
rate constant, r is the resistance to diffusion at the microorganism surface which increases with
proximity to soil surfaces as a function of the diffusion rate coefficient Do, Jm is the maximum
possible process rate when the substrate is not limiting. The dependence of r on the diffusion
rate coefficient Do is greatly affected by the thickness of the water film on soil surfaces as
thinner films exhibit reduced cross-sectional area and are prone to more drag and resultant
decreases in diffusive rates. Values for Jm and K can be found in the literature (Malhi and
McGill, 1982; McLaren, 1971; Sabey, 1969; Ardakani et al., 1973; Ardakani et al., 1974; Low et
al., 1997; Rovita and Killhorn, 2007), however, these values are highly variable with soil type
and experimental condition set.
According to Linn and Doran (1984) aerobic microbial activity increases with soil water
content until a point is reached where water displaces too much air, restricting the diffusion and
availability of oxygen. These authors suggested that %WFP is a better indicator for soils than
water tension or water holding capacity when determining aerobic vs. anaerobic microbial
activity as water contents approach field capacity. The value at which aerobic activity becomes

69
restricted was found to be 60% water filled pore space (%WFP). The function the authors use to
relate aerobic activity to %WFP is as follows (equation [9]):
Relative Aerobic Activity = %WFP / 60% (for WFP < 60%) [9]
= 60% / %WFP (for WFP > 60%)
This finding concerning the critical value separating maximum aerobic activity and the
onset of anaerobic activity in soil microorganisms is supported by Miller and Johnson (1964),
Grundmann and Rolston (1987), and Grundmann et al. (1995). The latter reported optimal water
contents for nitrification to occur at a water status wherein aggregates only were saturated with
water and no water existed in the interaggregate spaces. Breuer et al. (2002), however, found
that nitrification was severely reduced or not detectible at a WFP of ~60%. The authors of this
study attributed this contradictory finding to the high organic matter content of the soils studied.
They concluded that, as mineral soils have a generally lower pore space and bulk density than
soils containing high amounts of organic matter, these soils held a higher relative water content
resulting in a restricted diffusion of O2 into the areas of nitrifier activity.
Stark and Firestone (1995) reported observations concerning the mechanisms for soil
moisture effects on nitrifiers. As soils lose water through evaporation or drainage, the soil
solution becomes more concentrated with regard to solutes. In general, microorganisms in this
environment must increase intracellular solutes to maintain cellular integrity. This osmotic
potential maintenance is done at some cost in energy. As soil pores drain, water films on soil
surfaces become thinner. This condition will increase the tortuosity of diffusion of a substrate.
In the case of nitrifiers, rates of NO3- and NO2
- production may be depressed by either increases
in osmotic gradients or reduced substrate flux. Substrate that would otherwise be available may
even become locked in smaller unconnected pores at lower matric potentials.
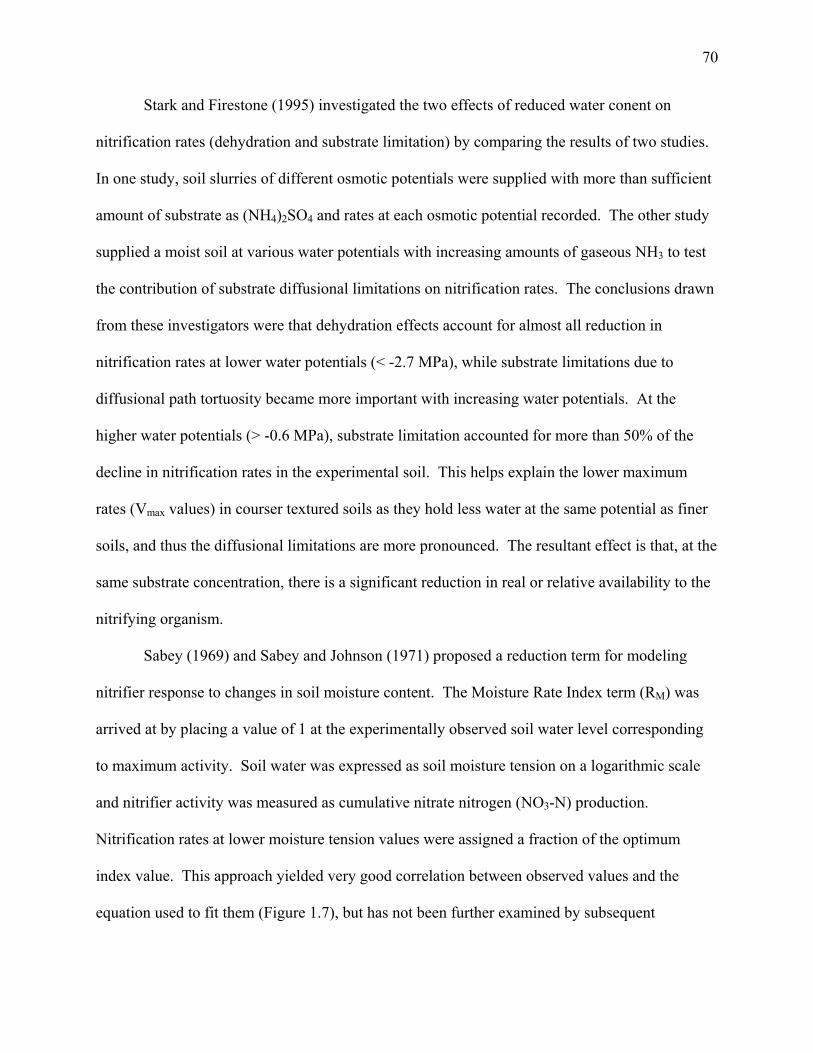
70
Stark and Firestone (1995) investigated the two effects of reduced water conent on
nitrification rates (dehydration and substrate limitation) by comparing the results of two studies.
In one study, soil slurries of different osmotic potentials were supplied with more than sufficient
amount of substrate as (NH4)2SO4 and rates at each osmotic potential recorded. The other study
supplied a moist soil at various water potentials with increasing amounts of gaseous NH3 to test
the contribution of substrate diffusional limitations on nitrification rates. The conclusions drawn
from these investigators were that dehydration effects account for almost all reduction in
nitrification rates at lower water potentials (< -2.7 MPa), while substrate limitations due to
diffusional path tortuosity became more important with increasing water potentials. At the
higher water potentials (> -0.6 MPa), substrate limitation accounted for more than 50% of the
decline in nitrification rates in the experimental soil. This helps explain the lower maximum
rates (Vmax values) in courser textured soils as they hold less water at the same potential as finer
soils, and thus the diffusional limitations are more pronounced. The resultant effect is that, at the
same substrate concentration, there is a significant reduction in real or relative availability to the
nitrifying organism.
Sabey (1969) and Sabey and Johnson (1971) proposed a reduction term for modeling
nitrifier response to changes in soil moisture content. The Moisture Rate Index term (RM) was
arrived at by placing a value of 1 at the experimentally observed soil water level corresponding
to maximum activity. Soil water was expressed as soil moisture tension on a logarithmic scale
and nitrifier activity was measured as cumulative nitrate nitrogen (NO3-N) production.
Nitrification rates at lower moisture tension values were assigned a fraction of the optimum
index value. This approach yielded very good correlation between observed values and the
equation used to fit them (Figure 1.7), but has not been further examined by subsequent
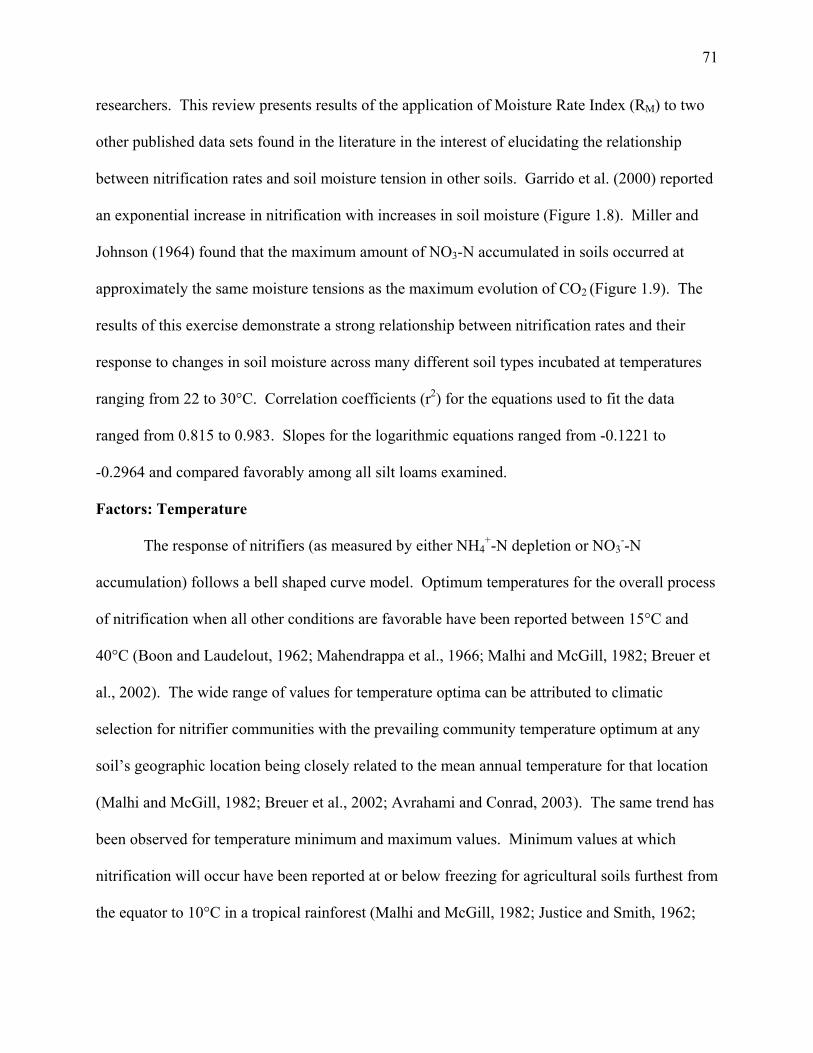
71
researchers. This review presents results of the application of Moisture Rate Index (RM) to two
other published data sets found in the literature in the interest of elucidating the relationship
between nitrification rates and soil moisture tension in other soils. Garrido et al. (2000) reported
an exponential increase in nitrification with increases in soil moisture (Figure 1.8). Miller and
Johnson (1964) found that the maximum amount of NO3-N accumulated in soils occurred at
approximately the same moisture tensions as the maximum evolution of CO2 (Figure 1.9). The
results of this exercise demonstrate a strong relationship between nitrification rates and their
response to changes in soil moisture across many different soil types incubated at temperatures
ranging from 22 to 30°C. Correlation coefficients (r2) for the equations used to fit the data
ranged from 0.815 to 0.983. Slopes for the logarithmic equations ranged from -0.1221 to
-0.2964 and compared favorably among all silt loams examined.
Factors: Temperature
The response of nitrifiers (as measured by either NH4+-N depletion or NO3
--N
accumulation) follows a bell shaped curve model. Optimum temperatures for the overall process
of nitrification when all other conditions are favorable have been reported between 15°C and
40°C (Boon and Laudelout, 1962; Mahendrappa et al., 1966; Malhi and McGill, 1982; Breuer et
al., 2002). The wide range of values for temperature optima can be attributed to climatic
selection for nitrifier communities with the prevailing community temperature optimum at any
soil’s geographic location being closely related to the mean annual temperature for that location
(Malhi and McGill, 1982; Breuer et al., 2002; Avrahami and Conrad, 2003). The same trend has
been observed for temperature minimum and maximum values. Minimum values at which
nitrification will occur have been reported at or below freezing for agricultural soils furthest from
the equator to 10°C in a tropical rainforest (Malhi and McGill, 1982; Justice and Smith, 1962;
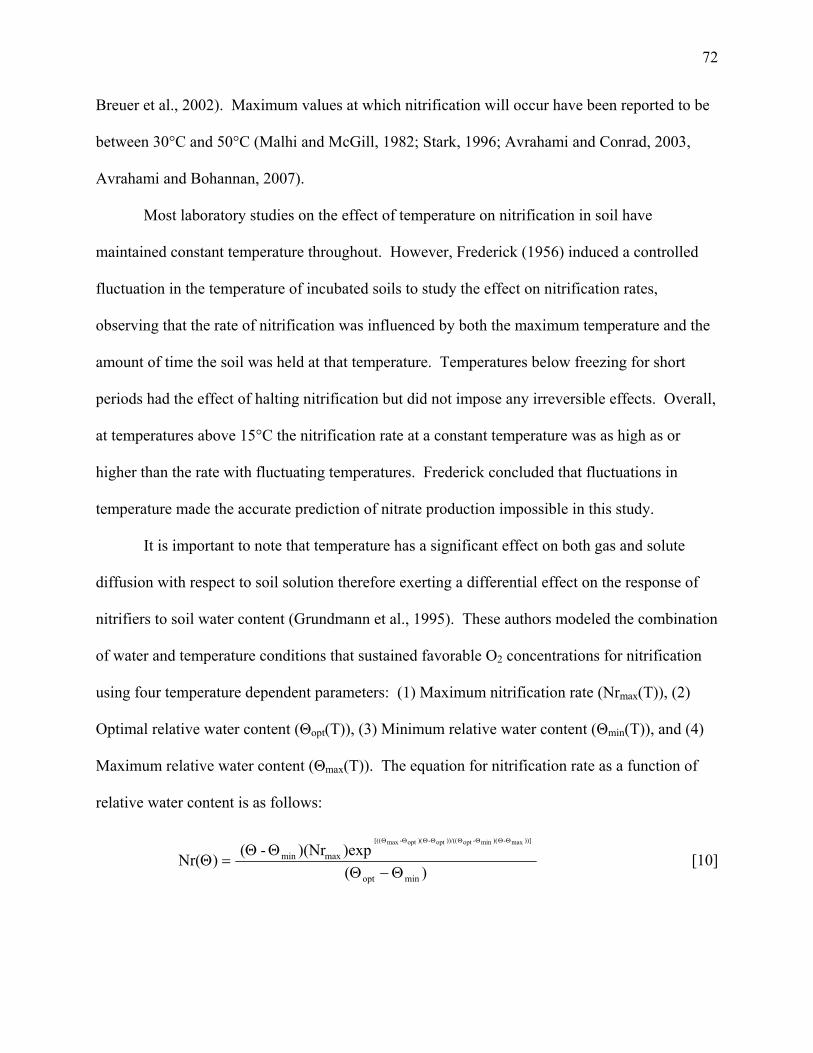
72
Breuer et al., 2002). Maximum values at which nitrification will occur have been reported to be
between 30°C and 50°C (Malhi and McGill, 1982; Stark, 1996; Avrahami and Conrad, 2003,
Avrahami and Bohannan, 2007).
Most laboratory studies on the effect of temperature on nitrification in soil have
maintained constant temperature throughout. However, Frederick (1956) induced a controlled
fluctuation in the temperature of incubated soils to study the effect on nitrification rates,
observing that the rate of nitrification was influenced by both the maximum temperature and the
amount of time the soil was held at that temperature. Temperatures below freezing for short
periods had the effect of halting nitrification but did not impose any irreversible effects. Overall,
at temperatures above 15°C the nitrification rate at a constant temperature was as high as or
higher than the rate with fluctuating temperatures. Frederick concluded that fluctuations in
temperature made the accurate prediction of nitrate production impossible in this study.
It is important to note that temperature has a significant effect on both gas and solute
diffusion with respect to soil solution therefore exerting a differential effect on the response of
nitrifiers to soil water content (Grundmann et al., 1995). These authors modeled the combination
of water and temperature conditions that sustained favorable O2 concentrations for nitrification
using four temperature dependent parameters: (1) Maximum nitrification rate (Nrmax(T)), (2)
Optimal relative water content (Θopt(T)), (3) Minimum relative water content (Θmin(T)), and (4)
Maximum relative water content (Θmax(T)). The equation for nitrification rate as a function of
relative water content is as follows:
)()exp)(Nr-( )Nr(
minopt
maxmin
))]max-)(min-opt))/((opt-)(opt-max[((
Θ−ΘΘΘ
=ΘΘΘΘΘΘΘΘΘ
[10]
73
The Θmin and Θmax values were not included in the range of relative water contents within
the study. However, using research by MacDuff and White (1985), the minimum was set at 0.22
or the permanent wilting point. Also the maximum value was set at 0.75 as this corresponds to
denitrification conditions where nitrification is likely inhibited by insufficient aeration (Skopp et
al., 1990).
A more recent study performed by Avrahami and Bohannan (2007) found an increase in
temperature from 20° to 30°C resulted in an increase in nitrification potential as measured by
nitrate plus nitrite accumulation, yet the higher temperature treatments exhibited a significantly
lower cell density of nitrifiers as measured by DGGE and T-RFLP. The same effect was
observed when temperature was correlated with soil %WFP. Numbers of nitrifying organisms
were higher in the samples with factor combinations of 20°C x 60%WFP and 30°C x 30%WFP
than at 30°C x 60%WFP. Nitrification potential was highest however, in the 30°C x 60%WFP
treatment. This phenomenon may hold the key to understanding the differential effect of
temperature and soil moisture content. The authors’ conclusions concerning these observations
included speculation that the diffusion of ammonia into the cells of AOB may be more rapid at
higher temperatures. They further hypothesized that the uncoupling of the relationship between
abundance and activity might provide a short term advantage through increased cell maintenance
and survival under high temperatures or a decrease in the lag time prior to growth when
conditions improve. Finally, they proposed that archaeal ammonia oxidizers may have
contributed to some of the enhanced activity observed. This presence and contribution to
nitrification in soils by archaeal bacteria has been investigated in some recent studies (Leininger
et al., 2006; Tourna et al., 2008).
74
In general, the response of nitrification rates has been described as being linear over
narrow temperature ranges (Breuer et al., 2002; Macduff and White, 1985) while the Van’t Hoff
function or the Arrhenius relationship has proven more applicable over slightly broader
temperature ranges (Rodrigo et al., 1997; Stark, 1996; Addiscott, 1983; Russell et al., 2002).
Still, these researchers have reported all of these approaches to be inadequate over the entire
range of temperatures expected over the course of a year in most temperate climes. Stark (1996)
found moderate success over a wide range of temperatures with a Poisson density function,
though it may prove more appropriate to model the temperature response of nitrifiers using
quadratic, exponential or multiple temperature functions when considering a temperature range
of -5°C to 50°C. Q10 values for nitrification ({nitrification at t} {nitrification at t-10}-1) have
been reported to be from <1.6 to 3.6 (Macduff and White, 1985; Breuer et al., 2002).
Mahandrappa et al. (1966) and Russell et al. (2002) observed that nitrite accumulated in
soils at some temperatures but not at others. This phenomenon was attributed in both cases to a
differing sensitivity of NOB to temperature as compared to AOB. While there may exist
differing temperature optima for NOB and AOB, the authors of both studies neglected to
consider the effect of pH on nitrite accumulation (Morrill and Dawson, 1967). In both studies,
the soil in question was characterized by a pH >7.5 and so should be expected to accumulate
NO2-N regardless of temperature. Two of the soils studied by Mahandrappa et al. (1966) did not
accumulate nitrite at any temperature (Yolo, pH=6.8; Walla Walla, pH=6.1). More work should
be done in this area before drawing conclusions concerning the differential response of AOB and
NOB to temperature.
Finally, Stark (1996) concluded in his study that the difference in optimum temperatures
for growth and nitrification might indicate that the energetic cost for the organism in these soils
75
of operating at or near the optimum nitrification temperature may exceed the benefit produced.
Other cellular processes are likely depressed as higher temperatures can denature enzymes and
lead to increased maintenance energy requirements. One reason suggested by the investigator
here for the difference is that the enzyme responsible for oxidation of ammonia may have
reached an evolutionary maximum that failed to change as the organism adapted to the
temperature range of this specific environment. It is worth considering that the often unique
properties of the AMO enzyme may result in similar disparities between optimum conditions for
nitrification and those required for cell growth and reproduction with respect to other factors
such as pH and/or substrate (NH3) concentration.
Factors: Osmotic potential
It is a general characteristic of lipid membranes that they allow the diffusion of water
molecules (solvent) into or out of cells while preventing the transport of most solutes. Naturally,
the osmotic properties of bacterial cells arise from the semipermeable nature of these lipid cell
membranes. Water will diffuse across a membrane in response to an electrochemical gradient.
When the direction of this diffusion is into the cell, the resultant expansion of the cytoplasmic
volume is limited at some point by a rigid cell wall. Any further influx of water beyond this
point results in an increase in cytoplasmic, or turgor, pressure. Cytoplasmic shrinking, or
plasmolysis, represents the opposite condition wherein water exits the cell leaving the remaining
cellular fluid more concentrated with respect to solutes and smaller with respect to volume. At
some point in between, nitrifier cell turgor pressure can be said to be at an optimum level for the
oxidation of ammonia to nitrate. As osmotic potential trends away from this point in either
direction nitrification will decrease to a negligible rate or, in extreme cases, cell death may occur.
The response curve for nitrifier activity to changes in osmotic pressure will appear to rise steeply
76
toward a maximum on the side where potentials are nearest to zero and fall more gradually as
solute concentrations increase. Osmotic stress in bacteria has also been reported to result in a
depression of other normal cellular functions such as nutrient uptake and DNA replication
(Csonka, 1989). Also, Jin et al. (2007) have demonstrated that NOB may be more sensitive to
osmotic stress than AOB.
Darrah et al. (1985) predicted that no inhibition of nitrification will be observed at soil
osmotic pressures of less than 1.9 atm, a critical value supported by the data published in that
study. The osmotic pressure resulting from the sum of salts in soil solution can be estimated
from the measurement of a soil’s electrical conductivity (equation [11]) (McBride, 1994).
Osmotic Pressure (atm) = EC (mS/cm) x 0.36 [11]
A summary of the results of electrical conductivity measurements on some soils in Georgia as
reported by the University of Georgia Soil Plant and Water Testing Laboratory (2400 College
Station Road, Athens, Ga. 30602) between July 2007 and September 2008 reveals an average
value of 0.09 mmhos/cm (unpublished data) (mmhos/cm = mS/cm). EC was measured at the on
the filtrate of an equilibrated 1:2 ratio of soil to water (w/v). Given that normal soil water
contents may be closer to 0.10 g H2O g-1 soil, conversion of this value by equation [11] gives an
average estimated osmotic pressure for these soils of 0.65 atm, well below the predicted value at
which inhibition of nitrifier activity occurs. It is unlikely then that many soils in the
Southeastern Coastal Plain will be inhibitory to nitrifiers with respect to osmotic pressure. An
exception to this assumption must be made for the time period following fertilizer application.
The osmotic pressure imposed by highly concentrated band or surface applications of fertilizers
is temporary but potentially severe if fertilizer is banded.
77
Interpretation of the effects of osmotic pressure is complicated by the existence of
specific ion effects. For example, the chloride anion (Cl-) has been credited with inhibition of
nitrification at concentrations too low to cause osmotic inhibition (Darrah et al., 1985; Darrah et
al., 1987; Rosenberg et al., 1986). Furthermore, osmotic potential has been reported to be lower
for chloride salts than for sulfate salts (Rosenberg et al., 1986). Also, changes in the salt content
of soil solutions will cause a shift in the equilibrium between adsorbed and solution ammonium,
potentially decreasing available substrate (Low et al., 1997). The potassium cation (K+) has been
observed to alleviate osmotic stress in nitrifiers and other bacteria (Csonka, 1989; Jin et al.,
2007). The study performed by Jin et al. (2007) focused on nitrification in an airlift bioreactor.
Though no comparable study was found relating this effect to soil nitrifiers, it seems reasonable
to expect a similar result in soils as potassium ions are the most prevalent cations in bacterial
cytoplasm and serve as one of the major intracellular osmolytes that maintain turgor (Csonka,
1989).
According to Low et al. (1997), when modeling nitrification based on Michaelis-Menten
kinetics, the effect of osmotic potential on Vmax can be described as follows;
K = a + becψs [12]
where K is the N transformation rate (mg N kg-1 d-1). a, b, and c are empirically determined
parameters and e is the base of the natural logarithm. Insertion of this modified term into the
Michaelis-Menten equation gives the following;
N = [(a + becψs) x S]/ (Km + S) [13]
The authors of this study offered a Km value of 39.7 µM NH4+ and concluded that the effect of
osmotic stress on nitrifiers was insignificant when substrate was limiting, suggesting that
substrate effects predominate over osmotic effects.

78
Factors: Soil Texture
Texture is a physical property of soils that refers to the particle size distribution of the
sand, silt, and clay fractions. Generally, nitrification can be expected to proceed more vigorously
in soils that contain higher amounts of clay particles (size fraction < 2 μm) and less rapidly in
soils that contain high amounts of sand particles (size fraction > 50 μm) (Albrecht and McCalla,
1937; Smith, 1964; Rovita and Killorn, 2007). The mechanisms attributed to this observation
include increased negatively charged surface area with increasing clay content for attachment by
AOB (Underhill and Prosser, 1987), increased CEC resulting in more available substrate at soil
particle surfaces (Albrecht and McCalla, 1937; Smith, 1964), better aggregation of soil particles
(Hoffmann et al., 2007), and protection from predation by protozoa afforded by a greater number
of micro-pore spaces (Rutherford and Juma, 1992).
Strong et al. (1999) reported a contradictory finding to the generalization that increased
clay content is positively correlated with nitrification rates. The possibility of low pH was
eliminated and the investigators attributed the effect to the tortuosity of NH4+ diffusive path
length, stating that a colony may exhaust its local supply of substrate before fresh ammonium
can diffuse to the vicinity. Another explanation is possible. The water potential here was
reported to be 10 kPa (0.01 MPa). According to Stark and Firestone (1995), at such a water
potential, differences in clay (matrix effect on soil moisture potential) may have a greater effect
on substrate limitation than at lower potentials. One factor not considered by the author of this
study is insufficient aeration. Conditions for saturation are nearly fulfilled at such a high
potential (-0.01MPa) and oxygen is possibly limiting. Furthermore, as clay content increases,
more water will be held as a percentage of total soil volume than at lower clay contents.
Thompsen et al. (2003) noted a similar decrease in net nitrification with increasing clay content

79
at -0.1 MPa matric potential regardless of organic matter content. These authors concluded that
the water content was well above optimum and that gaseous N losses were probably occurring.
Furthermore, it was reported that the optimum matric potential decreased with increasing clay
content.
Modeling Nitrification in Soils
Many approaches have been used to model nitrification rates. Zero order rate equations
(independent of substrate concentration) are useful generally only when substrate or some other
factor is serious limiting to nitrifier growth such as is the case at very low temperatures, low soil
water content, or when substrate is slowly supplied solely through the mineralization of organic
matter. First order rate equations which take into account the effect of dwindling substrate
concentrations do not however consider the effect of population growth and decline with changes
in substrate concentration. Neither of these are appropriate for approximating the sigmoidal
response characteristic of NO3 accumulation or NH3 consumption in agricultural soils following
the application of more than sufficient amounts of substrate to stimulate nitrifier population
growth.
Many researchers have advocated the use of the nonlinear Michaelis-Menten equation
(Kirk and Kronzucker, 2005; Kremen et al., 2005; Prosser, 1989; Malhi and McGill, 1985; Van
Veen and Frissel, 1981: Boon and Laudelout, 1962) which accounts for changes in substrate
concentration but not for population dynamics.
[ ][ ]SKSVv
m += max [14]
The rate (mass time-1) of ammonia degradation (-v) or nitrate accumulation (v) is a function of
the maximum potential rate (Vmax) when all conditions are set at optimum, the concentration of
substrate [S] at any time, and the parameter Km, an indicator of the affinity that the enzyme has

80
for the substrate that can be interpreted as the concentration of substrate at which the reaction
occurs at half the maximum rate. Some important underlying assumptions to consider when
employing the Michaelis-Menten equation are that the substrate and the enzyme are in solution.
These assumptions must be challenged or ignored if credence is given to research indicating the
membrane bound nature of the AMO enzyme, the periplasmic location of the HAO enzyme in
AOB (Arp et al., 2007; Hooper, 1997; Frijlink, 1992), and the likewise intercellular location of
the NXR enzyme in NOB (Starkenburg et al., 2006; Hooper, 1989). Furthermore, many
researchers have indicated that adsorbed, rather than solution ammonium (NH4+) may be the
preferred source of substrate ammonia (NH3) taken up by AOB (Albrecht and McCalla, 1937;
Lees and Quastel, 1946; Underhill and Prosser, 1987; De Boer et al., 1991; Batchelor et al.,
1997). It is interesting to note that no model yet published has attempted to utilize the
concentration of ammonia (NH3) in solution as the direct source of substrate, nor has any model
been based solely on adsorbed ammonium (NH4+) as the source of substrate despite the mounting
evidence of AOB preference for surface adsorbed substrate and the non-polar compound affinity
of the AMO enzyme.
Another approach to modeling nitrification uses the Monod and/or modified Monod
equations which account for both substrate and population change and may therefore provide
more accurate predictive power for modeling nitrification in agricultural soils (Alexander, 1994;
Darrah et al., 1986a). The Monod equation has been used to relate the specific growth rate (μ) to
a growth-limiting substrate [S] concentration in bulk solution,
][][
max SKS
s += μμ [15]
where μmax is the maximum specific growth rate and Ks is the Monod constant. This equation
looks almost exactly like the Michaelis-Menten equation relating substrate concentration to
81
population growth rather than substrate degradation rate. Ks could easily be interpreted then to
be a growth rate equal to half the maximum rate, yet according to Liu et al. (2003), Monod
intended no theoretical or mechanistic base for this equation. These authors proposed that the
magnitude of Ks represents the equilibrium position of a microbial growth process, and μmax
represents the limit of microbial growth. Relating growth and substrate concentration to the rate
of substrate decomposition or product accumulation is clearly not accomplished by the Monod
equation as given by equation [15].
A modified version of the Monod equation can be used to predict substrate
decomposition or product accumulation. However, nitrifier biomass density and biomass yield
have yet to be measured satisfactorily (Avrahami and Bohannan, 2007; De Boer and Kowalchuk,
2001) and so their estimated values must be modeled when this approach is used (Simkins and
Alexander, 1984). The equation for calculating the rate of substrate decomposition (-v) or
product accumulation (v) as a function of time can be written as follows:
][])[)/(]]([[ 00
max SKSYBSSv
s +−+
= μ [16]
μmax, [S], and Ks remain the same as in equation [15]. [S0] is the initial concentration of
substrate in solution. B0 is the initial density of active microbial biomass and Y is the yield
coefficient relating the amount of biomass produced per amount of substrate consumed. Simkins
and Alexander (1984) demonstrated that when Ks is sufficiently larger than [S0], a logistic
sigmoidal curve can be generated that closely fits the nitrate accumulation patterns observed
during the course of nitrification in soil when the addition of substrate follows a period of
starvation or growth-limiting substrate concentration. Any equation used to approximate the
nitrate accumulation curve typically resulting from the process of nitrification can be modified to
82
reflect reductions in nitrifier activity resulting from a less than optimal level of any of the
previously described factor, as described earlier.
Conclusion
Nitrifiers exist in an environment marked by a continual change in temperature, soil
water potential, pH, salinity, substrate availability, and aeration. These organisms are highly
sensitive to such changes in environmental conditions while at the same time being very slow to
respond or adapt in order to maintain activity and/or growth. These qualities inherent in both
AOB and NOB are exacerbated in the coarse, sandy soils of the Southeastern U.S. Coastal Plain
region that provide little protection for these organisms from predation. Low surface area and a
low volume of micro-pore space when compared to more clayey soils likewise do not support
high densities of resting biomass in times of low substrate availability. Such coarse textured
soils are often characterized by a low water holding capacity which results in rapid changes in
soil water content and osmotic pressure that serve to depress nitrifier activity and if severe
enough, may result in desiccation or lysis. The minimal cation exchange capacity of these soils
may reduce the availability of adsorbed substrate sources while the marginal acid buffering
capacity offers little protection against inhibition arising from the protons produced as a natural
byproduct during the oxidation of ammonia.
This production of protons during the process of nitrification and its implications for the
sustainability of agricultural production in the Southeastern U.S. is well known, but less
understood in detail as it could be. The development of soil acidity in the subsoil horizons is
difficult to remediate and has been documented to depress cotton yields in this region due to a
reduction in root exploration of this portion of the soil volume. Important trends in subsoil
acidity may be overlooked when samples for soil fertility testing are taken from the plow layer or
83
topsoil only. The ability of roots to proliferate in the subsoil greatly increases a crop’s potential
to withstand water and nutrient stress, while the recovery of highly mobile nitrate (and possibly
ammonium) from the subsoil also serves to protect groundwater from contamination and reduce
‘waste’ from applied fertilizer by tightening the nitrogen cycle.
Areas of research identified as showing emerging promise or need in building a better
understanding of the process of nitrification in soils are numerous. One of the most important is
the development of better, more accurate methods for determining nitrifier cell densities in soil,
both at rest and during periods of positive and negative growth. Identification of the many
species and strains of nitrifiers that make up the population ecology within a given soil system is
advancing through recently developed molecular techniques such as PCR (polymerase chain
reaction), DGGE (denaturing gradient gel electrophoresis), and T-RFLP (terminal restriction
fragment length polymorphism); while the most probable number (MPN) approaches have been
shown to be largely inappropriate for identification and enumeration (Avrahami and Bohannan,
2007; De Boer and Kowalchuk, 2001). The mechanism(s) by which nitrification is stimulated
and/or inhibited by the presence of organic matter needs to be better illuminated as more interest
continues to be developed in the area of conservation tillage in agricultural production,
particularly in the Southeastern U.S. A systematic way of comparing the process of nitrification
across soil types is long overdue. It is suggested here that the landmark work of Sabey (1959)
and the more recent work of Laubscher et al. (1990) be used to correlate the effects of any
nitrification factor on each of the three phases of the sigmoidal nitrate accumulation curve. For
example, ‘what are the effects of temperature on the lag phase?’ or ‘how does soil texture impact
the concentration of remaining substrate at which the terminal phase commences?’ Finally,
process and organism based models must be improved to give better predictive accuracy in the

84
field based on real knowledge of nitrifier biology and enzymology and less on a ‘black box’
approach in order to create an agricultural legacy of lower input and higher sustainability.

85
Table 1.5. N oxidation states.
Compound N Oxidation State
NH4+ -3
NH2 -1
N2 0
N2O +1
NO +2
NO2- +3
NO3- +5
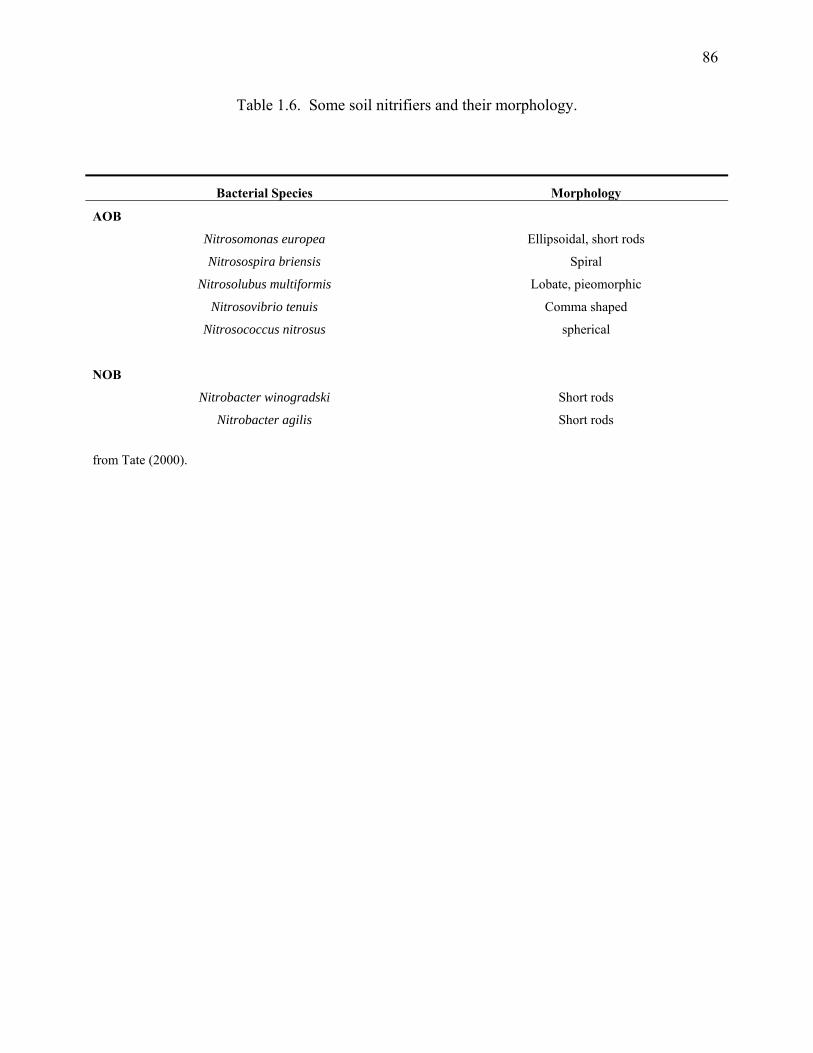
86
Table 1.6. Some soil nitrifiers and their morphology.
Bacterial Species Morphology
AOB
Nitrosomonas europea Ellipsoidal, short rods
Nitrosospira briensis Spiral
Nitrosolubus multiformis Lobate, pieomorphic
Nitrosovibrio tenuis Comma shaped
Nitrosococcus nitrosus spherical
NOB
Nitrobacter winogradski Short rods
Nitrobacter agilis Short rods
from Tate (2000).

87
Figure 1.2. Enzymatic pathway for Equation (2): Oxidation of ammonia to nitrite. X and XH2 are the oxidized and reduced forms of the electron donor. NH4
+ is oxidized for energy for the fixation of CO2 via the Calvin cycle (Bedard and Knowles. 1989).
Ammonia Monooxygenase
(AMO)
O2 H2O
XH2 X
NH3 NH2OH
X XH2
Hydroxylamine Oxidoreductase
NO2-
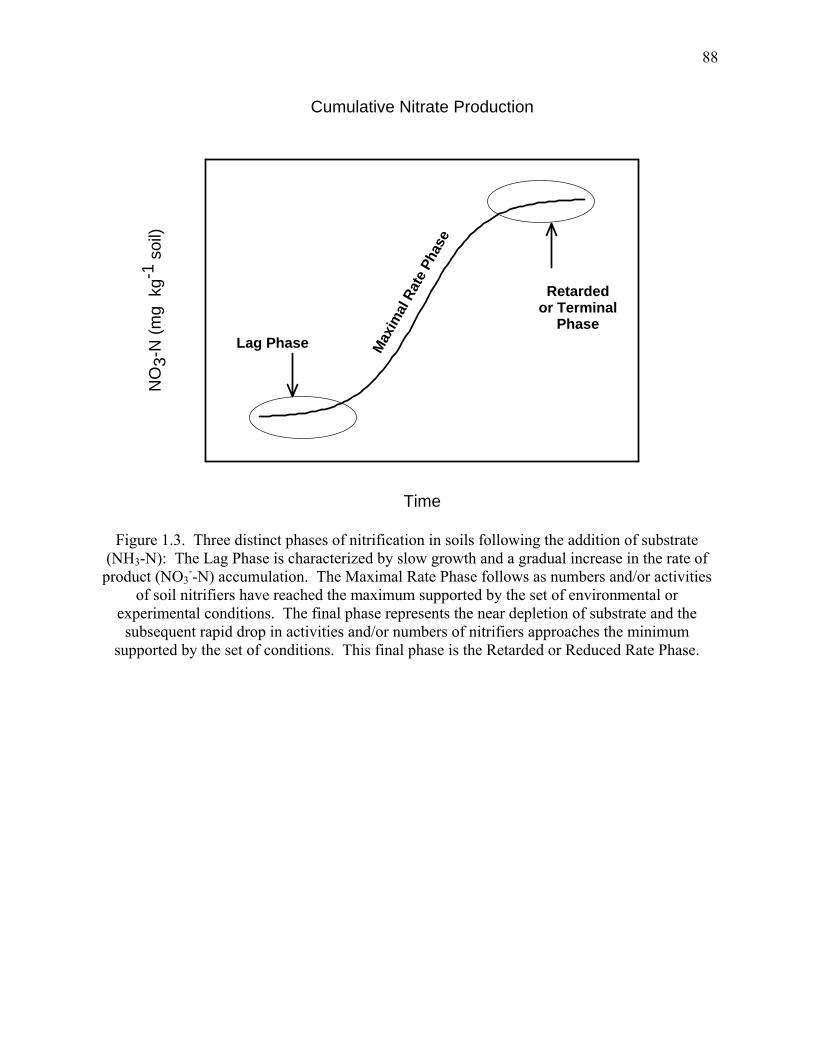
88
Cumulative Nitrate Production
Time
-150 -100 -50 0 50 100 150 200 250
NO
3-N
(mg
kg-1
soi
l)
-1.2
-1.0
-0.8
-0.6
-0.4
-0.2
0.0
Retardedor Terminal
PhaseLag Phase M
axim
al R
ate
Phas
e
Figure 1.3. Three distinct phases of nitrification in soils following the addition of substrate (NH3-N): The Lag Phase is characterized by slow growth and a gradual increase in the rate of
product (NO3--N) accumulation. The Maximal Rate Phase follows as numbers and/or activities
of soil nitrifiers have reached the maximum supported by the set of environmental or experimental conditions. The final phase represents the near depletion of substrate and the subsequent rapid drop in activities and/or numbers of nitrifiers approaches the minimum
supported by the set of conditions. This final phase is the Retarded or Reduced Rate Phase.
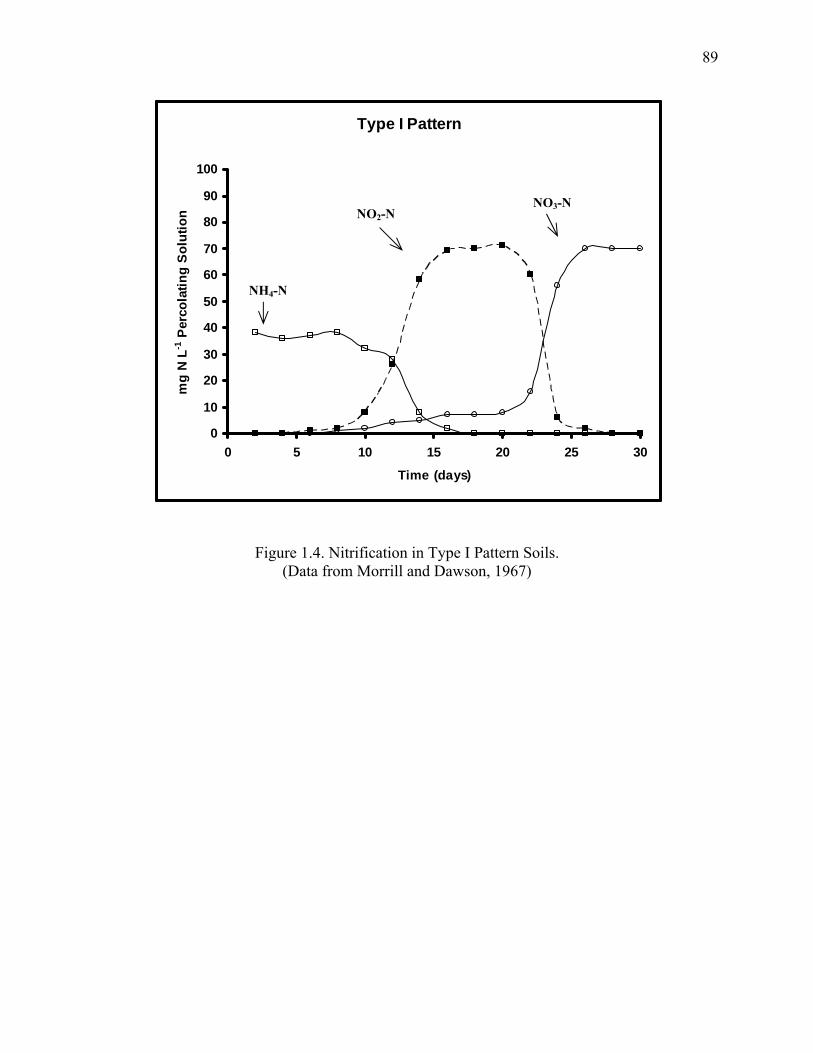
89
Type I Pattern
0
10
20
30
40
50
60
70
80
90
100
0 5 10 15 20 25 30
Time (days)
mg
N L-1
Per
cola
ting
Sol
utio
n
Figure 1.4. Nitrification in Type I Pattern Soils. (Data from Morrill and Dawson, 1967)
NH4-N
NO2-N NO3-N
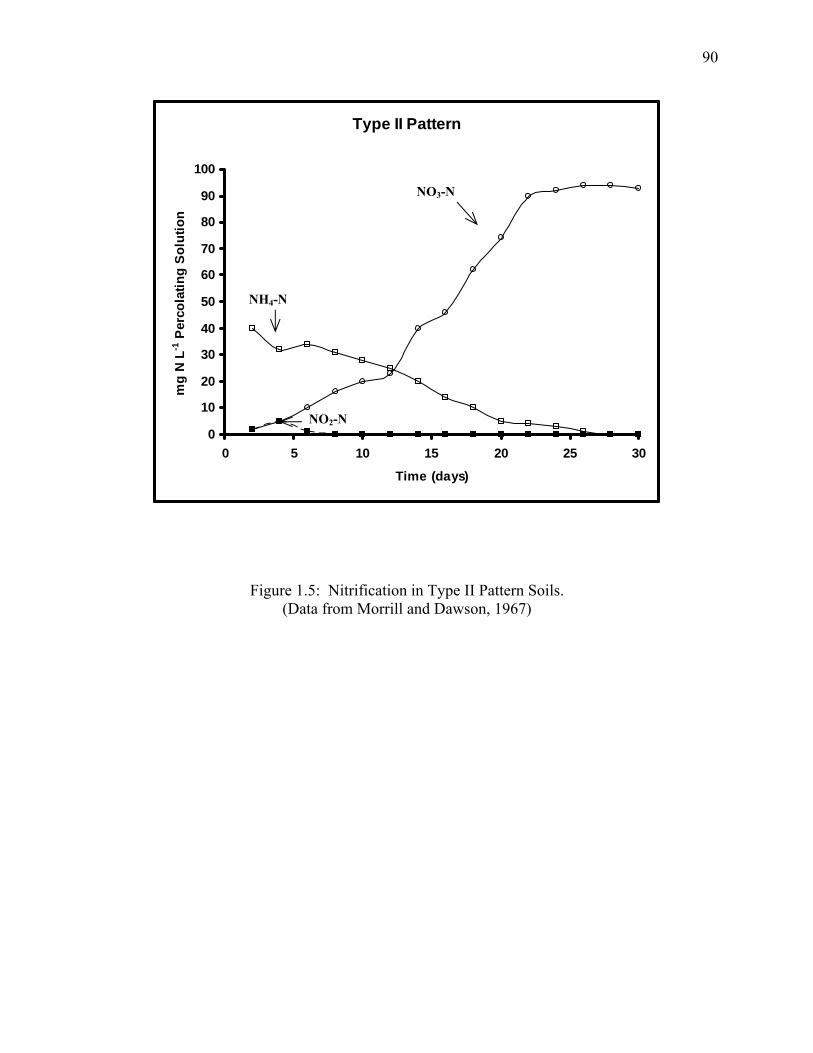
90
Type II Pattern
0
10
20
30
40
50
60
70
80
90
100
0 5 10 15 20 25 30
Time (days)
mg
N L-1
Per
cola
ting
Solu
tion
Figure 1.5: Nitrification in Type II Pattern Soils. (Data from Morrill and Dawson, 1967)
NH4-N
NO2-N
NO3-N

91
Type III Pattern
0
10
20
30
40
50
60
70
80
90
100
0 5 10 15 20 25 30
Time (days)
mg
N L
-1 P
erco
latin
g So
lutio
n
Figure 1.6: Nitrification in Type III Pattern Soils. (Data from Morrill and Dawson, 1967)
NH4-N
NO3-N
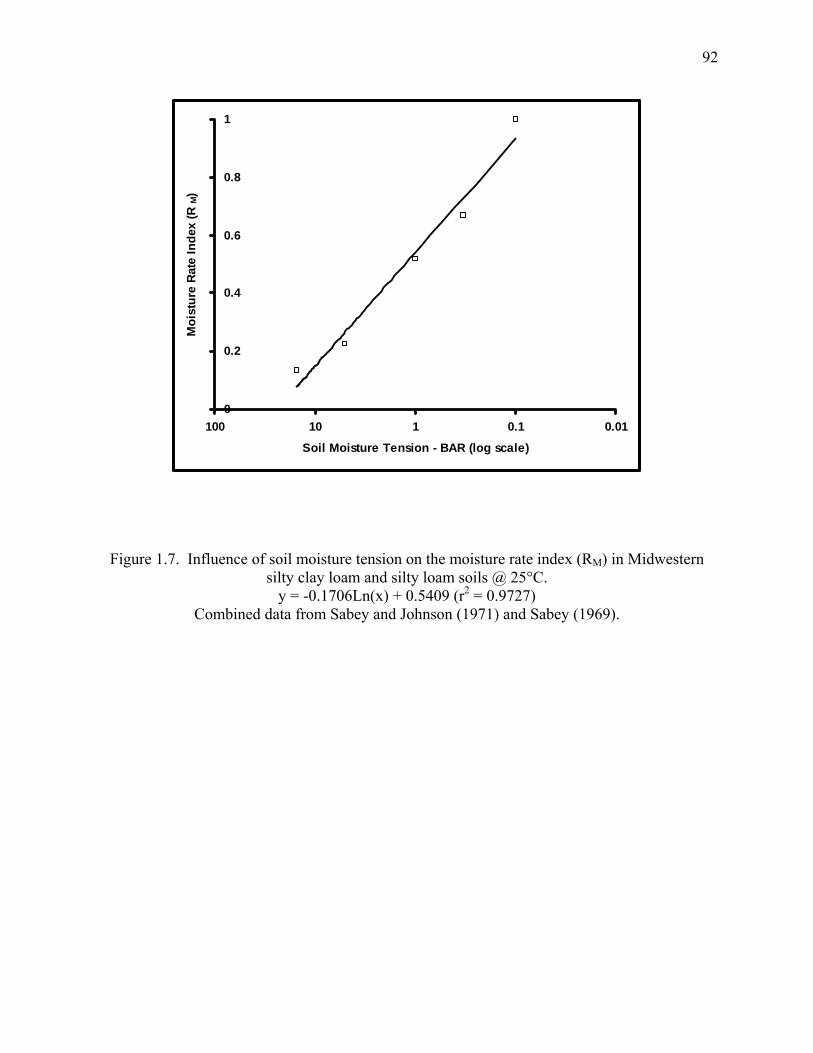
92
0
0.2
0.4
0.6
0.8
1
0.010.1110100
Soil Moisture Tension - BAR (log scale)
Moi
stur
e Ra
te In
dex
(RM)
Figure 1.7. Influence of soil moisture tension on the moisture rate index (RM) in Midwestern silty clay loam and silty loam soils @ 25°C.
y = -0.1706Ln(x) + 0.5409 (r2 = 0.9727) Combined data from Sabey and Johnson (1971) and Sabey (1969).
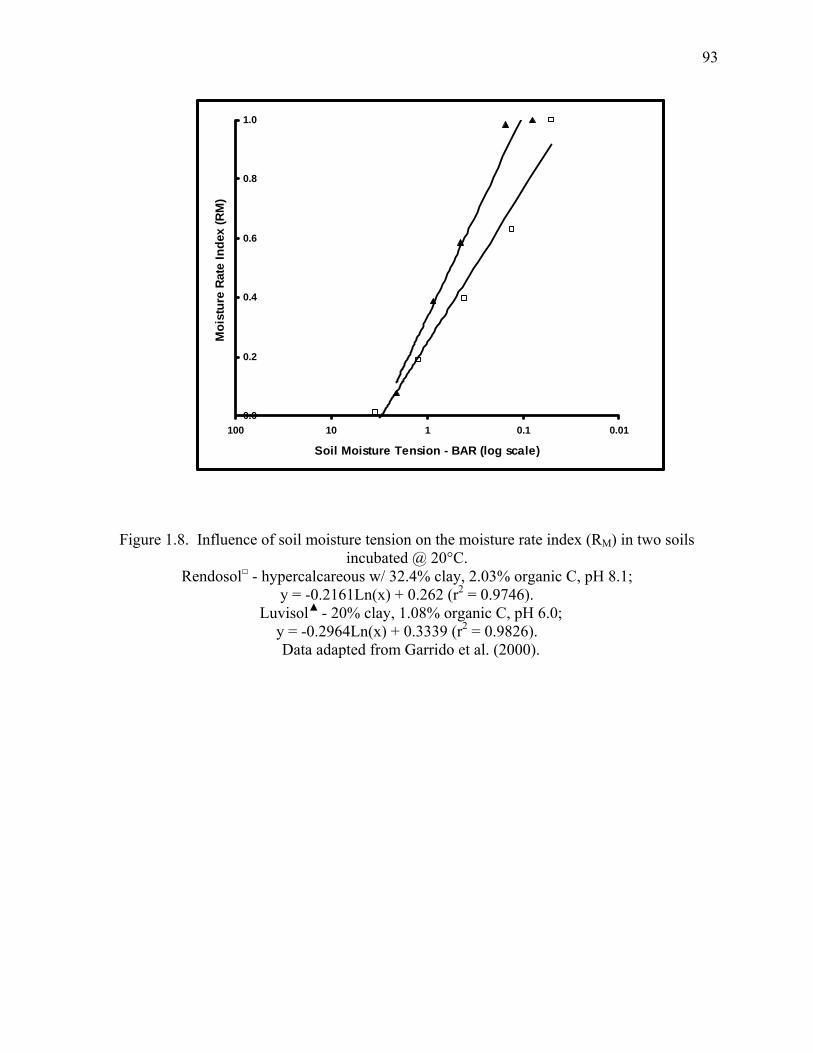
93
0.0
0.2
0.4
0.6
0.8
1.0
0.010.1110100
Soil Moisture Tension - BAR (log scale)
Moi
stur
e Ra
te In
dex
(RM
)
Figure 1.8. Influence of soil moisture tension on the moisture rate index (RM) in two soils incubated @ 20°C.
Rendosol□ - hypercalcareous w/ 32.4% clay, 2.03% organic C, pH 8.1; y = -0.2161Ln(x) + 0.262 (r2 = 0.9746).
Luvisol▲ - 20% clay, 1.08% organic C, pH 6.0; y = -0.2964Ln(x) + 0.3339 (r2 = 0.9826). Data adapted from Garrido et al. (2000).
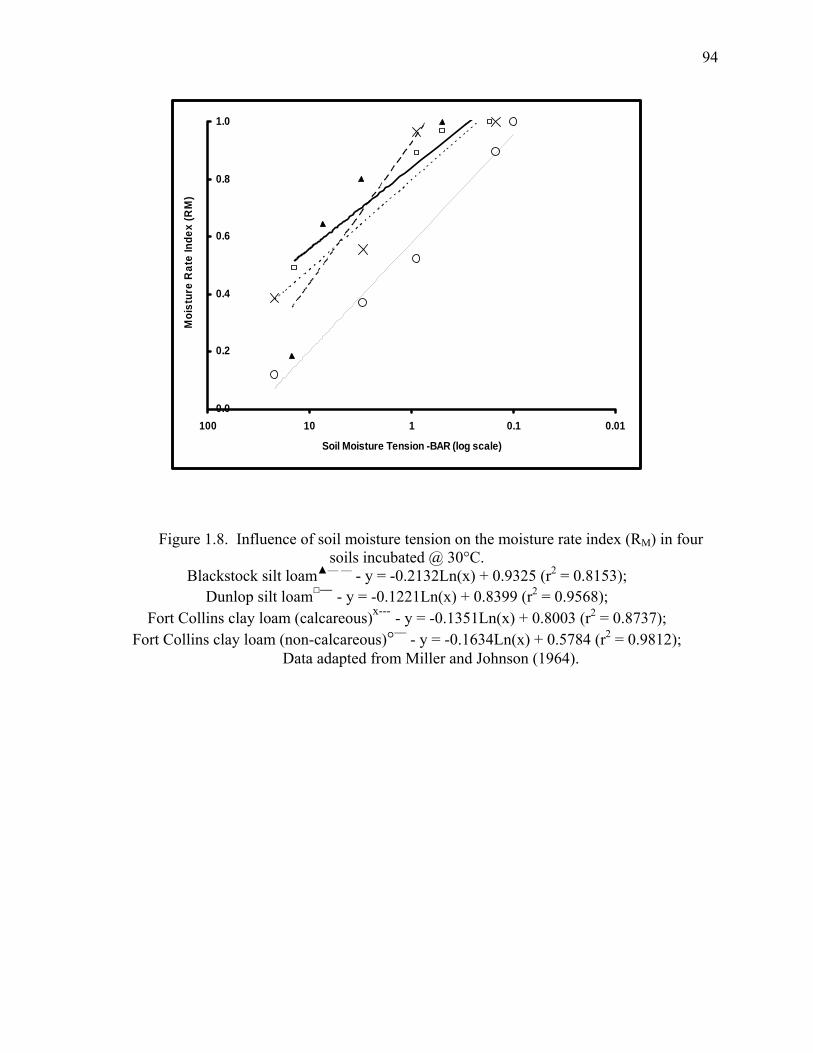
94
0.0
0.2
0.4
0.6
0.8
1.0
0.010.1110100
Soil Moisture Tension -BAR (log scale)
Moi
stur
e R
ate
Inde
x (R
M)
Figure 1.8. Influence of soil moisture tension on the moisture rate index (RM) in four
soils incubated @ 30°C. Blackstock silt loam▲— — - y = -0.2132Ln(x) + 0.9325 (r2 = 0.8153);
Dunlop silt loam□–– - y = -0.1221Ln(x) + 0.8399 (r2 = 0.9568); Fort Collins clay loam (calcareous)x--- - y = -0.1351Ln(x) + 0.8003 (r2 = 0.8737);
Fort Collins clay loam (non-calcareous)°–– - y = -0.1634Ln(x) + 0.5784 (r2 = 0.9812); Data adapted from Miller and Johnson (1964).

95
References
Addiscott, T.M. 1983. Kinetics and temperature relationships of mineralization and nitrification in Rothamsted soils with differing histories. European Journal of Soil Science 2:343-353.
Albrecht, W.A., and T.M. McCalla. 1937. Nitrification of ammonia adsorbed on colloidal clay. Soil Sci. Soc. Am. Proc.
Alexander, M. 1994. Biodegradation and bioremediation, p. 71-98. Academic Press, A division of Harcourt Brace & Company, New York.
Allison, S.M., and J.I. Prosser. 1993. Ammonia oxidation at low pH by attached populations of nitrifying bacteria. Soil Biol. Biochem. 25:935-941.
Anthonisen, A.C., R.C. Loehr, T.B.S. Prakasam, and E.G. Srinath. 1976. Inhibition of nitrification by ammonia and nitrous acid. Journal Water Pollution Control Federation 48:835-852.
Ardakani, M.S., J.R. Rehbock, and A.D. McLaren. 1973. Oxidation of nitrite to nitrate in a soil column. Soil Sci. Soc. Amer. Proc. 37:53-56.
Ardakani, M.S., R.K. Schulz, and Mclaren. 1974. A kinetic study of ammonium and nitrite oxidation in a soil field plot. Soil Sci. Soc. Amer. Proc. 38:273-277.
Arp, D.J., P.S.G. Chain, and M.G. Klotz. 2007. The impact of genome analyses on our understanding of ammonia-oxidizing bacteria. Ann. Rev. Micro. 61:503-528.
Avrahami, S., and B.J.M. Bohannan. 2007. Response of Nitrosospira sp. strain AF-like ammonia oxidizers to changes in temperature, soil moisture content, and fertilizer concentration. App. Environ. Microbiol. 73:1166-1173.
Avrahami, S., and R. Conrad. 2003. Patterns of community change among ammonia oxidizers in meadow soils upon long-term incubation at different temperatures. App. Environ. Microbiol. 69:6152-6164.
Badía, D. 2000. Potential nitrification rates of semiarid cropland soils from the Central Ebro Valley, Spain. Arid Soil Research and Rehabilitation 14:281-292.
Bartlett, R.J. 1981. Nonmicrobial nitrite-to-nitrate transformations in soils. Soil Sci Soc. Am. J. 45:1054-1058.
Batchelor, S.E., M. Cooper, S.R. Chhabra, L.A. Glover, G.S.A.B. Stewart, P. Williams, and J.I. Prosser. 1997. Celldensity-regulated recovery of starved biofilm populations of ammonia-oxidizing bacteria. App. Environ. Microbioil. 63:2281-2286.
Bedard, C., and R. Knowles. 1989. Physiology, biochemistry, and specific inhibitors of CH4, NH4+, and CO oxidation by methanotrophs and nitrifiers. Microbiological Reviews. 53:68-84.
96
Boon, B., and H. Laudelout. 1962. Kinetics of nitrite oxidation by nitrobacter winogradskyi. Biochem. J. 85:440-447
Bouman, O.T., D. Curtin, C.A. Campbell, V.O. Biederbeck, and H. Ukrainetz. 1995. Soil acidification from long-term use of anhydrous ammonia and urea. Soil Sci. Soc. Am. J. 59:1488-1494.
Breuer, L., R. Kiese, and K. Butterbach-Bahl. 2002. Temperature and moisture effects on nitrification rates in tropical rain-forest soils. Soil Sci. Soc. Am. J. 66:834-844.
Broadbent, F.E., K.B. Tyler, and G.N. Hill. 1957. Nitrification of ammoniacal fertilizers in some California soils. Hilgardia 27:247-267.
Burton, S.A.Q., and J.I. Prosser. 2001. Autotrophic ammonia oxidation at low pH through urea hydrolysis. App. Environ. Microbiol. 67:2952-2957.
Carpenter-Boggs, L., P.D. Stahl, M.J. Lindstrom, and T.E. Schumacher. 2003. Soil microbial properties under permanent grass, conventional tillage, and no-till management in South Dakota. Soil and Tillage Research 71P:15-23.
Chu, H., T. Fujii, S. Morimoto, X. Lin, and K. Yagi. 2008. Population size and specific nitrification potential of soil ammonia-oxidizing bacteria under long-term fertilizer management. Soil Biol. Biochem. 40:1960-1963.
Csonka, L.N. 1989. Physiological and genetic responses of bacteria to osmotic stress. Microbiological Reviews 53:121-147.
Dancer, W.S., L.A. Peterson, and G. Chesters. 1973. Ammonification and nitrification of N as influenced by soil pH and previous N treatments. Soil Sci. Soc. Amer. Proc. 37:67-69.
Darrah, P.R., P.H. Nye, and R.E. White. 1985. Modelling growth responses of soil nitrifiers to additions of ammonium sulphate and ammonium chloride. Plant and Soil 86:425-439.
Darrah, P.R., R.E. White, and P.H. Nye. 1986a. Simultaneous nitrification and diffusion in soil. II. The effects at levels of ammonium chloride which inhibit nitrification.
Darrah, P.R., R.E. White, and P.H. Nye. 1986b. Simultaneous nitrification and diffusion in soil V. The effects of pH change, following the addition of ammonium sulphate, on the activity of nitrifiers. Journal of Soil Science, 37:479-484.
Darrah, P.R., R.E. White, and P.H. Nye. 1987. The effect of high solute concentrations on nitrification rates in soil. Plant Soil 97:37-45.
De Boer, W., P.J.A. Klein Gunnewiek, M. Veenhuis, E. Bock, and H.J. Laanbroek. 1991. Nitrification at low pH by aggregated chemolithotrophic bacteria. App. Environ. Microbiol. 57:3600-3604.

97
De Boer, W., P.J.A. Klein Gunnewiek, S.T. Troelstra, and H.J. Laanbroek. 1989. Two types of chemolithotrophic nitrification in acid heathland humus. Plant and Soil 119:229-235.
De Boer, W., and G.A. Kowalchuk. 2001. Nitrification in acid soils: micro-organisms and mechanisms. Soil biology and Biochemistry 33:853-866.
Eno, C.F. 1960. Nitrate production in the field by incubating the soil in polyethylene bags. Soil Sci. Soc. Am. Proc. 24:277-279.
Eno, C.F., and W.G. Blue. 1954. The effect of anhudrous ammonia on nitrification and the microbiological population in sandy soils. Soil Sci. Soc. Am. Proc. 18:178-181.
Foster, R.C. 1988. Microenvironments of soil microorganisms. Biol. Fertil. Soils 6:189-203.
Frederick, L. and F.B. Broadbent. 1965. Biological Interactions. In Agricultural Anhydrous Ammonia Technology and Use. (McVickar, M.H., ed.) Ammonia Institute, Memphis, TN, pp. 198–212.
Frederick, L.R. 1956. The formation of nitrate from ammonium nitrogen in soils. I. Effect of temperature. Soil Sci. Soc. Amer. Proc. 20:496-500.
Freitag, A., and E. Bock. 1987. Growth of Nitrobacter by dissimilatoric nitrate reduction. FEMS Microbiol. Lett. 48:105-109.
Frijlink, M.J., T. Abee, H.J. Laanbroek, W. de Boer, amd W.N. Konings. 1992. The bioenenrgetics of ammonia and hydroxylamine oxidation in Nitrosomonas europaea at acid and alkaline pH. Arch. Microbiol. 157:194-199.
Fuentes, J.P., D.F. Bezdicek, M. Flury, S. Albrecht, and J.L. Smith. 2006. Microbial activity affected by lime in a long-term no-till soil. Soil and Tillage Research 88:123-131.
Garrido, F., C. Hénault, H. Gaillard. and J.C. Germon. 2000. Inhibitory capacities of acetylene on nitrification in two agricultural soils. Soil Biol. Biochem. 32:1799-1802.
Glass, A.D. 2003. Nitrogen use efficiency of crop plants: Physiological constraints upon nitrogen absorption. Crit. Rev. Plant. Sci. 22:453-470.
Groffman, P.M. 1985. Nitrification and denitrification in conventional and no-tillage soils. Soil Sci Soc. Am. J. 49:329-334.
Grundmann, G.L., and D.E. Rolston. 1987. Water function approximation to degree of anaerobiosis associated with denitrification. Soil Sci. 144:437-441.
Grundmann, G.L., P. Renault, L. Rosso. and R. Bardin. 1995. Differential effects of soil water content and temperature on nitrification and aeration. Soil Sci. Soc. Am. J., 59:1342-1349.
98
Hadas, A., S. Feigenbaum, A. Feigin, and R. Portnoy. 1986. Nitrification rates in profiles of differently managed soil types. Soil Sci. Soc. Amer. J. 50:633-639.
Hall, A.D., N.H.J. Miller, and C.T. Gimingham. 1908. Nitrification in acid soils Proc. Roy. Soc. (London), Ser. B., 80:196-212.
Hankinson, T.R., and E.L. Schmidt. 1989. An acidophilic and a neutrophilic Nitrobacter strain isolated from the numerically predominant nitrite-oxidizing population of an acid forest soil. App. Environ. Microbiol. 54:1536-1540.
Hart, S.C., J.M. Stark, E.A. Davidson, and M.K. Firestone. 1994. Nitrogen mineralization, immobilization, and nitrification. In Methods of Soil Analysis: part 2 Microbiological and biochemical properties (managing ed. Mickelson, S.H.) Soil Sci. Soc. Am., Inc. Madison, WI.
Hattori, T., and T. Hattori. 1976. The physical environment in soil microbiology: An attempt to extend the principles of microbiology to soil microorganisms. Crit. Rev. Microbio. 4:423-461.
Hauck, R.D. Mode of action of nitrification inhibitors. ASA special publication No. 38. Amer. Soc. Agron. and Soil Sci. Soc. Amer, Madison, Wi. 1980.
Haynes, R.J. 1986. Nitrification. In Mineral Nitrogen in the Plant-Soil System (Kozlowski, T.T. ed.), pp. 127-157. Academic Press, Inc. Orlando.
Hissett, R., and T.R.G. Gray. 1976. Microsites and time changes in soil microbe ecology. In The role of terrestrial and aquatic organisms in decompostioin processes (Anderson, J.M., MacFadyen, A., eds.) Blackwell, Oxford, pp 23-39.
Hoffmann, H., M. Schloter, and B-M Wilke. 2007. Microscale-scale measurement of potential nitrification rates of soil aggregates. Biol Fertil. Soils 44:411-413.
Hooper, A.B. 1989. Biochemistry of the nitrifying lithoautotrophic bacteria. In Autotrophic Bacteria (Shlegel, H.G., Bowien, B., eds.) Science Tech, Madison, WI, pp.239-265.
Hooper, A.B. 1997. Enzymology of the oxidation of ammonia to nitrite by bacteria. Antonie van Leeuvenhoek 71:59-67.
Hyman, M.R., and P.M. Wood. 1985. Suicidal inactivation and labeling of ammonia mono-oxygenase by acetylene. Biochem. J. 227:719-725.
Islam, A., R.E. White, and D. Chen. 2006. Nitrification activity in acid soils of North-Eastern Victoria, Australia, as affected by liming and phosphorus fertilization. Australian Journal of Soil Research 44:739-744.
Jin, R.-C., P. Zheng, Q. Mahmood, B-L. Hu. 2007. Osmotic stress on nitrification in an airlift bioreactor. Journal of Hazardous Materials 146:148-154.

99
Justice, J.K., and R.L. Smith. 1962. Nitrification of ammonium sulfate in a calcareous soil as influenced by combinations of moisture, temperature and levels of added nitrogen. Soil Sci. Soc. Proc. 26:246-250.
Kandeler, E., and K.E. Böhm. 1996. Termporal dynamics of microbial biomass, zylanase activity, N-mineralisation and potential nitrification in different tillage systems. Applied Soil Ecology, 4:181-191.
Kirk, G.J.D., H.J. Kronzucker. 2005. The potential for nitrification and nitrate uptake in the rhizosphere of weland plants: A modeling study. Annals of Botany 96:639-646.
Kremen, A., J. Bear, U. Shavit, and A. Shaviv. 2005. Model demonstrating the potential for coupled nitrification denitrification in soil aggregates. Environ. Sci. Technol. 39:4180-4188.
Kyverga, P.M., A.M. Blackmer, J.W. Ellsworth, and R. Isla,. 2004. Soil pH effects on nitrification of fall-applied anhydrous ammonia. Soil Sci. Soc. M. J. 68:545-551.
Laubscher, K.J., J.M. Van Zyl, and C.C. du Preez. 1990. Equations to calculate the approximate duration and termination of the maximal rate phase of nitrification in soil. Commun. Soil Sci. Plant Anal., 21:611-621.
Laura, R.D. 1977. Salinity and nitrogen mineralization in soil. Soil Biol. Biochem. 9:333-336.
Lees, H., and J.H. Quastel. 1946. Biochemistry of nitrification in soil. II. The site of soil nitrification Biochem. J. 40:815-823.
Leininger, S., T. Urich, M. Schloter, L. Schwark, J. Qi, G.W. Nicol, J.I. Prosser, S.C. Schuster, and C. Schleper. 2006. Archaea predominate among ammonia-oxidizing prokaryotes in soils. Nature 442:806-809.
Linn, D.M. and J.W. Doran. 1984. Effect of water filled pore space on carbon dioxide and nitrous oxide production in tilled and nontilled soils. Soil Science Society of America Journal 48:1267–1272.
Liu, Y., Y-M. Lin, and S-F. Yang. 2003. A thermodynamic interpretation of the monod equation. Current Microbiology 46:233-234.
Low A.P., J.M. Stark, and L.M. Dudley. 1997. Effects of soil osmotic potential on nitrification, ammonification, N-assimilation and nitrous oxide production. Soil Science 162:16-27.
Macduff, J.H., and R.E. White. 1985. Net mineralization and nitrification rates in a clay soil measured and predicted in permanent grassland from soil temperature and moisture content. Plant and Soil 86:151-172.
Mahendrappa, M.K., R.L. Smith, and A.T. Christiansen. 1966. Nitrifying organisms affected by climatic region in Western United States. Soil Sci Soc. Amer. Proc., 30:60-62.
100
Malhi, S.S., R. Lemke, Z.H. Wang, and B.S. Chhabra. 2006. Tillage, nitrogen and crop residue effects on crop yield, nutrient uptake, soil quality, and greenhouse gas emissions. Soil and Tillage Research 90:171-183.
Malhi, S.S., and W.B. McGill. 1982. Nitrification in three Alberta soils: Effect of temperature, moisture and substrate concentration. Soil Biol. Biochem. 14:393-399.
McBride, M.B. 1994. Environmental chemistry of soils. Oxford University Press, N.Y.
McDowell, L.L., and G.E. Smith. 1958. The retention and reactions of anhydrous ammonia on different soil types. Soil Sci. Soc. Amer. Proc. 22:38-42.
McLaren, A.D. 1971. Kinetics of nitrification in soil: Growth of the nitrifiers. Soil Sci. Soc. Amer. Proc. 35:91-95.
Miller R.D., and D.D. Johnson. 1964. The effect of soil moisture tension on carbon dioxide evolution, nitrification, and nitrogen mineralization. Soil Sci. Soc. Am. J. 28:644-647
Morrill, L.G., and J.E. Dawson. 1961. Growth rates of nitrifying chemoautotrophs in soil. Bacteriol. 83:205-206.
Morrill, L.G., and J.E. Dawson. 1967. Patterns observed for the oxidation of ammonium to nitrate by soil organisms. Soil Sci. Soc. Amer. Proc. 31:757-760.
Page, K.L., R.C. Dalal, N.W. Menzies, and W.M. Strong. 2002. Nitrification in a vertisol subsoil and its relationship to the accumulation of ammonium-nitrogen at depth. Aust. J. Soil Res. 40:727-735.
Papendick, R I., G.S. Campbell. 1978. Theory and measurement of water potential. In Water potential relations in soil microbiology. ( Kral, D. ed.) SSA special publication no. 9. Madison, Wis: Soil Science Society of America; 1978. pp. 1–21.
Phillips , C.J., D. Harris, S.L. Dollhopf, K.L. Gross, J.I. Prosser, and E.A. Paul. 2000. Effects of agronomic treatments on structure and function of ammonia-oxidizing communities. Appl. Environ. Microbiol. 66:5410-5418.
Prosser, J.I. 1989. Autotrophic nitrification in bacteria. Advances in Microbial Physiology 30:125-181.
Quastel, J.H., and P.G. Scholefield. 1951. Biochemistry of nitrification in soil. Bacteriol. Rev. 15:1-53.
Rice, C.W., and M.S. Smith. 1983. Nitrification of fertilizer and mineralized ammonium in no-till and plowed soil. Soil Sci. Soc. Am. J. 47:1125-1129.
Rice, E.L. 1984. Allelopathy. 2nd ed. Academic Press, London.
101
Robertson, G.P., and P.M. Vitousek. 1981. Nitrification potentials in primary and secondary succession. Ecology 62:376-386.
Rodrigo, A., S. Recous, C. Neel, and B. Mary. 1997. Modelling temperature and moisture effects on C-N trasformations in soils: comparison of nine models. Ecological Modelling 102:325-339.
Rosenberg, R.J., N.W. Christensen, and T.L. Jackson. 1986. Chloride, soil solution osmotic potential, and soil pH effects on nitrification. Soil Sci. Soc. Am. J. 50:941-945.
Rovita, D. and Killorn, R. 2007. Kinetics of Nitrification in Selected Iowa Soils Treated with Stay-N 2000. Commun. Soil Sci. Plant Anal. 38:13,1949-1963
Russell, C.A., I.R.P. Fillery, N. Bootsma, and K.J. McInnes. 2002. Effect of termperature and nitrogen source on nitrification in a sandy soil. Commun. Soil Sci. Plant Anal. 33:1975-1989.
Rutherford, P.M., and N.G. Juma. 1992. Influence of texture on habitable pore space and bacterial-protozoan populations in soil. Biol. Fertil. Soils 12:221-227.
Sabey, B.R., and L.R. Frederick, and W.V. Bartholomew. 1959. The formation of nitrate from ammonium nitrogen in soils: III Influence of temperature and initial population of nitrifying organisms on the maximum rate and delay period. Soil Sci. Soc. Amer. Proc.23:462-465
Sabey, B.R., L.R. Frederick, and W.V. Bartholomew. 1969. The formation of nitrate from ammonium nitrogen in soils: IV. Use of the delay and maximum rate phases for making quantitative predictions. Soil Sci. Soc. Amer. Proc. 33:276-278.
Sabey, B.R. 1969. Influence of soil moisture tension on nitrate accumulation in soils. Soil Sci. Soc. Amer. Proc. 33:263-266.
Sabey, B.R., and D.D. Johnson. 1971. Effect of soil moisture tension on nitrate accumulation in Drummer silty clay loam. Soil Sci. Soc. Am. J. 35:848-850.
Sahrawat, K.L. 1988. Use of 15N in nitrification inhibitor studies with special reference to indigenous materials. Jounal of Nuclear Agriculture and Bioilogy 17:238-242.
Shi, W., and J.M. Norton. 2000. Microbial control of nitrate concentrations in an agricultural soil treated with dairy waste compost or ammonium fertilizer. Soil Biology and Biochemistry 32:1453-1457.
Simkins, S., and M. Alexander. 1984. Models for mineralization kinetics with the variables of substrate concentration and population density. App. Env. Micro. 47:1299-1306.
Singh, S.S., and A.K. Kashyap. 2007. Contrasting pattern of nitrifying bacteria and nitrification in seasonally dry tropical forest soils. Current Science 92:1739-1744.
102
Skopp, J., M.D. Jawson. and J.W. Doran. 1990. Steady-state microbial activity as a function of soil water content. Soil Sci. Soc. Am. J. 54:1619-1625.
Smith, J.H. 1964. Relationships between soil cation-exchange capacity and the toxicity of ammonia to the nitrification process. Soil Sci. Soc. Am. Proc. 28:640-644.
Stark, J.M. 1996. Modeling the temperature response of nitrification. Biogeochemistry. 35:433-435.
Stark, J.M., M.K. Firestone. 1995. Mechanisms for soil moisture effects on activity of nitrifying bacteria. Applied and environmental microbiology. 61:218-221.
Starkenburg, S.R., P.S.G. Chain. L.A. Sayavedra-Soto. L. Hauser. M.L. Land, F.W. Larimer, S.A. Malfatti, M.G. Klotz, P.J. Bottomley, D.J. Arp, and W.J. Hickey, W.J., 2006. Genome sequence of the chemolithoautotrophic nitrite-oxidizing bacterium Nitrobacter winogradskyi Nb-255. Appl. Environ. Microbio. 72:2050-2063.
Stearman, G.K., J.E. Matocha. 1992. Soil microbial population and nitrogen-transforming bacteria from 11-year sorghum tillage plots. Soil and Tillage Research 22:299-310.
Stein, L.Y., and D.J. Arp. 1998. Loss of ammonia monooxygenase activity in Nitrosomonas europaea upon exposure to nitrite. App. Environ. Microbiol. 64:4098-4102.
Strong, D.T., P.W.G. Sale, and K.R. Helyar. 1999. The influence of the soil matrix on nitrogen mineralization and nitrification. IV. Texture. Aust. J. Soil Res., 37:329-344.
Subbarao, G.V., M. Rondon, O. Ito, T. Ishikawa, I.M. Rao, K. Nakahara, C. Lascano, and W.L. Berry. 2006. Biological nitrification inhibition (BNI) – is it a widespread phenomenon? Plant and Soil 294:5-18.
Suzuki, I., U. Dular, and S.C. Kwok. 1974. Ammonia or ammonium ion as substrate for oxidation by Nitrosomonas europaea cells and extracts. Journal of bacteriology 120:556-558.
Swensen, B., L.R. Bakken. 1997. Nitrification potential and urease activity in a mineral subsoil. Soil Biol. Biochem. 30:1333-1341.
Tate, R.L. III. 2000. Soil Microbiology, 2nd ed. John Wiley & Sons, Inc. New York.
Thamdrup, B., T. Dalsgaard, M.M. Jensen, O. Ulloa, L. Farías, and R. Escribano. 2006. Anaerobic ammonium oxidation in the oxygen-deficient waters off northern Chile. Limnol. Oceonagr. 51:2145-2156.
Thompson, S.P., H.W. Paerl, and M.C. Go. 1995. Seasonal patterns of nitrification and denitrification in a natural and a restored salt marsh. Estuaries 18:399–406.
103
Touchton, J.T., and F.C. Boswell. Performance of nitrification inhibitors in the Southeast. In Nitrification Inhibitors- Potentials and Limitations. ASA special publication No. 38. Amer. Soc. Agron. and Soil Sci. Soc. Amer, Madison, Wi. 1980.
Tourna, M., T.E. Freitag. G.W. Nicol, and J.I. Prosser. 2008. Growth, activity, and temperature response of ammonia oxidizing bacteria in soil microcosms. Environ. Microbiol. 10:1357-1364.
Underhill, S.E., and J.I. Prosser. 1987. Surface attachment of nitrifying bacteria and their inhibition by potassium ethyl xanthate. Microb. Ecol. 14:129-139.
Van Veen, J.A., and M.J. Frissel. 1981. Simulation model of the behavior of N in soils. In Simulation of nitrogen behaviour of soil-plant systems. (Frissel, M.J., and Vav Veen, J.A. eds.) Centre for Agricultural Publishing and Documentation, Wageningen, The Netherlands.
Verhagen, F.J.M., and H.J. Laanbroek. 1991. Competition for ammonium between nitrifying and heterotrophic bacteria in dual energy-limited chemostats. App. Environ. Microbiol. 57:3255-3263.
Walker, N. 1975. Nitrification and nitrifying bacteria. Ch. 7 In Soil Microbiology (Walker, N. ed.) John Wiley & Sons, N.Y.
Weier, K.L., and J.W. Gilliam. 1986. Effect of acidity on nitrogen mineralization and nitrification in Atlantic Coastal Plain soils. Soil Sci. Soc. Amer. J. 50:1210-1214.
Wheatley, R.E., K. Ritz, D. Crabb, and S. Caul. 2001. Temporal variations in potential nitrification dynamics in soil related to differences in rates and types of carbon and nitrogen inputs. Soil Biol. Biochem. 33:2135-2144.
White, C.S. 1994. Monoterpenes: their effects on ecosystem nutrient cycling. Journal of Chemical Ecology 20:1381-1406.
Whitehouse, M.J., and J.K. Leslie. 1973. Movement, pH effect and nitrification of band-applied anhydrous ammonia, urea and sulphate of ammonia in an alkaline black earth. Queensland journal of Agricultural and Animal Sciences 30:301-310.
104
CHAPTER 2
NITRIFICATION RATES IN SANDY SOILS OF THE SOUTHEASTERN COASTAL
PLAIN AS AFFECTED BY SOIL TEXTURE, ORGANIC MATTER, AND pH
_______________________________________________ 1Mowrer, J.E., D.E. Kissel, M.L. Cabrera, and W.P. Miller. To be submitted to Soil Science Society of America

105
Abstract
Nitrification is known to proceed more slowly in sandy soils than in clayey soils. This
fact holds implications for the fate of ammoniacal fertilizers applied to agricultural land. The
fate of ammoniacal fertilizers is closely tied to the pattern of acid soil and subsoil development, a
persistent problem with moderately weathered and coarse textured soils. Incubation experiments
were conducted on four sandy soils typical of those under agricultural production in the Coastal
Plain region of the Southeastern United States. The soils were chosen for study based on their
differing properties with respect to soil texture and organic matter content. Each soil was
additionally adjusted to three different target pH values (5.5, 6.0, and 6.5) to study the effect of
initial soil pH on nitrification rates. The results of the study show that nitrification rates are
strongly and positively related to soil cation exchange capacity (CEC) of these soils and that the
lag phase (time from introduction of ammonia substrate to the onset of measureable nitrification)
is negatively related to CEC. No significant relationship between nitrification rates and initial
soil pH was found, though the multiple regression analysis model was strengthened when initial
soil pH was included. Finally, it was shown that soil matric potential is a poor reference index
for comparing soils with respect to nitrifier activity. Evidence is presented here to support the
concept of using percent water-filled pore space (%WFP) as a measurement of soil water content
to compare such activity.

106
Introduction
Nitrification is the process wherein ammonia (NH3) is oxidized first to nitrite (NO2-) and
ultimately to nitrate (NO3-). This process is of great interest in agricultural production as it has
implications both environmental and economic. The end product of nitrification is nitrate, an
anion easily leached through the root zone leading to losses of applied or native nitrogen,
ecological imbalance, and/or human toxicities. Furthermore, protons (H+) are a by-product of
the oxidation of ammonia. One mole of H+ ions is produced for every mole of ammonia
oxidized to nitrate. When ammonia exists as the ionic form (NH4+), dissociation of one
additional proton must occur prior to oxidation. This production of protons, coupled with the
leaching of nitrates (accompanied by base cations) makes nitrification a highly significant
contributor to the acidification of soils and subsoils (Helyar and Porter, 1989; Bouman et al.,
1995). For these reasons, Sumner and Noble (2003) have asserted that ammoniacal fertilizers
provide the major acidifying input to soils under intensive agricultural production.
Nitrification is performed in soils by a number of microorganisms including fungi,
heterotrophic bacteria, and archaea (Hayatsu et al., 2008); but is dominated in normal (non-
extreme) soil environments by chemolithoautotrophic bacteria. The two groups of nitrifying
chemolithoautotrophs can be generalized as ammonia oxidizing bacteria (AOB) and nitrite
oxidizing bacteria (NOB). Under soil conditions considered typical for agriculture in the
Southeastern United States Coastal Plain (i.e. temperature 100° - 40°C, pH < 7.0), nitrite is
consumed by NOB and converted to nitrate as quickly as it is produced (Morrill and Dawson,
1967). Therefore, net nitrification rates are frequently measured as nitrate accumulation or as
ammonium consumption. The pattern of nitrate accumulation or ammonia consumption by soil
nitrifiers under non-limiting conditions will appear as a sigmoidal curve when plotted against

107
time on the x-axis. Three distinct phases of the curve have been described as the lag phase,
maximal rate phase, and the retarded (reduced rate) phase (Sabey et al. 1959; Hadas et al. 1986).
Using either measurement approach, a sigmoidal curve can be fit to the observed data using a
non-linear least squares regression of the Verhulst equation {dN/dt = kN(a-N)} related to
substrate or product rather than population. Parameters describing the phases of the sigmoidal
curve can then be calculated using the method suggested by Sabey et al. (1969) and expanded on
by Hadas et al. (1986) and Laubscher et al. (1990). Often there is good agreement between
equation parameters when fitting to data for NO3- accumulation or NH3
+ consumption (Hadas et
al., 1986), though significant differences have been reported when other processes such as
nitrogen mineralization, immobilization, and denitrification interfere with measurement of net
rates (Weier and Gilliam, 1986; Justice and Smith, 1962). In these instances, net nitrification
rates may fail to represent actual or gross nitrification rates leading to less accurate
interpretations of experimental data.
Some soil properties known to affect nitrification rates (net and gross) include soil texture
(Strong et al. 1999), pH (Islam et al., 2006; Page et al., 2002), organic matter content (Chu et al.,
2008; Rice and Smith, 1983), temperature (Avrahami and Conrad, 2003; Russell et al., 2002),
osmotic pressure (Low et al., 1997), substrate availability/concentration (Shi and Norton, 2000;
Malhi and McGill, 1982; Anthonisen et al., 1976), aeration (Grundmann et al., 1995), and water
content (Stark and Firestone, 1995; Doran et al., 1990). These soil properties have been well
studied and are related to nitrification rates closely enough to be applied to the process as factors
whose individual and interactive effects been estimated with some success (Grundmann et al.
1995, Darrah et al., 1989). Generally, nitrification rates increase with increasing soil clay
content and decrease with increasing sand content. Nitrification rates are also positively related
108
to soil organic matter content. With respect to soil pH, ammonia oxidation is typically optimized
at neutral to slightly alkaline pH with rates decreasing with increasing alkalinity or acidity.
Similarly, there exists an optimum value for temperature, water content, substrate availability,
osmotic pressure, and aeration. When nitrification rates are plotted on a y-axis against pH,
temperature, water content, substrate availability, osmotic pressure and/or aeration, the result
often appears as an imperfect or in some cases heavily skewed parabola. The optimum level of
each factor may be considered to be the apex of the parabola. As this value increases or
decreases along the x-axis, that factor value is less than optimal and nitrification rates will
therefore decrease.
Soils under agricultural production in the Southeastern United States Coastal Plain
contain mostly 1:1 clay, aluminum- and iron-oxide minerals, are well weathered, often coarse in
texture (> 50% sand), and poorly buffered against changes in pH (Adams and Hathcock, 1984) .
This combination of soil properties should be expected to result in lower potential nitrification
rates than those observed in the more clayey soils of the Western, Midwestern, or Northeastern
United States (Weier and Gilliam, 1986). Clay content is positively associated with soil surface
area and cation exchange capacity. Soil AOB are reported to perform best when attached to
positively charged surfaces and NOB perform best when attached to negatively charged surfaces
(Allison and Prosser, 1993). Therefore, sandy soils will provide less habitat and support smaller
populations of resting and active AOB (Rutherford and Juma, 1992; Underhill and Prosser,
1987). The poor pH buffering capacity of these soils can allow for large changes in pH resulting
from the production of protons during the oxidation of ammonia. This in turn will potentially
lead to acid inhibition of the entire nitrification process (Morrill and Dawson, 1967). The overall
pattern of ammonia consumption and nitrate production, when considered along with downward
109
ion (solute) transport, plant root uptake, and proton production, will in large part determine the
pattern of soil and subsoil acidity development (Helyar and Porter, 1989).
The development of soil and subsoil acidity has been observed to be more rapid than in
soils found in other regions of the U.S., and therefore deserves attention (Weier and Gilliam,
1986; Eno and Blue, 1957). Towards this end, some coarsely textured soils typical of those
under agricultural production in the Southeastern U.S. Coastal Plain were selected for study.
Four representative soils were sampled from different locations in the Cabin Field (Crisp Co.,
Georgia) and incubated with added ammonium substrate source. These soils were selected for
their differing properties with respect to clay and organic matter content to study the effect(s)
these properties exert on the oxidation of ammonia. Additionally, each of the four soils were
adjusted to three pH values (pH 5.5, 6.0, and 6.5) representing the range of soil pH values often
found in the field at the time of nitrogen fertilizer application in this region. It was hypothesized
that the data from this experiment could be used to generate values for the duration of lag phase,
maximal rate, and duration of maximal rate phase that would differ significantly from each other
based on the soil properties selected for and from those reported in other regions of the U.S. For
instance, it was expected that lag times would be longer and maximal rates would be lower.
These biotic properties related to nitrification in the highly-weathered, coarsely textured soils of
the Southeastern Coastal Plain should be closely related to certain abiotic properties of soil,
including texture, organic matter content, CEC, and initial incubation pH.
Materials and Methods
Soils and Experimental Treatments
All four soils were sampled from Northwest Crisp County, Georgia (83o56’20.510” to
83o56’51.944” W; 32o00’16.994” to 32o01’24.675” N). Some selected properties of each soil are
110
presented in Table 2.1. The soils included a Bonifay soil from an upper slope or ridge area of the
field as well as a Bonifay soil from a depressional area of the field to contrast the effect of
organic matter on nitrification within the same soil series. The latter soil will be referred to as
Bonifay depressional while the former will simply be designated Bonifay. A Norfolk series soil
from a depressional area which contained the highest amount of organic matter and clay was also
chosen for the experiment along with an Orangeburg soil containing a low amount of organic
matter and intermediate clay content. Prior to the incubation experiment, each soil was adjusted
to three different target pH values using additions of Ca(OH)2. The target pH values were pH
5.5, 6.0, and 6.5 (1:1 soil:0.01 M CaCl2 w/v). Also, nitrate was leached from all soils prior to
incubation (to reduce measurement error) using at least three pore volumes of deionized water
through a Buchner funnel.
The actual initial pH values following addition of substrate ((NH4)2PO4 + NH4HPO4)
differed slightly from the intended target pH (Tables 2.2 – 2.5). The combination of mono-
ammonium- and di-ammonium-phosphate as sources of substrate for the experiment were chosen
for the minimization of this substrate-induced pH effect. Chloride (Cl-) was specifically avoided
for its inhibitory effects. All experimental treatments received the addition of 100 mg NH3+-N
kg-1 soil. Four replicates of each soil experimental unit received substrate (treatments) and four
replicates of each soil received no substrate (control). Soil moisture for all soils was adjusted to -
0.033 MPa (approximately field capacity) and monitored and maintained throughout the course
of the experiment.
Soil Incubation Conditions
50 grams (oven-dry weight) of air dried soil was placed into specimen cups with screw-
top lids. 0.95 cm holes were drilled into the screw caps using a paddle bit to allow diffusion of
111
oxygen into the incubation units. Cylindrical pieces of sponge 1.3 cm in diameter and 1.9 cm
long were inserted into the holes and wet (not saturated) with deionized water to reduce moisture
loss without preventing the diffusion of oxygen into the unit. Substrate was added to deionized
water in amounts calculated to deliver 100 mg NH3-N kg-1 soil when the appropriate volume of
water was added to each soil after subtracting the air-dry soil water content. The soils were not
packed but were gently tamped against the benchtop at this time and following each sampling
period to reduce any irregularities in the soil surface. Gravimetric moisture values for air-dry
soils and soils at -0.033 MPa are provided in Table 2.1. The soils were incubated at a
temperature of 31°C for 20 days. This is a temperature reported to be at or very near to the
optimum for a temperate area such as Southern Central Georgia (Malhi and McGill, 1982).
Samples were taken for extraction at days 0, 5, 8, 11, 14, 17, and 20 except in the case of the
Norfolk depressional soil where sampling times were similar at 0, 5, 7, 10, 13, 16, and 19 days.
Soil Moisture
Soil gravimetric moisture contents (θg) corresponding to soil water potentials of -0.1 and
-0.033 MPa were determined by placing each soil on a pressure plate apparatus followed by oven
drying (Equations [1,2]). Measurements were made in triplicate and replicate measurements
generally agreed very well.
(mass of soil @ -0.033 MPa) – (mass of oven-dry soil) = (mass of soil water) [1]
θg = (mass of soil water) / (mass of oven-dry soil) [2]
A soil water potential of -0.033 MPa was maintained throughout the experiment by weighing at
every sampling period and adding as necessary. Sponges were re-wet daily with deionized water
to prevent their drying out.

112
Percent water filled pore space (%WFP) was determined on the experimental soils by
first placing 50 cm3 of soil into a 100 mL class A graduated beaker. Deionized water was added
until the soil appeared to be just saturated. Prior to the final volume measurement the graduated
cylinders were then gently tamped to simulate the settling that occurred during incubation,
covered with parafilm to prevent evaporation, and allowed to equilibrate for 24 hours. It was
hoped that, by tamping the soils in this way, a bulk density matching that of the incubation soils
could be simulated. Following the equilibration period, more deionized water was added if the
sheen had disappeared to ensure displacement of all entrapped air. The equilibration step and
addition of water was repeated until the sheen remained on the soils for 24 hours and
displacement of all entrapped air was ensured. 100% water filled pore space was considered to
be satisfied at the point of soil water saturation. Water volume (cm3) was considered to be
equivalent to water mass (g). Bulk densities for the Bonifay, Bonifay Depressional, Orangeburg
and Norfolk Depressional soils were 1.53, 1.45, 1.43, and 1.30 g cm-3 respectively.
Soil Bulk Density (g cm-3) = Soil Oven Dry Weight / Soil Volume [3]
% Soil Pore Space = Saturated Soil Water Volume / Soil Volume [4]
Volumetric Water Content (θν) (-0.033 MPa) = θg x Soil Bulk Density [5]
%WFP (-0.033 MPa) = 100% * θν (-0.033 MPa) / % Soil Pore Space [6]
Sampling, pH Measurement, and Extraction of Soil Mineral Nitrogen
5 grams (oven-dry weight) of soil was taken from each incubation unit and placed into
50-mL centrifuge tubes with screw top caps. A solution of 0.01 M CaCl2 was added to each tube
so that the volume of solution when added to the volume of soil water totaled 5 mL. The
centrifuge tubes containing the soil and salt solution were shaken (side to side) for 30 minutes
113
prior to pH measurement. Measurement of pH was performed using a semi-micro electrode in
conjunction with a standard benchtop pH meter.
Following pH measurement, 20 mL 2 M KCl was added to the centrifuge tubes for
extraction of NH3 and NO3-. The extraction solution to soil ratio was 5:1 (v/w). All centrifuge
tubes were then shaken (side to side) for 30 minutes followed by centrifugation 30 minutes. The
supernatant was frozen (< 0°C) until analysis. Extracted NO3--N and NH3-N were quantified by
flow injection colorimetry and a dilution factor of 5x was applied. Nitrate and ammonia
measured in the control samples (no added substrate) was subtracted from that of the treatments.
Nitrite (NO2-N) was not detected in any of the extracts.
Measurement of Some Selected Soil Properties
Soil organic matter and total nitrogen were measured by the combustion (Dumas) method
and expressed as mg carbon kg-1 soil or mg nitrogen kg-1 soil (Nelson and Sommers, 1996;
Bremner, 1996). Soil cation exchange capacity (CEC) was measured using the unbuffered
method of Sumner and Miller (1996). The saturation solution from CEC determination process
was collected and analyzed by ICP-OES for exchangeable cations. Soil texture was determined
using the hydrometer method (Bouyoucos, 1962).
Non-linear Parameter Estimation
Verhulst equation parameters were estimated by non-linear least squares regression using
SAS software (version 9.1, SAS Institute). The values for duration of lag phase (t’), maximal
rate (Kmax), and onset of retarded or reduced rate phase (ts) were subsequently calculated by the
method of Sabey et al. (1969) later expanded by Hadas et al. (1986), and Laubscher et al. (1990).
114
Results and Discussion
Net Nitrification
The results of measurements for soil nitrate nitrogen (NO3--N) and ammonium nitrogen
(NH3-N) at each sampling period are presented in Tables 2.2 – 2.5. All soils showed at least
some evidence of nitrification as measured either by substrate (NH3-N) consumption or product
(NO3--N) accumulation. At the end of the 20 day incubation period, the Bonifay soil at the initial
target pH 5.5 exhibited the lowest rate of nitrification (10.2 mg NO3--N kg-1 soil; -24.9 mg NH3-
N kg-1 soil). The Bonifay also soil exhibited the greatest effect of pH on nitrification rates.
However, the same soil series at the same initial target pH from a nearby depressional area
exhibited the highest amount of nitrate accumulation and ammonium consumption at the end of
the 20 day incubation period (89.1 mg NO3--N kg-1 soil; -131.033 mg NH3-N kg-1 soil). Soil pH
had very little effect on rates in this soil. The clay and sand contents were very similar, though
the soil organic matter contents were markedly different for the Bonifay and Bonifay
depressional.
This greater amount of soil organic matter was in all probability the reason for the large
difference in gravimetric moisture contents (θg) at -0.033 MPa. The soil organic matter also
contributed an increase in CEC (> 3x) in the Bonifay depressional compared to the Bonifay.
There is evidence that both percent water filled pore space (%WFP) (Doran et al., 1990) and
cation exchange capacity are closely related to nitrification rates in agricultural soils supplied
with non-limiting substrate (Underhill and Prosser, 1987). It is believed, then, that the increased
organic matter in the Bonifay depressional soil is almost solely responsible for the dramatic
difference in observed nitrification rates in two soil samples that differ very little otherwise.
115
Of the two other soils incubated during the experiment, the nitrification rate of the
Orangeburg soil was very similar to the Bonifay depressional. Soil pH treatments had very little
effect on net nitrification rates in the Orangeburg soil, which contained considerably more clay
than the Bonifay soils. Nitrification rates are often positively related to clay content when
aeration is not limiting (Smith, 1964) and negatively related when aeration becomes limiting
(Strong et al., 1999). The Norfolk Depressional contained the largest percent clay (33.2%) as
well as the highest concentration of organic matter (23,387 mg C kg-1 soil). However, the
Norfolk depressional soil nitrified less than the Orangeburg soil.
The reduced nitrification rates in the Norfolk Depressional soil are believed to be related
to insufficient aeration (excessive WFP). Although all soils were incubated at -0.033 MPa, the
gravimetric moisture contents at this potential were very different (Table 2.1). This observation
prompted a measurement of water filled pore space for each soil by the method described
previously. Maximum respiration by aerobic bacteria in coarse textured soils was described by
Doran et al. (1990) as occurring at 54.1 %WFP. A quadratic fit of the experimental data from
Doran et al. study provided the following formula for relative aerobic activity as a function of
%WFP.
Relative Activity = 5.44 (WFP) – 5.03 (WFP)2 – 0.492 [7]
The %WFP for the Norfolk depressional soil was determined to be 88.07% by equations
[2-6], a value well above the optimum of 54.1%. Application of equation [7] to this value
indicated a 40% relative activity in the Norfolk depressional soil when incubated at -0.033 MPa
as compared to 80% (Bonifay), 98% (Orangeburg), and 92% (Bonifay depressional) relative
activity. It is interesting to note that the soils exhibiting the most rapid nitrification rates during
116
the experiment were, according to Doran et al. (1990), functioning at 90 to 100% relative activity
with respect to %WFP (Table 2.10).
Calculation of Delay, Maximal Rate, and Terminal Phases
Integration of the Verhulst equation {dN/dt = kN(a-N)} as outlined by Hadas et al. (1986)
yields the following equation for expressing NO3--N accumulation with time (t) quantitatively,
NO3--N = a / {1 + (a/[NO-
3-N]0 – 1)exp(-ak[t – t0]} [8]
where a and [NO-3-N]0 are the asymptotic and initial values of NO-
3-N, respectively (mg N kg-1
soil). The coefficient k is a constant, and t is time. In this experiment, to is set at zero days. The
parameters a, k, and [NO-3-N]o were calculated by the least-squares fit of equation [8] to the
experimental data for nitrate accumulation. The equation parameter a depends on the amount of
substrate added to the soil. However, the maximal rate (Kmax) is expected to depend on soil
properties as long as substrate is not limiting (Sabey et al., 1959). Kmax was calculated as the
maximal slope of equation [8] at the inflection point where NO-3-N = a/2.
Kmax = k x (a2 / 4) [9]
The delay period (t’), or lag phase was calculated as the value of t when the maximal slope was
extrapolated to [NO-3-N]0 (Sabey et al., 1959; Hadas et al., 1986).
t’ = (1 / ak)ln[a /[NO-3-N]0 – 1] + ([NO-
3-N]0 – a/2) / Kmax [10]
According to Laubscher et al. (1990), the time to the termination of the maximal rate phase (ts)
and the onset of the retarded phase, can be estimated by first calculating the time (tmx) to the
inflection point at NO-3-N = a/2.
tmx = (1/ak) ln(a / [NO-3-N] 0-1) [11]
ts = tmx + (a/2 – [NO-3-N] 0)/Kmax [12]
117
The duration of the maximal rate phase (Δt) is then calculated as the difference between the time
to termination of the maximal rate phase and the time to the onset of same.
Δt = ts – t’ [13]
Termination of the maximal rate phase is initiated when substrate becomes too limiting to
support respiration at the rate observed during the maximal rate phase. This limitation may arise
from insufficient substrate for maximum respiration, which may be affected by the resupply of
substrate to the organism. The mechanism of resupply may be ammonification (mineralization)
of organic nitrogen when available and/or diffusion. During this phase nitrification does not
altogether cease, but rather proceeds at a lower rate that can be described by a first order linear
equation of the general form y = ax + b (Sabey et al. 1969; Darrah et al. 1989). This slope of the
equation fitting all observations at time ≥ ts when such observations exist should give some
indication of how ammonification and diffusional limitation combine to supply substrate to and
subsequently support the AOB population following the onset of substrate limitation. As some
soils have been reported to nitrify very nearly 100% of the added substrate prior to onset of the
retarded phase while others have been observed to nitrify much less than this, it is believed that
measurements beyond the onset of the reduced rate phase could prove useful in illuminating the
rate and or mechanism of substrate resupply.
Hadas et al. (1986) suggested a method based on substrate decomposition/consumption
for estimating the same parameters of [NH3-N0], Kmax, t’, ts, and Δt. The initial value of
substrate [NH3-N0] can be considered equivalent to parameter a – [NO-3-N0]. The concentration
of substrate as a function of time is obtained in the following manner.
NH3-N = [ ][ ] [ ] )exp(
)exp(
0303
03
aktNNHNNHaaktNNHa
−×−+−−−×−× [14]
118
Again the parameters a, k, and [NH3-N0] were calculated from the experimental observations
using least squares regression independently of those derived from the NO-3-N data. The
maximal rate of substrate decomposition (Kmax) is the slope at [NH3-N0] = a/2.
Kmax = -ka2/4 [15]
The delay period (t’) at the time when the maximal slope was extrapolated to the initial value of
[NH3-N0] is derived with the following equation.
t’ = [ ][ ]
[ ]max
03
03
03 2/ ln1K
aNNHNNHa
NNHak
−−+
−−− [16]
Calculation of the remaining rate parameters is as above.
All Verhulst equation parameters for the NO-3-N and NH3-N data are presented in Tables
2.6 and 2.7 with approximate standard errors for each parameter. Estimations of goodness of fit
for equations to data are often supported by r2 values which require an intercept term in the
equation. Non-linear equations such as the Verhulst do not intercept the x axis and so the
goodness of fit for this procedure with each data set was estimated through the use of a pseudo r2
term (pseudo r2 = [1 - SSresidual] / SStotal corrected) (Introduction to SAS, 2009). Net nitrification rate
parameters calculated using equations [9-13, 15, 16] for both substrate consumption and product
accumulation are presented in Tables 2.8 and 2.9.
The pseudo r2 values for all least-squares regression fits of the Verhulst equation to the
observations were very high (0.9275 – 0.9993) indicating very good fits for all data sets and
standard errors for each parameter are relatively low. This was true regardless of the application
to nitrate or ammonia data. Figures 2.1 – 2.8 show the relationship between the observations and
the regression curves. For those soils where nitrification reached the reduced rate phase by the
119
end of the incubation time period (Bonifay, Orangeburg and Bonifay depressional soils), all three
phases are clearly evidenced.
Comparison of maximal rates and the duration of phases as estimated by either NO-3-N or
NH3-N data is presented in Tables 2.8 and 2.9. The highest calculated rates were those
belonging to the Bonifay depressional followed closely by the Orangeburg soil. The lowest rates
belonged to the Bonifay soil from the upslope/ridge area, which contained the most sand, the
least organic matter and the lowest CEC of all soils incubated. The delay or lag phase (t’) was
most brief in the Bonifay depressional and Orangeburg soils and longest in the Norfolk
depressional soil. Durations of the maximal rate phase (Δt) when estimated using nitrate
measurements were closely grouped between 7 to 11 days with only two values outside this
range. Δt estimated from the ammonia measurements varied much more widely (~7 to 37 days).
Maximal rates (Kmax) for the Bonifay soil compared fairly well when estimated using either
substrate or product data. The relationship between KmaxNO3 and KmaxNH3 for the other three soils
was not very close, indicating interference in measurement of net rates from some other
process(es). Because the maximal rates calculated from the NH3-N depletion data are greater
than those calculated from the NO3--N accumulation data, it is likely that ammonia and/or
ammonium nitrogen was being consumed by these other processes. As these coarsely textured
soils contain very little 2:1 clays, interlayer fixation can be excluded as a possibility. The most
likely source of interference in all four soils is immobilization by competing soil organisms,
though it is also likely that some nitrate was lost to denitrification in the Norfolk depressional
soil (> 62% WFP) (Linn and Doran, 1984). The effect of this competition for nitrogen should be
more pronounced in ammonia measurements as heterotrophs are reported to preferentially
immobilize ammonia/ammonium over nitrate when both are available (Puri and Ashman, 1999).

120
This scenario is supported by the discrepancy between initial and final mineral nitrogen
measurements observed in all treatments for all soils (Tables 2.2 – 2.5). The difference between
total initial and final mineral nitrogen was greatest in those soils with the highest concentrations
of organic matter and the widest C:N ratios (Norfolk depressional and Bonifay depressional) and
lowest in the remaining two soils containing low amounts of organic matter and C:N ratios less
than 13:1. For this reason it is recommended that NO-3-N accumulation measurements be used
when estimating net nitrification rates in sandy soils where aeration is not a limiting factor.
The values for Kmax at -0.033 MPa and those adjusted for the effects of water-filled pore
space are in the same range (~2 to ~15 mg NO-3-N kg-1 soil day-1) as those observed by
Laubscher et al. (1990) in a study that included soils similarly low in clay content and organic C,
though the substrate was supplied at a rate of 50 mg N kg-1 soil and the soils were wet to
“approximately field capacity” and incubated at 31°C. Lag times (t’) were similar as well and
ranged from 1.1 to 7.3 days. Rovita and Killorn (2007) observed maximal rates of 13 and 26 mg
kg-1 day-1 and t’ values of less than 3 - 5 days. Experimental conditions in this study included
incubation at 20°C, 60% water-holding capacity (method of determination not specified), and
200 mg N kg-1 soil. Both Sabey et al. (1959) and Hadas et al. (1986) observed much higher
maximal rates and shorter lag phases than the values of Kmax and t’ reported in the current study
(Tables 2.8 and 2.9). The values reported here appear to fall near the low and high end of the
scale respectively when compared to those found in the literature, even when incubated under
what are presumed to be optimum temperature and water content, indicating that these soils have
relatively slow nitrification rates when compared to their counterparts under agricultural
production around the world.
121
Regression analysis using the SAS multiple regression procedure (SAS Institute, version
9.1) revealed a strong negative relationship (p < 0.0005) between the lag phase (t’) and soil CEC
(Table 2.13). There was also a positive interactive effect on the lag phase when the co-factors
organic matter and CEC were entered into the model (R2 = 0.8450). This relationship between
CEC and the lag phase provides more evidence to support previous assertions placing the
location of AOB activity and substrate uptake at soil adsorption sites (Albrecht and McCalla,
1937; Lees and Quastel, 1946; Allison and Prosser, 1993). Multiple regression analysis of the
relationship between the maximal rate (Kmax) and soil properties was performed on the values
calculated at -0.033 MPa as well as the maximal rate values adjusted to 100% relative activity by
the method of Doran et al. (1990) using equation [7]. Results of the regression procedure
revealed a strong positive relationship (p < 0.05) between the maximal rate at -0.033 MPa (Kmax-
0.033) and CEC and initial pH (R2 = 0.7638). When the same model was regressed on the adjusted
rates (Kmax adjusted) the relationship with CEC (p < 0.001) and initial pH were strengthened (R2 =
0.8084) indicating that effects often attributed to texture and organic matter are mechanistically
related to the proliferation of sites for attachment and substrate uptake (CEC) and also to the
capacity of a soil to hold water relative to its pore volume.
Effect of pH on Nitrification
The lone soil observed to exhibit distinct differences in nitrification rates between
treatments (initial pH) was the Bonifay soil containing the least amount of clay and organic
matter. Low contents of clay mineral fraction and soil organic matter are associated with
lowered capacity for holding water and reduced CEC. If the number of active nitrifiers and
substrate availability are indeed positively associated with adsorption sites and clay content
(Rutherford and Juma, 1992; Underhill and Prosser, 1987) then soils with low clay content and
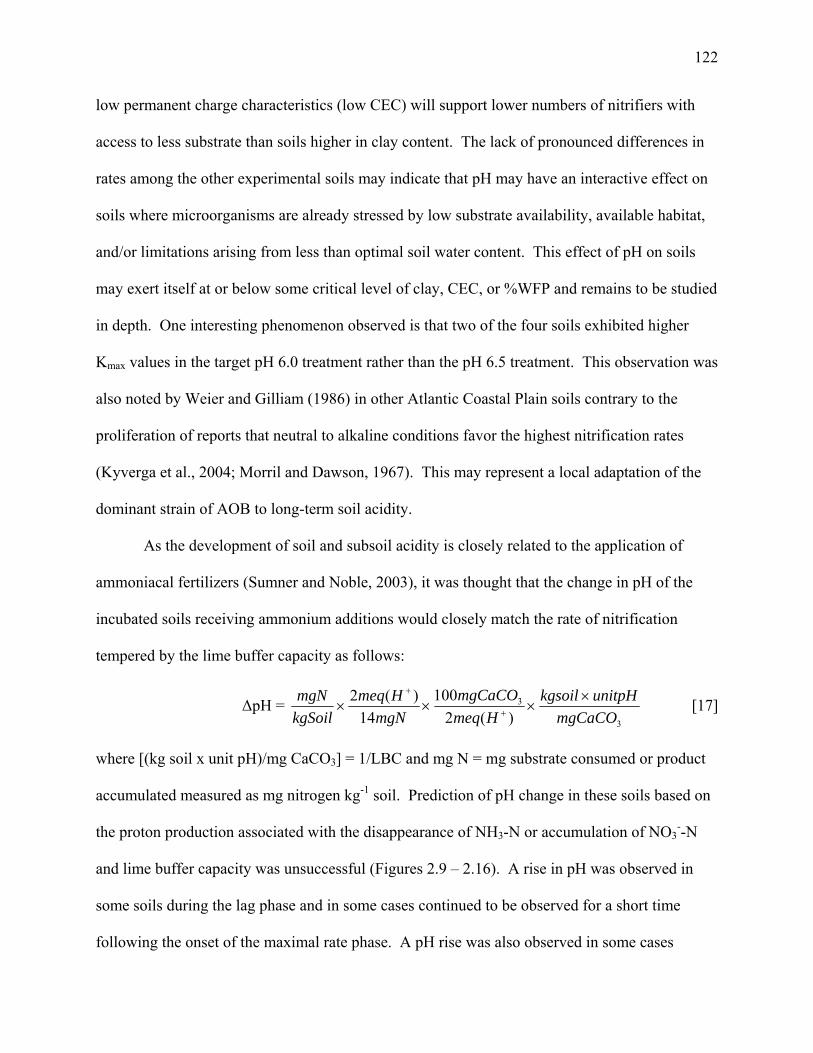
122
low permanent charge characteristics (low CEC) will support lower numbers of nitrifiers with
access to less substrate than soils higher in clay content. The lack of pronounced differences in
rates among the other experimental soils may indicate that pH may have an interactive effect on
soils where microorganisms are already stressed by low substrate availability, available habitat,
and/or limitations arising from less than optimal soil water content. This effect of pH on soils
may exert itself at or below some critical level of clay, CEC, or %WFP and remains to be studied
in depth. One interesting phenomenon observed is that two of the four soils exhibited higher
Kmax values in the target pH 6.0 treatment rather than the pH 6.5 treatment. This observation was
also noted by Weier and Gilliam (1986) in other Atlantic Coastal Plain soils contrary to the
proliferation of reports that neutral to alkaline conditions favor the highest nitrification rates
(Kyverga et al., 2004; Morril and Dawson, 1967). This may represent a local adaptation of the
dominant strain of AOB to long-term soil acidity.
As the development of soil and subsoil acidity is closely related to the application of
ammoniacal fertilizers (Sumner and Noble, 2003), it was thought that the change in pH of the
incubated soils receiving ammonium additions would closely match the rate of nitrification
tempered by the lime buffer capacity as follows:
ΔpH = 3
3
)(2100
14)(2
mgCaCOunitpHkgsoil
HmeqmgCaCO
mgNHmeq
kgSoilmgN ×
××× +
+
[17]
where [(kg soil x unit pH)/mg CaCO3] = 1/LBC and mg N = mg substrate consumed or product
accumulated measured as mg nitrogen kg-1 soil. Prediction of pH change in these soils based on
the proton production associated with the disappearance of NH3-N or accumulation of NO3--N
and lime buffer capacity was unsuccessful (Figures 2.9 – 2.16). A rise in pH was observed in
some soils during the lag phase and in some cases continued to be observed for a short time
following the onset of the maximal rate phase. A pH rise was also observed in some cases

123
during the reduced rate phase even as nitrate continued to appear. One possible source of pH
elevation may be the mineralization (ammonification) of native organic nitrogen in these soils.
However, without monitoring by-products such as CO2 evolution or the use of 15N isotopic
dilution, quantification of the effect of ammonification is impossible. Another potential for pH
elevation resides in the high iron oxide content of these soils. Oxidation/reduction reactions
associated with iron minerals are known to exert a considerable influence on soil pH as shown by
equation [18] (McBride, 1994).
Fe(OH)3(s) + 2H+ = Fe2+ + 1/4 O2(g) + 5/2 H2O [18]
Although this is more often considered a phenomenon of anaerobic conditions, recent research
with aerobically incubated soils may also point in this direction (Thompson, 2008).
Furthermore, this phenomenon may not be strictly chemical. There is some evidence that
acidophilic heterotrophic bacteria can solubilize ferric oxides through enzymatic catalysis of the
reaction given in equation [18] (Bridge and Johnson, 1998; Johnson and McGuinness, 1991)
Regardless of the above postulations, the degree to which the prediction of pH change was
unsuccessful indicates that nitrification alone is a highly insufficient indicator for modeling
changes in soil acidity in these soils when incubated under these conditions.
Conclusions
First, the results of this study provide good evidence that soil CEC is important to the
nitrification process. Mechanistically, cation exchange sites are presumed to be the preferred
location for AOB surface attachment as well as the site of substrate uptake. This may provide
some survival advantage and reduce energy spent by the organism on acquiring substrate for
respiration. Second, this study has reaffirmed the appropriateness of expressing soil water
content with respect to microbial activity as percent water-filled pore space over soil water

124
potential. Past conclusions by investigators concerning the relationship between soil texture and
or organic matter and nitrification rates may have been clouded by adhering to the concept of
expressing soil water content as potential without regard to its effects on aeration.
There were some problems encountered in this study as well. The determination of net
nitrification rates via the measurement of product (NH3-N) disappearance and/or substrate (NO3--
N) accumulation in these soils suffers from a lack of agreement between approaches.
Furthermore, there was a discrepancy between total initial and final mineral nitrogen measured
during the incubation period. The disappearance of mineral nitrogen measured during the
experiment indicates some immobilization likely occurred in the soils that were maintained at
aerobic conditions. One of the four soils (Norfolk depressional) was incubated at a water content
(~88% WFP) that would promote loss of nitrate through denitrification as well and accordingly
exhibited the greatest discrepancy in total mineral nitrogen measured. Ammonia loss through
volatilization, although not measured, was considered minimal to insignificant at these pH
values. Estimation of the effect of immobilization and/or denitrification on net nitrification rates
as determined under the experimental conditions is impossible and so it is recommended that
future incubation studies include efforts to quantify the contribution of these processes to the
overall pattern of nitrogen flux between the available forms and the forms that have been
immobilized or lost from the experimental system. This may be achieved through the use of 15N
isotopic pool enrichment and/or monitoring of CO2 evolution by heterotrophic activity. When
unable to employ these techniques for the estimation of gross nitrification rates, it is
recommended that net rates be based on the measurement of nitrate accumulation as the
interferences are suspected to be less influential (under aerobic conditions) than on the
disappearance of ammonia.
125
Finally, the failure to predict pH change in these soils as a result of the nitrification
process contradicts opinions that the fate of ammoniacal fertilizers is the dominant force in the
acidification of soils. The spectacular degree to which the prediction equation failed to agree
with observations indicates that there is some significant part of the soil acidification system not
accounted for in this study. A likely source of pH buffering in this case may be an artifact of the
conditions under which the incubation study was conducted. Specifically, soil moisture was
maintained at a relatively constant level and oxygen consuming processes were stimulated by the
presence of high levels of nitrogen. This may have resulted in anoxic ‘hot spots’ that promoted
the reduction of ferric materials leading to a rise in pH that would not have been observed under
normal ‘field’ conditions where drying and wetting cycles are environmental norms.
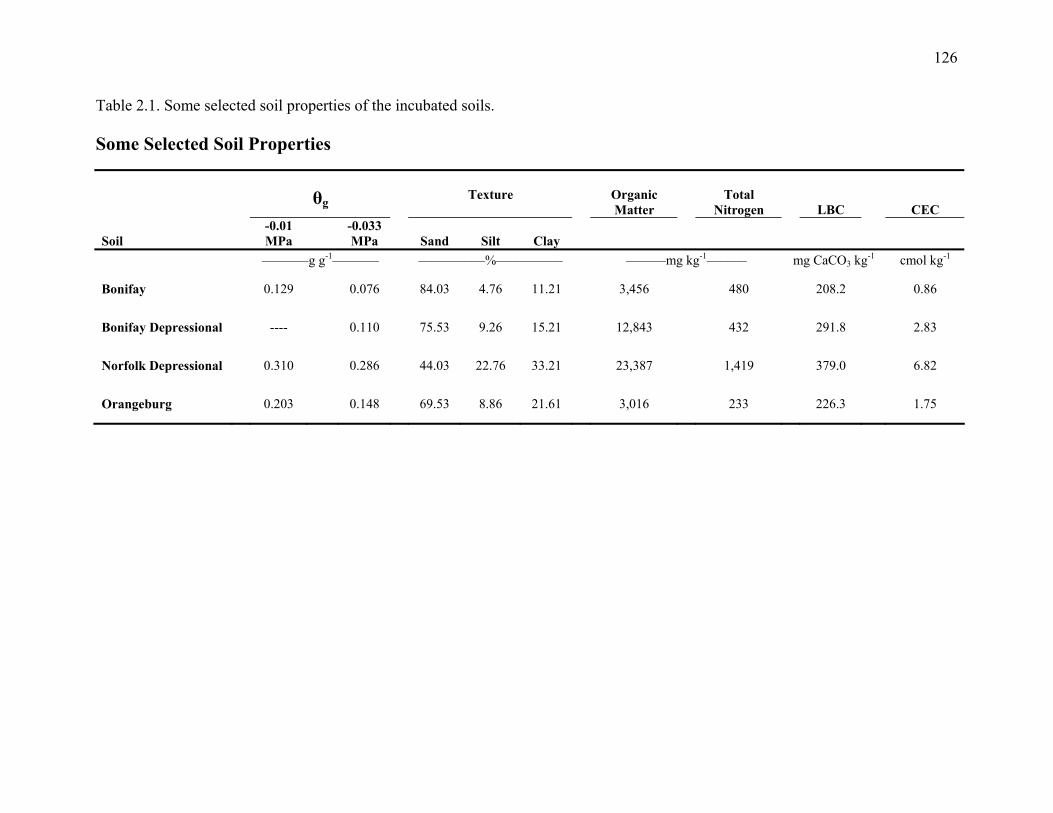
126
Table 2.1. Some selected soil properties of the incubated soils. Some Selected Soil Properties
θg
Texture
Organic Matter
Total Nitrogen LBC CEC
Soil -0.01 MPa
-0.033 MPa Sand Silt Clay
–––––––g g-1–––—–– ––––––––––%–––––––––– ––––––mg kg-1–––––– mg CaCO3 kg-1 cmol kg-1
Bonifay 0.129 0.076 84.03 4.76 11.21 3,456 480 208.2 0.86
Bonifay Depressional ---- 0.110 75.53 9.26 15.21 12,843 432 291.8 2.83
Norfolk Depressional 0.310 0.286 44.03 22.76 33.21 23,387 1,419 379.0 6.82
Orangeburg 0.203 0.148 69.53 8.86 21.61 3,016 233 226.3 1.75
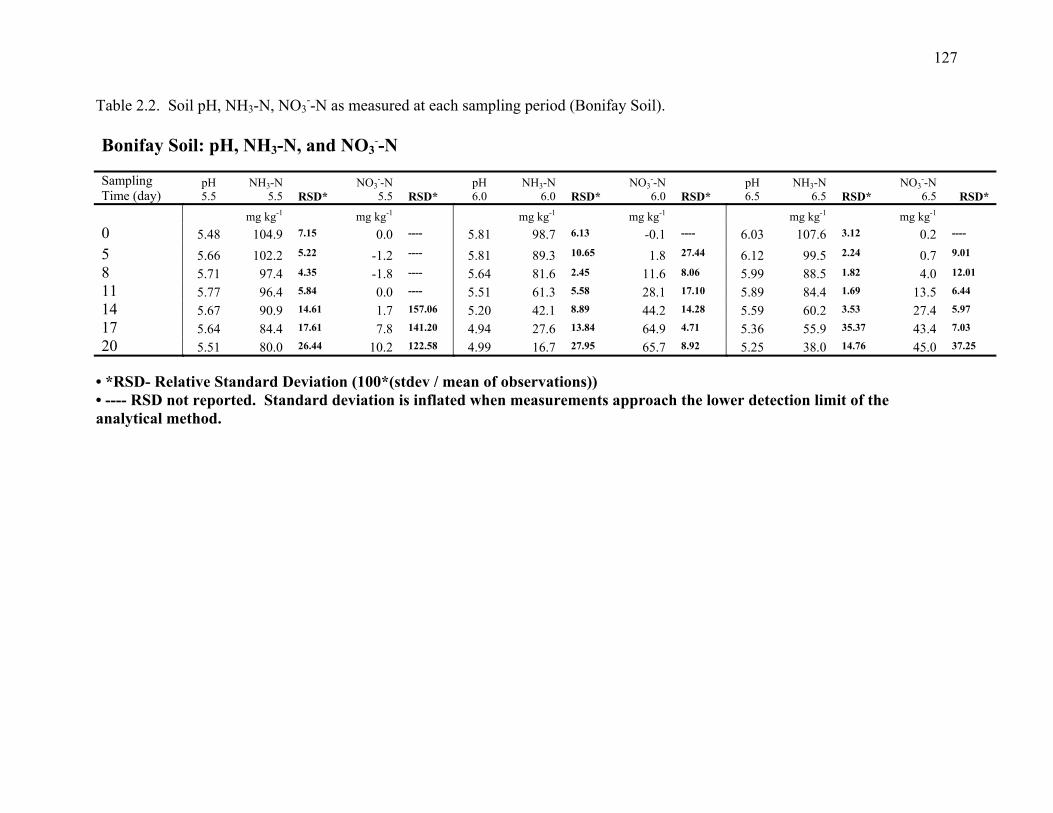
127
Table 2.2. Soil pH, NH3-N, NO3--N as measured at each sampling period (Bonifay Soil).
Bonifay Soil: pH, NH3-N, and NO3
--N Sampling Time (day)
pH 5.5
NH3-N 5.5 RSD*
NO3--N 5.5 RSD*
pH 6.0
NH3-N 6.0 RSD*
NO3--N 6.0 RSD*
pH 6.5
NH3-N 6.5 RSD*
NO3--N 6.5 RSD*
mg kg-1 mg kg-1 mg kg-1 mg kg-1 mg kg-1 mg kg-1
0 5.48 104.9 7.15 0.0 ---- 5.81 98.7 6.13 -0.1 ---- 6.03 107.6 3.12 0.2 ----
5 5.66 102.2 5.22 -1.2 ---- 5.81 89.3 10.65 1.8 27.44 6.12 99.5 2.24 0.7 9.01
8 5.71 97.4 4.35 -1.8 ---- 5.64 81.6 2.45 11.6 8.06 5.99 88.5 1.82 4.0 12.01
11 5.77 96.4 5.84 0.0 ---- 5.51 61.3 5.58 28.1 17.10 5.89 84.4 1.69 13.5 6.44
14 5.67 90.9 14.61 1.7 157.06 5.20 42.1 8.89 44.2 14.28 5.59 60.2 3.53 27.4 5.97
17 5.64 84.4 17.61 7.8 141.20 4.94 27.6 13.84 64.9 4.71 5.36 55.9 35.37 43.4 7.03
20 5.51 80.0 26.44 10.2 122.58 4.99 16.7 27.95 65.7 8.92 5.25 38.0 14.76 45.0 37.25
• *RSD- Relative Standard Deviation (100*(stdev / mean of observations)) • ---- RSD not reported. Standard deviation is inflated when measurements approach the lower detection limit of the analytical method.

128
Table 2.3. Soil pH, NH3-N, NO3--N as measured at each sampling period (Bonifay Depressional Soil).
Bonifay Depressional Soil: pH, NH3-N, and NO3
--N
Sampling Time (day)
pH 5.5
NH3-N 5.5 RSD*
NO3--N 5.5 RSD*
pH 6.0
NH3-N 6.0 RSD*
NO3--N 6.0 RSD*
pH 6.5
NH3-N 6.5 RSD*
NO3--N 6.5 RSD*
mg kg-1 mg kg-1 mg kg-1 mg kg-1 mg kg-1 mg kg-1
0 5.59 131.0 8.77 -0.1 ---- 5.86 120.0 10.44 0.9 138.69 6.23 122.5 18.76 0.0 ----
5 5.26 80.8 11.35 21.9 13.87 5.43 73.1 13.70 24.3 21.67 5.91 83.9 9.15 8.1 21.91
8 5.14 50.6 7.96 46.5 6.14 5.19 34.8 20.82 60.7 13.62 5.52 47.5 15.00 43.4 13.67
11 4.75 20.8 8.96 63.9 1.54 4.91 4.6 48.06 67.6 32.72 5.26 6.4 50.14 55.9 17.78
14 4.84 0.3 ---- 73.5 26.53 5.04 0.0 ---- 86.7 23.12 5.34 0.0 ---- 72.3 38.82
17 4.94 0.0 ---- 81.9 18.50 5.16 0.4 ---- 78.4 22.78 5.58 0.0 ---- 78.8 14.42
20 4.93 0.0 ---- 89.1 8.67 5.16 0.0 ---- 87.8 28.99 5.51 0.0 ---- 79.2 32.78
• *RSD- Relative Standard Deviation (100*(stdev / mean of observations)) • ---- RSD not reported. Standard deviation is inflated when measurements approach the lower detection limit of the analytical method.

129
Table 2.4. Soil pH, NH3-N, NO3--N as measured at each sampling period (Orangeburg Soil).
Orangeburg Soil: pH, NH3-N, and NO3
--N
Sampling Time (day)
pH 5.5
NH3-N 5.5 RSD*
NO3--N 5.5 RSD*
pH 6.0
NH3-N 6.0 RSD*
NO3--N 6.0 RSD*
pH 6.5
NH3-N 6.5 RSD*
NO3--N 6.5 RSD*
mg kg-1 mg kg-1 mg kg-1 mg kg-1 mg kg-1 mg kg-1
0 5.86 104.7 7.55 -0.1 ---- 6.07 101.0 13.42 -0.2 ---- 6.29 108.5 7.22 -0.4 ----
5 5.72 95.6 1.00 13.3 16.73 5.89 86.4 15.55 13.6 27.74 6.06 85.6 5.07 17.7 7.79
8 5.26 62.9 10.47 38.2 8.73 5.45 59.2 24.66 41.4 14.15 5.62 54.7 5.66 50.5 7.38
11 4.88 35.0 9.75 53.9 2.89 4.95 24.0 8.33 65.2 3.06 5.09 15.7 9.63 69.5 3.54
14 4.59 16.7 8.11 67.2 6.42 4.81 9.7 89.81 71.1 3.63 4.98 3.8 78.53 76.4 23.02
17 4.54 8.6 21.06 83.7 3.23 4.84 2.6 92.61 87.5 1.89 5.06 -0.2 ---- 77.4 17.85
20 4.48 2.6 22.54 82.2 4.47 4.80 -0.1 ---- 81.9 10.41 5.07 -0.1 ---- 84.4 4.66
• *RSD- Relative Standard Deviation (100*(stdev / mean of observations)) • ---- RSD not reported. Standard deviation is inflated when measurements approach the lower detection limit of the analytical method.
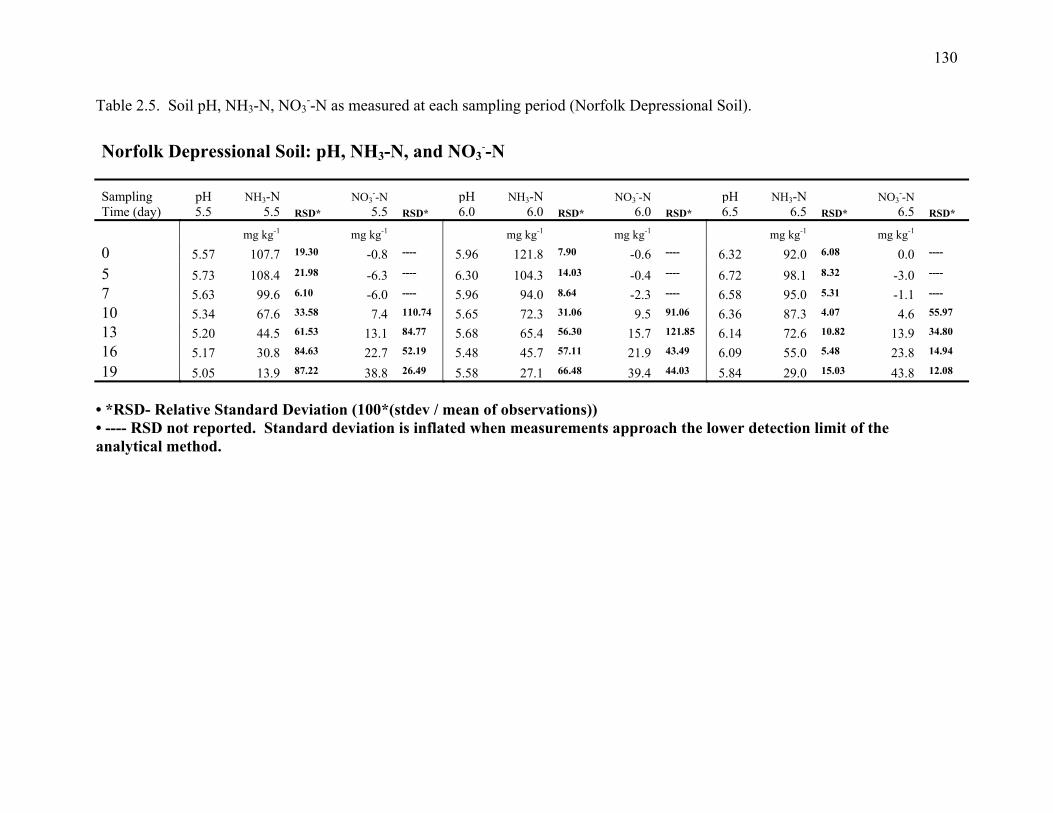
130
Table 2.5. Soil pH, NH3-N, NO3--N as measured at each sampling period (Norfolk Depressional Soil).
Norfolk Depressional Soil: pH, NH3-N, and NO3--N
Sampling Time (day)
pH 5.5
NH3-N 5.5 RSD*
NO3--N 5.5 RSD*
pH 6.0
NH3-N 6.0 RSD*
NO3--N 6.0 RSD*
pH 6.5
NH3-N 6.5 RSD*
NO3--N 6.5 RSD*
mg kg-1 mg kg-1 mg kg-1 mg kg-1 mg kg-1 mg kg-1
0 5.57 107.7 19.30 -0.8 ---- 5.96 121.8 7.90 -0.6 ---- 6.32 92.0 6.08 0.0 ----
5 5.73 108.4 21.98 -6.3 ---- 6.30 104.3 14.03 -0.4 ---- 6.72 98.1 8.32 -3.0 ----
7 5.63 99.6 6.10 -6.0 ---- 5.96 94.0 8.64 -2.3 ---- 6.58 95.0 5.31 -1.1 ----
10 5.34 67.6 33.58 7.4 110.74 5.65 72.3 31.06 9.5 91.06 6.36 87.3 4.07 4.6 55.97
13 5.20 44.5 61.53 13.1 84.77 5.68 65.4 56.30 15.7 121.85 6.14 72.6 10.82 13.9 34.80
16 5.17 30.8 84.63 22.7 52.19 5.48 45.7 57.11 21.9 43.49 6.09 55.0 5.48 23.8 14.94
19 5.05 13.9 87.22 38.8 26.49 5.58 27.1 66.48 39.4 44.03 5.84 29.0 15.03 43.8 12.08
• *RSD- Relative Standard Deviation (100*(stdev / mean of observations)) • ---- RSD not reported. Standard deviation is inflated when measurements approach the lower detection limit of the analytical method.
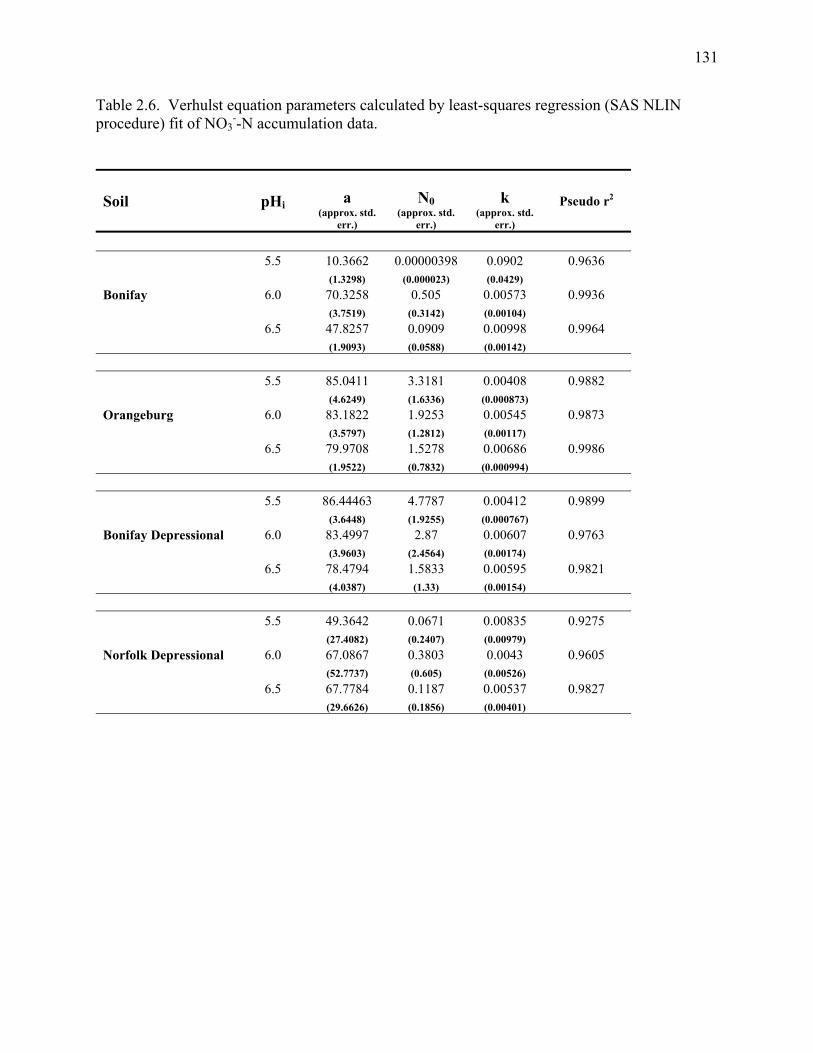
131
Table 2.6. Verhulst equation parameters calculated by least-squares regression (SAS NLIN procedure) fit of NO3
--N accumulation data.
Soil pHi a (approx. std.
err.) N0
(approx. std. err.)
k (approx. std.
err.) Pseudo r2
5.5 10.3662 0.00000398 0.0902 0.9636 (1.3298) (0.000023) (0.0429) Bonifay 6.0 70.3258 0.505 0.00573 0.9936 (3.7519) (0.3142) (0.00104) 6.5 47.8257 0.0909 0.00998 0.9964 (1.9093) (0.0588) (0.00142) 5.5 85.0411 3.3181 0.00408 0.9882 (4.6249) (1.6336) (0.000873) Orangeburg 6.0 83.1822 1.9253 0.00545 0.9873 (3.5797) (1.2812) (0.00117) 6.5 79.9708 1.5278 0.00686 0.9986 (1.9522) (0.7832) (0.000994) 5.5 86.44463 4.7787 0.00412 0.9899 (3.6448) (1.9255) (0.000767) Bonifay Depressional 6.0 83.4997 2.87 0.00607 0.9763 (3.9603) (2.4564) (0.00174) 6.5 78.4794 1.5833 0.00595 0.9821 (4.0387) (1.33) (0.00154) 5.5 49.3642 0.0671 0.00835 0.9275 (27.4082) (0.2407) (0.00979) Norfolk Depressional 6.0 67.0867 0.3803 0.0043 0.9605 (52.7737) (0.605) (0.00526) 6.5 67.7784 0.1187 0.00537 0.9827 (29.6626) (0.1856) (0.00401)

132
Table 2.7. Verhulst equation parameters calculated by least-squares regression (SAS NLIN procedure) fit of NH3-N consumption data.
Soil pHi a (approx. std.
err.) N0
(approx. std. err.)
k (approx. std.
err.) Pseudo r2
5.5 111.3 105 0.000856 0.9898 (3.7558) (0.993) 0.000197) Bonifay 6.0 103.9 99.2533 0.00233 0.9752 (2.8061) (1.7927) (0.000204) 6.5 116.1 107.8 0.0014 0.9792 (8.9482) (3.9917) (0.000375) 5.5 110.8 107 0.00334 0.9948 (4.805) (3.4878) (0.000472) Orangeburg 6.0 103 101.1 0.00448 0.9993 (1.4983) (1.2339) (0.000235) 6.5 109.3 107.3 0.00469 0.9981 (2.7648) (2.2951) (0.000437) 5.5 145.3 130.1 0.00251 0.9941 (10.6183) (4.7243) (0.000511) Bonifay Depressional 6.0 126.6 119.6 0.00391 0.9972 (4.83283) (3.0417) (0.000509) 6.5 125.4 121.3 0.00407 0.9939 (6.2706) (4.6863) (0.000715) 5.5 116.5 113.1 0.00256 0.9818 (7.7116) (5.6379) (0.000578) Norfolk Depressional 6.0 140.4 121.5 0.00118 0.9895 (12.2675) (3.9427) (0.000268) 6.5 96.3611 96.0538 0.00359 0.9896 (2.2759) (2.1245) (0.000486)
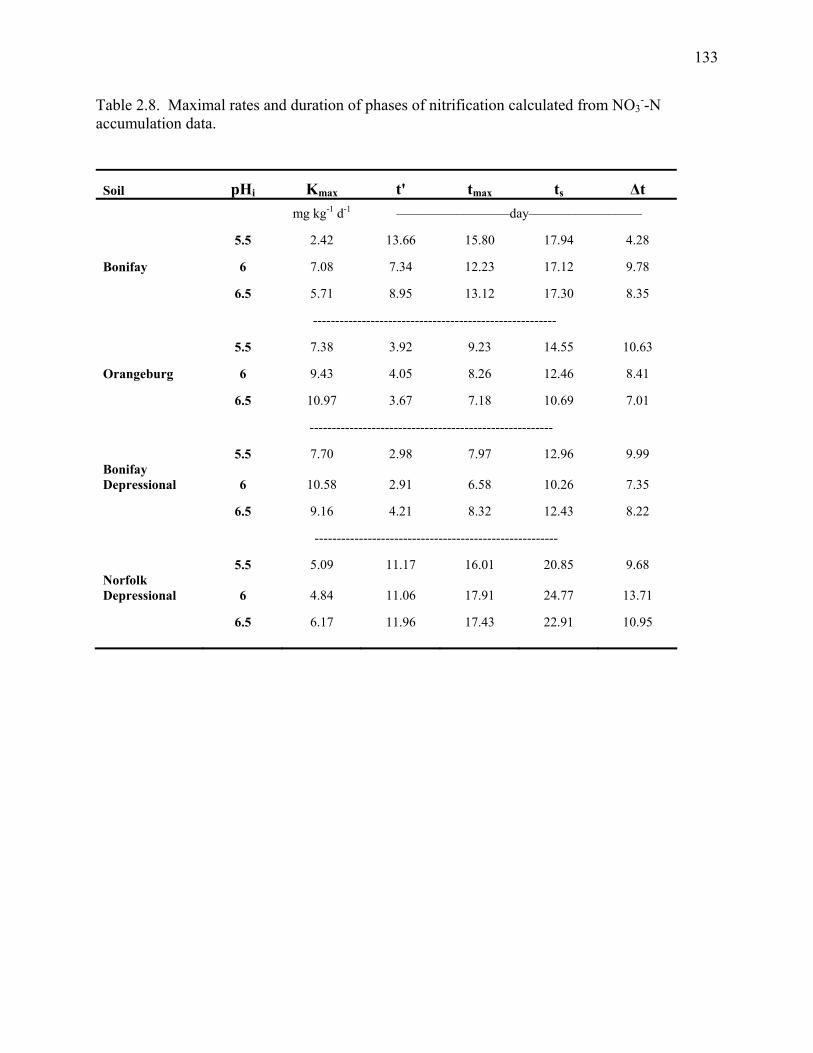
133
Table 2.8. Maximal rates and duration of phases of nitrification calculated from NO3--N
accumulation data.
Soil pHi Kmax t' tmax ts Δt mg kg-1 d-1 –––––––––––––––––day–––––––––––––––––
5.5 2.42 13.66 15.80 17.94 4.28
Bonifay 6 7.08 7.34 12.23 17.12 9.78
6.5 5.71 8.95 13.12 17.30 8.35
-------------------------------------------------------
5.5 7.38 3.92 9.23 14.55 10.63
Orangeburg 6 9.43 4.05 8.26 12.46 8.41
6.5 10.97 3.67 7.18 10.69 7.01
-------------------------------------------------------
5.5 7.70 2.98 7.97 12.96 9.99 Bonifay Depressional 6 10.58 2.91 6.58 10.26 7.35
6.5 9.16 4.21 8.32 12.43 8.22
-------------------------------------------------------
5.5 5.09 11.17 16.01 20.85 9.68 Norfolk Depressional 6 4.84 11.06 17.91 24.77 13.71
6.5 6.17 11.96 17.43 22.91 10.95
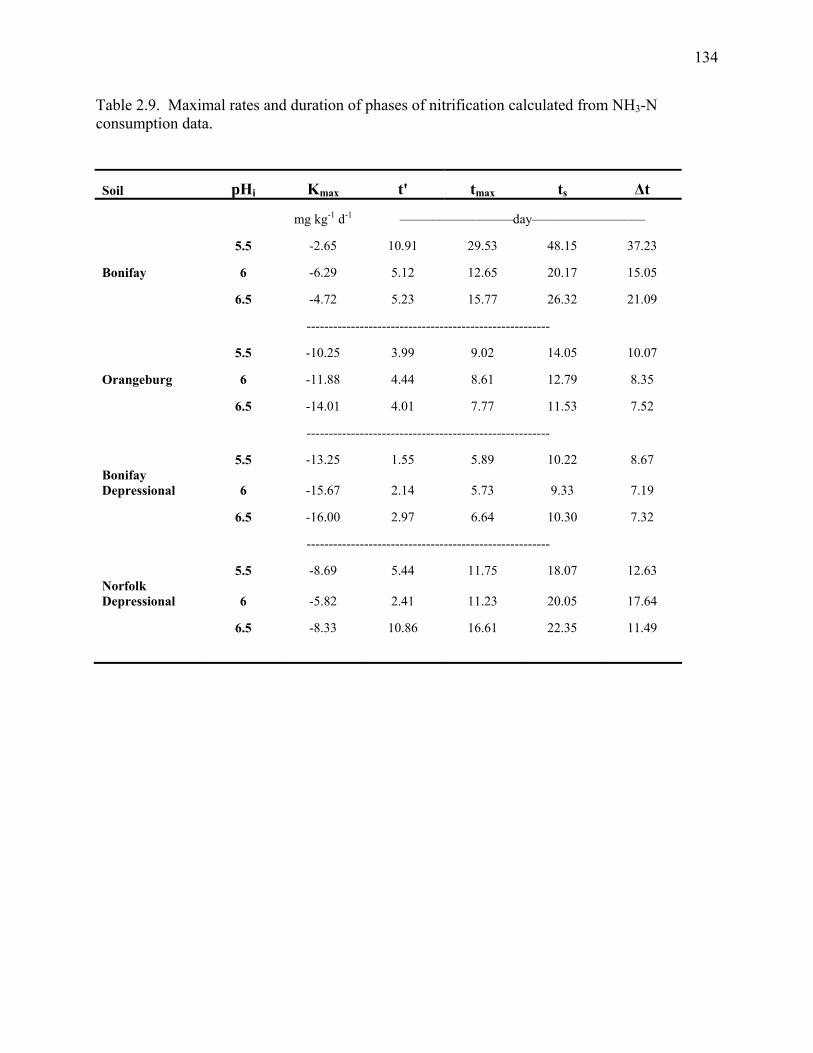
134
Table 2.9. Maximal rates and duration of phases of nitrification calculated from NH3-N consumption data.
Soil pHi Kmax t' tmax ts Δt
mg kg-1 d-1 –––––––––––––––––day–––––––––––––––––
5.5 -2.65 10.91 29.53 48.15 37.23
Bonifay 6 -6.29 5.12 12.65 20.17 15.05
6.5 -4.72 5.23 15.77 26.32 21.09
-------------------------------------------------------
5.5 -10.25 3.99 9.02 14.05 10.07
Orangeburg 6 -11.88 4.44 8.61 12.79 8.35
6.5 -14.01 4.01 7.77 11.53 7.52
-------------------------------------------------------
5.5 -13.25 1.55 5.89 10.22 8.67 Bonifay Depressional 6 -15.67 2.14 5.73 9.33 7.19
6.5 -16.00 2.97 6.64 10.30 7.32
-------------------------------------------------------
5.5 -8.69 5.44 11.75 18.07 12.63 Norfolk Depressional 6 -5.82 2.41 11.23 20.05 17.64
6.5 -8.33 10.86 16.61 22.35 11.49
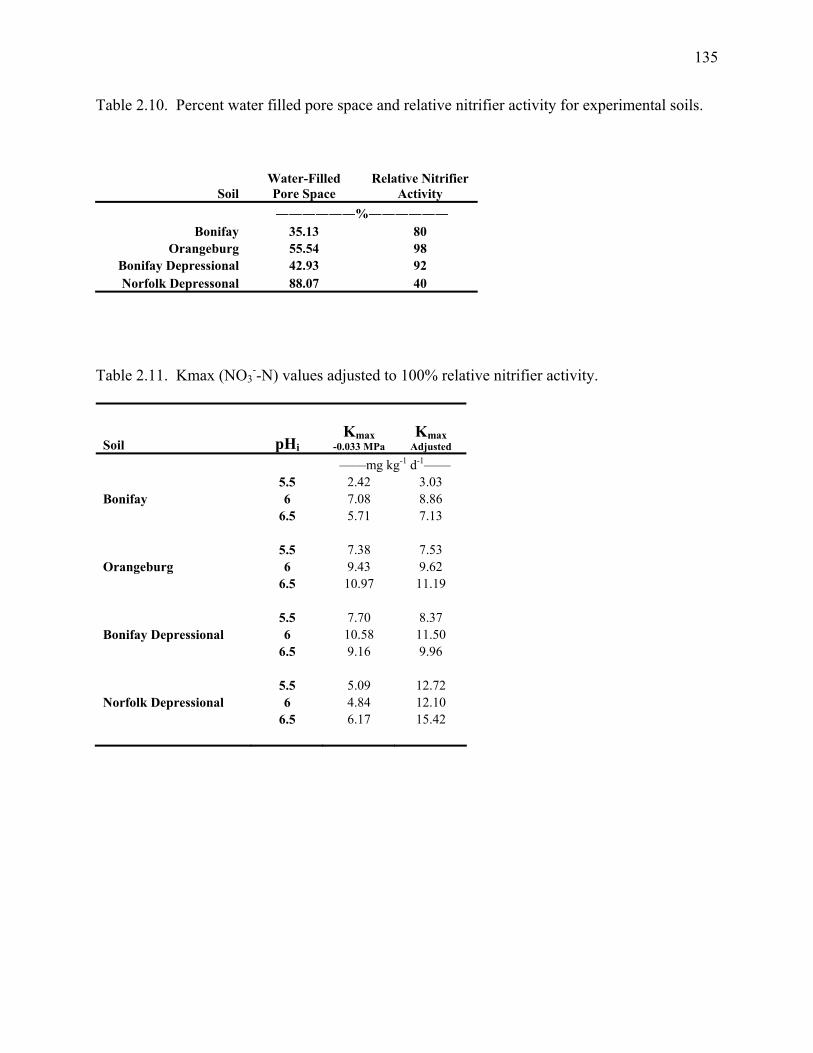
135
Table 2.10. Percent water filled pore space and relative nitrifier activity for experimental soils.
Soil Water-Filled Pore Space
Relative Nitrifier Activity
――――――%―――――― Bonifay 35.13 80
Orangeburg 55.54 98 Bonifay Depressional 42.93 92 Norfolk Depressonal 88.07 40
Table 2.11. Kmax (NO3
--N) values adjusted to 100% relative nitrifier activity.
Soil pHi Kmax
-0.033 MPa Kmax
Adjusted ——mg kg-1 d-1—— 5.5 2.42 3.03 Bonifay 6 7.08 8.86 6.5 5.71 7.13 5.5 7.38 7.53 Orangeburg 6 9.43 9.62 6.5 10.97 11.19 5.5 7.70 8.37 Bonifay Depressional 6 10.58 11.50 6.5 9.16 9.96 5.5 5.09 12.72 Norfolk Depressional 6 4.84 12.10 6.5 6.17 15.42
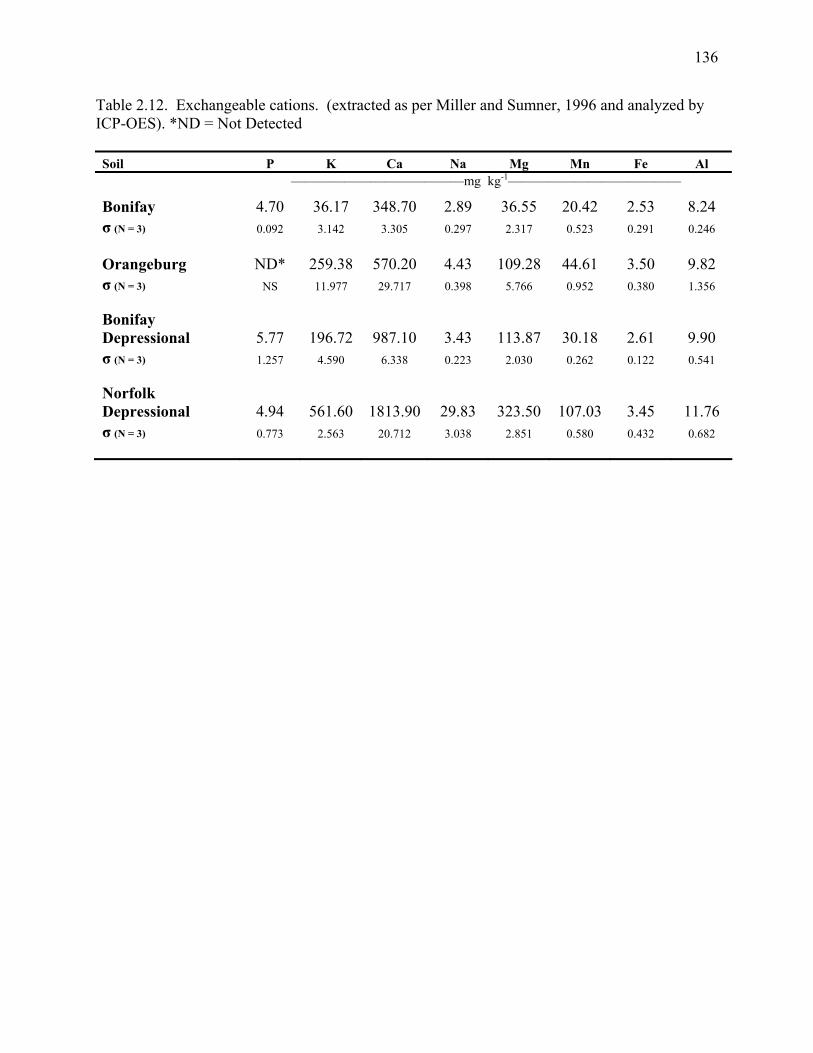
136
Table 2.12. Exchangeable cations. (extracted as per Miller and Sumner, 1996 and analyzed by ICP-OES). *ND = Not Detected Soil P K Ca Na Mg Mn Fe Al
—————————————mg kg-1—————————————
Bonifay 4.70 36.17 348.70 2.89 36.55 20.42 2.53 8.24 σ (N = 3) 0.092 3.142 3.305 0.297 2.317 0.523 0.291 0.246 Orangeburg ND* 259.38 570.20 4.43 109.28 44.61 3.50 9.82 σ (N = 3) NS 11.977 29.717 0.398 5.766 0.952 0.380 1.356 Bonifay Depressional 5.77 196.72 987.10 3.43 113.87 30.18 2.61 9.90 σ (N = 3) 1.257 4.590 6.338 0.223 2.030 0.262 0.122 0.541 Norfolk Depressional 4.94 561.60 1813.90 29.83 323.50 107.03 3.45 11.76 σ (N = 3) 0.773 2.563 20.712 3.038 2.851 0.580 0.432 0.682

137
Table 2.13. Model parameters from regression analysis of response nitrification rate parameters to soil factors. (NS – Not Significant; p > 0.1)
Soil Nitrification Factor
Nitrification Parameter Intercept
Initial pH Sand Clay
Cation Exchange Capacity
Organic Matter
Clay *
Organic Matter
CEC *
Organic Matter R-Square
t' 16.49112 NS NS NS -8.65933 NS NS 0.0003372 0.8450
p > 0.0001 p > 0.0005 p > 0.0005
Kmax (-0.033 MPa) -20.42642 4.22379 NS NS 2.76933 NS -0.0000235 NS 0.7638 p > 0.1 p > 0.05 p > 0.05 p > 0.01
Kmax adjusted -23.33375 5.08317 NS NS 0.98353 NS NS NS 0.8084 p > 0.05 p > 0.05 p > 0.001
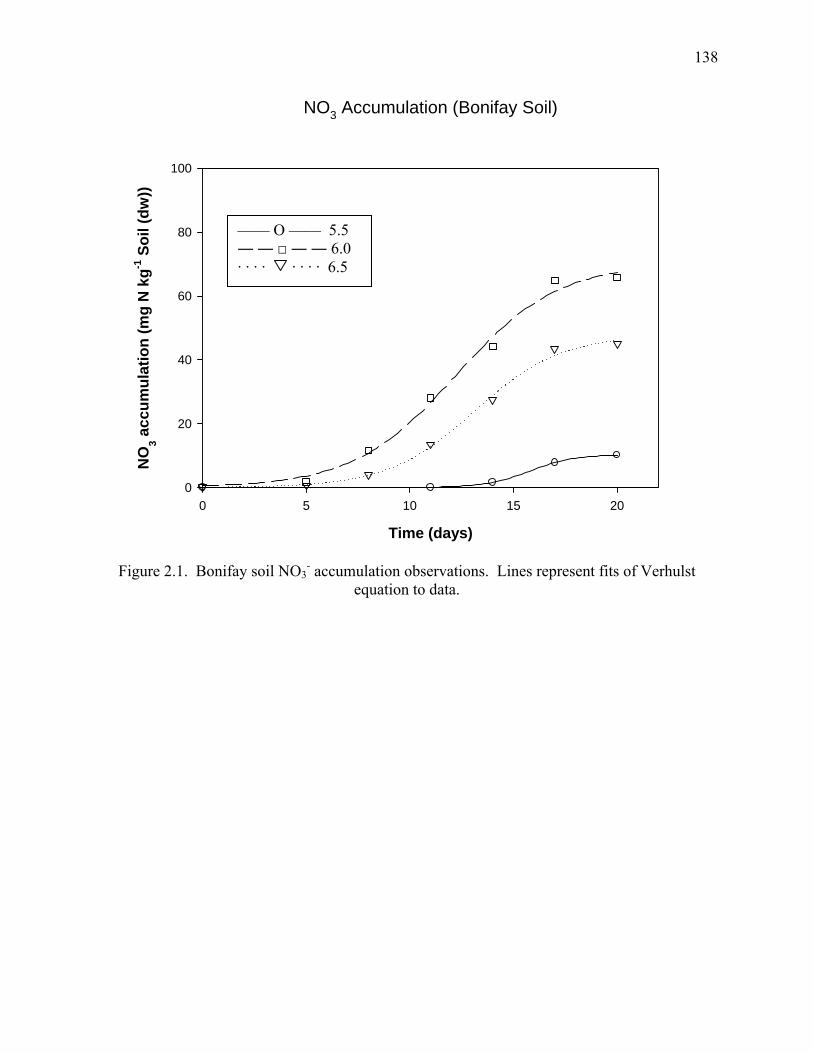
138
NO3 Accumulation (Bonifay Soil)
Time (days)
0 5 10 15 20
NO
3 acc
umul
atio
n (m
g N
kg-1
Soi
l (dw
))
0
20
40
60
80
100
Figure 2.1. Bonifay soil NO3- accumulation observations. Lines represent fits of Verhulst
equation to data.
—— Ο —— 5.5 ― ― □ ― ― 6.0 · · · · · · · · 6.5
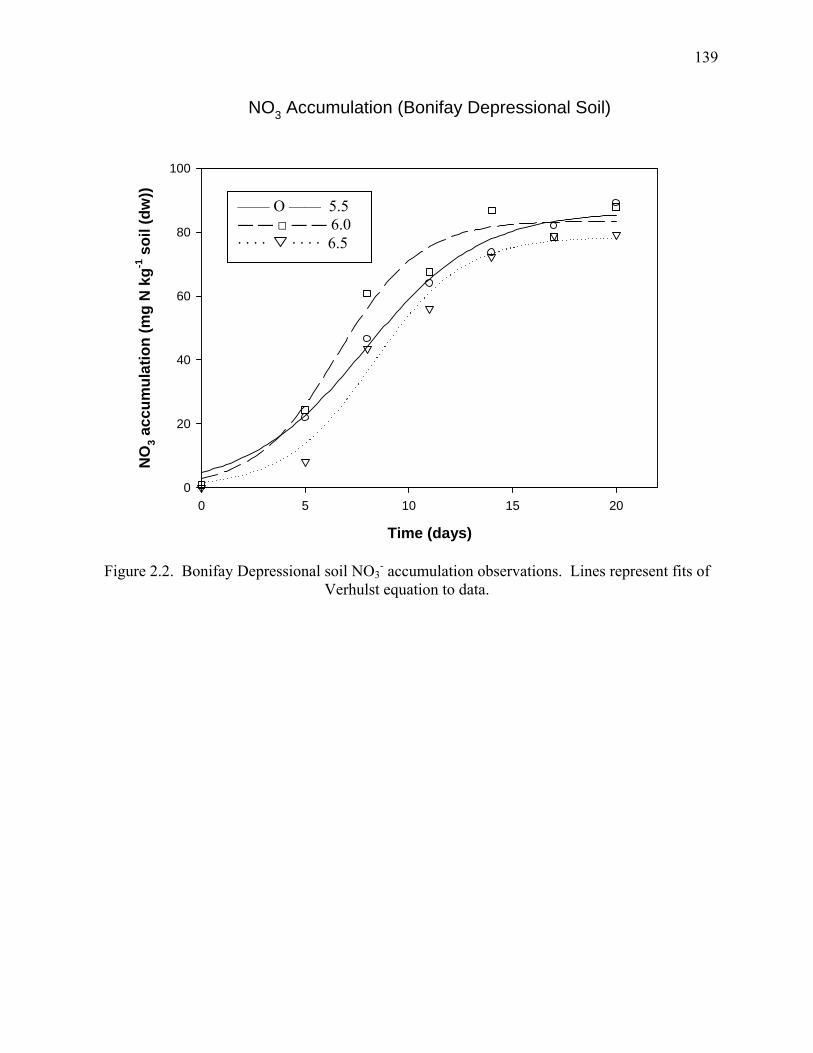
139
NO3 Accumulation (Bonifay Depressional Soil)
Time (days)
0 5 10 15 20
NO
3 acc
umul
atio
n (m
g N
kg-1
soi
l (dw
))
0
20
40
60
80
100
Figure 2.2. Bonifay Depressional soil NO3- accumulation observations. Lines represent fits of
Verhulst equation to data.
—— Ο —— 5.5 ― ― □ ― ― 6.0 · · · · · · · · 6.5
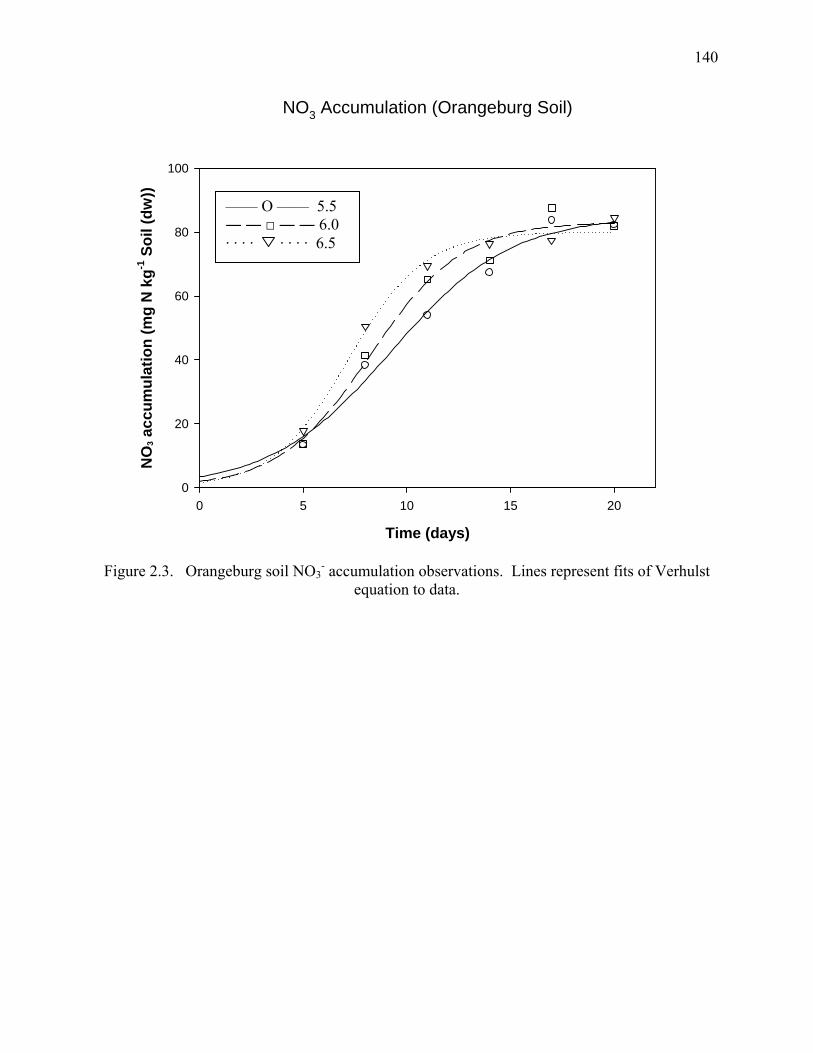
140
NO3 Accumulation (Orangeburg Soil)
Time (days)
0 5 10 15 20
NO
3 acc
umul
atio
n (m
g N
kg-1
Soi
l (dw
))
0
20
40
60
80
100
Figure 2.3. Orangeburg soil NO3- accumulation observations. Lines represent fits of Verhulst
equation to data.
—— Ο —— 5.5 ― ― □ ― ― 6.0 · · · · · · · · 6.5

141
NO3 Accumulation (Norfolk Depressional Soil)
Time (days)
0 5 10 15 20
NO
3 acc
umul
atio
n (m
g N
kg-1
Soi
l (dw
))
0
20
40
60
80
100
Figure 2.4. Norfolk Depressional soil NO3- accumulation observations. Lines represent fits of
Verhulst equation to data.
—— Ο —— 5.5 ― ― □ ― ― 6.0 · · · · · · · · 6.5

142
NH3 Consumption (Bonifay Soil)
Time (days)
0 5 10 15 20
NH
3 C
onsu
mpt
ion
(mg
NH
4-N
kg-1
Soi
l (dw
))
0
20
40
60
80
100
Figure 2.5. Bonifay soil NH3 consumption observations. Lines represent fits of Verhulst equation to data.
—— Ο —— 5.5 ― ― □ ― ― 6.0 · · · · · · · · 6.5
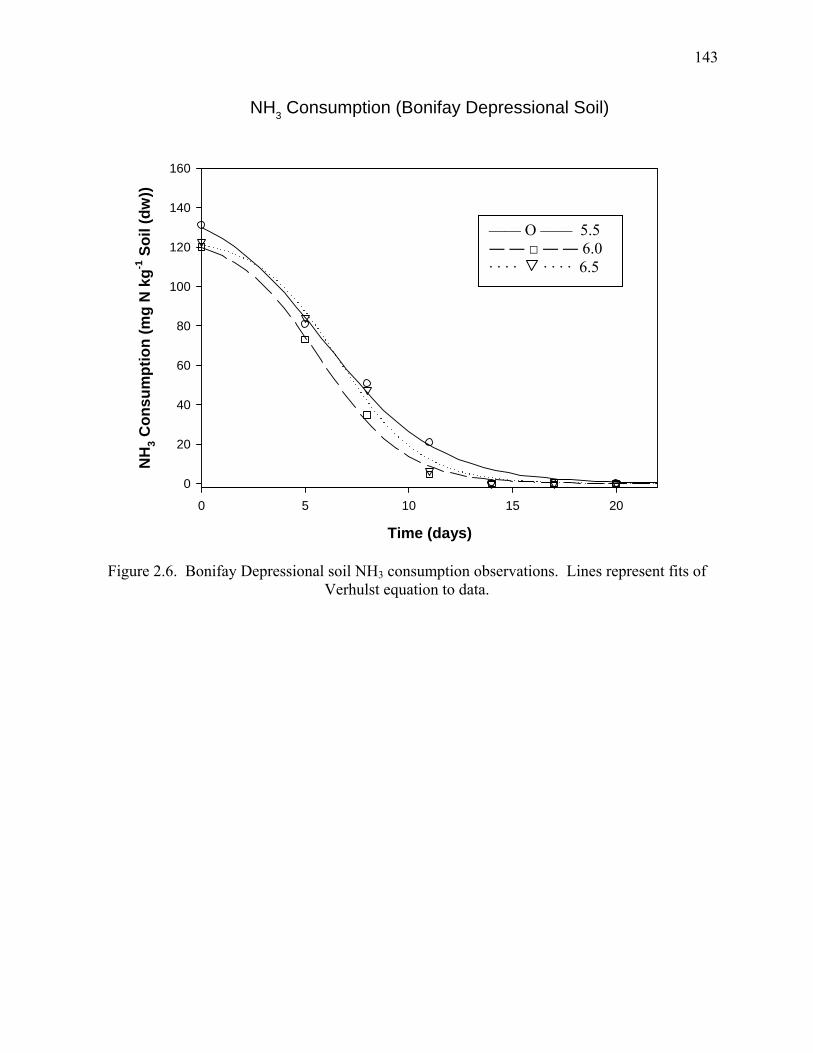
143
NH3 Consumption (Bonifay Depressional Soil)
Time (days)
0 5 10 15 20
NH
3 Con
sum
ptio
n (m
g N
kg-1
Soi
l (dw
))
0
20
40
60
80
100
120
140
160
Figure 2.6. Bonifay Depressional soil NH3 consumption observations. Lines represent fits of Verhulst equation to data.
—— Ο —— 5.5 ― ― □ ― ― 6.0 · · · · · · · · 6.5

144
NH3 Consumption (Orangeburg Soil)
Time (days)
0 5 10 15 20
NH
3 Con
sum
ptio
n (m
g N
kg-1
Soi
l (dw
))
0
20
40
60
80
100
Figure 2.7. Orangeburg soil NH3 consumption observations. Lines represent fits of Verhulst equation to data.
—— Ο —— 5.5 ― ― □ ― ― 6.0 · · · · · · · · 6.5
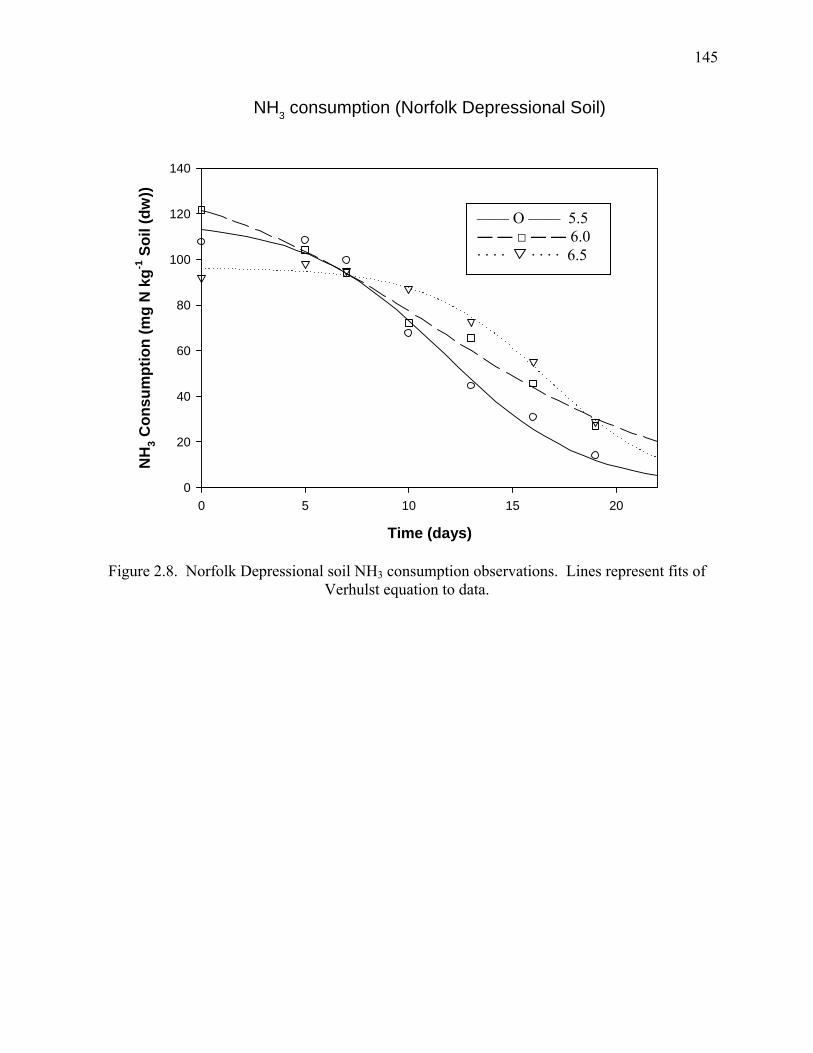
145
NH3 consumption (Norfolk Depressional Soil)
Time (days)
0 5 10 15 20
NH
3 Con
sum
ptio
n (m
g N
kg-1
Soi
l (dw
))
0
20
40
60
80
100
120
140
Figure 2.8. Norfolk Depressional soil NH3 consumption observations. Lines represent fits of Verhulst equation to data.
—— Ο —— 5.5 ― ― □ ― ― 6.0 · · · · · · · · 6.5
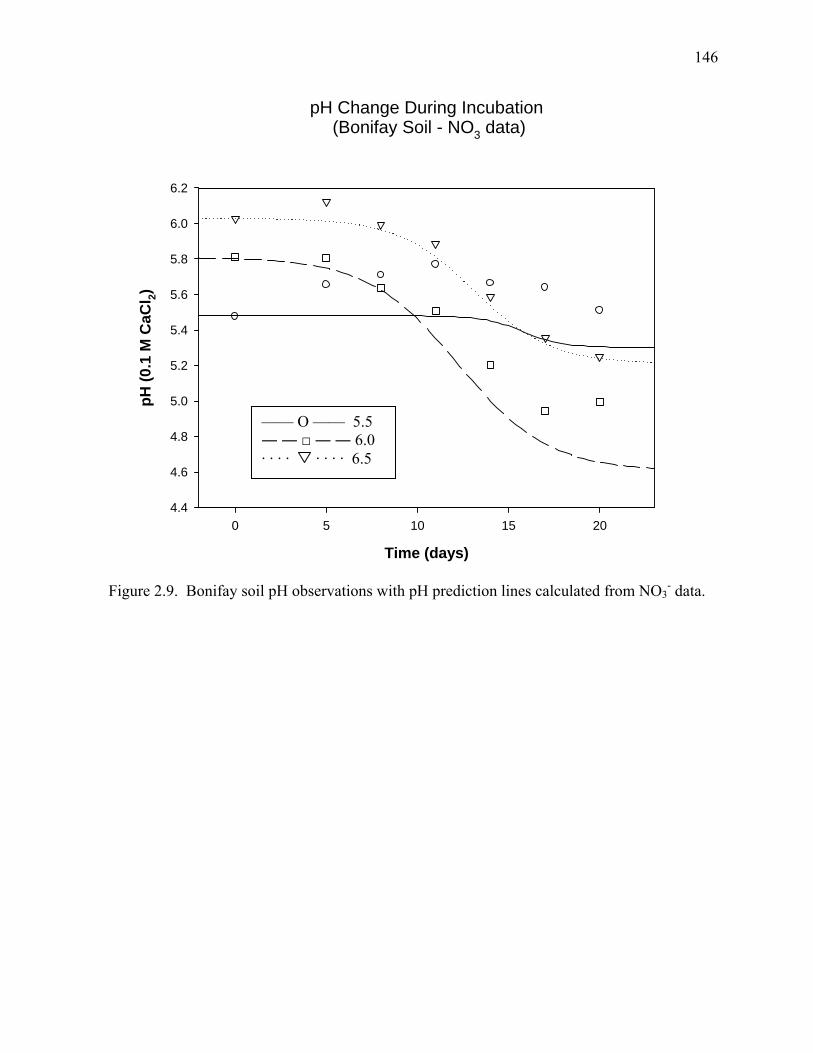
146
pH Change During Incubation (Bonifay Soil - NO3 data)
Time (days)
0 5 10 15 20
pH (0
.1 M
CaC
l 2)
4.4
4.6
4.8
5.0
5.2
5.4
5.6
5.8
6.0
6.2
Figure 2.9. Bonifay soil pH observations with pH prediction lines calculated from NO3- data.
—— Ο —— 5.5 ― ― □ ― ― 6.0 · · · · · · · · 6.5

147
pH Change During Incubation (Bonifay Soil - NH3 data)
Time (days)
0 5 10 15 20
pH (0
.1 M
CaC
l 2)
2.5
3.0
3.5
4.0
4.5
5.0
5.5
6.0
6.5
Figure 2.10. Bonifay soil pH observations with pH prediction lines based on NH3 data.
—— Ο —— 5.5 ― ― □ ― ― 6.0 · · · · · · · · 6.5
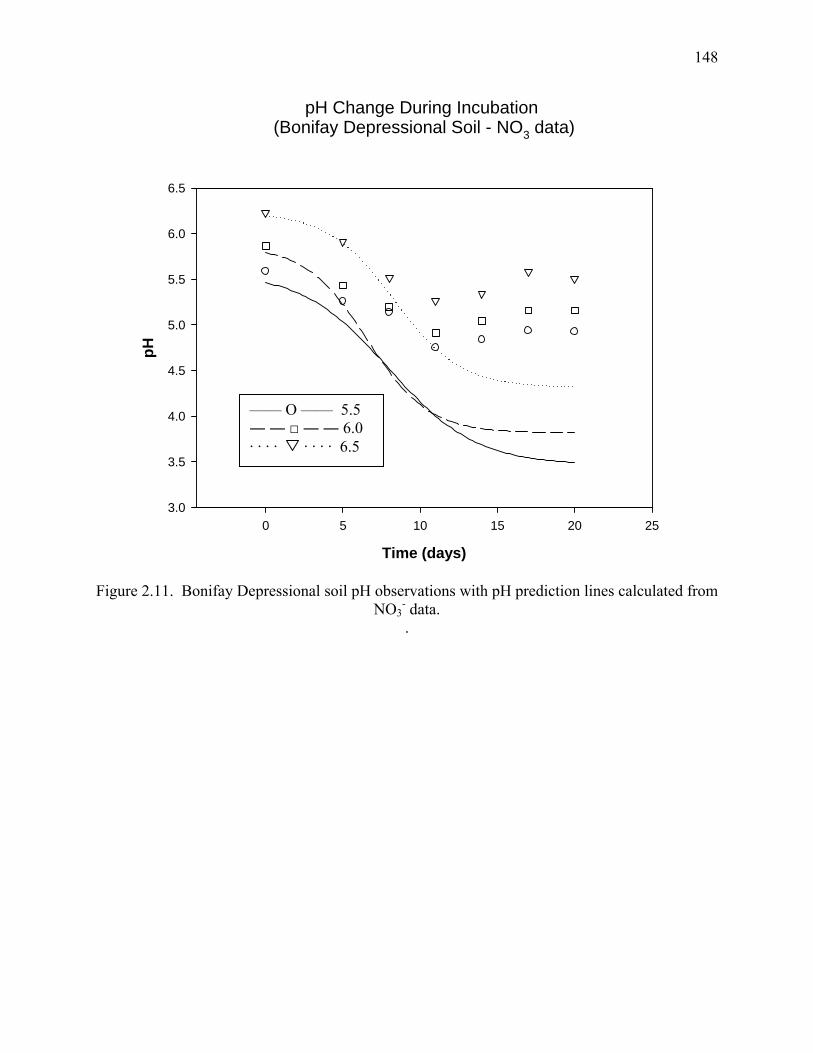
148
pH Change During Incubation (Bonifay Depressional Soil - NO3 data)
Time (days)
0 5 10 15 20 25
pH
3.0
3.5
4.0
4.5
5.0
5.5
6.0
6.5
Figure 2.11. Bonifay Depressional soil pH observations with pH prediction lines calculated from NO3
- data. .
—— Ο —— 5.5 ― ― □ ― ― 6.0 · · · · · · · · 6.5
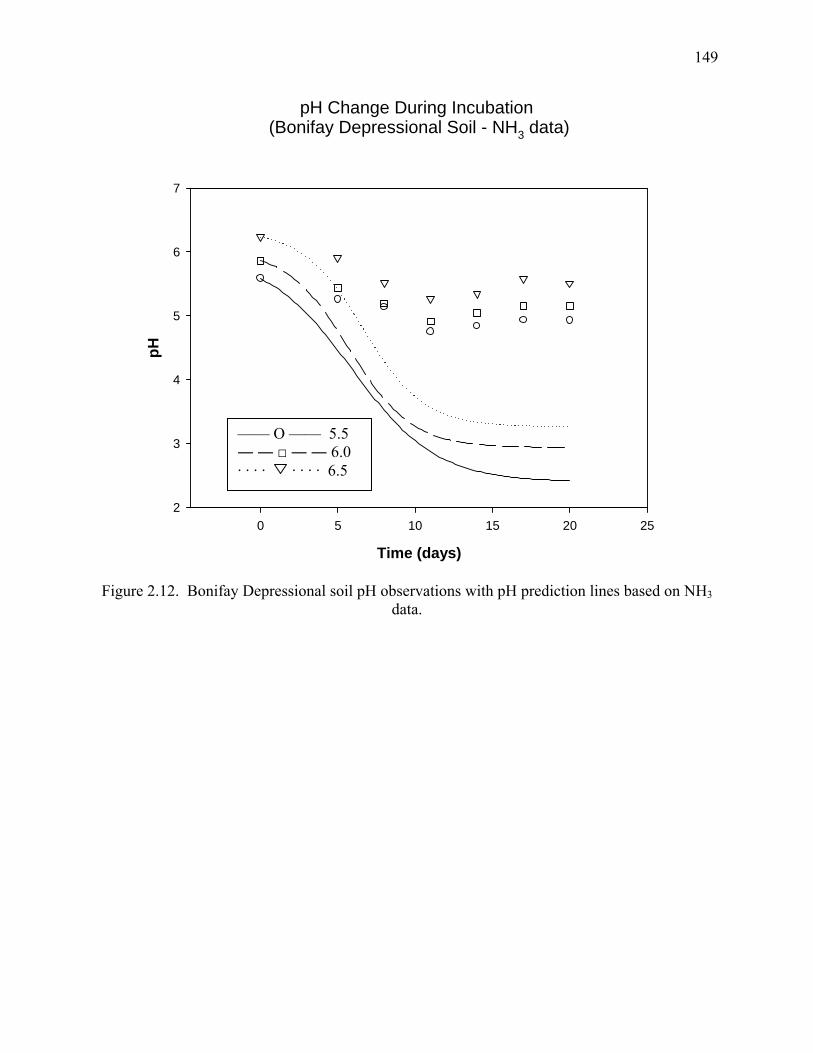
149
pH Change During Incubation (Bonifay Depressional Soil - NH3 data)
Time (days)
0 5 10 15 20 25
pH
2
3
4
5
6
7
Figure 2.12. Bonifay Depressional soil pH observations with pH prediction lines based on NH3 data.
—— Ο —— 5.5 ― ― □ ― ― 6.0 · · · · · · · · 6.5
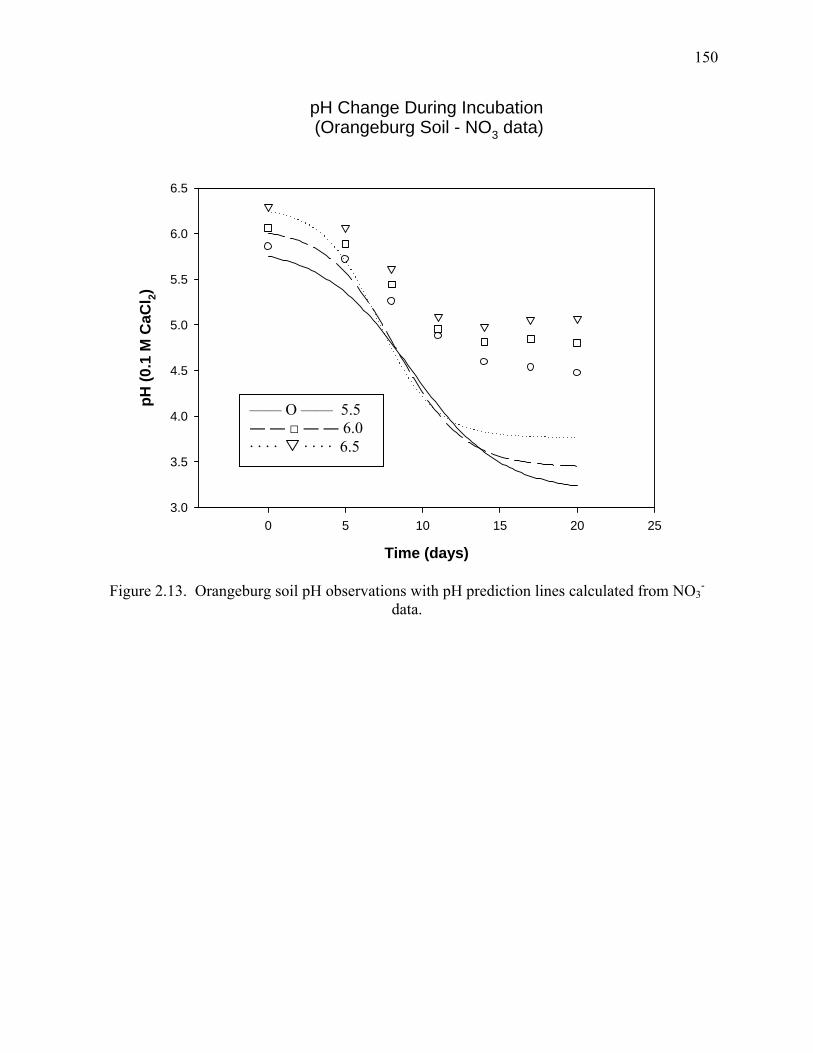
150
pH Change During Incubation (Orangeburg Soil - NO3 data)
Time (days)
0 5 10 15 20 25
pH (0
.1 M
CaC
l 2)
3.0
3.5
4.0
4.5
5.0
5.5
6.0
6.5
Figure 2.13. Orangeburg soil pH observations with pH prediction lines calculated from NO3-
data.
—— Ο —— 5.5 ― ― □ ― ― 6.0 · · · · · · · · 6.5
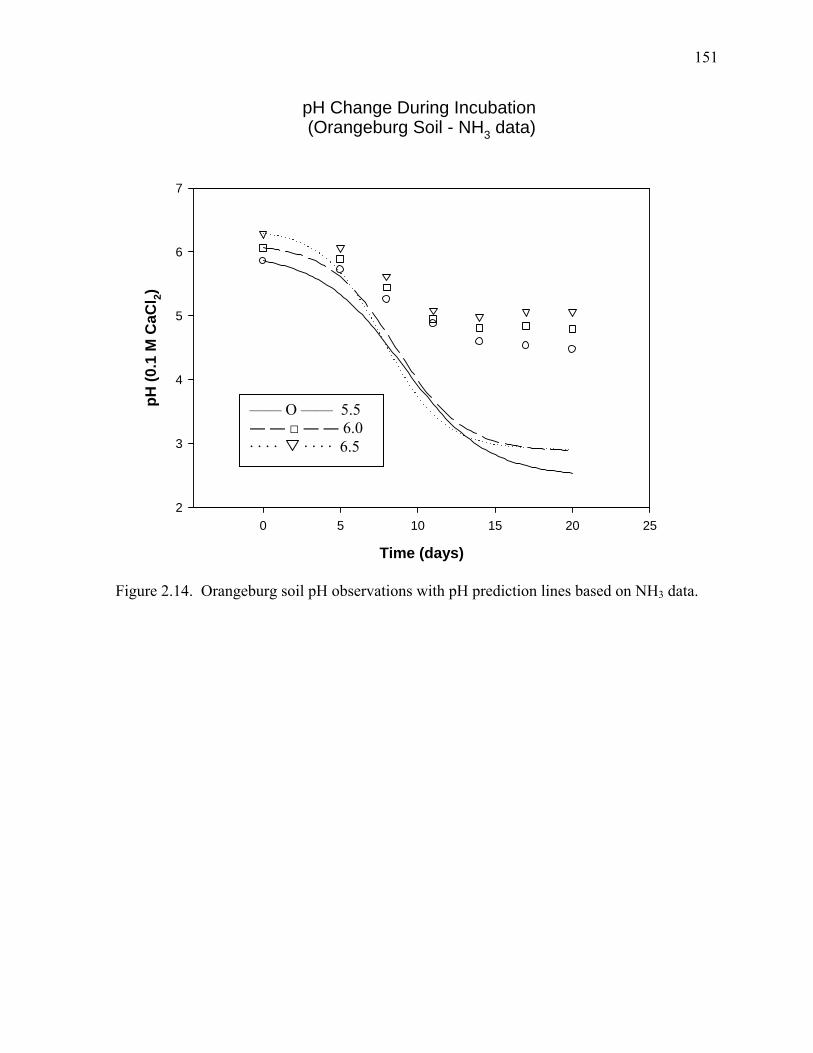
151
pH Change During Incubation (Orangeburg Soil - NH3 data)
Time (days)
0 5 10 15 20 25
pH (0
.1 M
CaC
l 2)
2
3
4
5
6
7
Figure 2.14. Orangeburg soil pH observations with pH prediction lines based on NH3 data.
—— Ο —— 5.5 ― ― □ ― ― 6.0 · · · · · · · · 6.5
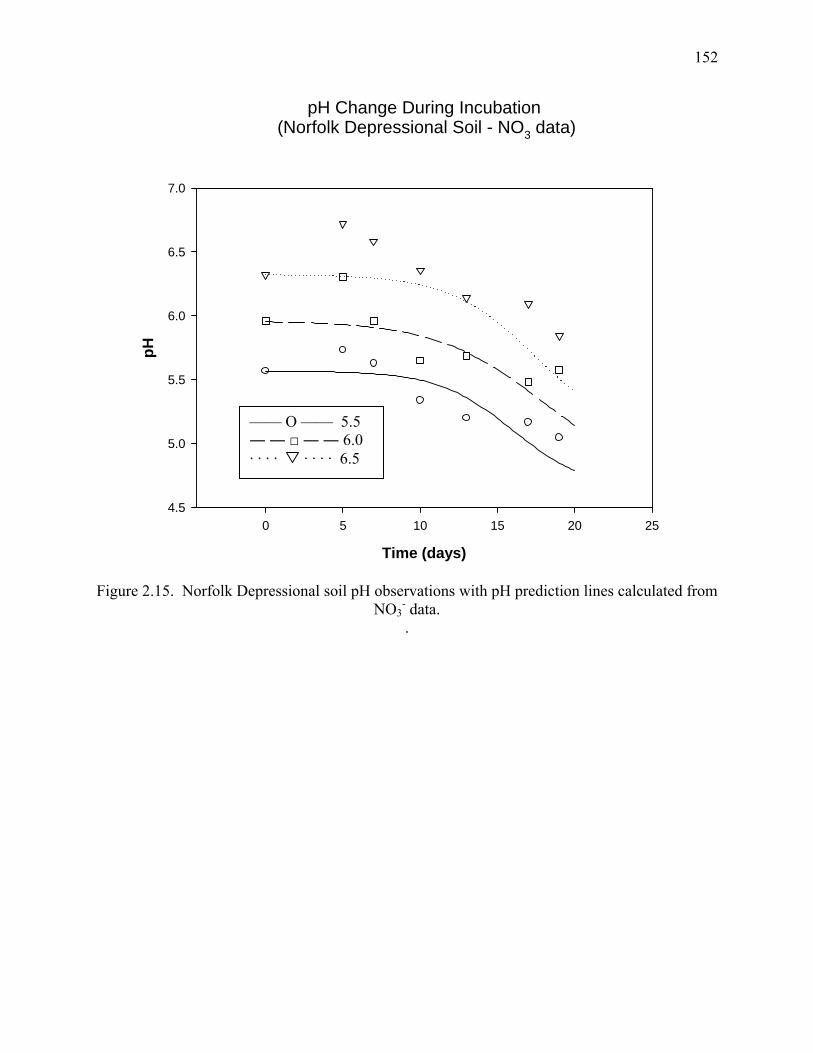
152
pH Change During Incubation (Norfolk Depressional Soil - NO3 data)
Time (days)
0 5 10 15 20 25
pH
4.5
5.0
5.5
6.0
6.5
7.0
Figure 2.15. Norfolk Depressional soil pH observations with pH prediction lines calculated from NO3
- data. .
—— Ο —— 5.5 ― ― □ ― ― 6.0 · · · · · · · · 6.5
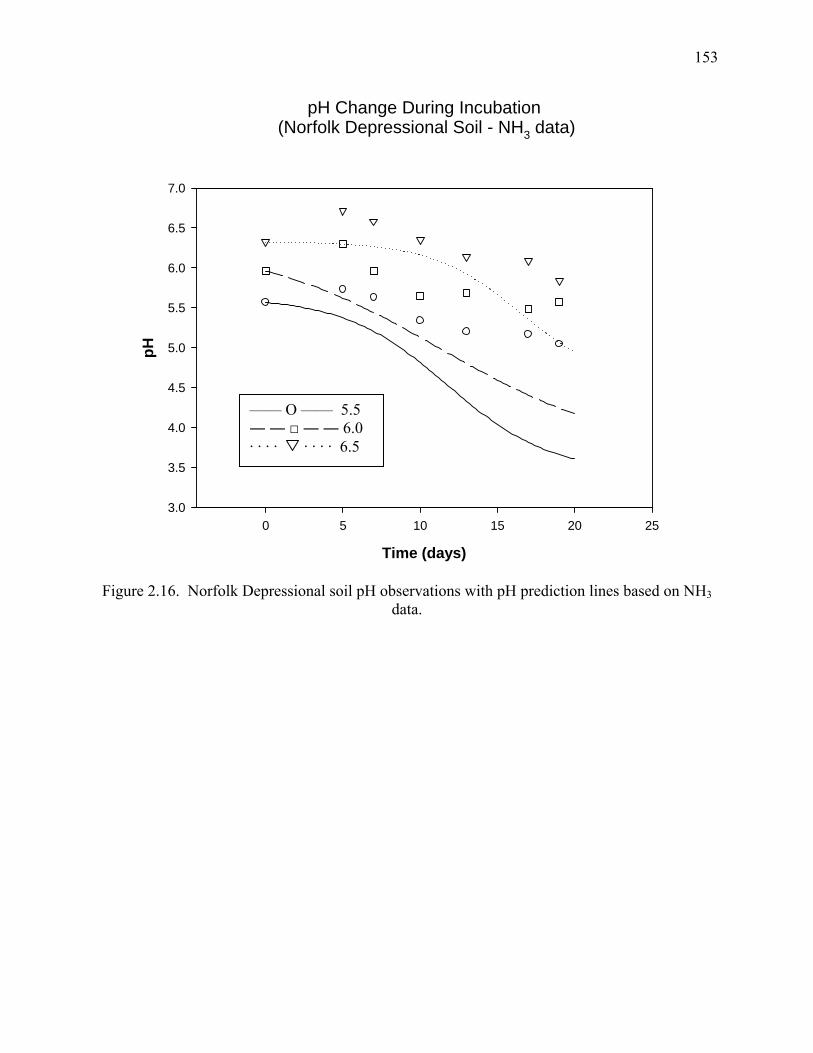
153
pH Change During Incubation (Norfolk Depressional Soil - NH3 data)
Time (days)
0 5 10 15 20 25
pH
3.0
3.5
4.0
4.5
5.0
5.5
6.0
6.5
7.0
Figure 2.16. Norfolk Depressional soil pH observations with pH prediction lines based on NH3 data.
—— Ο —— 5.5 ― ― □ ― ― 6.0 · · · · · · · · 6.5

154
References Adams, F., and P.J. Hathcock. 1984. Aluminum toxicity and calcium deficiency in acid subsoil
horizons of two coastal plains soil series. Soil Sci. Soc. Am. J. 48:1305-1309.
Albrecht, W.A., and T.M. McCalla. 1937. Nitrification of ammonia adsorbed on colloidal clay. Soil Sci. Soc. Am. Proc.
Allison, S.M., and J.I. Prosser. 1993. Ammonia oxidation at low pH by attached populations of nitrifying bacteria. Soil Biol. Biochem. 25:935-941.
Anthonisen, A.C., R.C. Loehr, T.G.S. Prakasam, and E.G. Srinath. 1976. Inhibition of nitrification by ammonia and nitrous acid. 48:835-851.
Avrahami, S., and R. Conrad. 2003. Patterns of community change among ammonia oxidizers in meadow soils upon long-term incubation at different temperatures. App. Environ. Microbiol. 69:6152-6164.
Bouman, O.T., D. Curtin, C.A. Campbell, V.O. Biederbeck, and H. Ukrainetz. 1995. Soil acidification from long-term use of anhydrous ammonia and urea. Soil Sci. Soc. Am. J. 59:1488-1494.
Bouyoucos, G.J. 1962. Hydrometer method improved for making particle size analysis of soils. Agron. J. 54:464-465.
Bremner, J.M. 1996. Nitrogen-Total. p. 1085-1121. In D.L. Sparks et al. (ed.) Methods of Soil Analysis, Part 3. Chemical methods. SSSA Book Ser. 5. SSSA and ASA, Madison, WI.
Bridge, T.A.M., D.B. Johnson. 1998. Reduction of soluble iron and reductive dissolution of ferric iron-containing minerals by moderately thermophilic iron-oxidizing bacteria. Appl. Environ. Microbiol. 64:2181-2186.
Chu, H., T .Fujii, S. Morimoto, X. Lin, and K. Yagi. 2008. Population size and specific nitrification potential of soil ammonia-oxidizing bacteria under long-term fertilizer management. Soil Biol. Biochem. 40:1960-1963.
Darrah, P.R., R.E. White, and P.H. Nye. 1989. Simultaneous nitrification and diffusion in soil. I. The effects of the addition of a low level of ammonium chloride. Journal of Soil Science 36:281-292.
Doran, J.W., L.N. Mielke, and J.F. Power. 1990. Microbial activity as regulated by soil water-filled pore space. In. Transactions, 14th International Congress of Soil Science, Kyoto, Japan. p. 94-99.
Eno, C.F., and W. G. Blue. 1957. The comparative rate of nitrification of anhydrous ammonia, urea, and ammonium sulfate in sandy soils. Soil Sci. Soc. Am. Proc. 21:392-396.
155
Grundmann, G.L., P. Renault, L. Rosso, and R. Bardin. 1995. Differential effects of soil water content and temperature on nitrification and aeration. Soil Sci. Soc. Am. J., 59:1342-1349.
Hadas, A., S. Feigenbaum, A. Feigen, and R. Portnoy. 1986. Nitrification rates in profiles of differently managed soil types. Soil Sci. Soc. Am. J. 50:633-639.
Hayatsu, M., K. Tago, and M. Saito. 2008. Various players in the nitrogen cycle: Diversity and functions of the microorganisms involved in nitrification and denitrification. Soil Science and Plant Nutrition. 54:33-45.
Helyar, K.R., and W.M. Porter. 1989. Soil acidification, its measurement and the processes involved, In Soil Acidity and Plant Growth (Robson, A.D., ed.) Academic Press, Sydney. pp. 61-101.
Introduction to SAS. UCLA: Academic Technology Services, Statistical Consulting Group. from http://www.ats.ucla.edu/stat/sas/library/SASNLin_os (accessed February 12, 2009).
Islam, A., R.E.White, and D. Chen. 2006. Nitrification activity in acid soils of North-Eastern Victoria, Australia, as affected by liming and phosphorus fertilization. Australian Journal of Soil Research 44:739-744.
Johnson, D.B., and S. McGinness. 1991. Ferric iron reduction by acidophilic heterotrophic bacteria. Appl. Environ. Microbiol 57:207-211.
Justice, J.K., and R.L. Smith. 1962. Nitrification of ammonium sulfate in a calcareous soil as influenced by combinations of moisture, temperature, and levels of added nitrogen. Soil Sci. Soc. Proc. 26:246-250.
Kyverga, P.M., A.M. Blackmer, J.W. Ellsworth, and R. Isla. 2004. Soil pH effects on nitrification of fall-applied anhydrous ammonia. Soil Sci. Soc. Am. J. 68:545-551.
Laubscher, K.J., J.M. Van Zyl, and C.C. du Preez. 1990. Equations to calculate the approximate duration and termination of the maximal rate phase of nitrification in soil. Commun. Soil Sci. Plant Anal., 21:611-621.
Lees, H., and J.H. Quastel. 1946. Biochemistry of nitrification in soil. II. The site of soil nitrification Biochem. J. 40:815-823.
Leininger, S., T. Urich, M. Schloter, L. Schwark, J. Qi, G.W. Nicol, J.I. Prosser, S.C. Schuster, and C. Schleper. 2006. Archaea predominate among ammonia-oxidizing prokaryotes in soils. Nature, 442:806-809.
Linn, D.M. and Doran, J.W., 1984. Effect of water filled pore space on carbon dioxide and nitrous oxide production in tilled and nontilled soils. Soil Sci. Soc. Am. J. 48:1267–1272.
Low A.P., J.M. Stark, and L.M. Dudley. 1997. Effects of soil osmotic potential on nitrification, ammonification, N-assimilation and nitrous oxide production. Soil Science 162:16-27.
156
Malhi, S.S., and W.B. McGill. 1982. Nitrification in three Alberta soils: Effect of temperature, moisture and substrate concentration. Soil Biol. Biochem. 14:393-399.
McBride, M. 1994. Environmental chemistry of soils. Oxford University Press. N.Y., New York.
Morrill, L.G., and J.E. Dawson. 1967. Patterns observed for the oxidation of ammonium to nitrate by soil organisms. Soil Sci. Soc. Amer. Proc. 31:757-760.
Nelson, D.W., and L.E. Sommers. 1996. Total carbon, organic carbon, and organic matter. p. 961-1010. In D.L. Sparks et al. (ed.) Methods of Soil Analysis, Part 3. Chemical methods. SSSA Book Ser. 5. SSSA and ASA, Madison, WI.
Page, K.L., R.C. Dalal, N.W. Menzies, and W.M. Strong. 2002. Nitrification in a vertisol subsoil and its relationship to the accumulation of ammonium-nitrogen at depth. Aust. J. Soil Res. 40:727-735.
Puri, G., and M.R. Ashman. 1999. Microbial immobilization of 15N-labelled ammonium and nitrate in a temperate woodland soil. Soil Biology and Biochemistry 31:929-931.
Rice, C.W., and M.S. Smith. 1983. Nitrification of fertilizer and mineralized ammonium in no-till and plowed soil. Soil Sci. Soc. Am. J. 47:1125-1129.
Russell, C.A., I.R.P. Fillery, N. Bootsma, and K.J. McInnes. 2002. Effect of temperature and nitrogen source on nitrification in a sandy soil. Commun. Soil Sci. Plant Anal. 33:1975-1989.
Rutherford, P.M., and N.G. Juma. 1992. Influence of texture on habitable pore space and bacterial-protozoan populations in soil. Biol. Fertil. Soils 12:221-227.
Sabey, B.R., L.R. Frederick, and W.V. Bartholomew. 1959. The formation of nitrate from ammonium nitrogen in soils: III. Influence of temperature and initial population of nitrifying organisms on the maximum rate and delay period. Soil Sci. Soc. Am. Proc. 23:462-465.
Sabey, B.R., L.R. Frederick, and W.V. Bartholomew. 1969. The formation of nitrate from ammonium nitrogen in soils: IV. Use of the delay and maximum rate phases form making quantitative predictions. Soil Sci. Soc. Am. Proc. 33:276-278.
Shi, W., and J.M. Norton. 2000. Microbial control of nitrate concentrations in an agricultural soil treated with dairy waste compost or ammonium fertilizer. Soil Biology and Biochemistry 32:1453-1457.
Smith, J.H. 1964. Relationships between soil cation-exchange capacity and the toxicity of ammonia to the nitrification process. Soil Sci. Soc. Am. Proc. 28:640-644.
Stark, J.M., and M.K. Firestone. 1995. Mechanisms for soil moisture effects on activity of nitrifying bacteria. Applied and environmental microbiology. 61:218-221.
157
Strong, D.T., P.W.G. Sale, and K.R. Helyar. 1999. The influence of the soil matrix on nitrogen mineralization and nitrification. IV. Texture. Aust. J. Soil Res., 37:329-344.
Sumner, M.E., and W.P. Miller. 1996. Cation exchange capacity and exchange coefficients. p. 1201-1229. In D.L. Sparks et al. (ed.) Methods of Soil Analysis, Part 3. Chemical methods. SSSA Book Ser. 5. SSSA and ASA, Madison, WI.
Thompson, J. S. 2008. Master’s Thesis, University of Georgia.
Underhill, S.E., and J.I. Prosser. 1987. Surface attachment of nitrifying bacteria and their inhibition by potassium ethyl xanthate. Microb. Ecol. 14:129-139.
Weier, K.L., and J.W. Gilliam. 1986. Effect of acidity on nitrogen mineralization and nitrification in Atlantic Coastal Plain soils. Soil Sci. Soc. Amer. J. 50:1210-1214.
158
CONCLUSIONS AND IMPLICATIONS
The results of this study show that nitrification rates in the sandy soils of the Southeastern
Atlantic Coastal Plain are among the slowest reported in the existing literature. Slow
nitrification rates allow ammonium nitrogen to persist in the soil for longer periods of time,
increasing the potential for its downward transport via mass flow into lower soil horizons. The
presence of ammonium nitrogen in lower horizons will change the balance of anion:cation
uptake by plants and promote subsoil acidification through the release of protons by plant roots
in an effort to maintain the plant’s electrochemical balance.
Nitrification rates in these soils were shown to be strongly affected by soil water content
and the results of this study confirm the appropriateness of expressing soil water as percent
water-filled pore space (%WFP) over soil water potential (ψ). This study also strengthened the
existing evidence that soil cation exchange capacity (CEC) is mechanistically related to nitrifier
activity. It is proposed that soil CEC serves both as a source of substrate in the ionized form for
uptake by ammonium oxidizers and as a location for organism attachment and aggregation.
Increases in soil clay and organic matter content are positively associated with soil water content
and CEC. Nitrification rates were not affected by pH difference in the 5.5 to 6.5 range in soils
where the water content was near or above the optimum %WFP and CEC was determined to be
1.75 cmol kg-1 or above.