nitrate treatment technologies for drinking water · nitrate treatment technologies for drinking...
TRANSCRIPT
3/11/2016
1
Nitrate Treatment Technologies for Drinking Water
Technology Update 2016 forCentral Coast Regional Water Quality Control Board
Eugene H. Leung, P.E.State Water Resources Control Board
Division of Drinking WaterMarch 2016
Presentation Goal• Highlight the latest treatment technologies
from around the state for nitrate treatment• Bring awareness to key issues that must be
addressed or considered in order to implement these technologies.
• How they differ from existing (traditional) treatment technologies already in the marketplace.
• Project status for these technologies.2
Page 1 of 17 Item 21 Presentation March 17-18, 2016
Handout
3/11/2016
2
Presentation Outline• Nitrate Maximum Contaminant Level
– Associated Health Risks– Compliance Determination for public water systems– Nitrate Treatment Options
• Optimized Ion Exchange Treatment• Biological Treatment
– Different Reactor Designs – Targeting Nitrate, Perchlorate, and more…– Performance Requirements– Demonstration / Full Scale Projects
• Point-of-Use as an interim solution3
Nitrate Maximum Contaminant Level
• Effective July 16, 2015, Nitrate is now reported as Nitrate as Nitrogen
• Nitrate MCL is 10. mg/L as N• Nitrite MCL is 1. mg/L as N• The change in reporting unit does not affect
the nitrate MCL and brings us inline with the rest of the country. 10. mg/L as N is substantially the same as 45 mg/L as NO3 (nitrate)
4
Page 2 of 17 Item 21 Presentation March 17-18, 2016
Handout
3/11/2016
3
Nitrate Maximum Contaminant Level (2)
• Acute Health Risk Contaminant = Significant Health Effects by even ingesting water over MCL for a short period of time (Tier 1 violation)
• Vulnerable populations are: infants below the age of six months & pregnant women
• DDW requires water systems providing treatment for nitrate must provide treated water that meet the drinking water standard at all times.
5
Typical Treatment Target• 80% of MCL as a starting point for treatment
target. • May be adjusted up with good record.• Treatment target can be achieved by blending
of treated water with by-pass flow or treating 100% of water.
• On-line nitrate analyzer has allowed water system to blend and treat more effectively.
• Analyzers require skilled technicians to maintain and is expensive. (~$16K)
6
Page 3 of 17 Item 21 Presentation March 17-18, 2016
Handout
3/11/2016
4
General Background on Ion Exchange • Proven technology • Used successfully for nitrate, arsenic, perchlorate• Different Resin Types
Technical Considerations• Performance (new vs. regenerated)• Nitrate peaking (non-nitrate selective resin)• Regeneration method • Treatment residual• Disinfection By-products (nitrosamines)
7
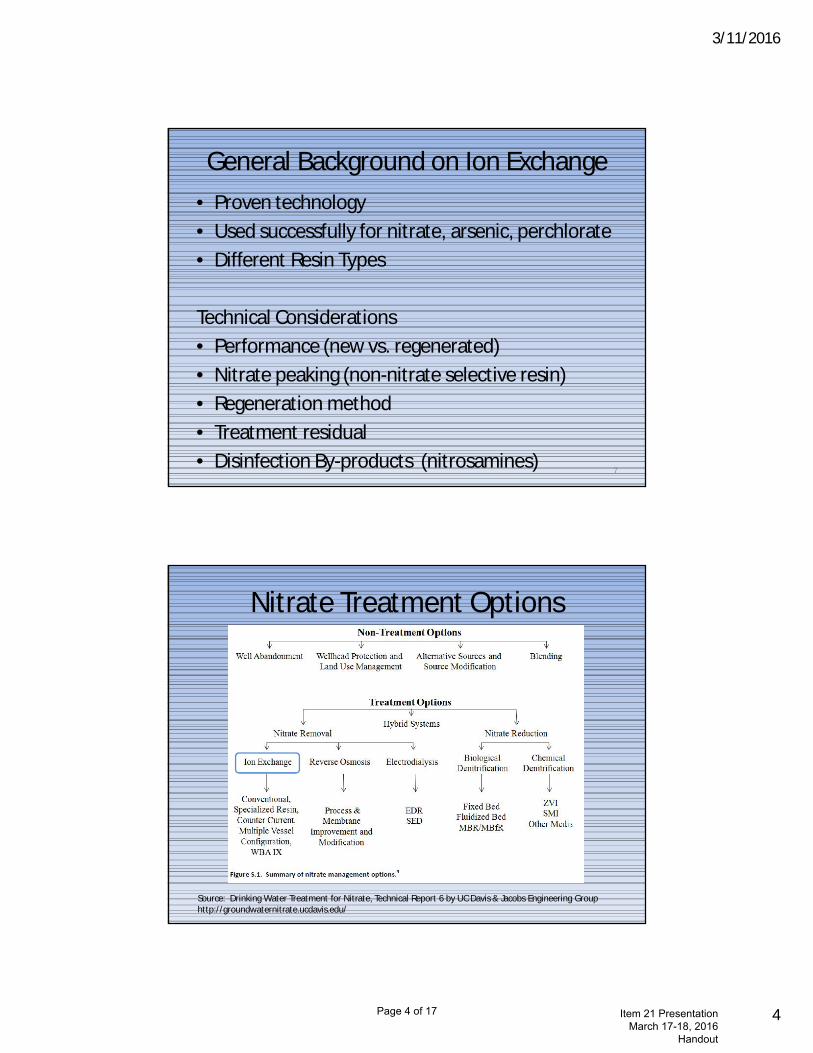
Nitrate Treatment Options
Source: Drinking Water Treatment for Nitrate, Technical Report 6 by UC Davis & Jacobs Engineering Grouphttp://groundwaternitrate.ucdavis.edu/
Page 4 of 17 Item 21 Presentation March 17-18, 2016
Handout
3/11/2016
5
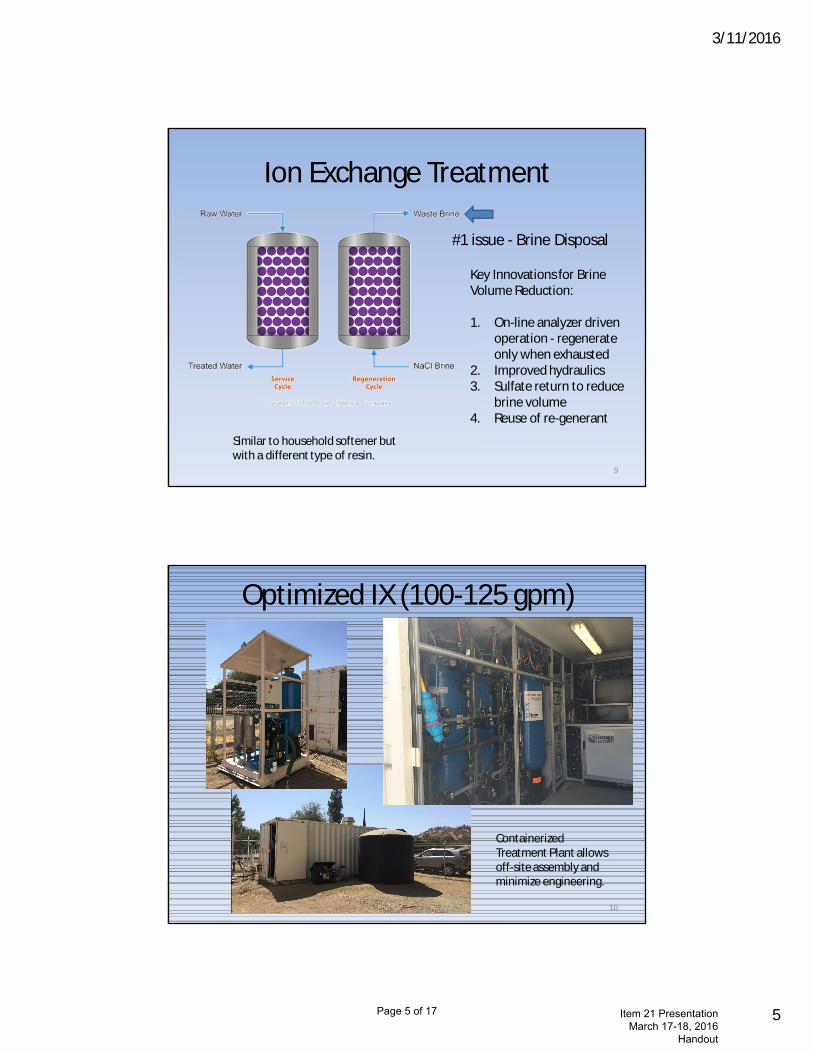
Ion Exchange Treatment
9
#1 issue - Brine Disposal
Key Innovations for Brine Volume Reduction:
1. On-line analyzer driven operation - regenerate only when exhausted
2. Improved hydraulics3. Sulfate return to reduce
brine volume4. Reuse of re-generant
Similar to household softener but with a different type of resin.
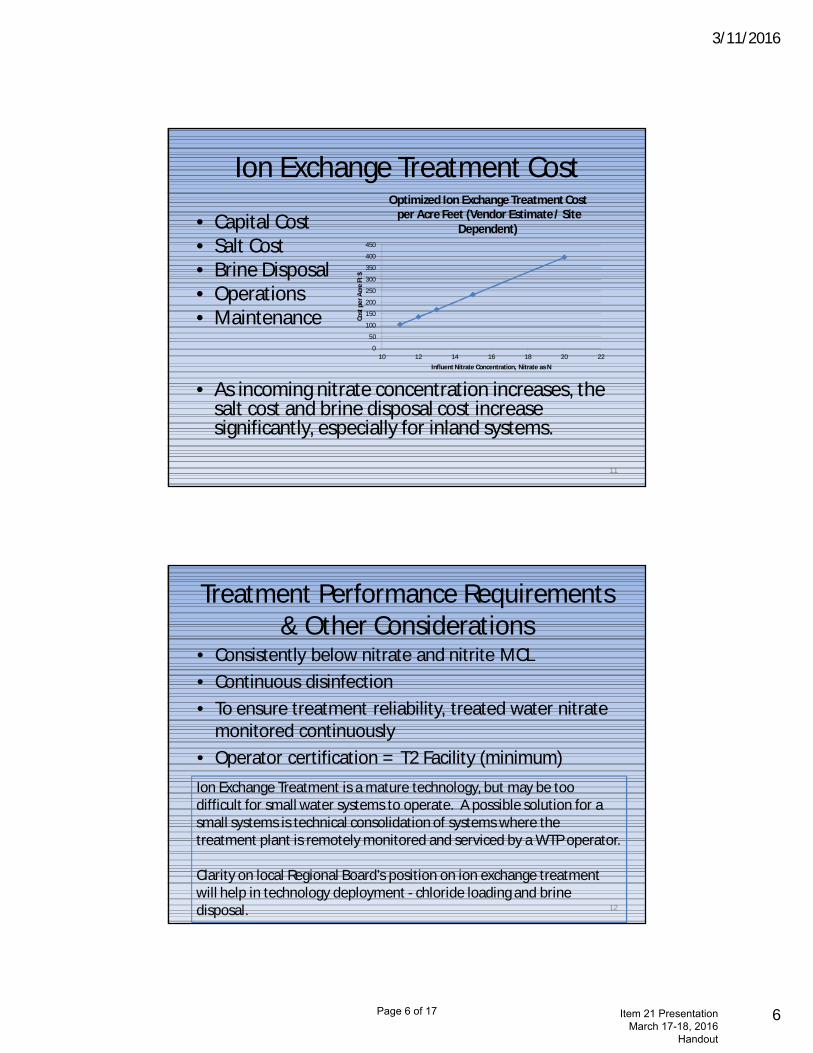
Optimized IX (100-125 gpm)
10
Containerized Treatment Plant allows off-site assembly and minimize engineering.
Page 5 of 17 Item 21 Presentation March 17-18, 2016
Handout
3/11/2016
6
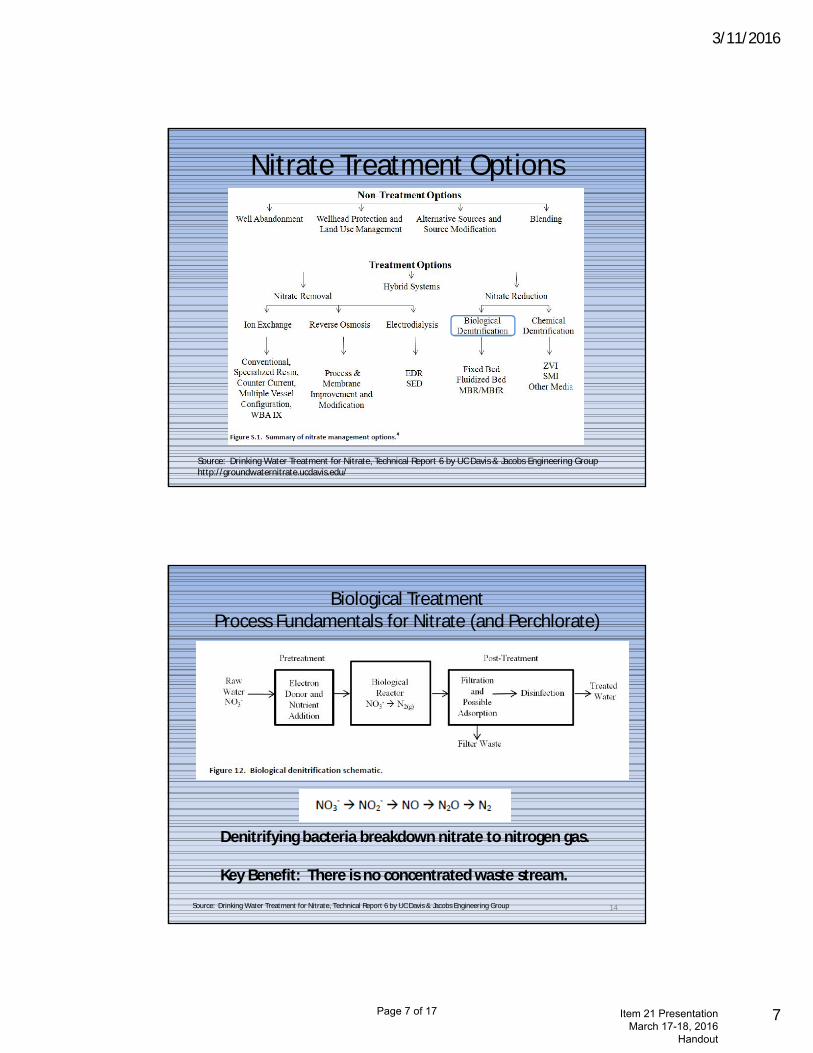
Ion Exchange Treatment Cost
• Capital Cost• Salt Cost• Brine Disposal• Operations• Maintenance
• As incoming nitrate concentration increases, the salt cost and brine disposal cost increase significantly, especially for inland systems.
11
0
50
100
150
200
250
300
350
400
450
10 12 14 16 18 20 22Co
st p
er A
cre
Ft $
Influent Nitrate Concentration, Nitrate as N
Optimized Ion Exchange Treatment Costper Acre Feet (Vendor Estimate / Site
Dependent)
Treatment Performance Requirements & Other Considerations
• Consistently below nitrate and nitrite MCL• Continuous disinfection• To ensure treatment reliability, treated water nitrate
monitored continuously• Operator certification = T2 Facility (minimum)
12
Ion Exchange Treatment is a mature technology, but may be too difficult for small water systems to operate. A possible solution for a small systems is technical consolidation of systems where the treatment plant is remotely monitored and serviced by a WTP operator.
Clarity on local Regional Board’s position on ion exchange treatment will help in technology deployment - chloride loading and brine disposal.
Page 6 of 17 Item 21 Presentation March 17-18, 2016
Handout
3/11/2016
7
Nitrate Treatment Options
Source: Drinking Water Treatment for Nitrate, Technical Report 6 by UC Davis & Jacobs Engineering Grouphttp://groundwaternitrate.ucdavis.edu/
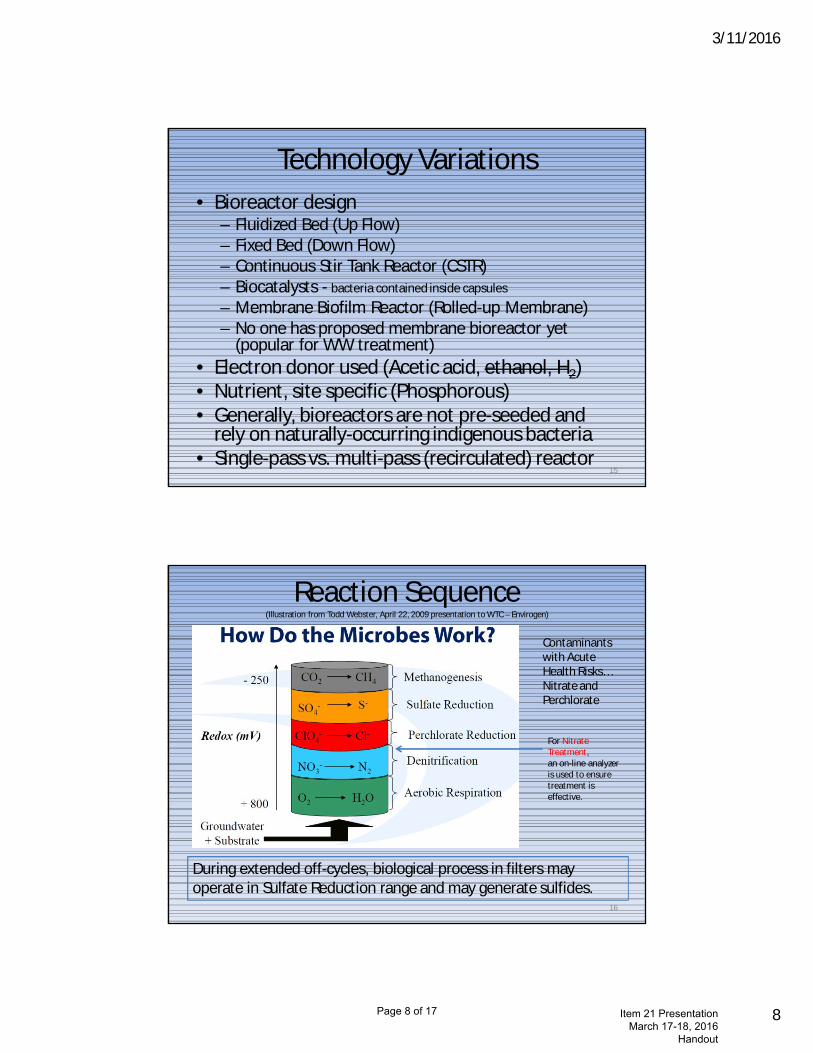
Biological TreatmentProcess Fundamentals for Nitrate (and Perchlorate)
Denitrifying bacteria breakdown nitrate to nitrogen gas.
Key Benefit: There is no concentrated waste stream.
Source: Drinking Water Treatment for Nitrate, Technical Report 6 by UC Davis & Jacobs Engineering Group 14
Page 7 of 17 Item 21 Presentation March 17-18, 2016
Handout
3/11/2016
8
Technology Variations• Bioreactor design
– Fluidized Bed (Up Flow)– Fixed Bed (Down Flow)– Continuous Stir Tank Reactor (CSTR)– Biocatalysts - bacteria contained inside capsules
– Membrane Biofilm Reactor (Rolled-up Membrane)– No one has proposed membrane bioreactor yet
(popular for WW treatment)• Electron donor used (Acetic acid, ethanol, H2)• Nutrient, site specific (Phosphorous)• Generally, bioreactors are not pre-seeded and
rely on naturally-occurring indigenous bacteria• Single-pass vs. multi-pass (recirculated) reactor
15
Reaction Sequence(Illustration from Todd Webster, April 22, 2009 presentation to WTC – Envirogen)
For Nitrate Treatment, an on-line analyzer is used to ensure treatment is effective.
16
Contaminants with Acute Health Risks…Nitrate and Perchlorate
During extended off-cycles, biological process in filters may operate in Sulfate Reduction range and may generate sulfides.
Page 8 of 17 Item 21 Presentation March 17-18, 2016
Handout
3/11/2016
9
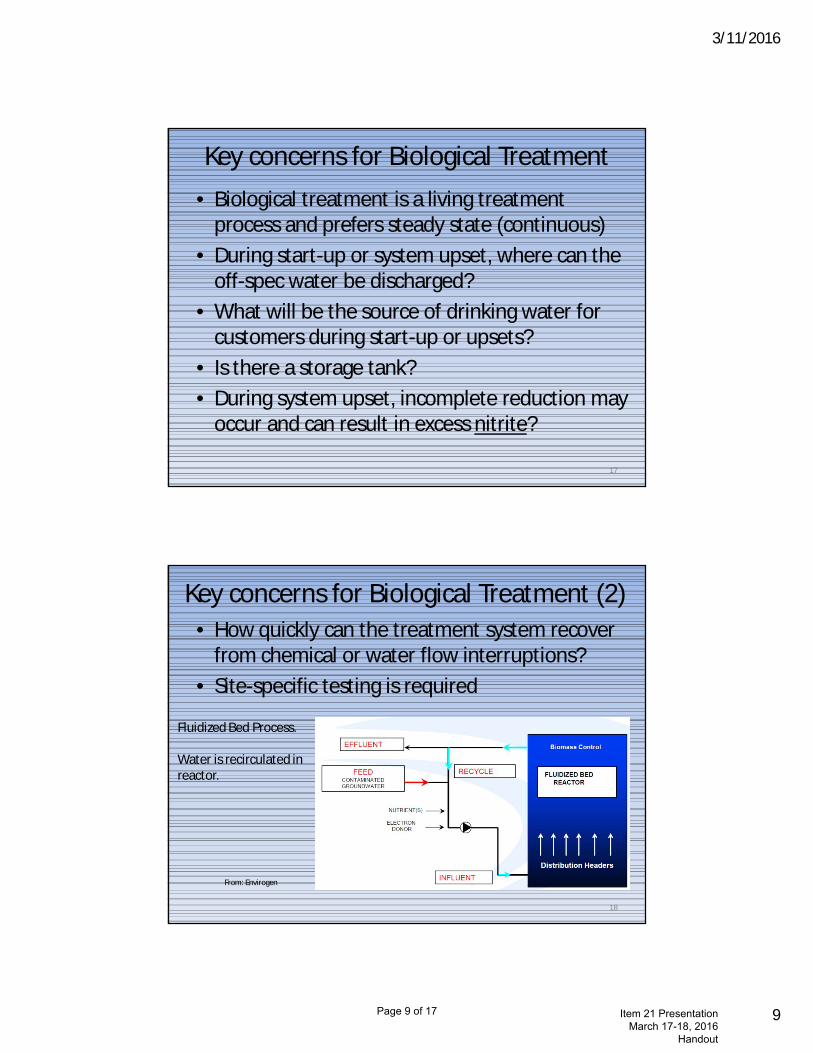
Key concerns for Biological Treatment• Biological treatment is a living treatment
process and prefers steady state (continuous)• During start-up or system upset, where can the
off-spec water be discharged?• What will be the source of drinking water for
customers during start-up or upsets? • Is there a storage tank?• During system upset, incomplete reduction may
occur and can result in excess nitrite?
17
Key concerns for Biological Treatment (2)• How quickly can the treatment system recover
from chemical or water flow interruptions?• Site-specific testing is required
18
From: Envirogen
Fluidized Bed Process.
Water is recirculated in reactor.
Page 9 of 17 Item 21 Presentation March 17-18, 2016
Handout
3/11/2016
10
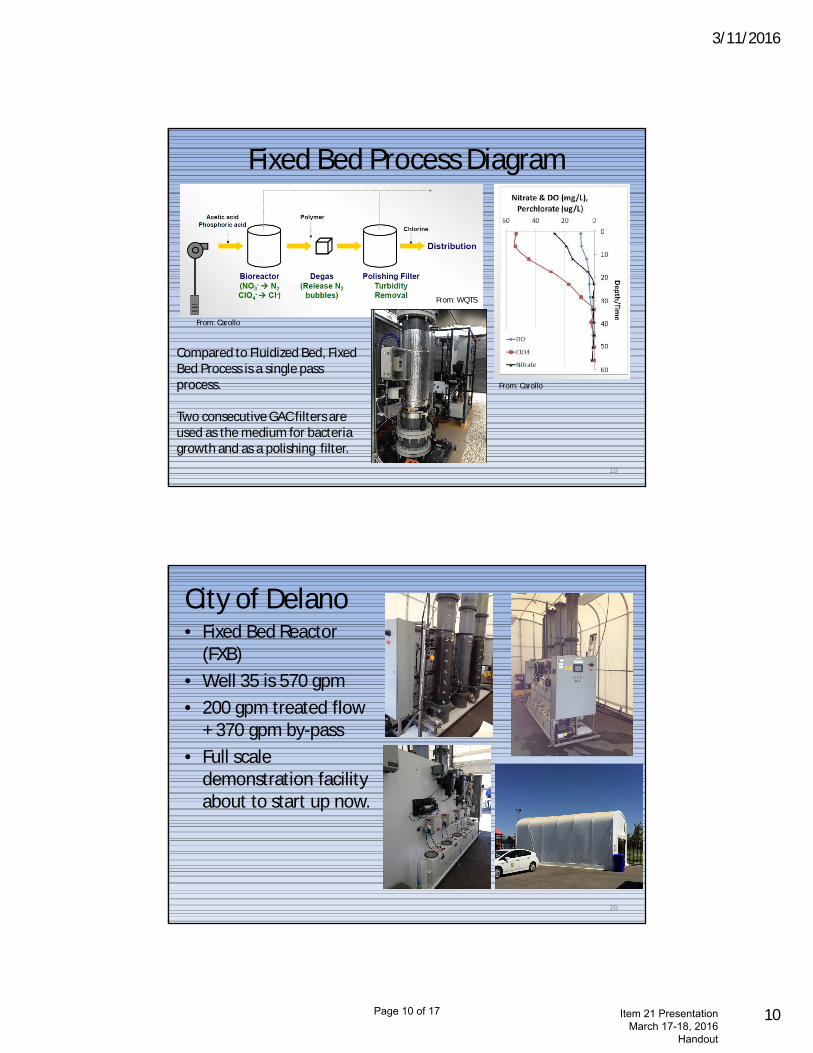
Fixed Bed Process Diagram
Compared to Fluidized Bed, Fixed Bed Process is a single pass process.
Two consecutive GAC filters are used as the medium for bacteria growth and as a polishing filter.
From: Carollo
From: WQTS
From: Carollo
19
City of Delano• Fixed Bed Reactor
(FXB)• Well 35 is 570 gpm• 200 gpm treated flow
+ 370 gpm by-pass• Full scale
demonstration facility about to start up now.
20
Page 10 of 17 Item 21 Presentation March 17-18, 2016
Handout
3/11/2016
11
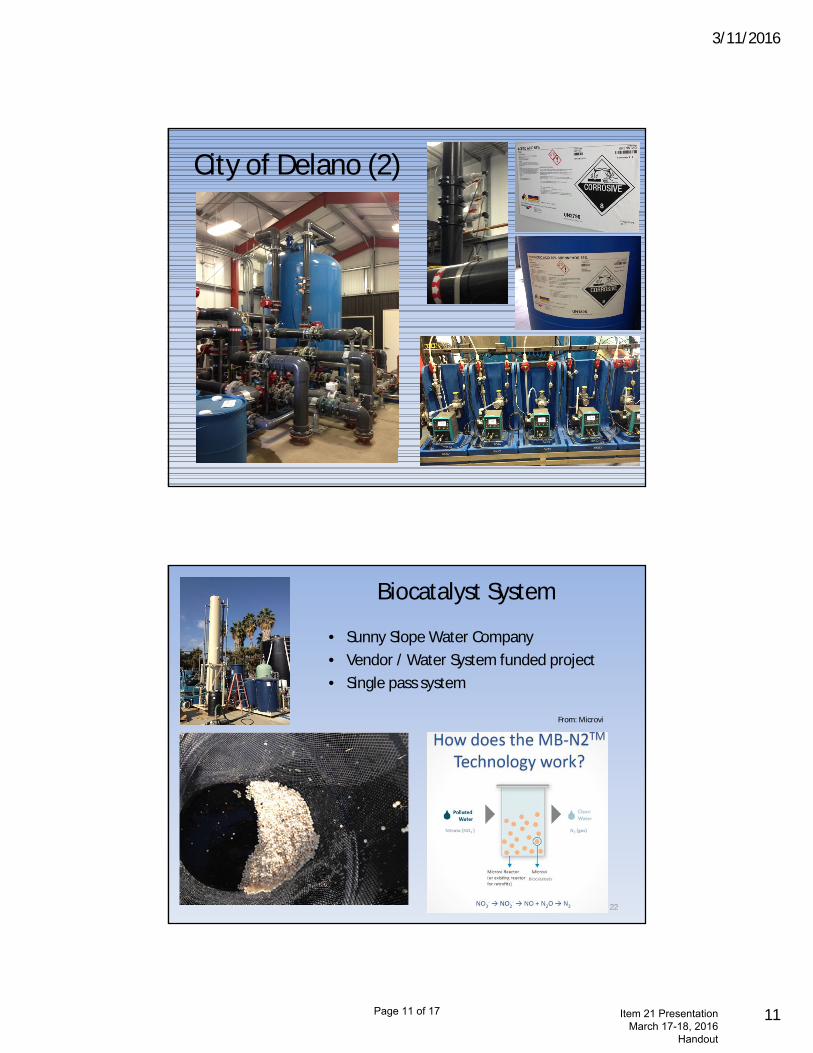
City of Delano (2)
Biocatalyst System
• Sunny Slope Water Company• Vendor / Water System funded project• Single pass system
22
From: Microvi
Page 11 of 17 Item 21 Presentation March 17-18, 2016
Handout
3/11/2016
12
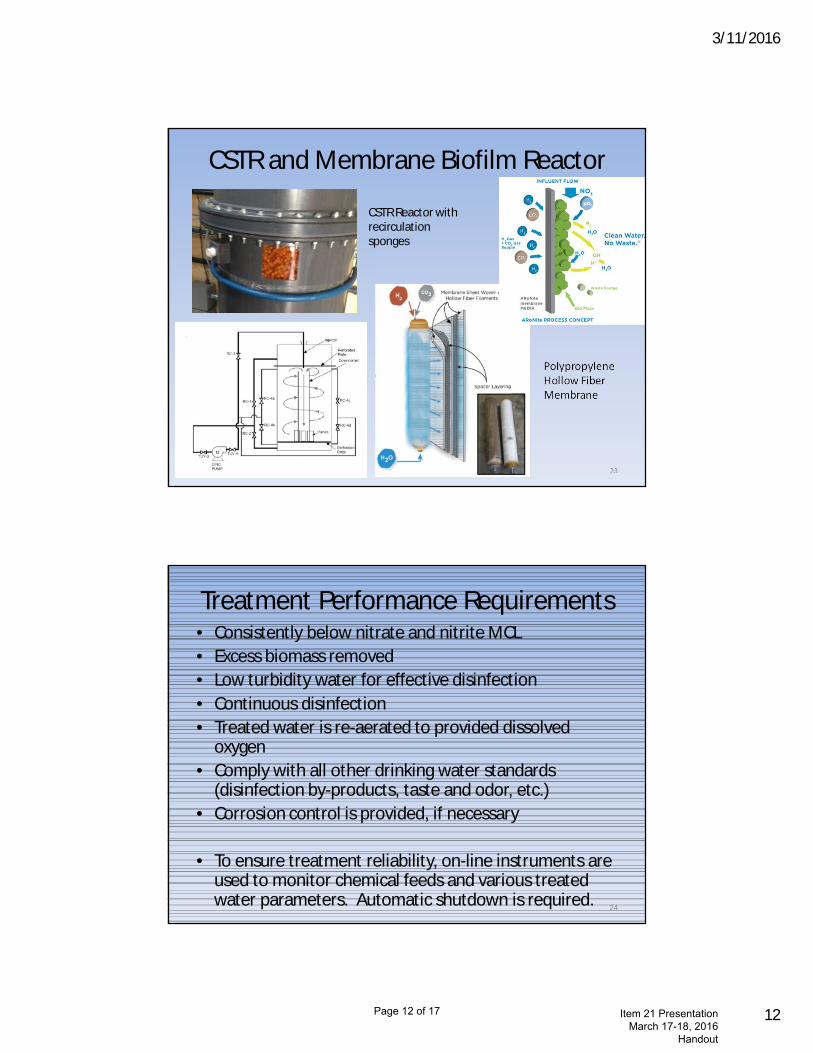
CSTR and Membrane Biofilm Reactor
23
Polypropylene Hollow Fiber Membrane
CSTR Reactor with recirculation sponges
Treatment Performance Requirements• Consistently below nitrate and nitrite MCL• Excess biomass removed• Low turbidity water for effective disinfection• Continuous disinfection• Treated water is re-aerated to provided dissolved
oxygen• Comply with all other drinking water standards
(disinfection by-products, taste and odor, etc.)• Corrosion control is provided, if necessary
• To ensure treatment reliability, on-line instruments are used to monitor chemical feeds and various treated water parameters. Automatic shutdown is required. 24
Page 12 of 17 Item 21 Presentation March 17-18, 2016
Handout
3/11/2016
13
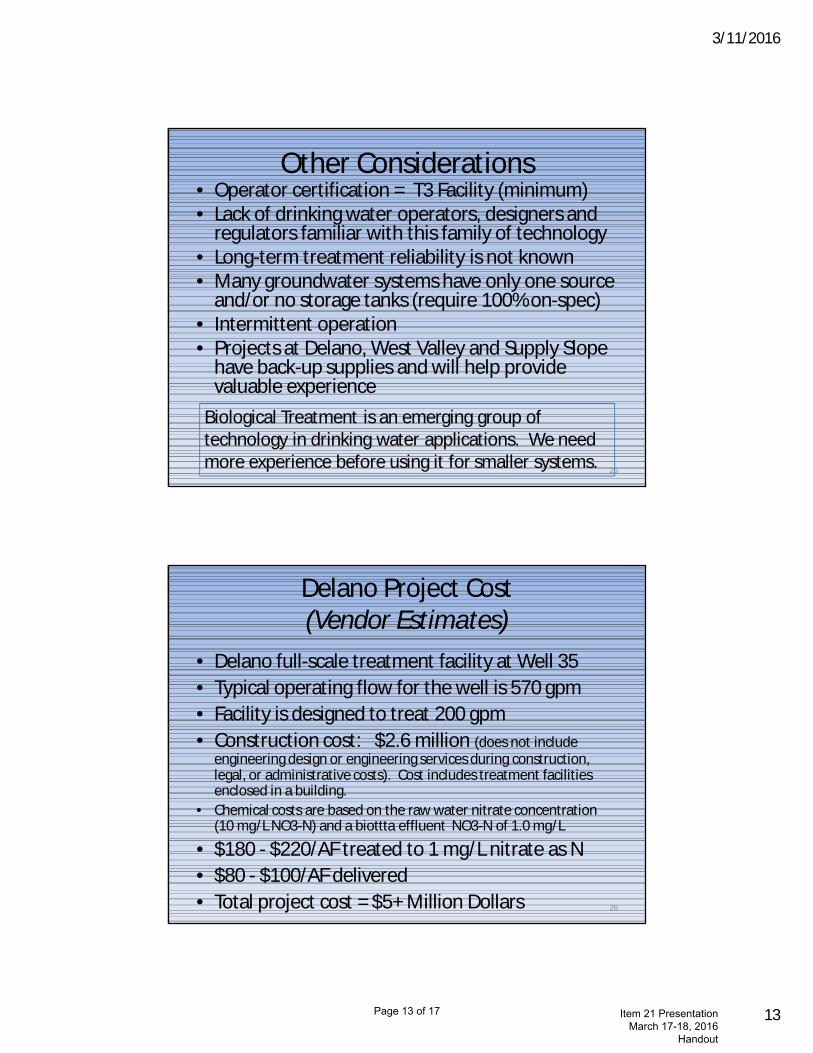
Other Considerations• Operator certification = T3 Facility (minimum)• Lack of drinking water operators, designers and
regulators familiar with this family of technology• Long-term treatment reliability is not known• Many groundwater systems have only one source
and/or no storage tanks (require 100% on-spec)• Intermittent operation• Projects at Delano, West Valley and Supply Slope
have back-up supplies and will help provide valuable experience
25
Biological Treatment is an emerging group of technology in drinking water applications. We need more experience before using it for smaller systems.
Delano Project Cost(Vendor Estimates)
• Delano full-scale treatment facility at Well 35• Typical operating flow for the well is 570 gpm• Facility is designed to treat 200 gpm• Construction cost: $2.6 million (does not include
engineering design or engineering services during construction, legal, or administrative costs). Cost includes treatment facilities enclosed in a building.
• Chemical costs are based on the raw water nitrate concentration (10 mg/L NO3-N) and a biottta effluent NO3-N of 1.0 mg/L
• $180 - $220/AF treated to 1 mg/L nitrate as N• $80 - $100/AF delivered• Total project cost = $5+ Million Dollars 26
Page 13 of 17 Item 21 Presentation March 17-18, 2016
Handout
3/11/2016
14
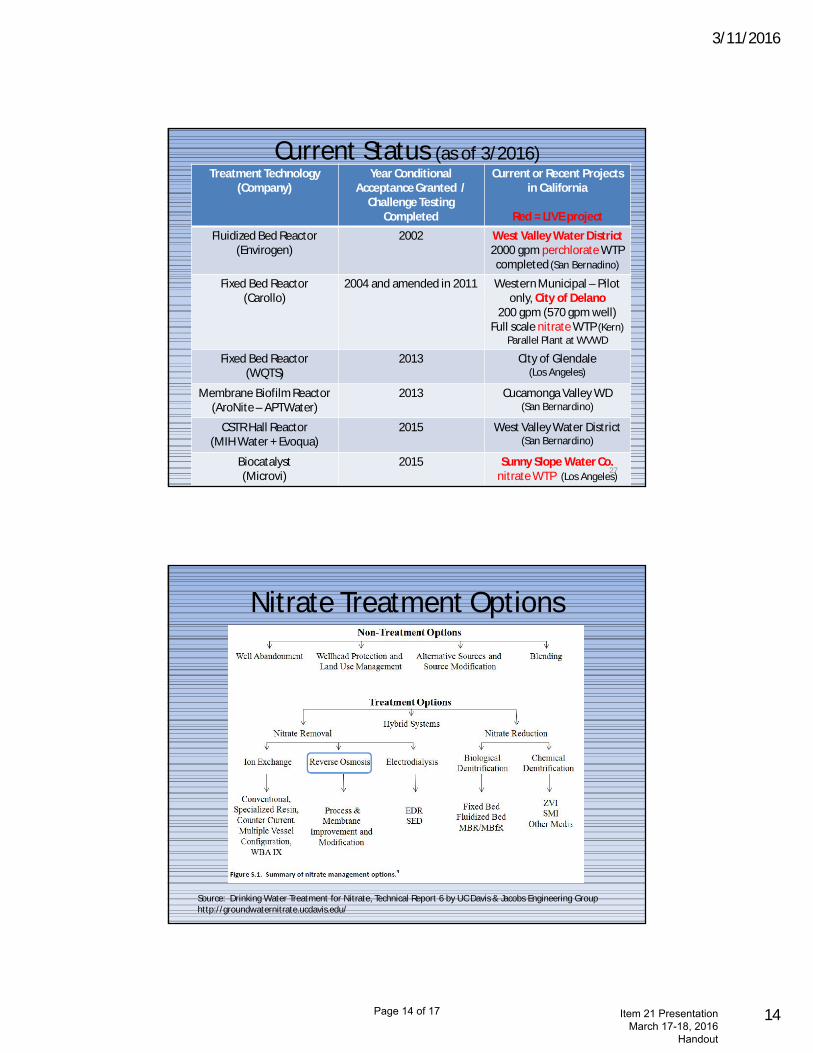
Current Status (as of 3/2016)Treatment Technology
(Company)Year Conditional
Acceptance Granted / Challenge Testing
Completed
Current or Recent Projects in California
Red = LIVE projectFluidized Bed Reactor
(Envirogen)2002 West Valley Water District
2000 gpm perchlorate WTPcompleted (San Bernadino)
Fixed Bed Reactor (Carollo)
2004 and amended in 2011 Western Municipal – Pilot only, City of Delano
200 gpm (570 gpm well) Full scale nitrate WTP (Kern)
Parallel Plant at WVWD
Fixed Bed Reactor(WQTS)
2013 City of Glendale(Los Angeles)
Membrane Biofilm Reactor (AroNite – APTWater)
2013 Cucamonga Valley WD(San Bernardino)
CSTR Hall Reactor (MIH Water + Evoqua)
2015 West Valley Water District(San Bernardino)
Biocatalyst(Microvi)
2015 Sunny Slope Water Co. nitrate WTP (Los Angeles)
27
Nitrate Treatment Options
Source: Drinking Water Treatment for Nitrate, Technical Report 6 by UC Davis & Jacobs Engineering Grouphttp://groundwaternitrate.ucdavis.edu/
Page 14 of 17 Item 21 Presentation March 17-18, 2016
Handout
3/11/2016
15
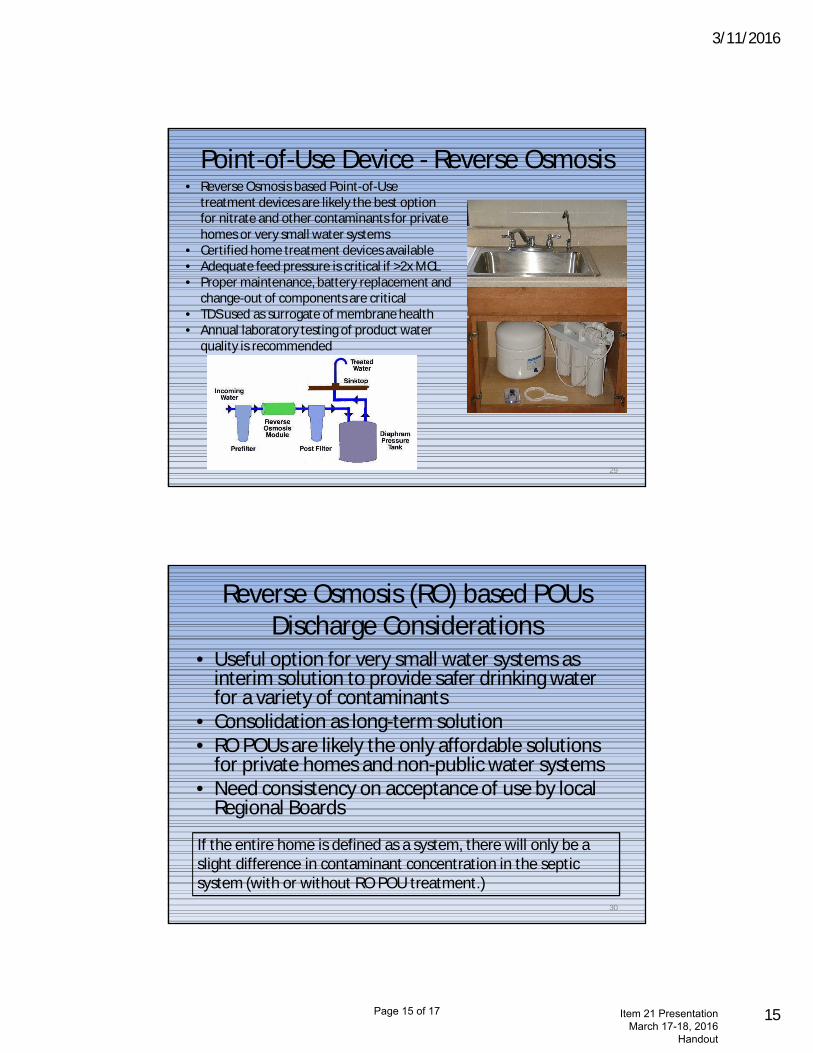
Point-of-Use Device - Reverse Osmosis
29
• Reverse Osmosis based Point-of-Use treatment devices are likely the best option for nitrate and other contaminants for private homes or very small water systems
• Certified home treatment devices available• Adequate feed pressure is critical if >2x MCL• Proper maintenance, battery replacement and
change-out of components are critical• TDS used as surrogate of membrane health• Annual laboratory testing of product water
quality is recommended
Reverse Osmosis (RO) based POUs Discharge Considerations
• Useful option for very small water systems as interim solution to provide safer drinking water for a variety of contaminants
• Consolidation as long-term solution• RO POUs are likely the only affordable solutions
for private homes and non-public water systems• Need consistency on acceptance of use by local
Regional Boards
30
If the entire home is defined as a system, there will only be a slight difference in contaminant concentration in the septic system (with or without RO POU treatment.)
Page 15 of 17 Item 21 Presentation March 17-18, 2016
Handout
3/11/2016
16
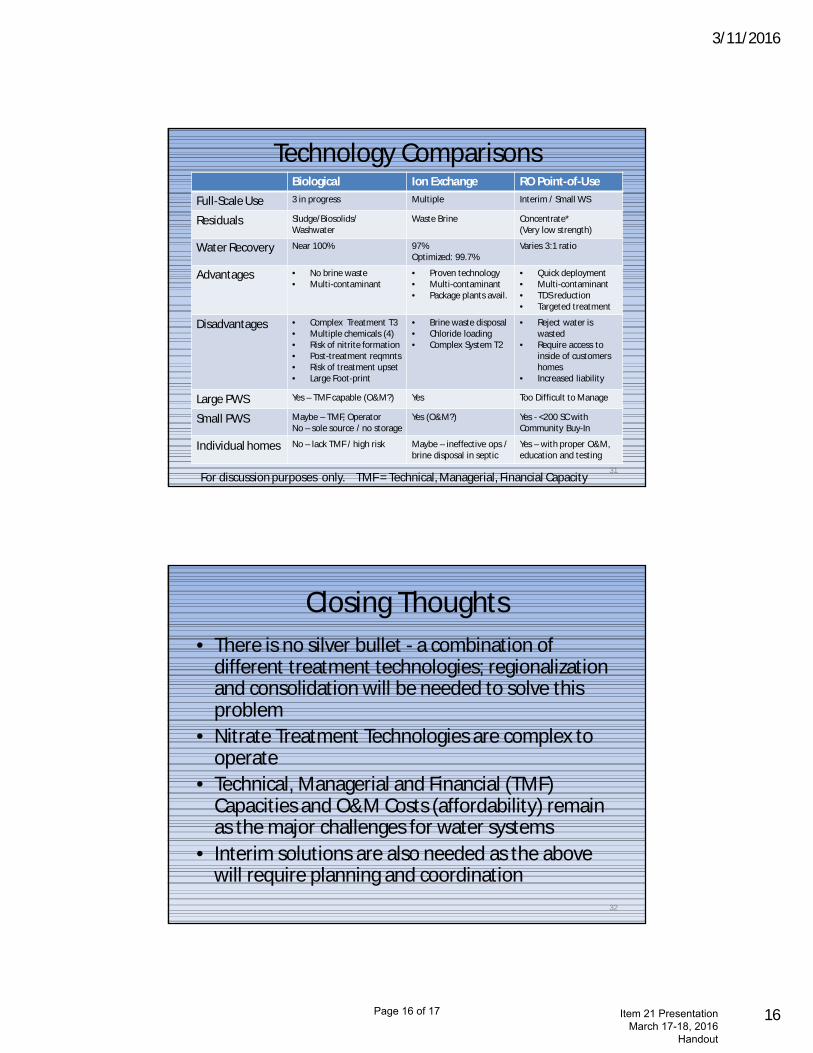
Technology ComparisonsBiological Ion Exchange RO Point-of-Use
Full-Scale Use 3 in progress Multiple Interim / Small WS
Residuals Sludge/Biosolids/ Washwater
Waste Brine Concentrate*(Very low strength)
Water Recovery Near 100% 97%Optimized: 99.7%
Varies 3:1 ratio
Advantages • No brine waste• Multi-contaminant
• Proven technology• Multi-contaminant• Package plants avail.
• Quick deployment• Multi-contaminant • TDS reduction• Targeted treatment
Disadvantages • Complex Treatment T3• Multiple chemicals (4)• Risk of nitrite formation• Post-treatment reqmnts• Risk of treatment upset• Large Foot-print
• Brine waste disposal• Chloride loading• Complex System T2
• Reject water is wasted
• Require access to inside of customers homes
• Increased liability
Large PWS Yes – TMF capable (O&M?) Yes Too Difficult to Manage
Small PWS Maybe – TMF, OperatorNo – sole source / no storage
Yes (O&M?) Yes - <200 SC with Community Buy-In
Individual homes No – lack TMF / high risk Maybe – ineffective ops / brine disposal in septic
Yes – with proper O&M, education and testing
31For discussion purposes only. TMF = Technical, Managerial, Financial Capacity
Closing Thoughts• There is no silver bullet - a combination of
different treatment technologies; regionalization and consolidation will be needed to solve this problem
• Nitrate Treatment Technologies are complex to operate
• Technical, Managerial and Financial (TMF) Capacities and O&M Costs (affordability) remain as the major challenges for water systems
• Interim solutions are also needed as the above will require planning and coordination
32
Page 16 of 17 Item 21 Presentation March 17-18, 2016
Handout
3/11/2016
17
• Questions?
• [email protected]• [email protected]
33
Page 17 of 17 Item 21 Presentation March 17-18, 2016
Handout