nissan motor co., ltd. - nissan-global.com · 【company name (in english)】 nissan motor co.,...
TRANSCRIPT

Quarterly Securities Report First Quarter of FY2018
(From April 1, 2018 To June 30, 2018)
( The English translation of the Quarterly Securities Report “Shihanki-Houkokusho” )
Nissan Motor Co., Ltd.

Table of Contents
Page
Cover ..................................................................................................................................................................... 1
Part I Information on the Company ..................................................................................................... 2
1. Overview of the Company .................................................................................................................... 2 1. Key financial data and trends .................................................................................................................. 2 2. Description of business.............................................................................................................................2
2. Business Overview ................................................................................................................................... 3 1. Business and other risks .......................................................................................................................... 3 2. Management’s analysis of financial position, operating results and cash flows ...................................... 3 3. Important business contracts ................................................................................................................... 6
3. Corporate Information .......................................................................................................................... 7 1. Information on the Company’s shares ..................................................................................................... 7 2. Members of the Board of Directors and Statutory Auditors .................................................................... 8
4. Financial Information ............................................................................................................................ 9 1. Quarterly Consolidated Financial Statements ....................................................................................... 10 2. Other ...................................................................................................................................................... 29
Part II Information on Guarantors for the Company ................................................................. 30 Independent Auditor’s Quarterly Review Report Confirmation Note
- 1 -
【Cover】
【Document Submitted】 Quarterly Securities Report (“Shihanki-Houkokusho”)
【Article of the Applicable Law Requiring
Submission of This Document】
Article 24-4-7, Paragraph 1 of the Financial Instruments and
Exchange Law
【Filed to】 Director, Kanto Local Finance Bureau
【Date of Submission】 July 30, 2018
【Accounting Period】 First Quarter of the 120th Fiscal Year
(From April 1, 2018 To June 30, 2018)
【Company Name】 Nissan Jidosha Kabushiki-Kaisha
【Company Name (in English)】 Nissan Motor Co., Ltd.
【Position and Name of Representative】 Hiroto Saikawa, President
【Location of Head Office】 2, Takaracho, Kanagawa-ku, Yokohama-shi, Kanagawa
【Phone No.】 (045) 523-5523 (switchboard)
【Contact for Communications】 Chie Saito, Manager, Consolidation Accounting Group,
Budget and Accounting Department
【Nearest Contact】 1-1, Takashima 1-chome, Nishi-ku, Yokohama-shi, Kanagawa
【Phone No.】 (045) 523-5523 (switchboard)
【Contact for Communications】 Chie Saito, Manager, Consolidation Accounting Group,
Budget and Accounting Department
【Place Where Available for Public
Inspection】
Tokyo Stock Exchange, Inc.
2-1, Nihonbashi Kabutocho, Chuo-ku, Tokyo

- 2 -
Part I Information on the Company
1. Overview of the Company 1. Key financial data and trends
Fiscal year 119th
Prior First Quarter
120th Current First
Quarter 119th
Accounting period (From April 1, 2017 To June 30, 2017)
(From April 1, 2018 To June 30, 2018)
(From April 1, 2017 To March 31, 2018)
Net sales Millions of yen 2,760,436 2,716,592 11,951,169
Ordinary income Millions of yen 189,600 158,902 750,302
Net income attributable to owners of parent
Millions of yen 134,916 115,829 746,892
Comprehensive income Millions of yen 124,917 74,290 740,338
Net assets Millions of yen 5,195,902 5,594,142 5,701,710
Total assets Millions of yen 18,491,209 18,672,894 18,739,935
Basic earnings per share Yen 34.49 29.62 190.96
Diluted earnings per share Yen 34.49 29.62 190.96
Net assets as a percentage of total assets % 26.5 28.4 28.8
Cash flows from operating activities Millions of yen 110,373 322,279 1,071,250
Cash flows from investing activities Millions of yen (294,314) (136,386) (1,147,719)
Cash flows from financing activities Millions of yen 71,763 (205,466) 36,810
Cash and cash equivalents at end of the period
Millions of yen 1,124,505 1,174,380 1,206,000
Notes: 1. Non-consolidated financial data is not presented as Nissan Motor Co., Ltd. (the “Company”) prepares quarterly consolidated financial statements.
2. Net sales are presented exclusive of consumption tax.
3. “Partial Amendments to Accounting Standard for Tax Effect Accounting, etc.” (Accounting Standards Board of Japan (ASBJ) Statement No. 28, February 16, 2018) and other standards have been adopted from the beginning of the current first quarter. Key financial data, etc. concerning the prior first quarter and the prior fiscal year are presented as figures after the retrospective adoption of these accounting standards, etc.
2. Description of business There have been no significant changes in the business in which the Company and its subsidiaries and affiliates
(collectively, the “Group”) operate during the first quarter ended June 30, 2018. No changes were made to major subsidiaries and affiliates.

- 3 -
2. Business Overview 1. Business and other risks
During the first quarter ended June 30, 2018, there were no unusual fluctuations with regard to financial position, operating results and cash flows or important changes in the “Business and other risks,” which are described in the securities report of the prior fiscal year.
2. Management’s analysis of financial position, operating results and cash flows
Any future forecasts included in the following descriptions are based on the best estimates or judgment of the Group as of June 30, 2018, the end of the current first quarter.
(1) Financial position and operating results
For the three months ended June 30, 2018 (the “current first quarter”), the Group’s net sales amounted to ¥2,716.6 billion, a decrease of ¥43.8 billion (1.6%) from the corresponding period of the last year (the “prior first quarter”). Operating income decreased by ¥44.2 billion (28.8%) to ¥109.1 billion on a consolidated basis. Net non-operating income of ¥49.8 billion was recorded for the current first quarter, increased by ¥13.5 billion from the prior first quarter. As a result, ordinary income decreased by ¥30.7 billion (16.2%) from the prior first quarter to ¥158.9 billion. Net special gains of ¥1.5 billion were recorded, improved by ¥5.0 billion from the prior first quarter. Income before income taxes decreased by ¥25.7 billion (13.8%) to ¥160.4 billion compared with the prior first quarter. Finally, net income attributable to owners of parent of ¥115.8 billion was recorded for the current first quarter, a decrease of ¥19.1 billion (14.1%) from the prior first quarter.
(2) Cash flows
Cash and cash equivalents at June 30, 2018 decreased by ¥31.6 billion (2.6%) from the end of the prior fiscal year to ¥1,174.4 billion. This reflected ¥322.3 billion in net cash provided by operating activities, ¥136.4 billion in net cash used in investing activities and ¥205.5 billion in net cash used in financing activities, as well as a decrease of ¥13.1 billion in the effects of exchange rate changes on cash and cash equivalents and a ¥1.1 billion increase attributable to a change in the scope of consolidation.
(3) Production and sales
Actual production
Location of manufacturers Number of vehicles produced (units) Change
(units) Change
(%) Prior first quarter Current first quarter
Japan 245,389 229,217 (16,172) (6.6)
The United States of America 236,673 200,075 (36,598) (15.5)
Mexico 220,444 179,134 (41,310) (18.7)
The United Kingdom 120,897 126,422 5,525 4.6
Spain 26,418 29,136 2,718 10.3
Russia 11,365 13,604 2,239 19.7
Thailand 29,870 38,889 9,019 30.2
Indonesia 3,109 3,853 744 23.9
Philippines 1,294 1,047 (247) (19.1)
India 62,236 42,956 (19,280) (31.0)
South Africa 7,463 10,870 3,407 45.7
Brazil 14,621 27,294 12,673 86.7
Egypt 2,803 4,325 1,522 54.3
Total 982,582 906,822 (75,760) (7.7)
Note: The figures represent the production figures for the 3-month period from April 1 to June 30, 2018.

- 4 -
Actual sales
Sales to Number of vehicles sold
(on a consolidated basis: units) Change (units)
Change (%)
Prior first quarter Current first quarter
Japan 123,652 124,302 650 0.5
North America 537,303 432,611 (104,692) (19.5)
(The United States of America included therein)
392,544 328,168 (64,376) (16.4)
Europe 170,883 154,609 (16,274) (9.5)
Asia 87,719 77,524 (10,195) (11.6)
Other overseas countries 110,946 138,593 27,647 24.9
Total 1,030,503 927,639 (102,864) (10.0)
Note: The figures in China and Taiwan, which are included in “Asia” represent the sales figures for the 3-month period from January 1 to March 31, 2018. Those sold in Japan, North America, Europe, Other overseas countries and Asia (excluding China and Taiwan) represent vehicles sold for the 3-month period from April 1 to June 30, 2018.
(4) Results of segments
(Business segments) a. Automobiles
The Group’s worldwide automobile sales (on a retail basis) for the current first quarter decreased by 3.0% from the prior first quarter to 1,310 thousand units. Net sales in automobile segment (including inter-segment sales) for the current first quarter decreased by ¥67.9 billion (2.7%) from the prior first quarter to ¥2,463.6 billion. Operating income decreased by ¥52.4 billion (58.0%) to ¥38.0 billion from the prior first quarter. A major profit-decreasing factor were increase of raw materials cost and foreign exchange rate movement.
b. Sales Finance Net sales in the sales finance segment (including inter-segment sales) for the current first quarter increased by ¥20.3 billion (7.4%) to ¥293.7 billion. Operating income for the current first quarter increased by ¥8.3 billion (15.1%) from the prior first quarter to ¥63.1 billion.
(Geographic segments) a. Japan
The overall demand for vehicles decreased by 1.0% in the domestic market, and the number of vehicles sold in Japan decreased by 0.8%, resulting in 130 thousand units, accounting for a market share of 10.9%, as same points as the prior first quarter. Net sales (including inter-segment sales) for the current first quarter increased by ¥7.7 billion (0.7%) from the prior first quarter to ¥1,106.9 billion. Operating income decreased by ¥37.6 billion (39.5%) from the prior first quarter to ¥57.6 billion. A major profit-decreasing factor were foreign exchange rate movement, increase of raw materials cost, and increase of R&D and manufacturing cost despite a favorable effect of reduction in purchasing costs.
b. North America The overall demand for vehicles in the United States of America increased by 1.8%, while the number of vehicles sold in the United States of America decreased by 9.5% to 365 thousand units, accounting for a market share of 8.1%. The number of vehicles sold in North America, including Mexico and Canada, decreased by 9.5% to 482 thousand units. Net sales (including inter-segment sales) for the current first quarter decreased by ¥166.4 billion (10.4%) to ¥1,436.1 billion. Operating income decreased by ¥1.3 billion (2.6%) from the prior first quarter to ¥49.5 billion. A major profit-decreasing factor were decrease in the number of vehicle sold and increase of raw materials cost despite favorable effects of reduction in purchasing costs and foreign exchange rate movement.
c. Europe The overall demand for vehicles in Europe increased by 6.6%, and the number of vehicles sold in Europe excluding Russia decreased by 14.4% to 139 thousand units, accounting for a market share of 2.9%. The number of vehicles sold in Russia decreased by 0.6% to 23 thousand units. Net sales (including inter-segment sales) for the current first quarter increased by ¥26.7 billion (6.3%) to ¥448.0 billion. Operating loss of ¥4.7 billion was recorded, deteriorating by ¥2.0 billion from the prior first quarter. A major deteriorating factor was foreign exchange rate movement despite a favorable effect of reduction in purchasing costs.

- 5 -
d. Asia Sales volume in Asia and Oceania market, excluding China, decreased by 7.4% to 76 thousand units. Net sales in Asia and Oceania (including intersegment sales) for the current fiscal year increased by ¥20.8 billion (5.9%) from the prior first quarter to ¥374.7 billion. Operating income for the current fiscal year was ¥17.8 billion, an increase of ¥0.4 billion (1.9%) from the prior first quarter. The overall demand for vehicles in China increased by 2.3%, and the number of vehicles sold in China increased by 6.9% to 336 thousand units, accounting for a market share of 5.0%. The operating results of Chinese joint venture, Dongfeng Motor Co., Ltd., is reflected as a gain on the equity in earnings of affiliates in Non-operating income.
e. Other overseas countries The number of vehicles sold in other countries including Africa, Central and South America excluding Mexico, and Middle East increased by 17.5% to 124 thousand units. Net sales (including inter-segment sales) for the current first quarter increased by ¥62.6 billion (29.8%) from the prior first quarter to ¥272.3 billion. Operating loss of ¥0.2 billion was recorded, improving by ¥0.9 billion from the prior first quarter.
(5) Analysis of sources of capital and liquidity
a. Cash flows
(Cash flows from operating activities) Net cash provided by operating activities increased by ¥211.9 billion to ¥322.3 billion in the current first quarter from ¥110.4 billion provided in the prior first quarter. This was mainly attributable to a shift from an increase to a decrease in sales finance receivables.
(Cash flows from investing activities) Net cash used in investing activities decreased by ¥157.9 billion to ¥136.4 billion in the current first quarter from ¥294.3 billion used in the prior first quarter. This was mainly attributable to an increase in proceeds from a net decrease in restricted cash and decrease in net payment (net difference between the payment for purchase and the proceeds from sales) of leased vehicles.
(Cash flows from financing activities) Net cash used in financing activities was ¥205.5 billion in the current first quarter, an increase in cash outflows of ¥277.3 billion compared with ¥71.8 billion provided in the prior first quarter. This was mainly attributable to a decrease in net proceeds from short-term borrowings and a decrease in proceeds from long-term borrowings.
Cash and cash equivalents at June 30, 2018 decreased by ¥31.6 billion (2.6%) from the end of the prior fiscal year to ¥1,174.4 billion, which was included a decrease of ¥13.1 billion in the effects of exchange rate changes on cash and cash equivalents and a ¥1.1 billion increase attributable to a change in the scope of consolidation.
b. Financial policies
It is necessary to pay careful attention to the liquidity of funds in view of the drastic environmental changes in the financial markets and other relevant concerns. However, as the Group has entered into loan commitment agreements with major international banks in addition to the cash and cash equivalents held, the Group believes that a level of liquidity is sufficient to meet the Group’s funding requirements.
(6) Management policy and business strategies
Guided by the vision of Enriching people’s lives, the Group aims to provide unique and innovative products and services that deliver superior measurable values to all stakeholders under the Alliance.
The Group announced on November 8, 2017, the new midterm plan “Nissan M.O.V.E. to 2022” designed to guide the company toward profitable growth over the next six years, and to prepare for further growth beyond the plan as the evolution continues. The new plan expresses that the Group will keep on moving and evolving toward the future, and it stands for the following drivers: • Mobility • Operational Excellence • Value to Customers • Electrification
The mission under “Nissan M.O.V.E. to 2022” is to be built on the strong business foundations of “Nissan Power 88”, and leverage the benefits of our Alliance with Renault and Mitsubishi Motors Corporation, in order to; 1. Achieve sustainable growth, while delivering healthy profitability and strong free cash flow 2. Lead the technology and business evolution in the automotive industry, backed by our technology DNA
- 6 -
The Group will fulfill its mission by engaging in “Nissan M.O.V.E. to 2022” with in mind of the technology evolution coming in the next 10 to 15 years, as well as the significant changes in the market and evolving customer expectations.
The mission of the six-year midterm plan “Nissan M.O.V.E. to 2022” announced on November 8, 2017 is to achieve sustainable growth and to lead the technology and business evolution of the automotive industry. Because China market is one of the most important markets for the global automotive market today, this midterm plan of 8% operating margin, which is one of the Group’s KPIs, is based on the proportionate consolidation of the Chinese joint venture. By the end of the plan, the Group aims to grow revenues to ¥16,500 billion, and generate a cumulative ¥2,500 billion of automotive free cash flow, with 8% operating margin.
(7) Operating and financial issues to be addressed
Operating and financial issues to be addressed by the Group occurring during the current first quarter are as follows. Since the discovery in 2017 of nonconformities in the final vehicle inspection process (kanken) at its plants in Japan, Nissan Motor Co., Ltd. has been proactively carrying out comprehensive compliance checks of various parts of its operations. As part of a check of exhaust emissions and fuel economy measurement tests within the kanken, Nissan discovered that misconduct was carried out. A full and comprehensive investigation of the facts, including the causes and background of the misconduct, is underway. This issue came to light during the course of voluntary checks conducted by Nissan. As a companywide exercise, Nissan will continue to carry out comprehensive checks of frameworks, organizations and processes related to regulatory compliance.
(8) Research-and-development activities
The Group has been active in conducting research-and-development activities in the environment, safety and various other fields toward the realization of a sustainable, motorized society in the future. The research-and-development costs of the Group amounted to ¥122.8 billion for the current first quarter.
3. Important business contracts
No important business contracts were determined or entered into during the current first quarter.
- 7 -
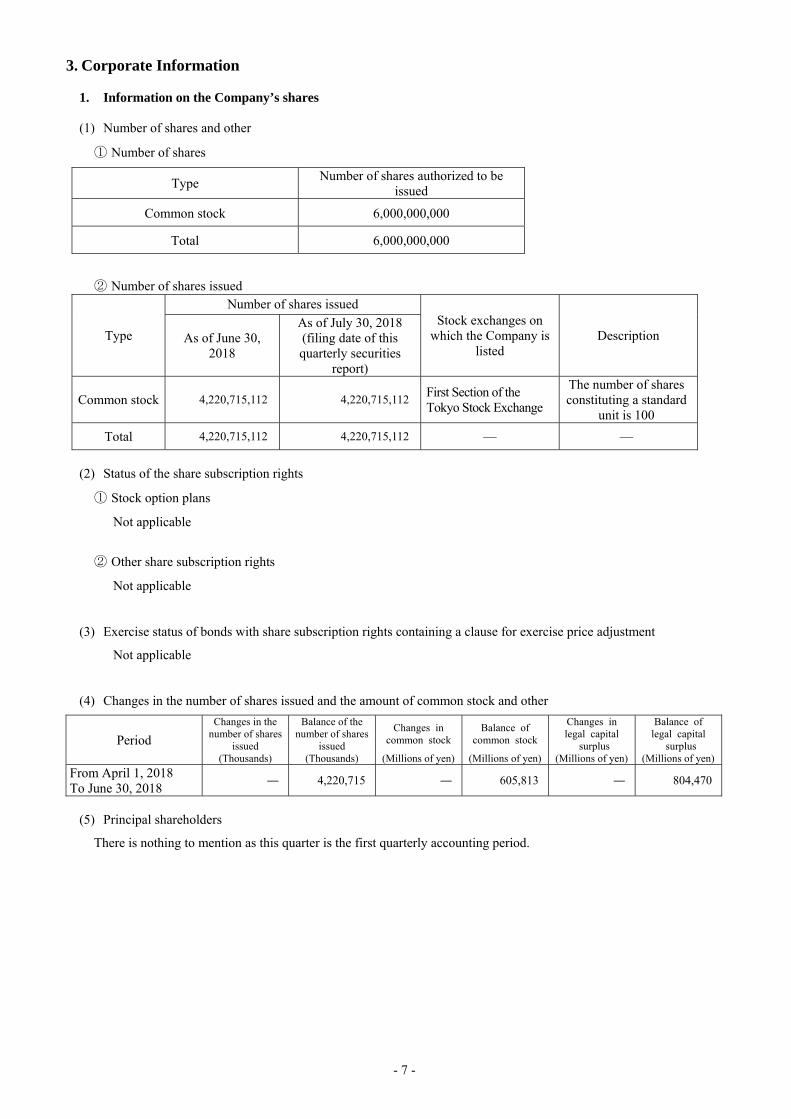
3. Corporate Information
1. Information on the Company’s shares
(1) Number of shares and other
① Number of shares
Type Number of shares authorized to be
issued
Common stock 6,000,000,000
Total 6,000,000,000
② Number of shares issued
Type
Number of shares issued Stock exchanges on
which the Company is listed
Description As of June 30, 2018
As of July 30, 2018 (filing date of this quarterly securities
report)
Common stock 4,220,715,112 4,220,715,112First Section of the Tokyo Stock Exchange
The number of shares constituting a standard
unit is 100
Total 4,220,715,112 4,220,715,112 — —
(2) Status of the share subscription rights
① Stock option plans
Not applicable
② Other share subscription rights
Not applicable
(3) Exercise status of bonds with share subscription rights containing a clause for exercise price adjustment
Not applicable
(4) Changes in the number of shares issued and the amount of common stock and other
Period
Changes in the number of shares
issued
Balance of the number of shares
issued
Changes in common stock
Balance of common stock
Changes in legal capital
surplus
Balance of legal capital
surplus (Thousands) (Thousands) (Millions of yen) (Millions of yen) (Millions of yen) (Millions of yen)
From April 1, 2018 To June 30, 2018
― 4,220,715 ― 605,813 ― 804,470
(5) Principal shareholders
There is nothing to mention as this quarter is the first quarterly accounting period.

- 8 -
(6) Status of voting rights The “Status of voting rights” as of the end of the current first quarter is presented as of March 31, 2018, the most recent record date, because the number of beneficiary shareholders as of June 30, 2018 could not be ascertained.
① Shares issued (As of March 31, 2018)
Classification Number of shares Number of voting rights
Description (Shares) (Units)
Shares with full voting rights (Treasury stock, etc.)
(Treasury stock) ― ― Common stock
28,426,000(Crossholding stock)
― ― Common stock 238,800
Shares with full voting rights (Others)
Common stock 41,914,681 ―
4,191,468,100
Stocks of less than a standard unit
Common stock ― ―
582,212
Total shares issued 4,220,715,112 ― ―
Total voting rights held by all shareholders
― 41,914,681 ―
Note: “Stocks of less than a standard unit” include 38 shares of treasury stock and 30 crossholding shares.
Crossholding stocks of less than a standard unit (As of March 31, 2018)
Shareholder Number of shares
Kai Nissan Motor Co., Ltd. 30
② Treasury stock, etc. (As of March 31, 2018)
Shareholders Addresses of shareholders
Number of shares held under own
name
Number of shares held under the
names of others
Total % of
interest
Shares Shares Shares %
Treasury stock: Nissan Motor Co., Ltd.
2 Takara-cho, Kanagawa-ku, Yokohama-shi, Kanagawa 28,426,000 ― 28,426,000 0.67
Crossholding stock:
Kochi Nissan Prince Motor Sales Co., Ltd.
2-21 Asahi-cho, Kochi-shi, Kochi 105,600 ― 105,600 0.00
Kai Nissan Motor Co., Ltd. 706 Kamiimai-cho, Kofu-shi, Yamanashi 37,800 44,900 82,700 0.00
Kagawa Nissan Motor Co., Ltd. 1-1-8 Hanazono-cho, Takamatsu-shi,
Kagawa 4,800 100 4,900 0.00
NDC Sales Co., Ltd. 2-39-1 Mimomi, Narashino-shi, Chiba 45,600 ― 45,600 0.00
Total 28,619,800 45,000 28,664,800 0.68
Note: The shares included in “Number of shares held under the names of others” represents those held by Nissan’s crossholding share association (address: 1-1, Takashima 1-chome, Nishi-ku, Yokohama-shi, Kanagawa).
(Fractional numbers under 100 have been omitted.) 2. Members of the Board of Directors and Statutory Auditors
Not applicable
- 9 -
4. Financial Information 1. Basis of preparation of the quarterly consolidated financial statements The quarterly consolidated financial statements of the Company are prepared in accordance with the Ministry
of Finance Ordinance No. 64, 2007 “Regulations Concerning the Terminology, Forms and Preparation Methods of Quarterly Consolidated Financial Statements” (“Regulations for Quarterly Consolidated Financial Statements”).
Pursuant to Article 5-2, Paragraph 2 of the Regulations for Quarterly Consolidated Financial Statements, the quarterly consolidated statements of cash flows are prepared.
2. Quarterly review report The quarterly consolidated financial statements for the current first quarter (from April 1, 2018 to June 30,
2018) were reviewed by Ernst & Young ShinNihon LLC, pursuant to Article 193-2, Paragraph 1 of the Financial Instruments and Exchange Law.

- 10 -
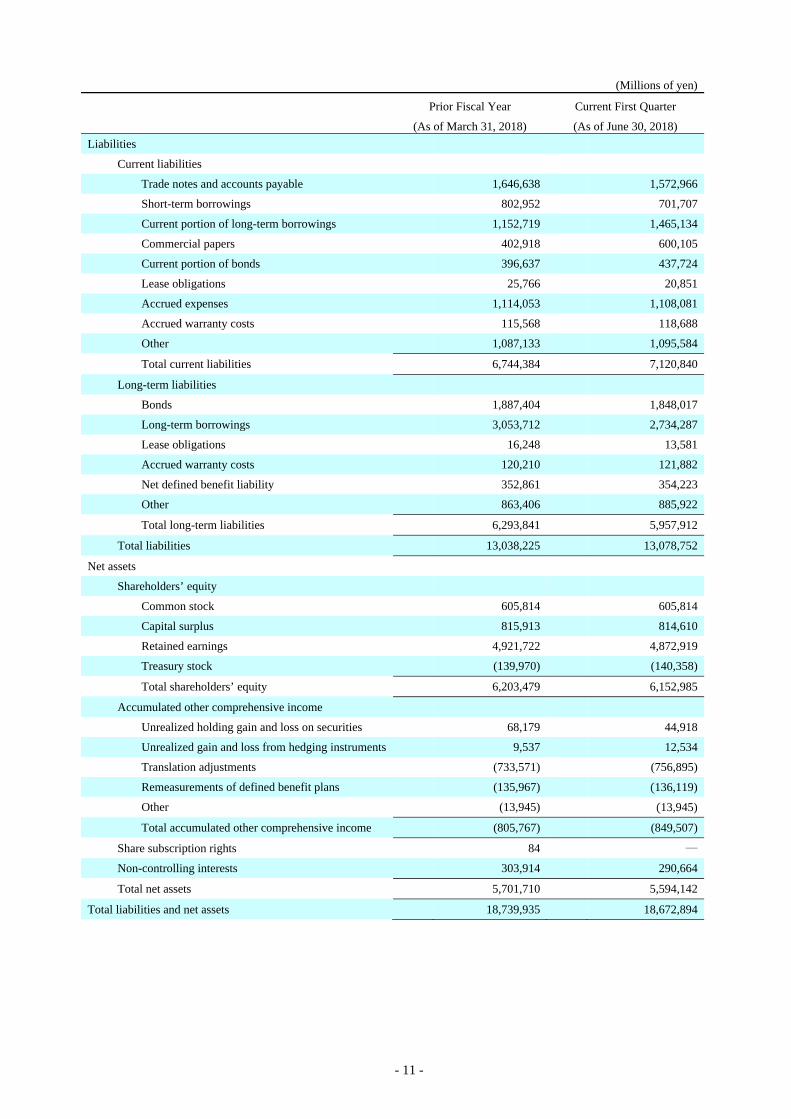
1. Quarterly Consolidated Financial Statements (1) Quarterly consolidated balance sheets
(Millions of yen)
Prior Fiscal Year Current First Quarter
(As of March 31, 2018) (As of June 30, 2018)
Assets
Current assets
Cash on hand and in banks 1,134,838 1,068,481
Trade notes and accounts receivable 739,851 554,876
Sales finance receivables 7,634,756 7,676,317
Securities 71,200 105,899
Merchandise and finished goods 880,518 1,019,852
Work in process 91,813 102,447
Raw materials and supplies 318,218 322,245
Other 775,771 732,440
Allowance for doubtful accounts 116,572) 120,702)
Total current assets 11,530,393 11,461,855
Fixed assets
Property, plant and equipment
Buildings and structures, net 600,675 595,858
Machinery, equipment and vehicles, net ※1 3,392,134 ※1 3,460,260
Land 598,780 598,096
Construction in progress 209,237 172,640
Other, net 464,808 448,209
Total property, plant and equipment 5,265,634 5,275,063
Intangible fixed assets 128,782 126,420
Investments and other assets
Investment securities 1,264,532 1,230,611
Other 552,396 580,719
Allowance for doubtful accounts 1,802) 1,774)
Total investments and other assets 1,815,126 1,809,556
Total fixed assets 7,209,542 7,211,039
Total assets 18,739,935 18,672,894
- 11 -
(Millions of yen)
Prior Fiscal Year Current First Quarter
(As of March 31, 2018) (As of June 30, 2018)
Liabilities
Current liabilities
Trade notes and accounts payable 1,646,638 1,572,966
Short-term borrowings 802,952 701,707
Current portion of long-term borrowings 1,152,719 1,465,134
Commercial papers 402,918 600,105
Current portion of bonds 396,637 437,724
Lease obligations 25,766 20,851
Accrued expenses 1,114,053 1,108,081
Accrued warranty costs 115,568 118,688
Other 1,087,133 1,095,584
Total current liabilities 6,744,384 7,120,840
Long-term liabilities
Bonds 1,887,404 1,848,017
Long-term borrowings 3,053,712 2,734,287
Lease obligations 16,248 13,581
Accrued warranty costs 120,210 121,882
Net defined benefit liability 352,861 354,223
Other 863,406 885,922
Total long-term liabilities 6,293,841 5,957,912
Total liabilities 13,038,225 13,078,752
Net assets
Shareholders’ equity
Common stock 605,814 605,814
Capital surplus 815,913 814,610
Retained earnings 4,921,722 4,872,919
Treasury stock (139,970) (140,358)
Total shareholders’ equity 6,203,479 6,152,985
Accumulated other comprehensive income
Unrealized holding gain and loss on securities 68,179 44,918
Unrealized gain and loss from hedging instruments 9,537 12,534
Translation adjustments (733,571) (756,895)
Remeasurements of defined benefit plans (135,967) 136,119)
Other (13,945) 13,945)
Total accumulated other comprehensive income (805,767) (849,507)
Share subscription rights 84 ―
Non-controlling interests 303,914 290,664
Total net assets 5,701,710 5,594,142
Total liabilities and net assets 18,739,935 18,672,894

- 12 -
(2) Quarterly consolidated statements of income and quarterly consolidated statements of comprehensive income The Three-Month Period Ended June 30
Quarterly consolidated statements of income
(Millions of yen)
Prior First Quarter Current First Quarter
(From April 1, 2017 To June 30, 2017)
(From April 1, 2018 To June 30, 2018)
Net sales 2,760,436 2,716,592
Cost of sales 2,267,080 2,273,580
Gross profit 493,356 443,012
Selling, general and administrative expenses
Advertising expenses 68,307 71,624
Provision for warranty costs 26,583 32,205
Other selling expenses 46,901 42,443
Salaries and wages 99,395 96,190
Retirement benefit expenses 5,361 4,767
Provision for doubtful accounts 20,067 15,282
Other 73,425 71,357
Total selling, general and administrative expenses 340,039 333,868
Operating income 153,317 109,144
Non-operating income
Interest income 4,457 7,297
Dividends income 6,583 8,026
Equity in earnings of affiliates 37,400 44,406
Derivative gain ― 23,733
Exchange gain 19,009 ―
Miscellaneous income 1,848 6,926
Total non-operating income 69,297 90,388
Non-operating expenses
Interest expense 3,635 3,149
Derivative loss 25,063 ―
Exchange loss ― 31,673
Miscellaneous expenses 4,316 5,808
Total non-operating expenses 33,014 40,630
Ordinary income 189,600 158,902
Special gains
Gain on sales of fixed assets 952 7,297
Other 182 137
Total special gains 1,134 7,434
Special losses
Loss on sales of fixed assets 677 297
Loss on disposal of fixed assets 1,267 1,388
Expense for reorganization of sales business ― 3,724
Other 2,700 520
Total special losses 4,644 5,929
Income before income taxes 186,090 160,407
Income taxes 45,774 38,949
Net income 140,316 121,458
Net income attributable to non-controlling interests 5,400 5,629
Net income attributable to owners of parent 134,916 115,829

- 13 -
Quarterly consolidated statements of comprehensive income
(Millions of yen)
Prior First Quarter Current First Quarter
(From April 1, 2017 To June 30, 2017)
(From April 1, 2018 To June 30, 2018)
Net income 140,316 121,458
Other comprehensive income
Unrealized holding gain and loss on securities (1,571) (22,163)
Unrealized gain and loss from hedging instruments (1,359) 2,991
Translation adjustments (1,015) (3,206)
Remeasurements of defined benefit plans (1,103) (443)
The amount for equity method company portion (10,351) (24,347)
Total other comprehensive income (15,399) (47,168)
Comprehensive income 124,917 74,290
(Breakdown of comprehensive income)
Comprehensive income attributable to owners of parent
118,978 72,089
Comprehensive income attributable to non-controlling interests
5,939 2,201

- 14 -
(3) Quarterly consolidated statements of cash flows (Millions of yen) Prior First Quarter Current First Quarter (From April 1, 2017
To June 30, 2017) (From April 1, 2018 To June 30, 2018)
Cash flows from operating activities
Income before income taxes 186,090 160,407 Depreciation and amortization (for fixed assets excluding leased
vehicles) 91,786 98,230
Depreciation and amortization (for long term prepaid expenses) 6,349 15,855
Depreciation and amortization (for leased vehicles) 118,380 124,576
Increase (decrease) in allowance for doubtful accounts 965 (1,965)
Interest and dividends income (11,040) (15,323)
Interest expense 36,227 48,659
Equity in losses (earnings) of affiliates (37,400) (44,406)
Loss (gain) on sales of fixed assets (275) (7,000)
Loss on disposal of fixed assets 1,267 1,388
Decrease (increase) in trade notes and accounts receivable 226,084 180,611
Decrease (increase) in sales finance receivables (165,167) 91,680
Decrease (increase) in inventories (150,301) (157,158)
Increase (decrease) in trade notes and accounts payable (84,098) (133,954)
Retirement benefit expenses 6,288 6,692
Payments related to net defined benefit assets and liabilities (5,522) (5,691)
Other 28,495 942
Subtotal 248,128 363,543
Interest and dividends received 9,330 18,313 Proceeds from dividends income from affiliates accounted for by
equity method 20,014 27,569
Interest paid (31,746) (45,047)
Income taxes paid (135,353) (42,099)
Net cash provided by operating activities 110,373 322,279
Cash flows from investing activities
Net decrease (increase) in short-term investments 115 83
Purchase of fixed assets (107,985) (101,112)
Proceeds from sales of fixed assets 11,404 14,299
Purchase of leased vehicles (346,993) (308,450)
Proceeds from sales of leased vehicles 148,079 171,879
Payments of long-term loans receivable (95) (172)
Collection of long-term loans receivable 146 98
Purchase of investment securities (10,980) (11,237)
Net decrease (increase) in restricted cash 11,198 98,373
Other 797 (147)
Net cash used in investing activities (294,314) (136,386)

- 15 -
(Millions of yen)
Prior First Quarter Current First Quarter
(From April 1, 2017 To June 30, 2017)
(From April 1, 2018 To June 30, 2018)
Cash flows from financing activities
Net increase (decrease) in short-term borrowings 246,881 71,596
Proceeds from long-term borrowings 289,968 170,800
Proceeds from issuance of bonds 32,952 33,037
Repayments of long-term borrowings (335,411) (290,145)
Redemption of bonds (60,000) (77,604)
Purchase of treasury stock (1) (1)
Proceeds from sales of treasury stock 12 ―
Repayments of lease obligations (8,121) (8,546)
Cash dividends paid (93,883) (103,627)
Cash dividends paid to non-controlling interests (634) (976)
Net cash provided by (used in) financing activities 71,763 (205,466)
Effects of exchange rate changes on cash and cash equivalents (4,441) (13,162)
Decrease in cash and cash equivalents (116,619) (32,735)
Cash and cash equivalents at beginning of the period 1,241,124 1,206,000
Increase due to inclusion in consolidation ― 1,115
Cash and cash equivalents at end of the period ※1 1,124,505 ※1 1,174,380

- 16 -
[Notes to Quarterly Consolidated Financial Statements] (Changes in accounting policies)
Current First Quarter (From April 1, 2018
To June 30, 2018) (1) Financial Accounting Standards Board (FASB) Accounting Standards Codification (ASC) 606, “Revenue from Contracts with Customers” and IFRS 15, “Revenue from Contracts with Customers” At foreign subsidiaries and affiliates that apply US GAAP, ASC 606, “Revenue from Contracts with Customers” has been adopted, while at other foreign subsidiaries and affiliates, IFRS 15, “Revenue from Contracts with Customers” (May 28, 2014) has been adopted from the current first quarter. In line with this adoption, revenue is recognized upon the transfer of promised goods or services to customers in an amount that reflects the consideration to which they expect to be entitled in exchange for those goods or services. In adopting the accounting standards, in accordance with the transitional treatment, the cumulative effect of adoption of the standards was recognized on the date of the start of adoption, and was added to or subtracted from retained earnings at the beginning of the current first quarter. As a result, the balance of retained earnings at the beginning of the current first quarter decreased by ¥58,566 million. In addition, net sales and income before income taxes for the current first quarter increased by ¥43,078 million and ¥60,140 million, respectively.
(2) International Financial Reporting Standards (IFRS) 9, “Financial Instruments” Some foreign subsidiaries and affiliates have adopted the IFRS 9, “Financial Instruments” (July 24, 2014) from the current first quarter. In line with this adoption, the methods for classification and measurement of financial instruments were reviewed and impairment losses were recognized on financial assets using the expected credit loss model. In adopting the accounting standard, in accordance with the transitional treatment, the cumulative effect of adoption of the standard was recognized on the date of the start of adoption, and was added to or subtracted from retained earnings at the beginning of the current first quarter. As a result, the balance of retained earnings at the beginning of the current first quarter decreased by ¥2,288 million. The effect of these revisions on the quarterly consolidated statements of income is immaterial.
(3) Accounting Standards Board of Japan (ASBJ) Guidance No. 28, “Implementation Guidance on Tax Effect Accounting” “Implementation Guidance on Tax Effect Accounting” (ASBJ Guidance No. 28, February 16, 2018) has been adopted from the beginning of the current first quarter. In line with this adoption, treatment of taxable temporary differences relating to shares, etc., of subsidiaries in non-consolidated financial statements was changed to match the treatment of taxable temporary differences relating to shares of subsidiaries or investments in affiliates in consolidated financial statements, and a reversal of deferred tax liabilities was made. The change in accounting policies in line with the adoption of these accounting standards has been retrospectively adopted and with respect to the prior fiscal year, retrospective adoption is reflected on the consolidated financial statements. As a result, compared with the accounting prior to retrospective adoption, on the consolidated balance sheets for the prior fiscal year, deferred tax liabilities decreased by ¥12,975 million, while retained earnings increased by ¥12,975 million.
(Specific accounting policies adopted in preparing quarterly consolidated financial statements)
Current First Quarter (From April 1, 2018
To June 30, 2018) (Calculation of tax expense) Income taxes are determined based on the amount of income before income taxes for the current first quarter ended June 30, 2018, multiplied by the effective tax rate, after the adoption of tax-effect accounting, estimated for the whole fiscal year ending March 31, 2019. Deferred income taxes are included in income taxes.
(Additional information)
Current First Quarter (From April 1, 2018
To June 30, 2018) “Partial Amendments to Accounting Standard for Tax Effect Accounting, etc.” (ASBJ Statement No. 28, February 16, 2018) and other standards have been adopted from the beginning of the current first quarter, whereby deferred tax assets are presented under investments and other assets, while deferred tax liabilities are presented under long-term liabilities.

- 17 -
(For quarterly consolidated balance sheets)
1 ※1 “Machinery, equipment and vehicles, net” includes the following assets leased to others under lease agreements.
(Millions of yen)
Prior Fiscal Year
(As of March 31, 2018) Current First Quarter (As of June 30, 2018)
Assets leased to others under lease agreements (lessor) 2,677,762 2,740,734
2 Guarantees and others
Prior Fiscal Year (As of March 31, 2018)
(1) Guarantees
Guarantees Balance of liabilities guaranteed
(Millions of yen) Description of liabilities guaranteed
Employees ※33,529 Guarantees for employees’ housing loans and others
43 foreign dealers 1,144 Guarantees for loans and others
Total 34,673
※ Allowance for doubtful accounts is provided for these loans mainly based on past experience.
(2) Commitments to provide guarantees
Guarantees
Balance of commitments
to provide guarantees
(Millions of yen)
Description of liabilities guaranteed
Hibikinada Development Co., Ltd. 53 Commitments to provide guarantees for loans
Current First Quarter (As of June 30, 2018)
(1) Guarantees
Guarantees Balance of liabilities guaranteed
(Millions of yen) Description of liabilities guaranteed
Employees ※32,259 Guarantees for employees’ housing loans and others
16 foreign dealers 493 Guarantees for loans and others
Total 32,752
※ Allowance for doubtful accounts is provided for these loans mainly based on past experience.
(2) Commitments to provide guarantees
Guarantees
Balance of commitments
to provide guarantees
(Millions of yen)
Description of liabilities guaranteed
Hibikinada Development Co., Ltd. 53 Commitments to provide guarantees for loans
3 Contingent Liabilities
・Lawsuits related to Takata’s airbag inflators Mainly in the United States (“U.S.”) and Canada various putative class action lawsuits, civil lawsuits and lawsuits by states related to Takata’s airbag inflator have been filed against the Company, consolidated subsidiaries and other Original Equipment Manufacturers. The lawsuits allege that the subject airbag inflators did not function properly, and seek, among others, damages for economic losses, incurred costs, decline in the value of vehicles, and, in certain cases, personal injury as well as punitive damages. Most of the class action lawsuits in the U.S. were transferred to the U.S. District Court for the Southern District of Florida and consolidated into a multi-district litigation (“MDL”). The Company and Nissan North America, Inc. (“NNA”) have agreed to a proposed settlement that would resolve the US class actions that are pending against them in the MDL, through a number of customer-focused programs. In September 2017, the court in the MDL granted preliminary approval to the proposed settlement. The total payment amount for the settlement will be $87.9 million to be paid over four years. The settlement amount has been partially paid and the remaining discounted obligation has been recorded for $49.6 million as of the current first quarter end. In February 2018, the court in MDL granted final approval to the proposed settlement. Regarding the lawsuits other than the above, management has not recognized a provision for loss contingencies because as of the date of this report it is not possible to reasonably estimate the amount, if any, of any potential future losses because there are some uncertainties, such as these lawsuits are still in progress.

- 18 -
(For quarterly consolidated statements of cash flows) ※1 Cash and cash equivalents as of the end of the quarter are reconciled to the accounts reported in the quarterly
consolidated balance sheets as follows. (Millions of yen)
Prior First Quarter
(From April 1, 2017 To June 30, 2017)
Current First Quarter (From April 1, 2018 To June 30, 2018)
Cash on hand and in banks 1,028,908 1,068,481
Time deposits with maturities of more than three months
(3,088) ―
Cash equivalents included in securities (*) 98,685 105,899
Cash and cash equivalents 1,124,505 1,174,380
*These represent short-term, highly liquid investments readily convertible into cash held by foreign subsidiaries.
(For net assets) Prior First Quarter (From April 1, 2017 To June 30, 2017) 1. Dividends paid
Resolution Type of shares Total dividends
(Millions of yen)Dividends per share (Yen)
Record date Effective date Source of dividends
Annual general meeting of the
shareholders on June 27, 2017
Common stock
93,883 24 March 31,
2017 June 28,
2017 Retained earnings
Note: Total dividends were obtained by deducting the amount corresponding to the equity of Renault shares held by the Company.
2. Dividends which the record date fell in the period from April 1 to June 30, 2017, and the effective date of which will
be after June 30, 2017 There were no applicable items during the first quarter ended June 30, 2017.
Current First Quarter (From April 1, 2018 To June 30, 2018) 1. Dividends paid
Resolution Type of shares Total dividends
(Millions of yen)Dividends per share (Yen)
Record date Effective date Source of dividends
Annual general meeting of the
shareholders on June 26, 2018
Common stock
103,627 26.5 March 31,
2018 June 27,
2018 Retained earnings
Note: Total dividends were obtained by deducting the amount corresponding to the equity of Renault shares held by the Company.
2. Dividends which the record date fell in the period from April 1 to June 30, 2018, and the effective date of which will
be after June 30, 2018 There were no applicable items during the first quarter ended June 30, 2018.

- 19 -
(Segments of an enterprise and related information) Segment information
1. General information about reportable segments
The reportable segments of the Group are components for which discrete financial information is available and whose operating results are regularly reviewed by the Executive Committee to make decision about resource allocation and to assess their performance. Businesses of the Group are segmented into Automobile and Sales financing based on feature of products and services. The Automobile business includes manufacturing and sales of vehicles and parts. The Sales financing business provides sales finance service and leasing to support sales activities of the above business.
2. Calculation method of net sales and profits or losses by reportable segments
The accounting method for the reportable segments is the same as basis of preparation for the quarterly consolidated financial statements. The segment profits are based on operating income. Inter-segment sales are based on the price in arms-lengths transaction.
3. Changes to reportable segments and others
(1) Financial Accounting Standards Board (FASB) Accounting Standards Codification (ASC) 606, “Revenue from Contracts with Customers” and IFRS 15, “Revenue from Contracts with Customers”
As stated in the changes in accounting policies, at foreign subsidiaries and affiliates that apply US GAAP, ASC 606, “Revenue from Contracts with Customers” has been adopted, while at other foreign subsidiaries and affiliates, IFRS 15, “Revenue from Contracts with Customers” (May 28, 2014) has been adopted from the current first quarter. In line with this adoption, revenue is recognized upon the transfer of promised goods or services to customers in an amount that reflects the consideration to which they expect to be entitled in exchange for those goods or services. In adopting the accounting standards, in accordance with the transitional treatment, the cumulative effect of adoption of the standards was recognized on the date of the start of adoption, and was added to or subtracted from retained earnings for business segments at the beginning of the current first quarter. As a result, the retained earnings in the summarized quarterly consolidated balance sheets by business segments at the beginning of the current first quarter decreased by ¥58,566 million in Automobile & Eliminations. In addition, net sales and income before income taxes for the current first quarter increased by ¥43,078 million and ¥60,140 million, respectively in Automobile & Eliminations.
(2) International Financial Reporting Standards (IFRS) 9, “Financial Instruments”
As stated in the changes in accounting policies, some foreign subsidiaries and affiliates have adopted the IFRS 9, “Financial Instruments” (July 24, 2014) from the current first quarter. In line with this adoption, the methods for classification and measurement of financial instruments were reviewed and impairment losses were recognized on financial assets using the expected credit loss model. In adopting the accounting standard, in accordance with the transitional treatment, the cumulative effect of adoption of the standard was recognized on the date of the start of adoption, and was added to or subtracted from retained earnings for business segments at the beginning of the current first quarter. As a result, the retained earnings in the summarized quarterly consolidated balance sheets by business segments at the beginning of the current first quarter decreased by ¥5,671 million in Sales financing and increased by ¥3,383 million in Automobile & Eliminations. The effect of these revisions on the quarterly consolidated statements of income is immaterial.
(3) Accounting Standards Board of Japan (ASBJ) Guidance No. 28, “Implementation Guidance on Tax Effect Accounting”
“Implementation Guidance on Tax Effect Accounting” (ASBJ Guidance No. 28, February 16, 2018) has been adopted from the beginning of the current first quarter. In line with this adoption, treatment of taxable temporary differences relating to shares, etc., of subsidiaries in non-consolidated financial statements was changed to match the treatment of taxable temporary differences relating to shares of subsidiaries or investments in affiliates in consolidated financial statements, and a reversal of deferred tax liabilities was made. The change in accounting policies in line with the adoption of these accounting standards has been retrospectively adopted and with respect to the prior fiscal year, retrospective adoption is reflected on the consolidated financial statements. As a result, compared with the accounting prior to retrospective adoption, on the summarized consolidated balance sheets by business segments for the prior fiscal year, deferred tax liabilities decreased by ¥12,975 million, while retained earnings increased by ¥12,975 million in Automobile & Eliminations.
- 20 -
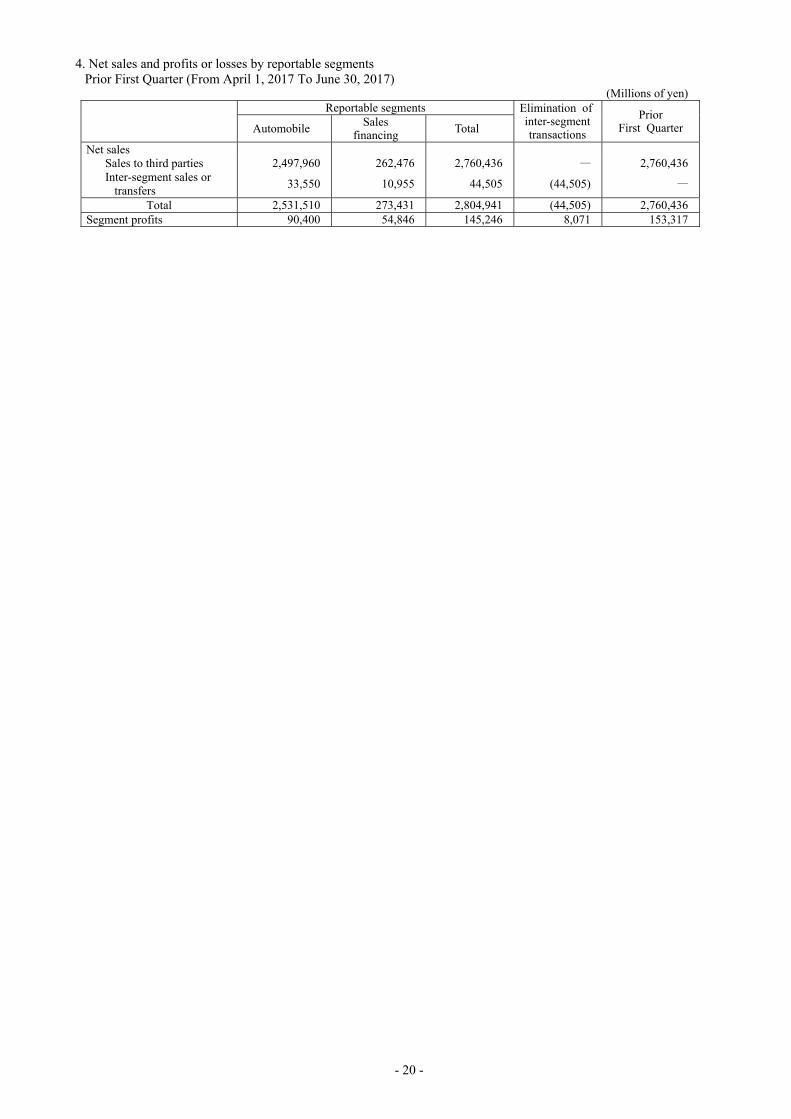
4. Net sales and profits or losses by reportable segments Prior First Quarter (From April 1, 2017 To June 30, 2017)
(Millions of yen)
Reportable segments Elimination of
inter-segment transactions
Prior First Quarter Automobile Sales
financingTotal
Net sales Sales to third parties 2,497,960 262,476 2,760,436 ― 2,760,436Inter-segment sales or
transfers 33,550 10,955 44,505 (44,505) ―
Total 2,531,510 273,431 2,804,941 (44,505) 2,760,436Segment profits 90,400 54,846 145,246 8,071 153,317

- 21 -
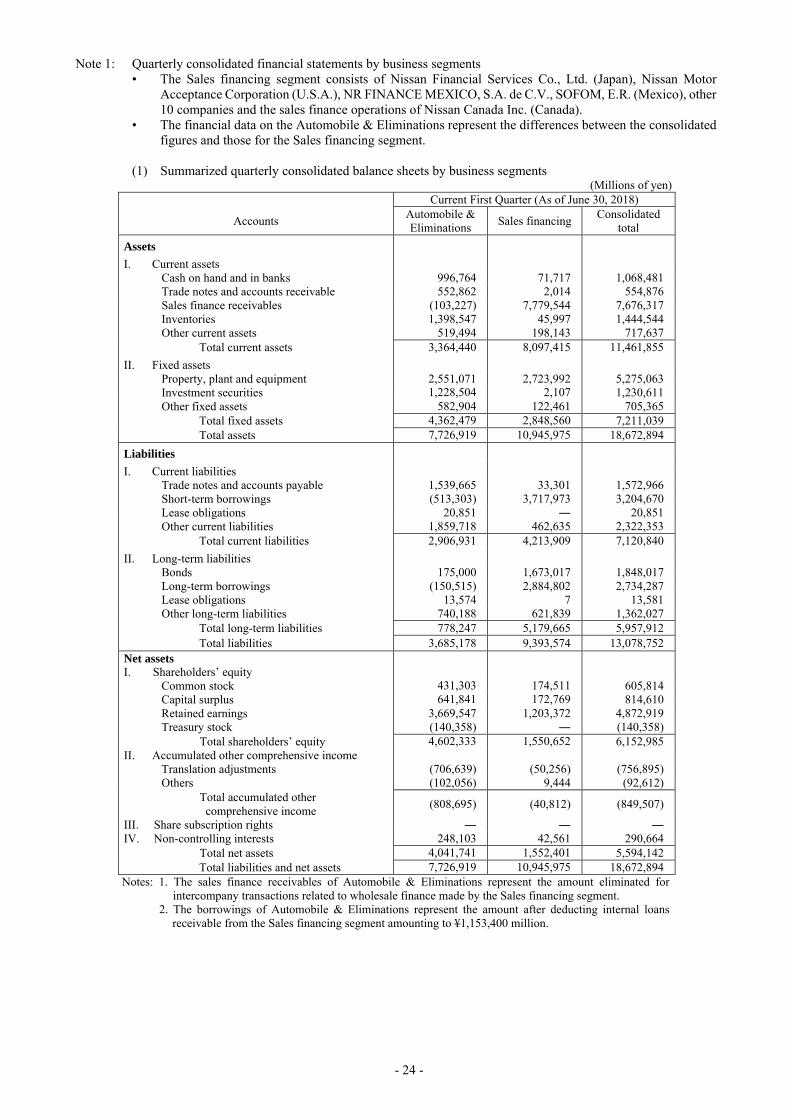
Note 1: Quarterly consolidated financial statements by business segments • The Sales financing segment consists of Nissan Financial Services Co., Ltd. (Japan), Nissan Motor
Acceptance Corporation (U.S.A.), NR FINANCE MEXICO, S.A. de C.V., SOFOM, E.R. (Mexico), other 8 companies and the sales finance operations of Nissan Canada Inc. (Canada).
• The financial data on the Automobile & Eliminations represent the differences between the consolidated figures and those for the Sales financing segment.
(1) Summarized quarterly consolidated balance sheets by business segments
(Millions of yen) Prior First Quarter (As of June 30, 2017)
Accounts Automobile & Eliminations
Sales financing Consolidated
total
Assets
I. Current assets Cash on hand and in banks 981,181 47,727 1,028,908Trade notes and accounts receivable 588,928 2,515 591,443Sales finance receivables (108,004) 7,621,112 7,513,108Inventories 1,404,208 49,152 1,453,360Other current assets 364,610 356,503 721,113
Total current assets 3,230,923 8,077,009 11,307,932
II. Fixed assets Property, plant and equipment 2,616,897 2,696,874 5,313,771Investment securities 1,152,137 23,362 1,175,499Other fixed assets 597,431 96,576 694,007
Total fixed assets 4,366,465 2,816,812 7,183,277Total assets 7,597,388 10,893,821 18,491,209
Liabilities
I. Current liabilities Trade notes and accounts payable 1,502,516 51,111 1,553,627Short-term borrowings (897,082) 4,143,351 3,246,269Lease obligations 31,293 ― 31,293Other current liabilities 1,785,858 444,606 2,230,464
Total current liabilities 2,422,585 4,639,068 7,061,653
II. Long-term liabilities Bonds 275,000 1,172,634 1,447,634Long-term borrowings (10,692) 3,200,641 3,189,949Lease obligations 17,899 7 17,906Other long-term liabilities 750,110 828,055 1,578,165
Total long-term liabilities 1,032,317 5,201,337 6,233,654Total liabilities 3,454,902 9,840,405 13,295,307
Net assets I. Shareholders’ equity
Common stock 432,905 172,909 605,814Capital surplus 784,134 33,380 817,514Retained earnings 3,559,863 843,281 4,403,144Treasury stock (140,670) ― (140,670)
Total shareholders’ equity 4,636,232 1,049,570 5,685,802II. Accumulated other comprehensive income
Translation adjustments (666,849) (33,066) (699,915)Others (89,665) 3,772 (85,893)
Total accumulated other comprehensive income
(756,514) (29,294) (785,808)
III. Share subscription rights 317 ― 317IV. Non-controlling interests 262,451 33,140 295,591
Total net assets 4,142,486 1,053,416 5,195,902Total liabilities and net assets 7,597,388 10,893,821 18,491,209
Notes: 1. The sales finance receivables of Automobile & Eliminations represent the amount eliminated for intercompany transactions related to wholesale finance made by the Sales financing segment.
2. The borrowings of Automobile & Eliminations represent the amount after deducting internal loans receivable from the Sales financing segment amounting to ¥1,529,080 million.
3. “Partial Amendments to Accounting Standard for Tax Effect Accounting, etc.” (ASBJ Statement No. 28, February 16, 2018) and other standards have been retrospectively adopted, whereby deferred tax assets are presented under fixed assets, while deferred tax liabilities are presented under long-term liabilities.

- 22 -
(2) Summarized quarterly consolidated statements of income by business segments (Millions of yen)
Prior First Quarter
(From April 1, 2017 To June 30, 2017)
Accounts Automobile & Eliminations
Sales financing Consolidated
total
Net sales 2,487,005 273,431 2,760,436Cost of sales 2,084,064 183,016 2,267,080
Gross profit 402,941 90,415 493,356Operating income as a percentage of net sales 4.0% 20.1% 5.6%
Operating income 98,471 54,846 153,317Financial income / expenses, net 7,381 24 7,405Other non-operating income and expenses, net 28,091 787 28,878
Ordinary income 133,943 55,657 189,600Income before income taxes 130,235 55,855 186,090Net income attributable to owners of parent 105,531 29,385 134,916
(3) Summarized quarterly consolidated statements of cash flows by business segments
(Millions of yen)
Prior First Quarter
(From April 1, 2017 To June 30, 2017)
Accounts Automobile & Eliminations
Sales financing Consolidated
total
I. Cash flows from operating activities Income before income taxes 130,235 55,855 186,090Depreciation and amortization 89,846 126,669 216,515Decrease (increase) in sales finance receivables 100,130 (265,297) (165,167)Others (101,415) (25,650) (127,065)
Net cash provided by (used in) operating activities
218,796 (108,423) 110,373
II. Cash flows from investing activities Purchase of investment securities (10,980) ― (10,980)Purchase of fixed assets (100,336) (7,649) (107,985)Proceeds from sales of fixed assets 4,339 7,065 11,404Purchase of leased vehicles ― (346,993) (346,993)Proceeds from sales of leased vehicles ― 148,079 148,079Others 776 11,385 12,161
Net cash used in investing activities (106,201) (188,113) (294,314)
III. Cash flows from financing activities Net increase (decrease) in short-term borrowings
(104,308) 351,189 246,881
Net change in long-term borrowings and redemption of bonds
(20,643) (84,800) (105,443)
Proceeds from issuance of bonds ― 32,952 32,952Others (102,627) ― (102,627)
Net cash provided by (used in) financing activities
(227,578) 299,341 71,763
IV. Effects of exchange rate changes on cash and cash equivalents
(3,986) (455) (4,441)
V. Increase (decrease) in cash and cash equivalents (118,969) 2,350 (116,619)VI. Cash and cash equivalents at the beginning of the
period 1,189,975 51,149 1,241,124
VII. Increase due to inclusion in consolidation ― ― ―
VIII. Cash and cash equivalents at the end of the period 1,071,006 53,499 1,124,505Notes: 1. The net increase (decrease) in short-term borrowings of Automobile & Eliminations includes the amount
of ¥258,435 million eliminated for net increase in internal loans receivable from the Sales financing segment.
2. The net change in long-term borrowings and redemption of bonds of Automobile & Eliminations includes the amount of ¥47,788 million eliminated for net decrease in internal loans receivable from the Sales financing segment.

- 23 -
Note 2: Net sales and profits or losses by region
Prior First Quarter (From April 1, 2017 To June 30, 2017) (Millions of yen)
Japan North
America Europe Asia
Other overseas countries
Total Eliminations Consolidated
Net sales (1) Sales to third
parties 494,663 1,499,185 335,013 224,374 207,201 2,760,436 ― 2,760,436
(2) Inter-segment sales
604,499 103,318 86,252 129,590 2,565 926,224 (926,224) ―
Total 1,099,162 1,602,503 421,265 353,964 209,766 3,686,660 (926,224) 2,760,436Operating income (loss)
95,194 50,811 (2,726) 17,493 (1,109) 159,663 (6,346) 153,317
Notes: 1. Regions represent the location of the Company and its group companies. 2. Areas are segmented based on their geographical proximity and their mutual operational relationship. 3. Major countries and areas which belong to segments other than Japan are as follows:
(1) North America : The United States of America, Canada and Mexico (2) Europe : France, The United Kingdom, Spain, Russia and other European countries (3) Asia : China, Thailand, India and other Asian countries (4) Other overseas countries : Oceania, Middle East, South Africa, and Central & South America excluding Mexico
Current First Quarter (From April 1, 2018 To June 30, 2018) (Millions of yen)
Reportable segments Elimination of
inter-segment transactions
Current First Quarter Automobile Sales
financingTotal
Net sales Sales to third parties 2,434,801 281,791 2,716,592 ― 2,716,592 Inter-segment sales or
transfers 28,851 11,906 40,757 (40,757) ―
Total 2,463,652 293,697 2,757,349 (40,757) 2,716,592 Segment profits 37,993 63,138 101,131 8,013 109,144
- 24 -
Note 1: Quarterly consolidated financial statements by business segments • The Sales financing segment consists of Nissan Financial Services Co., Ltd. (Japan), Nissan Motor
Acceptance Corporation (U.S.A.), NR FINANCE MEXICO, S.A. de C.V., SOFOM, E.R. (Mexico), other 10 companies and the sales finance operations of Nissan Canada Inc. (Canada).
• The financial data on the Automobile & Eliminations represent the differences between the consolidated figures and those for the Sales financing segment.
(1) Summarized quarterly consolidated balance sheets by business segments
(Millions of yen) Current First Quarter (As of June 30, 2018)
Accounts Automobile & Eliminations
Sales financing Consolidated
total
Assets
I. Current assets Cash on hand and in banks 996,764 71,717 1,068,481Trade notes and accounts receivable 552,862 2,014 554,876Sales finance receivables (103,227) 7,779,544 7,676,317Inventories 1,398,547 45,997 1,444,544Other current assets 519,494 198,143 717,637
Total current assets 3,364,440 8,097,415 11,461,855
II. Fixed assets Property, plant and equipment 2,551,071 2,723,992 5,275,063Investment securities 1,228,504 2,107 1,230,611Other fixed assets 582,904 122,461 705,365
Total fixed assets 4,362,479 2,848,560 7,211,039Total assets 7,726,919 10,945,975 18,672,894
Liabilities
I. Current liabilities Trade notes and accounts payable 1,539,665 33,301 1,572,966Short-term borrowings (513,303) 3,717,973 3,204,670Lease obligations 20,851 ― 20,851Other current liabilities 1,859,718 462,635 2,322,353
Total current liabilities 2,906,931 4,213,909 7,120,840
II. Long-term liabilities Bonds 175,000 1,673,017 1,848,017Long-term borrowings (150,515) 2,884,802 2,734,287Lease obligations 13,574 7 13,581Other long-term liabilities 740,188 621,839 1,362,027
Total long-term liabilities 778,247 5,179,665 5,957,912Total liabilities 3,685,178 9,393,574 13,078,752
Net assets I. Shareholders’ equity
Common stock 431,303 174,511 605,814Capital surplus 641,841 172,769 814,610Retained earnings 3,669,547 1,203,372 4,872,919Treasury stock (140,358) ― (140,358)
Total shareholders’ equity 4,602,333 1,550,652 6,152,985II. Accumulated other comprehensive income
Translation adjustments (706,639) (50,256) (756,895)Others (102,056) 9,444 (92,612)
Total accumulated other comprehensive income
(808,695) (40,812) (849,507)
III. Share subscription rights ― ― ― IV. Non-controlling interests 248,103 42,561 290,664
Total net assets 4,041,741 1,552,401 5,594,142Total liabilities and net assets 7,726,919 10,945,975 18,672,894
Notes: 1. The sales finance receivables of Automobile & Eliminations represent the amount eliminated for intercompany transactions related to wholesale finance made by the Sales financing segment.
2. The borrowings of Automobile & Eliminations represent the amount after deducting internal loans receivable from the Sales financing segment amounting to ¥1,153,400 million.

- 25 -
(2) Summarized quarterly consolidated statements of income by business segments (Millions of yen)
Current First Quarter
(From April 1, 2018 To June 30, 2018)
Accounts Automobile & Eliminations
Sales financing Consolidated
total
Net sales 2,422,895 293,697 2,716,592
Cost of sales 2,074,982 198,598 2,273,580
Gross profit 347,913 95,099 443,012
Operating income as a percentage of net sales 1.9% 21.5% 4.0%
Operating income 46,006 63,138 109,144
Financial income / expenses, net 12,181 (7) 12,174
Other non-operating income and expenses, net 37,968 (384) 37,584
Ordinary income 96,155 62,747 158,902
Income before income taxes 97,672 62,735 160,407
Net income attributable to owners of parent 78,165 37,664 115,829
(3) Summarized quarterly consolidated statements of cash flows by business segments
(Millions of yen)
Current First Quarter
(From April 1, 2018 To June 30, 2018)
Accounts Automobile & Eliminations
Sales financing Consolidated
total
I. Cash flows from operating activities Income before income taxes 97,672 62,735 160,407Depreciation and amortization 107,620 131,041 238,661Decrease (increase) in sales finance receivables 89,377 2,303 91,680Others (141,396) (27,073) (168,469)
Net cash provided by operating activities 153,273 169,006 322,279
II. Cash flows from investing activities Purchase of investment securities (11,237) ― (11,237)Purchase of fixed assets (98,070) (3,042) (101,112)Proceeds from sales of fixed assets 7,657 6,642 14,299Purchase of leased vehicles ― (308,450) (308,450)Proceeds from sales of leased vehicles ― 171,879 171,879Others (83,141) 181,376 98,235
Net cash provided by (used in) investing activities
(184,791) 48,405 (136,386)
III. Cash flows from financing activities Net increase (decrease) in short-term borrowings
173,476 (101,880) 71,596
Net change in long-term borrowings and redemption of bonds
11,030 (207,979) (196,949)
Proceeds from issuance of bonds ― 33,037 33,037Others (183,569) 70,419 (113,150)
Net cash provided by (used in) financing activities
937 (206,403) (205,466)
IV. Effects of exchange rate changes on cash and cash equivalents
(12,886) (276) (13,162)
V. Increase (decrease) in cash and cash equivalents (43,467) 10,732 (32,735)
VI. Cash and cash equivalents at the beginning of the period
1,140,621 65,379 1,206,000
VII. Increase due to inclusion in consolidation 1,115 ― 1,115
VIII. Cash and cash equivalents at the end of the period 1,098,269 76,111 1,174,380Notes:1. The net increase (decrease) in short-term borrowings of Automobile & Eliminations includes the amount of
¥25,395 million eliminated for net decrease in internal loans receivable from the Sales financing segment. 2. The net change in long-term borrowings and redemption of bonds of Automobile & Eliminations includes
the amount of ¥25,547 million eliminated for net decrease in internal loans receivable from the Sales financing segment.

- 26 -
Note 2: Net sales and profits or losses by region
Current First Quarter (From April 1, 2018 To June 30, 2018) (Millions of yen)
Japan North
America Europe Asia
Other overseas countries
Total Eliminations Consolidated
Net sales (1) Sales to third
parties 522,807 1,307,956 373,203 244,678 267,948 2,716,592 ― 2,716,592
(2) Inter-segment sales
584,079 128,100 74,782 130,059 4,429 921,449 (921,449) ―
Total 1,106,886 1,436,056 447,985 374,737 272,377 3,638,041 (921,449) 2,716,592 Operating income (loss)
57,636 49,472 (4,713) 17,826 (141) 120,080 (10,936) 109,144
Notes: 1. Regions represent the location of the Company and its group companies. 2. Areas are segmented based on their geographical proximity and their mutual operational relationship. 3. Major countries and areas which belong to segments other than Japan are as follows:
(1) North America : The United States of America, Canada and Mexico (2) Europe : France, The United Kingdom, Spain, Russia and other European countries (3) Asia : China, Thailand, India and other Asian countries (4) Other overseas countries : Oceania, Middle East, South Africa, and Central & South America excluding Mexico
5. Information about the impairment loss on fixed assets by reportable segments
Prior First Quarter (From April 1, 2017 To June 30, 2017) There were no significant impairment losses on fixed assets in the reportable segments for the three months ended June 30, 2017. Current First Quarter (From April 1, 2018 To June 30, 2018) There were no significant impairment losses on fixed assets in the reportable segments for the three months ended June 30, 2018.
6. Information about goodwill by reportable segments Prior First Quarter (From April 1, 2017 To June 30, 2017) There were no significant changes in the reported amounts of goodwill in the reportable segments for the three months ended June 30, 2017. Current First Quarter (From April 1, 2018 To June 30, 2018) There were no significant changes in the reported amounts of goodwill in the reportable segments for the three months ended June 30, 2018.
7. Information about the gain recognized on negative goodwill by reportable segments
Prior First Quarter (From April 1, 2017 To June 30, 2017) There were no significant gains recognized on negative goodwill in the reportable segments for the three months ended June 30, 2017. Current First Quarter (From April 1, 2018 To June 30, 2018) There were no significant gains recognized on negative goodwill in the reportable segments for the three months ended June 30, 2018.

- 27 -
8. Information about geographical area Net sales
Prior First Quarter (From April 1, 2017 To June 30, 2017) (Millions of yen)
Japan North America
Europe Asia Other
overseas countries
Total U.S.A.
414,415 1,466,077 1,187,583 350,282 286,902 242,760 2,760,436
Notes: 1. Regions represent customers’ location. 2. Areas are segmented based on their geographical proximity and their mutual operational relationship. 3. Major countries and areas which belong to segments other than Japan are as follows:
(1) North America : The United States of America, Canada and Mexico(2) Europe : France, The United Kingdom, Spain, Russia and other European countries (3) Asia : China, Thailand, India and other Asian countries(4) Other overseas countries : Oceania, Middle East, South Africa, and Central & South America excluding
Mexico, etc.
Current First Quarter (From April 1, 2018 To June 30, 2018) (Millions of yen)
Japan North America
Europe Asia Other
overseas countries
Total U.S.A.
429,459 1,277,505 1,043,971 388,756 320,852 300,020 2,716,592 Notes: 1. Regions represent customers’ location.
2. Areas are segmented based on their geographical proximity and their mutual operational relationship. 3. Major countries and areas which belong to segments other than Japan are as follows:
(1) North America : The United States of America, Canada and Mexico(2) Europe : France, The United Kingdom, Spain, Russia and other European countries (3) Asia : China, Thailand, India and other Asian countries(4) Other overseas countries : Oceania, Middle East, South Africa, and Central & South America excluding
Mexico, etc.

- 28 -
(Amounts per share)
Basic earnings per share, diluted earnings per share and the basis for calculation thereof are as follows.
Prior First Quarter (From April 1, 2017 To June 30, 2017)
Current First Quarter (From April 1, 2018 To June 30, 2018)
(1) Basic earnings per share ¥34.49 ¥29.62
(Basis for calculation) Net income attributable to owners of parent (Millions of yen)
134,916 115,829
Net income attributable to owners of parent relating to common stock (Millions of yen)
134,916 115,829
Average number of shares of common stock during the period (Thousands of shares)
3,911,574 3,910,588
(2) Diluted earnings per share ¥34.49 ¥29.62
(Basis for calculation) Adjustment in net income attributable to owners of parent (Millions of yen) ― ―
Increase in shares of common stock (Thousands of shares)
160 16
Any significant changes from the prior fiscal year-end in potential securities excluded from the computation of diluted earnings per share because they do not have dilutive effects
― ―
(Significant subsequent events)
Not applicable

- 29 -
2. Other Not applicable

- 30 -
Part II Information on Guarantors for the Company
Not applicable

(For Translation Purposes Only)
Independent Auditor’s Quarterly Review Report
July 27, 2018 The Board of Directors Nissan Motor Co., Ltd.
Ernst & Young ShinNihon LLC Designated and Engagement Partner Certified Public Accountant Koki Ito Designated and Engagement Partner Certified Public Accountant Takeshi Hori Designated and Engagement Partner Certified Public Accountant Koji Fujima Designated and Engagement Partner Certified Public Accountant Masao Yamamoto
Pursuant to Article 193-2, Section 1 of the Financial Instruments and Exchange Law of Japan, we have reviewed the accompanying quarterly consolidated financial statements of Nissan Motor Co., Ltd. (the “Company”) and its consolidated subsidiaries, which comprise the quarterly consolidated balance sheet as of June 30, 2018, the quarterly consolidated statement of income, quarterly consolidated statement of comprehensive income, quarterly consolidated statement of cash flows for the three-month period then ended, and the related notes included in “Financial Information”. Management’s Responsibility for the Quarterly Consolidated Financial Statements
The Company’s management is responsible for the preparation and fair presentation of these quarterly consolidated financial statements in conformity with the accounting principles for quarterly consolidated financial statements generally accepted in Japan, and for designing and operating such internal control as management determines is necessary to enable the preparation and fair presentation of quarterly consolidated financial statements that are free from material misstatement, whether due to fraud or error. Auditor’s Responsibility Our responsibility is to express a conclusion independently on these quarterly consolidated financial statements based on our review. We conducted our review in accordance with the review standards for quarterly financial statements generally accepted in Japan. A review of quarterly consolidated financial statements consists of making inquiries, primarily of management and persons responsible for financial and accounting matters, and applying analytical and other quarterly review procedures. A review is substantially less in scope than an audit conducted in accordance with auditing standards generally accepted in Japan. We believe that the evidence we have obtained is sufficient and appropriate to provide a basis for our conclusion. Auditor’s Conclusion
Based on our review, nothing has come to our attention that causes us to believe that the accompanying quarterly consolidated financial statements do not present fairly, in all material respects, the consolidated financial position of Nissan Motor Co., Ltd. and its consolidated subsidiaries at June 30, 2018, and the consolidated results of their operations and their cash flows for the three-month period then ended in conformity with the accounting principles for quarterly consolidated financial statements generally accepted in Japan.
Other Matter
We have no interest in the Company which should be disclosed in compliance with the Japanese Certified Public Accountants Law. Notes: 1. The above is a digitization of the text contained in the original copy of the Quarterly Review Report of Independent Auditors, which is in the custody of the Company—the submitter of this quarterly securities report. 2. The XBRL data is not included in the scope of Quarterly Review.

【Cover】
【Document Submitted】 Confirmation Note
【Article of the Applicable Law Requiring
Submission of This Document】
Article 24-4-8, Paragraph 1 of the Financial Instruments and
Exchange Law
【Filed to】 Director, Kanto Local Finance Bureau
【Date of Submission】 July 30, 2018
【Company Name】 Nissan Jidosha Kabushiki-Kaisha
【Company Name (in English)】 Nissan Motor Co., Ltd.
【Position and Name of Representative】 Hiroto Saikawa, President
【Position and Name of Chief Financial
Officer】
Hiroshi Karube, Chief Financial Officer
【Location of Head Office】 2, Takaracho, Kanagawa-ku, Yokohama-shi, Kanagawa
【Place Where Available for Public
Inspection】
Tokyo Stock Exchange, Inc.
2-1, Nihonbashi Kabutocho, Chuo-ku, Tokyo
1. Accuracy of the Descriptions in This Quarterly Securities Report Hiroto Saikawa, President of Nissan Motor Co., Ltd., and Hiroshi Karube, Chief Financial Officer have confirmed that this Quarterly Securities Report “Shihanki-Houkokusho” for the first quarter (from April 1, 2018 to June 30, 2018) of the 120th Fiscal Term is reasonably and fairly described in accordance with the Financial Instruments and Exchange Law.
2. Special Affairs
There are no noteworthy matters that are pertinent to this quarterly securities report.