nine months 2020 financial and operating results presentation
TRANSCRIPT

Nine Months 2020 Financial and Operating Results
Presentation
5th November 2020

2
3

Nationwide
Fiber
Rollout &
Migration
5G Network
Rollout &
Devices
BEING LASER-FOCUSED
Customer-driven Product
and Service Innovations
Close to
99% of
Cell Sites
are LTE-
Enabled
4

Most extensive fiber
footprint in the country395,000 kilometers of Fiber cables laid, up to
8.3 million Homes passed, and 3.84M Ports
Nationwidest
mobile data coverage9,892 Cell Sites, 56,799 Base Stations, 25 Core
& data centers, and 3 cable landing stations
96%Wireless
Population
Coverage
5

SMART
GLOBE
PHILIPPINES 16.89
19.45
14.91
Metro Manila - All Technologies
27.64 mbps
Metro Manila – Modern Chipsets
41.77 mbps
Based on analysis by Ookla® of Speedtest Intelligence® data for Q3 2020.
Ookla trademarks used under license and reprinted with permission.
CONSISTENTLY OUTPACING
LOCAL COMPETITION
Q3 2020 Ave. DL Speed
Speedtest Intelligence®
Fastest Mobile Award
Philippines Q1-Q2 2020
Q3 SPEED SCORETM
18.62
14.25GLOBE
V E R I F I E D
Fastest Fixed Internet Award
Philippines Q1-Q2 2020
Q3 SPEED SCORETM
CONVERGE ICT
30.6
SKY
GLOBE
25.67
22.89
17.26
V E R I F I E D
Speedtest™ Global Index – September 2020
6

7

Q3
INDIVIDUAL
Giga Life App, Product Launches, and
5G Commercial Rollout
HOME
Enabling Work@home and Study@home
for More Filipino Families
ENTERPRISE
Enabling eIndustries
INTERNATIONAL
Managing the Long Tail
KEY DRIVERS
8

9

P43.7B+11%vs.YAGO
+4.2B
Q3 2020 CRO REVENUE PERFORMANCE
10

21.0B+15%+2.7BVS. YAGO
Individual
10.6B+8%
+0.8BVS. YAGO
Enterprise
10.7B+16%+1.5BVs. YAGO
Home
All segments are contributing all-time high revenues
Q3 2020 CRO REVENUE PERFORMANCE
11

60.8B+15%+8.1BVS. YAGO
Individual
30.9B+6%
+1.7BVS. YAGO
Enterprise
30.3B+10%+2.7BVs. YAGO
Home
P126.5B+9%vs.YAGO
+10.4B
2020 YTD CRO REVENUE PERFORMANCE
12
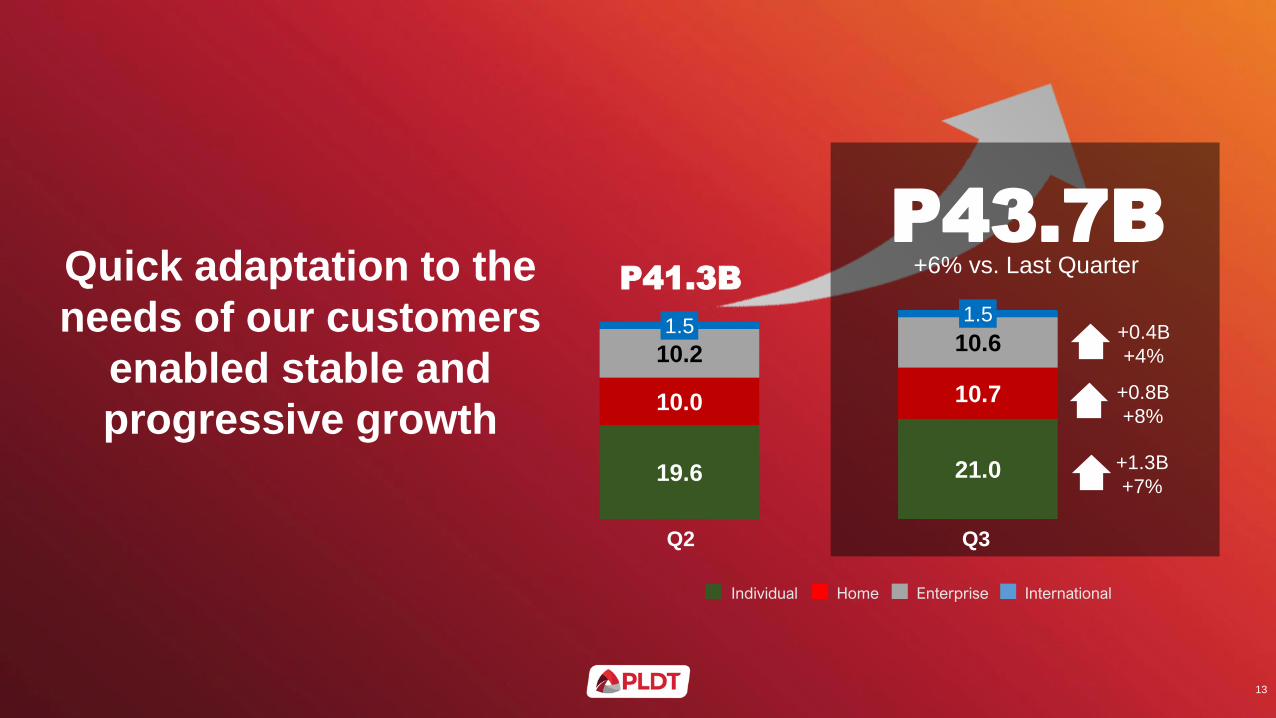
Quick adaptation to the
needs of our customers
enabled stable and
progressive growth
InternationalEnterpriseHomeIndividual
19.6 21.0
10.0 10.7
10.2 10.61.5
1.5
P41.3B
P43.7B+6% vs. Last Quarter
Q2 Q3
+0.4B
+4%
+0.8B
+8%
+1.3B
+7%
13

STRENGTHENED
POSITION IN FIXEDMARKET LEADERSHIP
IN SERVICE REVENUES
NO.1 IN WIRELESS
DATA TRAFFIC
GAINED WIRELESS
MARKET SHARE FOR 6
CONSECUTIVE QUARTERS
BIGGEST PREPAID
BRAND
NO 1. IN DATA
USERS
14

15

16

17

9M2020 Financial Highlights
18
18

PLDT Group: Service Revenues (by Customer Segment)
Individual
International and Carrier
Home
Enterprise
Consumer and Enterprise
19
(Php in bn)
Total Service Revenues
21.0bn
10.7bn
10.6bn
1.5bn
42.3bn
3Q2020
43.7bn 10%
+4.1bn
15%
+2.7bn
16%
+1.5bn
13%
+5.0bn
36%
-0.8bn
vs 3Q2019 vs 2Q2020
8%
+0.8bn
8%
3%
*
+0.8bn
* excl Mobile Domestic Inbound
-0.2bn
11% 4%
7%
+1.3bn
4%
+0.4bn
6%
+2.5bn
-0.1bn
6%
+2.4bn
All-time high
All-time high
All-time high
All-time high
All-time high

Service Revenues(net of interconnection costs)
Cash Opex, Subsidies, Provisions(ex-MRP)
EBITDA(ex-MRP)
Telco Core
PLDT Group: Financial Highlights
10%
+4.1bn
9%
+1.8bn
12%
+2.4bn
vs 3Q2019
14%
+0.9bn
Depreciation & Amortization+1.0bn
Net Financing Costs
10%
+0.6bn
33%
Reported Income 95%
+3.6bn
(Php in bn)
20
* excl Provisions: P18.1bn, stable
Provisions
43.7bn
3Q 2020
21.0bn
22.7bnMargin: 51%
7.1bn
2.9bn
7.4bn
10.9bn
2.5bn

PLDT: Service Revenues (by Customer Segment) 2020 vs 2019
Individual
International and Carrier
Home
Enterprise
Consumer and Enterprise
21
Total Service Revenues
39.9bn 39.8bn
9M 2020
126.6bn
60.8bn
30.3bn
30.9bn
4.6bn
9%
+10.3bn
15%
+8.1bn
6%
+1.7bn
10%
+2.7bn
11%
+12.6bn
32%
-2.2bn
vs 9M 2019
* excl Mobile Domestic Inbound
vs 2019
(Php in bn)
21.0bn
10.7bn
1.5bn
42.3bn
3Q 2020
43.7bn
+15% +2.7
+8% +0.8
+16% +1.5
+13% +5.0
-36% -0.8
+10% +4.1
10.6bn
10%
-0.5bn
2Q 20201Q 2020
19.6bn
10.0bn
10.2bn
1.5bn
41.3bn
20.2bn
9.6bn
1.6bn
41.5bn
10.1bn
+12% +2.1
+8% +0.8
+9% +3.4
+7% +2.6
-34% -0.8
+7% +0.6
+20% +3.3
+3% +0.3
+5% +0.5
+11% +4.1
-25% -0.5
+9% +3.5
121.9bn
All-time high
All-time high
All-time high
All-time high
All-time high
All-time high
All-time high
All-time high
All-time high All-time high

Service Revenues(net of interconnection costs)
Cash Opex, Subsidies, Provisions(ex-MRP)
EBITDA(ex-MRP)
Telco Core
126.6bn
149.4bn
9M2020
PLDT Group: Financial Highlights
9%
+10.3bn
8%
+4.7bn
9%
+5.6bn
vs 9M2019
8%
+1.6bn
Depreciation & Amortization 32.1bn+3.5bn
Net Financing Costs 6.7bn
12%
+1.5bn
29%
Reported Income 149.4bn19.7bn 23%
+3.7bn
(Php in bn)
22
* excl Provisions: P54.2bn, +P2.1bn or +4%
Provisions 6.4bn
66.0bnMargin: 52%
60.6bn*
21.0bn

14.2 14.4 15.1 16.5 16.9 17.6 18.2 19.4 20.2 19.6 21.0
9.0 9.2 9.39.8 9.8 9.5 9.8 10.0 10.1 10.2 10.68.8 9.1 9.19.1 9.1 9.2 9.2
9.6 9.6 10.010.7
3.5 3.5 2.72.2 2.2 2.3 2.3
2.3 1.6 1.51.5
1Q18 2Q18 3Q18 4Q18 1Q19 2Q19 3Q19 4Q19 1Q20 2Q20 3Q20
Individual Enterprise Home International Others23Note: Net of interconnection costs
Consolidated Service Revenues: All-time highs for 3Q20
9%
+3.3bn
10%
+4.1bn
35.6 36.3 36.337.6 38.0 38.7
+0.5bn
39.6 41.4
1%
YoY % +7% +7% +9% +10% +9% +7% +10%
QoQ % +1% +2% +2% +5% --- --- +6%
41.5
+16%
+8%
+15%
-36%
Y-o-Y %
+7%
+4%
+8%
-4%
(Php in bn)
41.3
149.4bn 9%
+10.3bn
9M20: P126.6bn
(vs 9M2019)
All-time high
43.7
vs 3Q17
All-time
high
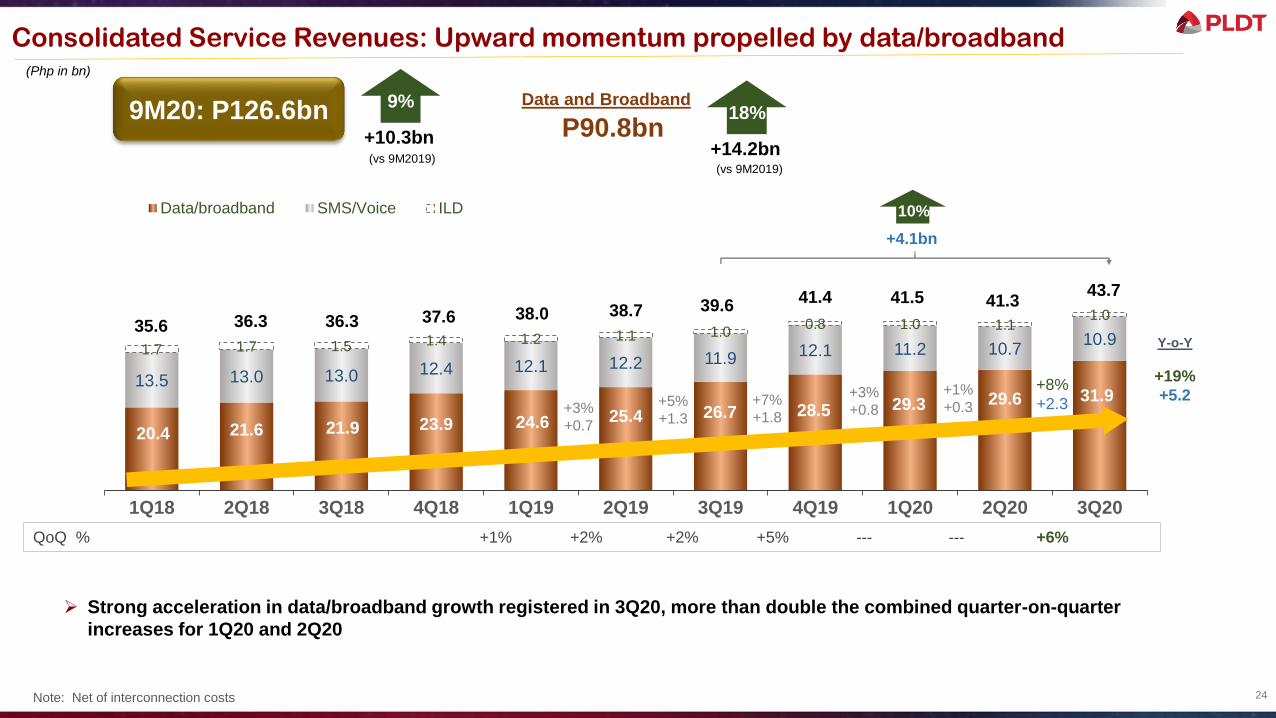
20.4 21.6 21.9 23.9 24.6 25.4 26.7 28.5 29.3 29.6 31.913.5 13.0 13.0 12.4 12.1 12.2 11.9 12.1 11.2 10.7
10.91.7 1.7 1.5 1.4 1.2 1.1 1.0
0.8 1.0 1.11.0
1Q18 2Q18 3Q18 4Q18 1Q19 2Q19 3Q19 4Q19 1Q20 2Q20 3Q20
Data/broadband SMS/Voice ILD
Consolidated Service Revenues: Upward momentum propelled by data/broadband
24Note: Net of interconnection costs
35.6 36.3 36.3 37.6 38.0 38.7 39.641.4 41.5
Y-o-Y
+8%
+2.3
10%
+4.1bn
➢ Strong acceleration in data/broadband growth registered in 3Q20, more than double the combined quarter-on-quarter
increases for 1Q20 and 2Q20
(Php in bn)
18%
+14.2bn(vs 9M2019)
41.3
+19%
+5.2
43.7
Data and Broadband149.4bn 9%
+10.3bn
9M20: P126.6bn
(vs 9M2019)
P90.8bn
QoQ % +1% +2% +2% +5% --- --- +6%
+1%
+0.3+3%
+0.8+7%
+1.8+5%
+1.3+3%
+0.7

Data and broadband
25
90.8bn 18%
+14.2
% to total: 72% Consumer + Enterprise 74%*
Individual: 74%
Home: 80%
Enterprise: 69%
Domestic voice(fixed and mobile)
149.4bn27.4bn
-2.2
% to total: 22%
SMS
149.4bn5.3bn
-1.3
International voice(fixed and mobile)
149.4bn3.1bn 10%
-0.4
(Php in bn)
% to total: 4% % to total: 2%
9M 2020 Service Revenues: Data accounts for 72% of total, remains the main driver of growth
19%8%
* excluding International & Carrier
Mobile Internet**
31%45.2bn
Home Broadband
14%23.9bn
Corp. Data
15.6bn
Data Center
3.2bn
+10.8 +3.0
149.4bn 9%
+10.3bn
P126.6bn
3%
+0.5
(2020 vs 2019)
** Part of Mobile Data (incl. mobile broadband and other data): P48.1bn, +28% or +P10.6bn
3%
+0.1

19.421.0
60.366.0
Higher
Svc Rev(net of IC)
Higher
Cash
Opex/CoS
-2.0+10.3
9M 2019 9M 2020
26
Consolidated EBITDA (ex-MRP) and Telco Core: 9M 2020 vs 9M2019
EBITDA margins
51% 51%
+5.6
Higher
EBITDA
-3.5
Higher
Depreciation
+1.0
Higher
Equity /
Others
Higher
Provisions
-2.6
-1.5
Higher
Fin. Cost,
net
(Php in bn)
Higher
Subsidies
-0.2
9%
+5.6bn
8%
+1.6bn
9M 2019 9M 2020
EBITDA(ex-MRP)
Telco Core
-0.1
Higher
Prov. for
Income tax

17.4 17.4 17.1 16.4
20.1 19.9 20.422.8
21.6 21.6 22.7
1Q18 2Q18 3Q18 4Q18 1Q19 2Q19 3Q19 4Q19 1Q20 2Q20 3Q20
Consolidated EBITDA (ex-MRP): Quarter average of P22.0bn higher than 2019 average
27
+2.4bn
12%
Margin:
47% 46% 45% 43% 52% 50% 50% 54% 52% 52% 51%
Qtr ave: P20.8bn
Note: PFRS16 starting 1Q19
(Php in bn)
Qtr ave: P17.1bn Qtr ave: P22.0bn
149.4bn 9%
+5.6bn
9M20: P66.0bn
(vs 9M2019)
+5%
+1.2

➢ During the lockdown, PLDT offered deferred payment options (up to 6-months interest-free) to its Home and
Enterprise customers
▪ Resulted in drop in cash collections
✓ As low as 34% of pre-ECQ collection for PLDT in April 2020
o Starting June 2020, collections have exceeded pre-ECQ daily collection levels
✓ YTD average collections of approx. 86%
o Expected to increase to over 90% by the end of the 4th quarter
➢ As a result of the decline in collection levels and in view of the weak economic outlook, our Expected Credit
Loss (ECL) under PFRS9 is higher
▪ Provisions in SepYTD20 amounted to P6.4bn -- higher by P2.6bn or 67% year-on-year
✓ From P3.5bn at end June 2020, an additional P2.9bn booked in 3Q20
➢ Collections have started to improve but are still expected to remain below 2019 efficiency levels by year-end
➢ Provision for 4Q20/FY20 under careful review to consider improvement in actual collections
▪ ECL provisions could be reduced should the economic outlook turn positive next year
Collections and Provisions
28

6.8 6.4 5.94.9
7.26.0 6.2
7.76.9 7.0 7.1
1Q18 2Q18 3Q18 4Q18 1Q19 2Q19 3Q19 4Q19 1Q20 2Q20 3Q20
Telco Core Income: FY20 earnings poised to surpass 2019
29
+2%
+0.1
Qtr ave: P6.8bn
(Php in bn)
149.4bn 8%
+1.6bn
+0.9bn
14%
Qtr ave: P7.0bn
9M20: P21.0bn
(vs 9M2019)
Qtr ave: P6.0bn
+2%
+0.1
FY19: P27.1bn

PLDT Group: Telco Core and Reported Income
Telco Core + Voyager
Telco Core
30
(Php in bn)
Reported Income
19.7bn
21.0bn
9M 2020
19.7bn 23%
+3.7bn
8%
+1.6bn
Voyager Loss (1.3bn) -0.3bn
Net Loss in FV Investment - iflix (0.6bn)
Net Loss in FV Investment – Rocket Internet (0.1bn)
MRP (0.1bn)
Net forex gains 1.0bn
Rocket Internet
✓ On 1 Sept, public delisting via
self tender offer at €18.57/share
announced
o PLDT completed sale of
1.9mn shares held ahead of
public delisting (P2.0bn or at
average of €18.64)
▪ 1.4mn shares for P1.5bn
(average of €18.66/share) in
Sept 2020
▪ 0.5mn shares for P0.5bn
(average of €18.59/share) in
Oct 2020)
Realized loss on sale – Rocket Internet (0.3bn)
7%
+1.3bn

➢US$ denominated: 16%
(YE19: 9%, 1H20: 19%, incl. US$ bond)
➢Unhedged: 3% or US$0.1bn taking into account
our hedges and $ cash allocated for debt
➢ 88% are fixed-rate loans, while 12% are floating-
rate loans
▪ Post-interest rate swaps: 89% fixed, 11%
floating
➢Average interest cost (pre-tax): 4.69%
(FY19: 4.8%; 1H20: 4.78%)
Net Debt/EBITDA:
1.9x 2.0x 2.13x
PLDT Group: Debt Profile
31
Debt Balance
3.4 3.8 4.6
1.0 0.5 0.72.4 3.3 3.9
2018 2019 9M2020Debt Balance Cash & Short-term Investments Net Debt
* LTM (last twelve months), ex-MRP ** Total debt based on nominal debt amount
**
(US$ in billions)
Debt Maturities (gross)
20252020 2021 2022 2024 2023 2026 to 2050
Debt maturities to total debt:
2% 10% 8% 12% 7% 9% 52%
(US$ in millions, 30 September 2020)
Gross Debt:
US$4,626mn
Net Debt
US$3,907mnGross Debt
US$4,626mn
94 468 363 549 308 442
2,402
➢ Issued $600mn dual tranche Senior Unsecured Notes on June 23 (listed on the SGX on June
24)
▪ US$300mn long 10-year bond at 2.5%, US$300mn 30-year bond at 3.45%
▪ To-date, US$120mn used to pay down USD debt maturities in August and September, and
US$116mn for capex payments
▪ Balance to be used for prepayment of 2022 loans by 4Q20, capex and debt maturities in 2021
(including P12.4bn of peso retail bonds)
➢ As of end September 2020, P14bn out of P40bn signed long-term bank facilities remained
undrawn
➢ Debt maturities continue to be well spread out
▪ Issuance of 30-year bond extended debt maturity profile such that 52% of total debt to mature
beyond 2025
➢ Operating cash flows to be supplemented by:
▪ Proceeds from sale of remaining 1.9mn Rocket Internet shares of approx. P2.0bn
➢ PLDT ratings remain at investment grade: S&P (BBB+), Moody’s (Baa2), Fitch (BBB)
Net Debt-to-EBITDA*
2.13x(1H20: 2.19x)

➢ Capex of P43.2bn as of end Sept 2020 includes:
▪ Network/IT capex: P33.3bn
▪ Business capex: 7.4bn
▪ Data center/others: 2.4bn
➢ Anticipating capex of at least P70bn for 2020 – similar to 2019 level despite
mobility challenges during the quarantine period; possibly higher depending
on actual home broadband installations
✓ Network/IT capex: P52bn
✓ Business capex: 13bn
✓ Data centers/others: 6bn
▪ Capex is “demand driven” resulting in a faster monetization of the investment
✓ Network/IT capex to provide capacity to support exponential rise in mobile data
traffic
✓ Business capex for last mile/CPE for new home broadband customers
▪ Projects being prioritized
✓ Continued LTE coverage and capacity expansion
▪ Completed LTE upgrade of 100% of Visayas base stations in October 2020
✓ Transport/backhaul expansion and transformation: fibering the base stations,
extend fiber footprint for capacity and resiliency
✓ Ongoing work to add 37Tbps to existing 55Tbps backbone network capacity
✓ Port build out: approx. 500K (on-going) to supplement 1.4mn port inventory
✓ ADSL upgrade to fiber: 650K homes in 18 months
o Upsell opportunity
o CX improvement, opex reduction from lower trouble tickets
✓ Additional cell sites by YE20: + close to 2000 owned; +180-200 c/o ITCs
✓ 5G base stations in major population areas
▪ Capex-to-service revenues for FY20 anticipated at around 40-41%
48.2 53.2
6.311.9
2018 2019
39.933.3
8.9 7.4
9M19 9M20
32
PLDT Group: Consolidated Capex
58.5
Capex to Service Revenues:
38% 45% 45% 34%
25%
+5.0
P432.0bn
Technology
& Others
+5.6
+8.8
Business
Capex
52.260.9
+14.4bn
72.9
53.4
19%
-10.3bn
43.1
44.5
-6.6
-1.4
-8.8
EBITDA (exMRP) less Capex:
P9.8bn P10.2bn P6.9bn P22.8bn
Network/IT
Business Capex
(Php in bn)
35.7
Total Capex Investments(2011 to 9M 2020)
Capex 2020 Forecast At least P70bn

➢ 0.9mn fiber + 0.5mn VVDSL (V-Fiber)
ports available at 3Q2020
(1 port = 1 customer)
TOTAL CAPACITY (Fiber)(Million Ports)
9.8 11.513.8
15.7
2017 2018 2019 3Q20
Fixed Fiber and Wireless Network: Selected Highlights
Extensive Fixed Network Rollout
TOTAL HOMES PASSED(Million Homes)
1.002.62
3.50 3.81
2017 2018 2019 3Q20
175.0244.0
322.4394.7
2017 2018 2019 3Q20
TOTAL FIBER FOOTPRINT(Thousand Cable Kilometers Laid)
Wireless Network Rollout (LTE and 3G)
(in thousands)
8.716.2
24.6 28.7
2017 2018 2019 3Q20
3G BTSLTE/4G BTS
+2.0
+14%
+22%+9%
+4.1
➢ Addl 36K kms of fiber from end 2Q20 or about 50% of
the total roll out in 2020
➢ Building out 81K kms more (31K kms by YE20 and 50K
in 2021)
33
4.0
6.3 7.28.3
2017 2018 2019 3Q20
➢ Additional 1,565 4G BTS from 2Q20 ➢ 754 3G BTS were added from 2Q20
Coverage
Population coverage at
end Sep 2020:
➢ 95% 4G+3G
➢ 96% 2G+3G+4G
5G BTS
279
3Q20
(in thousands)
Latched Devices
Nationwide
➢ LTE/4G: 71% (MM: 80%)
➢ 3G: 10% (MM: 8%)
➢ 2G: 19% (MM: 12%)
On-going build out of additional 500K
ports
Most extensive in the Philippines,
nationwide reach

14.25
18.62
Smart Globe
Ookla Average Mobile Download Speeds (Mbps)Nationwide
Smart and PLDT still the fastest Mobile and Fixed network providers in the country
16.68
27.6425.3
41.77
Metro Manila DL Speeds (Mbps)
Average DL Speeds(All Technologies)
Average DL Speeds (Devices with Modern
Chipsets)
17.26
22.89
25.67
30.6
PLDT Converge Sky Globe
Ookla Average Fixed Download Speeds (Mbps)Nationwide
Based on Ookla Speedtests as of Q3 2020
Devices using modern chipsets are able to utilize the latest technologies
* Based on analysis by Ookla® of Speedtest Intelligence® data average download speeds comparing all technologies to results from devices with modern chipsets Metro Manila for Q3 2020 and Sept 2020. Ookla trademarks used under license and reprinted with permission.
➢ Smart already delivers speeds at close to 30Mbps in Metro Manila
▪ When the right devices are used, customers are able to experience even
higher speeds
➢ Network capability can be maximized if matched with the right device
capability.
Sept 2020
17.73 28.81 27.12 42.56
34

Smart continues to improve its Quality of Experience and leads across regions
based on Opensignal
3535
33
31.3
35.7
35.7
45.1
46
49.2
49.9
49.5
65.7
Smart Globe
72.6
70.2
79
79.1
89.8
82.3
84.6
83.1
84
90.6
Mindanao
Visayas
South Luzon
North & CentralLuzon
NCR
Smart Globe
4G/LTE Availability Score(2018Q4 vs 2020Q3)
Video Experience Score(2018Q4 vs 2020Q3)
(+10.8%)
(+41.5%)
(+24.9%)
(+20.8%)
(+34.5%)
(+20.4%)
(+26.3%)
(+24.8%)
(+28.6%)
(+20.4%)
Independent data referenced with consent from Opensignal “The mobile network experience across five regions in the Philippines has greatly improved since Q4 2018 – October 2020”.
(% Time) (0-100)
H
H
H
H
H
H
H
H
H
H H
H
H
H
H
H
H
H
H
H

2018 – 2020 umlaut Mobile Wireless Benchmark Trend
Based on umlaut (P3) Global Telco Industry QoS Tests:
Smart winning by large margin vs competition while standards becomes tougher each year
2019 & 2020 Smart Best in Test Public Award
Consistently Winning 2019-Onwards
Voice QOS
Video QOS
Data QOS
Crowd QOE
➢ Smart leveling up its targets
▪ Aiming to score 900 in 1.5 – 2 years to align with Tier 1 global telco operators
▪ To benchmark vs regional peers
36

PLDT Group: Latest views for 2020
37
Capex At least P70bn
➢ Level similar to 2019 despite slowdown during lockdown
➢ Network rollout ramped up following easing of the
lockdown and improvement of permitting process
➢ Driven by demand, i. e., increase in mobile traffic/usage,
acceleration of home broadband installations
Revenues: Upward
momentum to
continue
FY20 to be a historical high:
strong 9M20 + anticipated seasonal lift in 4Q
➢ Positive outlook for all customer segments unchanged
▪ Robust demand for data expected to grow further
▪ Impact of the pandemic/lockdown on the economy,
employment being monitored
Dividend Payout: 60%To take into account:
FCF, capex, net-debt-to-EBITDA
Telco Core Poised to surpass 2019 level

Other Details
38

➢ Following a moderate dip in 2Q20 due to quarantine/lockdown, resurgence in revenue growth in 3Q20 reaching an all-time high of P21.0bn
▪ Daily top-up trends show consistent month-on-month upward trajectory since April 2020 with each month hitting historical highs vs previous years
▪ Mobile traffic grew to 2,114PB at 9M20, 91% higher year-on-year with 3Q20 traffic at 769PB up 76% vs 3Q19
➢ Growth driven by data which contributed 74% to total revenues in 9M20 from 68% in 9M19 and 59% in 9M18
▪ 76% of handsets on the network are smartphones (68% LTE; 8% 3G) – from 60% in 9M19
▪ Active data users at 36.8mn at end September 2020
➢ Sustained improvements in revenues underpinned by undisputed network leadership that ensures good CX, combined with simplified offers
anchored on the GIGA value proposition which addresses customer passion points
➢ Expanded initiatives to encourage stronger data adoption and usage among TNT and Sun subscribers
▪ Sun rebranding -- “The Sun you love is now Smart” – access to GIGA Life, Smart app, promos, retailers, without need to change number
▪ GIGA Life (app, promos) accessible to TNT subscribers
14.2 14.4 15.1 16.5 16.9 17.6 18.2 19.4 20.2 19.621.0
1Q18 2Q18 3Q18 4Q18 1Q19 2Q19 3Q19 4Q19 1Q20 2Q20 3Q20
Individual: Sustained double-digit year-on-year growth
39
Note: Net of interconnection costs
+7%+1.3
15%
+2.7bn
(Php in bn)149.4bn
2018: P60.3bn 2019: P72.1bn
149.4bn 15%
+8.1bn
9M20: P60.8bn
Qtr ave: P15.1bn Qtr ave: P18.0bn
(vs 9M2019)
All-time High
Qtr ave: P20.3bn
Historical high

8.8 9.1 9.1 9.1 9.1 9.2 9.2 9.6 9.6 10.010.7
1Q18 2Q18 3Q18 4Q18 1Q19 2Q19 3Q19 4Q19 1Q20 2Q20 3Q20
Home: Break-out performance in 3Q20
40
Note: Net of
interconnection costs
16%
+1.5bnDOLE Order
2018: P36.1bn 2019: P37.2bn
(Php in bn)
149.4bn 10%
+2.7bn
9M20: 30.3bn
+8%+0.8
Qtr ave: P9.3bn Qtr ave: P10.1bn
Historical high
(vs 9M2019)
Qtr ave: P9.0bn
➢ Acceleration in revenue growth with year-on-year rise in 9M20 service revenues of P2.7bn already at 2.6x higher than P1.1bn full year increase
in 2019
▪ Significant improvement in installation capability from an average of 40K/month in 2019 to new connects of 72K in 3Q20
▪ Demand boosted by continuing work-from-home and study-from-home requirements and customer requests for upgrades
➢ Marked improvement in HOME performance and outlook
▪ Installation → aiming for 100K/month to address unserved applications
▪ Build out of port capacity → additional 500K ports to be added to end September inventory of 1.4mn ports
▪ Fixed wireless home broadband to complement fiber offer: areas with no fiber yet and/or market segment at lower price point
✓ Gross adds of 198K in 3Q20 – nearly double gross adds in 1Q20➢
➢ As the largest fixed and wireless integrated telco in the Philippines, PLDT well positioned to take a significant share of home broadband
market
▪ As of end Sept 2020, only 3.8 million homes have fixed broadband while another 3.4 million are on fixed wireless, with potential for upgrade to fiber
All-time High

9.0 9.2 9.3 9.8 9.8 9.5 9.810.0 10.1 10.2
10.6
1Q18 2Q18 3Q18 4Q18 1Q19 2Q19 3Q19 4Q19 1Q20 2Q20 3Q20
Enterprise: Despite economic impact of COVID-19, 4% q-o-q, 8% y-o-y growth in 3Q20
41
Note: Net of interconnection costs
2018: P37.4bn 2019: P39.1bn
(Php in bn)
149.4bn 6%
+1.7bn
9M20: 30.9bn 8%
+0.8bn
+4%+0.4
Qtr ave: P9.8bn Qtr ave: P10.3bn
➢ Five quarters of sequential revenue increases, with acceleration of growth to 4% in the third quarter
➢ Although some sectors (e. g., SMEs) were negatively affected by COVID-19 lockdown, many businesses continued
to operate using work-from-home arrangements, digital platforms
▪ Employees equipped with remote working tools/connectivity
▪ Increase in e-commerce/digital transactions
➢ Pandemic accelerating Digital Transformation
▪ Pushing businesses to reinvent themselves (eLearning, eHealth, eCommerce, etc.) enabled by technology solutions
(fixed and wireless connectivity solutions, data center, cloud services, cybersecurity and managed services)
(vs 9M2019)
Qtr ave: P9.3bn
Historical high
All-time High

2.27 2.25 1.82 1.80 1.75 1.74 1.64 1.60 1.61 1.53 1.47
1Q18 2Q18 3Q18 4Q18 1Q19 2Q19 3Q19 4Q19 1Q20 2Q20 3Q20
International/Carrier: Declines moderating
42
36%
-0.8bn
2018: P11.9bn 2019: P9.1bn
-4%-0.1
(Php in bn)
9M20: P4.6bn 32%
-2.2bn
10%
-0.5bn
(excl Mobile Domestic Inbound)
Year-on-year
3.47 3.482.74
2.16 2.311.61
2.342.18 2.311.53
Reduced mobile
interconnect fees for SMS
and Voice (1 Sept. 2018)
Zero mobile interconnect fees
for SMS and Voice
(1 Jan. 2020)
➢ Excluding mobile domestic inbound revenues, organic revenues for 9M20 of P4.6bn lower by P0.5bn year-on-year
▪ Mainly due to the decline in international roaming following restricted travel because of the pandemic
Organic
Mobile Domestic Inbound
(vs 9M2019) (vs 9M2019)
1.47
11%
-0.2bn
(excl Mobile Domestic Inbound)

43
PLDT Group Subscriber Base
Note: Subscriber count impacted by NTC directive to extend prepaid load validity to 1-year effective 1 Jan and July 2018
end September 2020
78.2mnTotal Subscribers
(in mn)
Mobile 72.4mn
Cellular - Prepaid
Cellular - Postpaid
69.2mn
2.1mn
Fixed Line 3.0mn
Fixed
Fixed Wireless
2.2mn
0.6mn
vs end 2019
8%
Broadband 2.8mn 31%
+0.3mn
+0.2mn
1%
-0.7mn
-0.2mn
+0.2mn
+0.7mn
Mobile Broadband (dongles) 1.1mn
71.3mn-0.1mn
Net adds of 82K from end 2Q20
Gross adds of 198K in 3Q20 –
2x higher than 1Q20
Gross adds of 218K in 3Q20 –
1.7x higher than 2Q20
Offset by catch up churn in 3Q20
-0.5mn
+0.4mn

PayMaya: Leading Digital Payments Provider
Only end-to-end digital payments enabler connecting enterprises and consumers
44
Government
MSMEs
Large Enterprise
Unbanked
Underbanked
Banked
Enterprise Consumer
Ecosystem
Registered Customers across PayMaya platforms26M+
Nation-widest digital payments
touchpoints - add money, cash-out,
remit, pay
150K+Largest payments processor for key industries
including “everyday” merchants
such as groceries, gas stations,
pharmacies, quick-service restaurants,
and e-Commerce sites
#1Widest digital remittance network
with pervasive presence in 92% of
all cities/municipalities
33K

PayMaya: Transformative Payments for the Better Normal
Digitizing industries including “everyday” merchants, enabling consumers as the economy reopens
45Confidential and Proprietary
• More than 1,400% growth in unique
merchants across segments
• Over 60 gov’t units enabled, posting
more than 3,000% YoY growth in transactions for 9M 2020
• Enabling MSMEs to get a QR within 48
hours with PayMaya Negosyo, supporting MSMEs through its grassroots Sulong
Negosyo program
• Rapidly transforming agriculture,
transportation, religious, and school
communities with cashless ecosystems
• Powering over P4.5-billion in citizen aid
disbursements direct to PayMaya
accounts of beneficiaries

Appendix
46

Mobile Subscribers by Category:
Mobile Subscribers by Brand:
(1) Includes Mobile Broadband subscribers
Subscriber Base: Mobile
47
Mobile Subscriber Base (1)
Prepaid 70,027,763 67,738,421 70,590,758 70,721,789 69,012,106 (694,026) -1% 1,015,657 1% 2,289,342 3%
Smart Prepaid 23,983,929 23,413,304 24,830,033 25,866,195 25,240,171 (1,882,266) -7% (1,256,242) -5% 570,625 2%
Sun Prepaid 5,597,613 5,686,892 6,889,658 6,547,231 6,152,209 (949,618) -15% (554,596) -9% (89,279) -2%
TNT 40,446,221 38,638,225 38,871,067 38,308,363 37,619,726 2,137,858 6% 2,826,495 8% 1,807,996 5%
Postpaid 2,344,400 2,447,068 2,484,869 2,396,366 2,439,182 (51,966) -2% (94,782) -4% (102,668) -4%
Smart Postpaid 1,457,452 1,489,015 1,476,694 1,469,407 1,485,550 (11,955) -1% (28,098) -2% (31,563) -2%
Sun Postpaid 886,948 958,053 1,008,175 926,959 953,632 (40,011) -4% (66,684) -7% (71,105) -7%
Total Mobile Subscribers 72,372,163 70,185,489 73,075,627 73,118,155 71,451,288 (745,992) -1% 920,875 1% 2,186,674 3%
Sep-203Q20 vs YE19
Net Adds (Reductions)
3Q20 vs 2Q20Mar-20 Dec-19 Sep-19Jun-20
3Q20 vs 3Q19
Mobile Subscriber Base (1)
Smart 25,441,381 24,902,319 26,306,727 27,335,602 26,725,721 (1,894,221) -7% -1,284,340 -5% 539,062 2%
Smart Prepaid 23,983,929 23,413,304 24,830,033 25,866,195 25,240,171 (1,882,266) -7% -1,256,242 -5% 570,625 2%
Smart Postpaid 1,457,452 1,489,015 1,476,694 1,469,407 1,485,550 (11,955) -1% -28,098 -2% (31,563) -2%
TNT 40,446,221 38,638,225 38,871,067 38,308,363 37,619,726 2,137,858 6% 2,826,495 8% 1,807,996 5%
Sun Cellular 6,484,561 6,644,945 7,897,833 7,474,190 7,105,841 (989,629) -13% -621,280 -9% (160,384) -2%
Sun Prepaid 5,597,613 5,686,892 6,889,658 6,547,231 6,152,209 (949,618) -15% -554,596 -9% (89,279) -2%
Sun Postpaid 886,948 958,053 1,008,175 926,959 953,632 (40,011) -4% -66,684 -7% (71,105) -7%
Total Mobile Subscribers 72,372,163 70,185,489 73,075,627 73,118,155 71,451,288 (745,992) -1% 920,875 1% 2,186,674 3%
Sep-203Q20 vs YE19
Net Adds (Reductions)
3Q20 vs 2Q20Dec-19Mar-20 Sep-19
3Q20 vs 3Q19Jun-20

Broadband Subscribers
Fixed Line Subscribers
Subscriber Base: Fixed Line and Broadband
(1) Includes Corporate Fixed Broadband Subscribers
48
BROADBAND
Fixed Line Broadband (1) 2,194,931 2,105,140 1,986,783 1,931,333 1,878,983 263,598 14% 315,948 17% 89,791 4%
Fixed Wireless Broadband 646,830 504,026 296,005 230,151 212,031 416,679 181% 434,799 205% 142,804 28%
Total Broadband Subscribers 2,841,761 2,609,166 2,282,788 2,161,484 2,091,014 680,277 31% 750,747 36% 232,595 9%
Sep-203Q20 vs YE19
Net Adds (Reductions)
3Q20 vs 2Q20Sep-19Mar-20
3Q20 vs 3Q19Jun-20 Dec-19
Fixed Line Subscribers 2,999,174 2,917,641 2,801,187 2,765,209 2,727,035 233,965 8% 272,139 10% 81,533 3%
Sep-203Q20 vs YE19
Net Adds (Reductions)
3Q20 vs 2Q20Mar-20
3Q20 vs 3Q19Sep-19Jun-20 Dec-19

ARPU
(1) Includes Mobile Broadband subscribers
Mobile ARPU, Net(1) :
49
Broadband ARPU, Net :
1Q 2Q 3Q 1Q 2Q 3Q 4Q
Smart Postpaid 804 816 804 796 813 809 806
Smart Prepaid 112 110 116 118 118 114 114
TNT 71 76 84 67 67 67 74
Sun Postpaid 377 386 362 423 418 401 403
Sun Prepaid 66 67 79 77 73 76 75
2020 2019
1Q 2Q 3Q 1Q 2Q 3Q 4Q
Fixed Line Broadband 1,436 1,372 1,381 1,408 1,424 1,430 1,466
Fixed Wireless Broadband 495 644 578 725 710 618 545
2020 2019

(1) Service Revenues, gross of interconnection costs
(2) Cash Operating Expenses includes interconnection costs
(3) EBITDA margin calculated as EBITDA divided by service revenues (gross of interconnection costs)
9M2020: Consolidated Financial Highlights
50
Service revenues, gross of interconnection costs 72,287 71,087 - 127,849 119,008 7%
Interconnection costs 369 7,701 - 1,260 2,740 (54%)
Service revenues, net of interconnection costs 71,918 63,386 - 126,589 116,268 9%
(Php in millions)Fixed Line Others Consolidated
Service Revenues (1) 72,287 71,087 - 127,849 119,008 7%
Cash Operating Expenses (2) 24,459 38,029 6 51,861 53,185 (2%)
Subsidies and Cost of Services 1,430 2,314 - 3,704 4,036 (8%)
Provisions 2,150 4,269 1 6,420 3,852 67%
EBITDA 44,248 26,475 (7) 65,864 57,935 14%
EBITDA Margin(3) 61% 37% - 52% 49%
EBITDA (exMRP) 44,297 26,512 (7) 65,950 60,334 9%
EBITDA (exMRP) Margin(3) 61% 37% - 52% 51%
Depreciation and Amortization 23,646 12,536 - 31,587 28,613 10%
Financing Costs, Net (5,188) (4,343) - (7,517) (6,532) 15%
Other Income (Expenses) 1,364 2,463 (1,055) 1,153 293 294%
Income (Loss) before Income Tax 16,892 13,246 (2,316) 27,581 22,615 22%
Provision (Benefit from) for Income Tax 4,037 3,662 (349) 7,681 6,579 17%
Net Income (Loss) Attributable to Equity Holders of PLDT 12,847 9,380 (1,967) 19,687 15,996 23%
Core income (loss) 12,795 8,871 (1,455) 19,629 18,168 8%
9M2020
9M2019Y-o-Y
% ChangeWireless

(1) Gross of interconnection costs
Consolidated Service Revenues
51
Consolidated service revenues, net of interconnection costs
(Php in millions)1Q 2Q 3Q 9M 1Q 2Q 3Q 9M 4Q FY
9M20 vs
9M19
3Q20 vs
3Q19
Fixed Line 18,543 18,729 20,011 57,283 18,199 17,955 18,356 54,510 18,602 73,112 5% 9%
LEC 3,513 3,719 3,538 10,770 3,698 3,648 3,583 10,929 3,607 14,536 (1%) (1%)
Fixed Line Voice - International 540 573 919 2,032 758 712 838 2,308 575 2,883 (12%) 10%
Fixed Line Voice - Domestic (NLD) 527 416 588 1,531 578 657 621 1,856 615 2,471 (18%) (5%)
Home Broadband 7,492 7,823 8,554 23,869 6,828 6,971 7,070 20,869 7,438 28,307 14% 21%
Corporate Data and Data Center 6,400 6,080 6,346 18,826 6,231 5,861 6,148 18,240 6,240 24,480 3% 3%
Corporate data and leased lines 5,246 5,074 5,291 15,611 5,143 4,852 5,126 15,121 5,232 20,353 3% 3%
Data Center and IT 1,154 1,006 1,055 3,215 1,088 1,009 1,022 3,119 1,008 4,127 3% 3%
Miscellaneous 71 118 66 255 106 106 96 308 127 435 (17%) (31%)
Wireless 23,254 22,956 24,356 70,566 20,593 21,609 22,296 64,498 23,745 88,243 9% 9%
Mobile Services 23,198 22,917 24,322 70,437 20,476 21,490 22,200 64,166 23,657 87,823 10% 10%
Mobile Voice 5,543 5,219 5,289 16,051 5,989 6,062 5,976 18,027 5,986 24,013 (11%) (11%)
Mobile Voice - Domestic 4,875 4,484 4,647 14,006 5,167 5,324 5,306 15,797 5,473 21,270 (11%) (12%)
Mobile Voice - International 668 735 642 2,045 822 738 670 2,230 513 2,743 (8%) (4%)
SMS 1,806 1,724 1,783 5,313 2,582 2,559 2,367 7,508 2,398 9,906 (29%) (25%)
Mobile Data 15,452 15,752 17,013 48,217 11,581 12,538 13,491 37,610 14,856 52,466 28% 26%
Mobile Internet 14,597 14,758 15,906 45,261 10,486 11,497 12,500 34,483 13,916 48,399 31% 27%
Mobile Broadband 668 703 806 2,177 901 837 805 2,543 774 3,317 (14%) -
Other data 187 291 301 779 194 204 186 584 166 750 33% 62%
Inbound Roaming and Others 397 222 237 856 324 331 366 1,021 417 1,438 (16%) (35%)
Home Broadband 13 12 8 33 27 23 19 69 16 85 (52%) (58%)
MVNO and Others 43 27 26 96 90 96 77 263 72 335 (63%) (66%)
Total Consolidated Service Revenues (1)
41,797 41,685 44,367 127,849 38,792 39,564 40,652 119,008 42,347 161,355 7% 9%
2019 % Change2020
1Q 2Q 3Q 9M 1Q 2Q 3Q 9M 4Q FY9M20 vs
9M19
3Q20 vs
3Q19
Consolidated Service Revenues, gross of interconnection costs 41,797 41,685 44,367 127,849 38,792 39,564 40,652 119,008 42,347 161,355 7% 9%
Interconnection Costs 302 339 619 1,260 835 866 1,039 2,740 898 3,638 (54%) (40%)
Consolidated Service Revenues, net of interconnection costs 41,495 41,346 43,748 126,589 37,957 38,698 39,613 116,268 41,449 157,717 9% 10%
(Php in millions)
% Change20192020

Consolidated Service Revenues and EBITDA
52
(1) Gross of interconnection costs
(Php in millions)1Q 2Q 3Q 9M 1Q 2Q 3Q 9M 4Q FY
9M20 vs
9M19
3Q20 vs
3Q19
Data and Broadband 29,357 29,667 31,921 90,945 24,667 25,393 26,728 76,788 28,550 105,338 18% 19%
Home Broadband 7,505 7,835 8,562 23,902 6,855 6,994 7,089 20,938 7,454 28,392 14% 21%
Fixed Home Broadband 7,492 7,823 8,554 23,869 6,828 6,971 7,070 20,869 7,438 28,307 14% 21%
Wireless Home Broadband 13 12 8 33 27 23 19 69 16 85 (52%) (58%)
Corporate Data and Data Center 6,400 6,080 6,346 18,826 6,231 5,861 6,148 18,240 6,240 24,480 3% 3%
Corporate data and leased lines 5,246 5,074 5,291 15,611 5,143 4,852 5,126 15,121 5,232 20,353 3% 3%
Data Center and IT 1,154 1,006 1,055 3,215 1,088 1,009 1,022 3,119 1,008 4,127 3% 3%
Mobile Data 15,452 15,752 17,013 48,217 11,581 12,538 13,491 37,610 14,856 52,466 28% 26%
Mobile Internet 14,597 14,758 15,906 45,261 10,486 11,497 12,500 34,483 13,916 48,399 31% 27%
Mobile Broadband 668 703 806 2,177 901 837 805 2,543 774 3,317 (14%) -
Other data 187 291 301 779 194 204 186 584 166 750 33% 62%
Domestic Voice and Others 9,426 8,986 9,102 27,514 9,963 10,162 10,049 30,174 10,311 40,485 (9%) (9%)
LEC 3,513 3,719 3,538 10,770 3,698 3,648 3,583 10,929 3,607 14,536 (1%) (1%)
Fixed Line Voice - Domestic (NLD) 527 416 588 1,531 578 657 621 1,856 615 2,471 (18%) (5%)
Mobile Voice - Domestic 4,875 4,484 4,647 14,006 5,167 5,324 5,306 15,797 5,473 21,270 (11%) (12%)
Others 511 367 329 1,207 520 533 539 1,592 616 2,208 (24%) (39%)
Miscellaneous 71 118 66 255 106 106 96 308 127 435 (17%) (31%)
Inbound Roaming and Others 397 222 237 856 324 331 366 1,021 417 1,438 (16%) (35%)
MVNO and Others 43 27 26 96 90 96 77 263 72 335 (63%) (66%)
International (Fixed and Wireless) 1,208 1,308 1,561 4,077 1,580 1,450 1,508 4,538 1,088 5,626 (10%) 4%
Fixed Line Voice - International 540 573 919 2,032 758 712 838 2,308 575 2,883 (12%) 10%
Mobile Voice - International 668 735 642 2,045 822 738 670 2,230 513 2,743 (8%) (4%)
SMS 1,806 1,724 1,783 5,313 2,582 2,559 2,367 7,508 2,398 9,906 (29%) (25%)
Total Consolidated Service Revenues (1)
41,797 41,685 44,367 127,849 38,792 39,564 40,652 119,008 42,347 161,355 7% 9%
% Change20192020
1Q 2Q 3Q 9M 1Q 2Q 3Q 9M 4Q FY9M20 vs
9M19
3Q20 vs
3Q19
EBITDA 21,612 21,553 22,699 65,864 19,847 19,819 18,269 57,935 21,880 79,815 14% 24%
MRP 24 21 41 86 209 83 2,107 2,399 897 3,296 (96%) (98%)
EBITDA (exMRP) 21,636 21,574 22,740 65,950 20,056 19,902 20,376 60,334 22,777 83,111 9% 12%
2019 % Change
(Php in millions)
2020

Wireless Service Revenues
Wireless service revenues - net of interconnection costs
Note: Service revenues before intersegment elims 53
(1) Gross of interconnection costs
(Php in millions)1Q 2Q 3Q 9M 1Q 2Q 3Q 9M 4Q FY
9M20 vs
9M19
3Q20 vs
3Q19
Data/Broadband 15,532 15,828 17,086 48,446 11,670 12,603 13,679 37,952 14,981 52,933 28% 25%
Mobile Data 15,519 15,816 17,078 48,413 11,643 12,580 13,660 37,883 14,965 52,848 28% 25%
Mobile Internet 14,598 14,757 15,911 45,266 10,486 11,497 12,500 34,483 13,916 48,399 31% 27%
Mobile Broadband 698 732 830 2,260 948 888 865 2,701 846 3,547 (16%) (4%)
Other Data 223 327 337 887 209 195 295 699 203 902 27% 14%
Home Broadband 13 12 8 33 27 23 19 69 16 85 (52%) (58%)
SMS/Mobile Voice - Domestic/Others 7,479 6,942 7,367 21,788 8,624 8,966 8,566 26,156 8,805 34,961 (17%) (14%)
SMS 1,806 1,724 1,790 5,320 2,583 2,559 2,367 7,509 2,398 9,907 (29%) (24%)
Mobile Voice - Domestic 5,005 4,612 4,778 14,395 5,315 5,466 5,444 16,225 5,605 21,830 (11%) (12%)
Others 668 606 799 2,073 726 941 755 2,422 802 3,224 (14%) 6%
Inbound Roaming and Others 493 452 664 1,609 342 348 386 1,076 437 1,513 50% 72%
MVNO and Others 175 154 135 464 384 593 369 1,346 365 1,711 (66%) (63%)
Mobile Voice - International 672 737 644 2,053 828 744 676 2,248 519 2,767 (9%) (5%)
Total Wireless Gross Service Revenues (1)
23,683 23,507 25,097 72,287 21,122 22,313 22,921 66,356 24,305 90,661 9% 9%
% Change20192020
1Q 2Q 3Q 9M 1Q 2Q 3Q 9M 4Q FY9M20 vs
9M19
3Q20 vs
3Q19
Wireless Service Revenues, gross of interconnection costs 23,683 23,507 25,097 72,287 21,122 22,313 22,921 66,356 24,305 90,661 9% 9%
Interconnection Costs 141 111 117 369 533 580 615 1,728 681 2,409 (79%) (81%)
Wireless Service Revenues, net of interconnection costs 23,542 23,396 24,980 71,918 20,589 21,733 22,306 64,628 23,624 88,252 11% 12%
2019
(Php in millions)
% Change2020

Fixed line service revenues - net of interconnection costs
Fixed Line Service Revenues
Note: Service revenues before intersegment elims 54
(1) Gross of interconnection costs
(Php in millions)1Q 2Q 3Q 9M 1Q 2Q 3Q 9M 4Q FY
9M20 vs
9M19
3Q20 vs
3Q19
Data/Broadband 16,032 16,238 17,149 49,419 14,996 14,891 15,115 45,002 15,762 60,764 10% 13%
Home Broadband 7,515 7,845 8,574 23,934 6,875 7,007 7,101 20,983 7,466 28,449 14% 21%
Corp. Data and Other Network Services 6,963 6,914 7,137 21,014 6,694 6,397 6,668 19,759 6,922 26,681 6% 7%
Data Center and ICT 1,554 1,479 1,438 4,471 1,427 1,487 1,346 4,260 1,374 5,634 5% 7%
LEC/Others 3,700 3,941 3,712 11,353 3,916 3,865 3,790 11,571 3,847 15,418 (2%) (2%)
LEC 3,537 3,742 3,562 10,841 3,722 3,671 3,607 11,000 3,630 14,630 (1%) (1%)
Miscellaneous 163 199 150 512 194 194 183 571 217 788 (10%) (18%)
Fixed Line Voice - International/Domestic 2,785 3,255 4,275 10,315 2,627 3,089 3,030 8,746 2,891 11,637 18% 41%
Fixed Line Voice - International 2,231 2,810 3,654 8,695 2,020 2,403 2,380 6,803 2,247 9,050 28% 54%
Fixed Line Voice - Domestic (NLD) 554 445 621 1,620 607 686 650 1,943 644 2,587 (17%) (4%)
Total Fixed Line Service Revenues (1)
22,517 23,434 25,136 71,087 21,539 21,845 21,935 65,319 22,500 87,819 9% 15%
% Change20192020
1Q 2Q 3Q 9M 1Q 2Q 3Q 9M 4Q FY9M20 vs
9M19
3Q20 vs
3Q19
Fixed Line Service Revenues, Net
LEC 3,537 3,742 3,562 10,841 3,721 3,671 3,606 10,998 3,631 14,629 (1%) (1%)
Fixed Line Voice - International 363 341 389 1,093 442 414 399 1,255 343 1,598 (13%) (3%)
Fixed Line Voice - Domestic (NLD) 527 424 591 1,542 583 659 622 1,864 618 2,482 (17%) (5%)
Home Broadband 7,515 7,845 8,574 23,934 6,875 7,007 7,101 20,983 7,466 28,449 14% 21%
Corp. Data and Other Network Services 6,959 6,897 7,137 20,993 6,689 6,392 6,665 19,746 6,916 26,662 6% 7%
Data Center and ICT 1,554 1,479 1,438 4,471 1,427 1,487 1,346 4,260 1,374 5,634 5% 7%
Miscellaneous 163 199 150 512 194 194 183 571 217 788 (10%) (18%)
Total 20,618 20,927 21,841 63,386 19,931 19,824 19,922 59,677 20,565 80,242 6% 10%
% Change2019
(Php in millions)
2020

Expenses
Total Expenses, excluding interconnection costs and MRP:
55
(Php in millions) Wireless Fixed Line Others Consolidated
Operating Expenses
Compensation and Employee Benefits 5,627 12,032 - 17,647 19,284 (8%)
Repairs and Maintenance 7,445 9,176 - 15,875 14,224 12%
Professional and Other Contracted Services 3,132 4,901 3 5,676 5,761 (1%)
Selling and Promotions 3,297 985 - 4,280 4,553 (6%)
Taxes and Licenses 2,732 888 2 3,622 2,967 22%
Insurance and Security Services 706 682 - 1,305 1,266 3%
Interconnection Costs 369 7,701 - 1,260 2,740 (54%)
Rent 500 713 - 795 768 4%
Communication, Training and Travel 493 397 - 688 887 (22%)
Other Expenses 158 554 1 713 735 (3%)
Cash Operating Expenses 24,459 38,029 6 51,861 53,185 (2%)
Depreciation and Amortization 23,646 12,536 - 31,587 28,613 10%
Asset Impairment 2,150 4,269 1 6,420 3,852 67%
Provisions 2,150 4,269 1 6,420 3,852 67%
Amortization of Intangible Assets 528 9 - 528 582 (9%)
Non-Cash Operating Expenses 26,324 16,814 1 38,535 33,047 17%
Cost of Sales and Services 5,859 3,258 - 9,077 9,464 (4%)
Total Expenses 56,642 58,101 7 99,473 95,696 4%
Y-o-Y
% Change
9M20209M2019
Wireless Fixed Line Others Consolidated
Total Cash Operating Expenses 24,459 38,029 6 51,861 53,185 (2%)
Less: Interconnection Costs 369 7,701 - 1,260 2,740 (54%)
Total Cash Operating Expenses, excluding
Interconnection Costs24,090 30,328 6 50,601 50,445 -
Less: MRP 49 37 - 86 2,399 (96%)
Total Cash Operating Expenses, excluding
Interconnection Costs and MRP24,041 30,291 6 50,515 48,046 5%
Non-Cash Operating Expenses 26,324 16,814 1 38,535 33,047 17%
Cost of Sales and Services 5,859 3,258 - 9,077 9,464 (4%)
Total Expenses, excluding
Interconnection Costs and MRP56,224 50,363 7 98,127 90,557 8%
(Php in millions)
9M20209M2019
Y-o-Y
% Change

Other Income (expenses)
56
( Php in millions) Wireless Fixed Line Others Consolidated
Equity Share in Net Earnings (Losses) of Associates and Joint Ventures
Multisys - - (112) (112) 78 (244%)
Vega - - 32 32 (24) 233%
Voyager - - (1,577) (1,577) (1,329) 19%
Others - 81 (122) (41) 164 (125%)
Total Equity Share in Net Earnings (Losses) - 81 (1,779) (1,698) (1,111) 53%
Financing Costs, Net
Loans and Other Related Items (2,939) (4,799) - (7,738) (6,412) 21%
Accretion on Lease Liabilities (2,632) (249) - (867) (1,149) (25%)
Accretion on Financial Liabilities (42) (62) - (104) (91) 14%
Financing Charges (25) (30) - (55) (32) 72%
Capitalized Interest 450 797 - 1,247 1,152 8%
Total Financing Costs, Net (5,188) (4,343) - (7,517) (6,532) 15%
Other Income (Expenses), Net
Investment Impairment (60) - - (60) (34) 76%
Gain (Loss) on Investment Valuation - - (711) (711) (265) 168%
Realized Gain on Sale of Investment (Rocket Internet) - - (268) (268) 187 (243%)
Others 1,424 2,463 (76) 2,192 405 441%
Other Income (Expenses), Net 1,364 2,463 (1,055) 1,153 293 294%
Interest Income 441 429 429 911 1,405 (35%)
Losses on Derivative Financial Instruments, Net (95) (246) - (341) (190) 79%
Foreign Exchange Gains (Losses), Net 296 932 96 1,324 10 13,140%
Total Other Expenses, Net (3,182) (684) (2,309) (6,168) (6,125) 1%
9M2020 Y-o-Y
% Change9M2019

Earnings Per Share (EPS)
57
(Php in millions except EPS (in Php) and Shares (in mn)) Basic Diluted Basic Diluted
Net Income Attributable to Equity Holders of PLDT 19,687 19,687 15,996 15,996
Dividends on Preferred Shares (44) (44) (44) (44)
Net Income for the Period Attributable to Common Equity Holders of PLDT 19,643 19,643 15,952 15,952
Weighted Average Number of Common Shares, End 216,056 216,056 216,056 216,056
EPS (Based on Reported Net Income) 90.92 90.92 73.83 73.83
Core Income 19,629 19,629 18,168 18,168
Dividends on Preferred Shares (44) (44) (44) (44)
Core Income Applicable to Common Shares 19,585 19,585 18,124 18,124
Weighted Average Number of Common Shares, End 216,056 216,056 216,056 216,056
EPS (Based on Core Income) 90.65 90.65 83.88 83.88
9M2020 9M2019

Balance Sheet
58
(1) Cash and Short-Term Investments include Long-term Time Deposits(2) Net Debt calculated based on nominal value of debts less cash and cash equivalents and short-term investments(3) Nominal value of total debt(4) EBITDA for the Last Twelve Months (LTM)(5) EBITDA, excluding MRP, for LTM
September 30, 2020 December 31, 2019
Total Assets 547,433 525,027
Nominal Value of Total Debt 224,010 193,047
in US$ $4,626 $3,800
Less: Unamortized Debt Discount 1,187 491
Total Debt 222,822 192,556
Cash and Short-Term Investments(1)
34,842 24,683
Net Debt (2)
189,168 168,364
Equity 118,651 116,290
Total Debt(3)
/Equity 1.89x 1.66x
Net Debt(2)
/Equity 1.59x 1.45x
Total Debt(3)
/EBITDA (4)
2.55x 2.42x
Net Debt (2)
/EBITDA (4) 2.16x 2.11x
Total Debt(3)
/EBITDA (exMRP) (5)
2.52x 2.32x
Net Debt (2)
/EBITDA (exMRP) (5) 2.13x 2.03x
Consolidated
(Php in millions)

Debt Profile
Interest-Bearing liabilities
59
December 31,
2019
Carrying
Value
Unamortized Debt
Discount/Debt
Issuance
Face Value Face Value
Debt
PLDT $2,989 $19 $3,008 $2,256 $752
Smart 1,613 5 1,618 1,544 74
Total Debt $4,602 $24 $4,626 $3,800 $826
Change
(US$ in millions)
September 30, 2020
(US$ in millions) 2016 2017 2018 2019 9M2020
Debt Balance 3,730 3,466 3,362 3,800 4,626
Cash and Short-Term Investments 833 668 1,005 486 719
Net Debt 2,897 2,798 2,357 3,314 3,907

Foreign Exchange Risk
Forex Impact on Core Income Forex Impact of B/S Revaluation
60
(in US$ millions)
US$ Revenues
US$ Expenses
Cash Opex (238.8)
Cost of Sales and Services (9.7)
Financing Costs (12.2)
US$ Income before tax
Tax effect 41.3
Core Earnings
EBITDA 149.7
Forex sensitivity for every P1 change Conso - net of Elim
398.2
(260.7)
137.6
96.3
Debt (net of LT hedges & ST Forwards/options)
Accounts Payable (net of ST Forwards/options) 477.8
Accrued Liabilities 211.1
Derivative Liabilities 8.6
Other Current & Non Current Liabilities 1.2
Total US$ denominated Liabilities 1,198.4
Cash and Short-term Investments 348.1
Trade and other receivables 196.5
Derivative Assets
Other Current & Non Current Assets 24.6
Total US$ denominated Assets 569.7
Forex Revaluation for every P1 change
Conso
499.8
0.5
±628.7
Forex sensitivity for every P1 change on B/S
Revaluation (in US$ millions)
Ave. Period End
Forex rate, 9M 2020 50.06 48.42
Forex rate, 9M 2019 52.05 51.80% Change in Forex rate (3.8%) (6.5%)

Except for historical financial and operating data and other information in respect of historical matters,
the statements contained herein are “forward-looking statements” within the meaning of Section 27A of
the U.S. Securities Act of 1933, as amended, and Section 21E of the U.S. Securities Exchange Act of
1934, as amended. The words “believe”, “intend”, “plan”, “anticipate”, “continue”, “estimate”, “expect”,
“may”, “will” or other similar words are frequently used to indicate these forward looking statements.
Any such forward-looking statement is not a guarantee of future performance and involves a number of
known and unknown risks, uncertainties and other factors that could cause the actual performance,
financial condition or results of operation of PLDT to be materially different from any future
performance, financial condition or results of operation implied by such forward-looking statement.
Among the factors that could cause actual results to differ from the implied or expected results are
those factors discussed under “Risk Factors” in Item 3 in PLDT’s annual report on Form 20-F.
For inquiries, please contact: PLDT INVESTOR RELATIONS
61

62