nichols, meredith_validation of precipitation and lightning observations
TRANSCRIPT

Validation of Precipitation and Lightning Observations
Meredith NicholsSeptember 29th, 2015

2
Research GoalsThis study analyzes the performance of five satellite-derived
precipitation estimation products relative to rain-gauge and radar observations
________________________________________
Purpose: Characterize errors in satellite precipitation estimates to better inform the user community, and will help researchers improve future
versions of their precipitation estimates________________________________________
Submitted Manuscript:Nichols, M. A., D. F. Wheeler, P. C. Meyers, and S. D. Rudlosky, 2015:
Seasonal and Annual Validation of Satellite Precipitation Estimates. J. Operational Meteor., under review.

3
Current CICS Rainfall Validation:STAR Rainfall Product Cal/Val Center
http://cics.umd.edu/ipwg/
• Currently validates about 17 different satellite algorithms and models produced by NASA, NOAA and other groups
• Creates statistical maps and time series plots
• Created by John Janowiak, and updated by J.J. Wang
• Daily validation

4
Approach & Methods• Study focuses on Continental
United States
• Five years of daily precipitation estimates (2010–14) are composited into meteorological seasons and annual maps to characterize performance
• Data are objectively analyzed on a 0.25 degree grid
• Average conditional, maximum, and sum (accumulation) rain rates are computed
• Five satellite-derived precipitation products validated relative to:
• Rain Gauge
– From the Climate Prediction Center (CPC) Unified Precipitation project
– Contains quality controlled information from over 7000 stations across the U.S.
• Radar
– Composite of Stage II NWS WSR 88D radar data (Stage II/IV)
– Uses the radar-only Stage IV product with no bias correction
_______________________________________________

5
Satellite-Derived Precipitation Products• Infrared (IR)-based:
– SCAMPR, Hydro-Estimator, and GPI
• SCAMPR– NESDIS Self-Calibrating Multivariate
Precipitation Retrieval – combines the greater accuracy of PMW
precipitation estimates with more frequently available and higher spatial resolution IR observations
• Hydro-Estimator– The National Environmental Satellite,
Data, and Information Service (NESDIS) product uses GOES IR data, but corrects for the evaporation of raindrops to help improve accuracy
• GPI– CPC technique uses mainly IR data, and
only uses PMW to fill the spatial IR gaps
• Passive Microwave (PMW)-based:– 3B42RT, CMORPH
• 3B42RT– The NASA Tropical Rainfall
Measuring Mission (TRMM) Multi-Satellite Precipitation Analysis (TMPA) 3B42RT product that combines PMW and PMW-calibrated IR to estimate precipitation in near real-time
• CMORPH– CPC Morphing technique blends
PMW and IR observations
____________________________________________________________________________

6
Average Spatial Plots
Daily average rainfall estimates for Summer months (JJA) between
2010-2014

7
Maximum Spatial Plots
Daily maximum rainfall estimates for Summer months (JJA) between
2010-2014

8
Observed overestimates during both summer and winter
CMORPH generally overestimates precipitation by 3–5 mm day -1 over the U.S. Great Plains during summer
SCaMPR generally overestimates precipitation by 5–10 mm day-1 over the U.S. Great Plains during summer

9
CMORPH underestimates precipitation during winter
During winter, CMORPH underestimates precipitation over the eastern U.S. (1–3 mm day-1) as well as along the west coast and inter-mountain west (2–10 mm day -1).

10
Infrared-based satellite products overestimate precipitation

11
All satellite products overestimate precipitation during summer
12
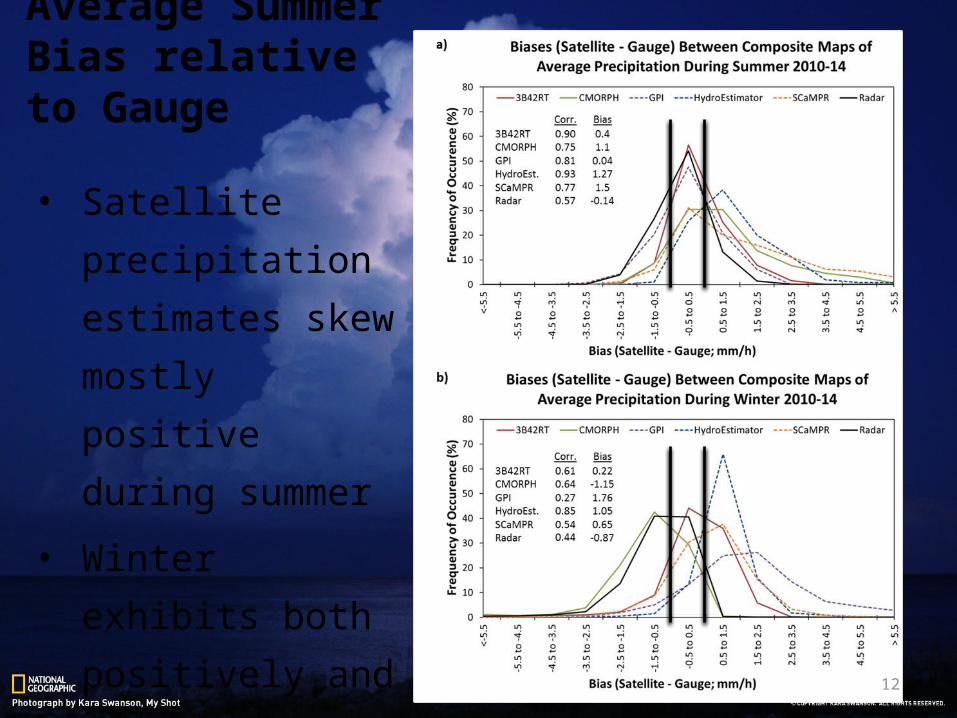
Average Summer Bias relative to Gauge
• Satellite precipitation estimates skew mostly positive during summer
• Winter exhibits both positively and negatively skewed biases

13
Average Conditional Precipitation Correlations
• Hydro-Estimator (red) produces the highest correlations during most years
• Satellite correlations are much more consistent compared to radar than gauge
• Overall, correlations are higher for satellite compared to gauge than radar

14
Understanding Possible Causes of Spatial Biases
• False Alarm Rate (FAR)
• Probability of Detection (POD)
• Suggestive of whether satellite biases are caused by misclassifying the frequency or intensity of precipitation

15
Understanding Possible Causes of Spatial Biases
The greatest SCaMPR overestimates occur over
Iowa, Nebraska, and Kansas:
a region with relatively low FAR values, indicating
rain-rate intensity overestimates
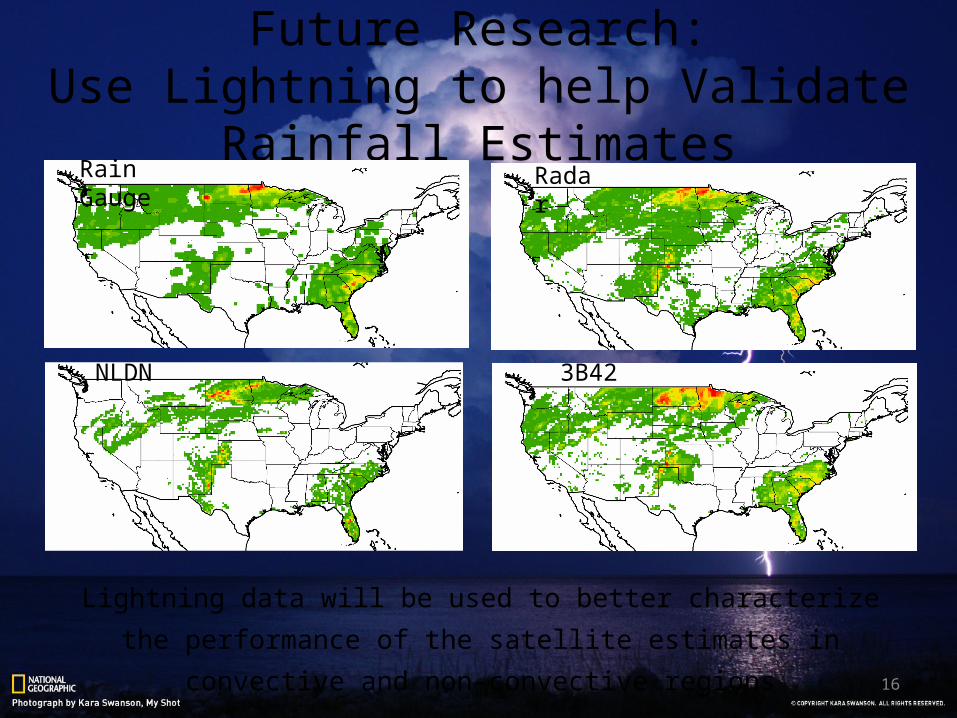
16
Future Research:Use Lightning to help Validate Rainfall Estimates
Rain Gauge Radar
NLDN
Lightning data will be used to better characterize the performance of the satellite estimates in convective and non-convective regions
3B42