nicholas r. noble eviews - miami university user guide (all).pdf · eviews user guide 3 figure 4...
TRANSCRIPT

Nicholas R. Noble
EViews
EViews User’s Guide

EViews User Guide 1
Figure 1
Figure 2
Opening an EViews WorkfileGetting Data.
Existing Data files -
Click on
FILE-OPEN
Choose the correct workfile,and
Click OPEN
EViews will open the requestedfile, and provide a list of
variables and objects in the file.
The open box on the screen iscalled the workfile box.
(see Figure 2)
The buttons with the labelsVIEW, PROCS, SAVE, etc.are referred to as the toolbar.
EViews has several differenttoolbars that we will use.
EViews User Guide 2
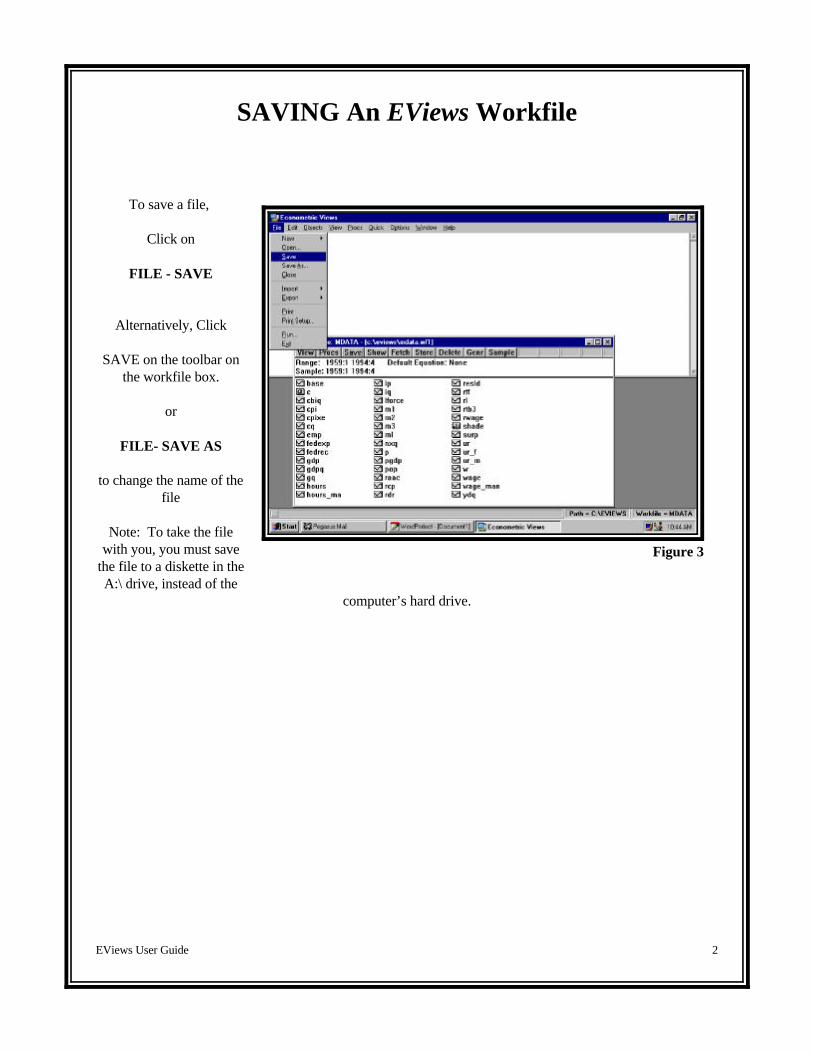
Figure 3
SAVING An EViews Workfile
To save a file,
Click on
FILE - SAVE
Alternatively, Click
SAVE on the toolbar onthe workfile box.
or
FILE- SAVE AS
to change the name of thefile
Note: To take the filewith you, you must save
the file to a diskette in theA:\ drive, instead of the
computer’s hard drive.

EViews User Guide 3
Figure 4
Figure 5
Choosing the Observations (Sample Size)The portion of the data thatEViews uses for analysis isdetermined by sample size.
Sample size can be changedfrom the defaults by using the
QUICK menu. (Figure 4)
Click on
QUICK
then click on
SAMPLE
In the sample box (Figure 5)fill in the starting and endingdate. You must use Proper
EViews date form. Thecorrect form for a date is:
Annual Data1960 for the year 1960
Quarterly Data1960:1 (or 60:1) for first
quarter in 1960. Use 60:3 forthird quarter.
Monthly Data1960:4 (or 60:4) for April1960. Use 60:10 for Oct.
1960.Undated Data
Use observation numbers.
Skipping DataTo skip a set of observations,use four dates, start date 1,end date 1, start date 2, end
date 2.

EViews User Guide 4
Figure 6
Figure 7
PRINTING DATA
To Print data, use theQUICK menu (Figure 4), and choose
SHOW
Type the variable name in thebox. (Figure 6)
and Click on OK
Alternatively, click on SHOWin the workfile box.
EViews will show the data ina spreadsheet form. (Figure 7)This is called the Spreadsheetbox.
Click on PRINT to send thisinformation to the printer.
Alternatively, theSpreadsheet box will appearif you double-click on avariable in the workfile box.

EViews User Guide 5
Figure 8
Figure 9
TO print more than onevariable, choose QUICK and SHOW
and then enter the namesof the variables you wishto print.(Figure 8)
Use the PRINT button onthe toolbar to send thedata to the printer,

EViews User Guide 6
Figure 10
Figure 11
PLOTTING DATA
EViews does an excellent jobplotting data. To plot twovariables together, use theQUICK menu, and choose
GRAPH
Fill in the names of thevariables in the box(figure 10) and click on OK
EViews has several graphicoptions. The default is aline graph. If the variables that you plotare similar in magnitude, use
SINGLE SCALE
If the variables are differentin magnitude, use one of the DUAL SCALES options
(Figure 11)

EViews User Guide 7
Figure 12
Figure 13
The resulting Graph can beprinted using the
button on the graphictoolbar.
The PrintSetup buttondetermines the size andattributes of the printedgraph.
The AddText button(Figure 13) on the graphicstoolbar allow the addition of atitle or other information tothe graph

EViews User Guide 8
Figure 14
Figure 15
This information will alsobe printed along with thegraph.
The name button on thetoolbar will give the grapha name, and the graph canbe stored in the workfilealong with the data.
Using the add text allows foraxis titles.
The AddShade allow timeperiods to be emphasized.(Figure 15)

EViews User Guide 9
Figure 16
Figure 17
One other graphic option is ascattergram. A scattergramplots one variable on the y-axis and one variable on thex-axis.
To produce a scattergram,follow the steps in figure 10,but choose
SCATTER DIAGRAM
option. The click on OK.
Note the scale options play norole if scatter diagram ischosen.
The variable listed first willbe plotted on the y-axis, andthe variable listed second willbe plotted on the x-axis.
Note the AddText button onthe graphics toolbar can beused to add information tothe graph as done in figure15.

EViews User Guide 10
Figure 18
Figure 19
The option button on thegraphics toolbar produces amenu of many graphicsoptions to “fine-tune” thegraph. These options areavailable on the line graphabove also.
One interesting option with ascatter diagram is theregression line option. Thisoption draws a straight linethat “best” describes the data.
The scatter diagram can beprinted with the
PRINT button on thetoolbar.

EViews User Guide 11
Figure 20
Figure 21
Creating New VariablesTo create new variables inEViews, start with
Generate Series
on the Quick Menu(see Figure 4).
Enter the equation in thebox to describe thevariable that you wish tocreate.
Use a * for multiplication,use a / for division, use **for raising to a power, and+ and - for addition andsubtraction. The examplein figure 20 creates aninflation rate over a yearspan.
An alternative to theQuick Menu is to usethe GENR button on theworkfile toolbar.
After you compute anew series you shouldalways plot and print theseries as a check of yourcomputational formula.

EViews User Guide 12
Figure 22
Figure 23
Estimating Regression Equations.
To estimate a Regressionequation, start with the QUICK MENU (figure 4)and choose
Estimate Equation..
If the equations to beestimated is:
Y = $ + $ X + , i 0 1 i i
Enter in the box,
Y C X
where C indicates to EViewsto include a regressionconstant. The equationentered in the box estimatesthe federal funds rate as afunction of the discount rate.
Figure 23 show standardEViews regression output. This is called the Regressionbox.
The PRINT button on theregression box toolbar willsend the regression results tothe printer.
Note date and time areincluded.
The name button will storethe equation in the workfile.

EViews User Guide 13
Figure 24
The Resids button on theregression box toolbar willgenerate time series graph ofthe actual andfitted(predicted) values andregression residuals. ThePRINT button on thetoolbar will now print thisgraphic. To get back to theregression results, click onStats.
The residuals are stored in aseries called resid. If youwant to use this variable youmust calculate a newvariable based upon resid.
Use the Quick Menu, choosegenerate series, and enter aformula such as, err=resid. Now err is a variable thatcan be used in a regression equation, printed, plotted, etc.