nicaragua: debt sustainability analysis; imf country ... · owned by pdvsa and petronic and the...
TRANSCRIPT

NICARAGUA STAFF REPORT FOR THE 2015 ARTICLE IV
CONSULTATION—DEBT SUSTAINABILITY ANALYSIS
UPDATE
Risk of external debt distress: Moderate
Augmented by significant risks stemming
from domestic public and private external
debt
Yes
This debt sustainability analysis (DSA) updates the full DSA that was conducted in
November 2013. Staff concludes that Nicaragua remains at moderate risk of debt
distress, based on an assessment of public external debt, and that it faces a heightened
overall risk of debt distress. On external debt, a customized contingent liability scenario
and two of the standardized stress scenarios breach the threshold. Further, while lower
oil prices have reduced the risk of debt distress, the magnitude of private external debt
elevates Nicaragua’s risk, as do questions about the continuation of external financing
from Venezuela. On public debt, while macroeconomic management has been prudent,
the fiscal position has become more expansionary and is expected to remain so over the
medium term, worsening public debt dynamics. In addition, the outlook for the social
security institute (INSS) has deteriorated and unless additional reforms are undertaken,
this could pose a significant fiscal burden in the long term. 1
1 Based on its 2015 Country Policy and Institutional Assessment (CPIA) score of 3.73, Nicaragua remains
classified as a medium performer.
Approved By Krishna Srinivasan and
Vivek Arora (IMF) and
John Panzer (IDA)
Prepared by the staffs of the International Monetary Fund
and the International Development Association
December 14, 2015

NICARAGUA
2 INTERNATIONAL MONETARY FUND
A. Underlying Assumptions
1. The key assumptions of this DSA are broadly in line with those of the 2013 DSA and in
particular, growth is assumed to stabilize at its medium-term potential level of 4 percent. As
in the past, this analysis considers the consolidated public sector, which includes debt of the
budgetary central government, decentralized entities, social security institute (INSS), the municipality
of Managua, state-owned enterprises (SOEs), and the central bank.1 This DSA also assumes (both in
the historical and projection periods) that relief has been obtained on HIPC terms for all eligible
debt where negotiations are still pending.2
However, differences are most notable in the following areas:
Official statistics: Revisions to the national accounts and balance of payments data have
resulted in lower projections for the current account deficit. On average, the current account
deficit was revised down by 1.2 percent of GDP over the period 2010–14. Moreover, staff
estimates of historical public debt stocks have been revised to consolidate intra-government
debt and to include an estimation of the domestic debt stock of SOEs.
Current account: Compared to the 2013 DSA, exports of goods and services are lower, owing to
a substantial downward revision of many traditional export prices as well as lower estimated
import volumes of Nicaragua’s trading partners. Also, since the 2013 DSA oil price projections
have been revised downwards, including over the medium to long term, and this has lowered
import projections. The net effect has been a reduction in projected current account deficits.
Future loan disbursements linked to the oil collaboration with Venezuela, which are recorded as
private external debt, are also affected by the revised oil price assumptions.
External financing: Assumptions about the availability and terms of new external financing
from multilateral sources have changed, with a higher average real interest rate projected in the
long term. In July 2015, Nicaragua was reclassified from an IDA-only to an IDA-gap country,
which means that it is no longer subject to IDA’s non-concessional borrowing policy and that
the IDA terms are less concessional. Also, access to resources from Nicaragua’s largest creditor,
the Inter-American Development Bank, changed in 2015 from a 50–50 ratio of concessional
resources to non-concessional resources to a 40–60 ratio. The trend of a declining grant element
in new loans is expected to continue over the medium to long term. On the positive side, these
developments should also increase the availability of external financing from official sources.
External financing from concessional multilateral and bilateral sources is therefore assumed
1 In spite of the comprehensive institutional coverage of the public sector, Nicaragua’s debt statistics do not cover all
domestic debt of state-owned enterprises. In particular, the public debt statistics used in this report differ slightly
from the authorities’ published numbers due to adjustments by staff to consolidate int ra-government debt and to
estimate the domestic debt stock of SOEs.
2 At end-June 2015, outstanding debt subject to relief stood at US$1 billion, most of this on the books of the central
bank. Since the 2013 DSA, additional debt relief has been obtained amounting to US$500 million. This DSA shows
debt net of pending relief, including for the historical period.

NICARAGUA
INTERNATIONAL MONETARY FUND 3
constant at 3.5 percent of GDP from 2020 through 2035, with residual financing needs being
met through domestic bond issuance.3
Fiscal policy: Fiscal policy has become more expansionary since the 2013 DSA, and the fiscal
anchor has shifted from the goal of a gradual declining debt-to-GDP ratio to maintaining an
overall deficit of the consolidated public sector at about 2.5 percent of GDP. Over the medium
term, fiscal policy is assumed to remain in line with current trends. This results in a higher
primary deficit than what was assumed in the 2013 DSA (1.4 percent of GDP versus 0.3 percent
in the 2015–20). In addition, the reserve fund of the INSS is projected to be depleted by 2024,
following which it is assumed that the central government will transfer resources to INSS to help
finance its deficit. This does not affect the CPS primary balance, as the transfers are between two
government entities and thus consolidated out. Nevertheless, as the INSS fund is exhausted,
these deficits will impact debt dynamics because the central government is required to issue
bonds to finance transfers to INSS. The scenario assumes that the bonds are issued domestically,
a more expensive source of financing. Securing the INSS’s financial sustainability is therefore a
key long-term challenge that needs to be tackled.
Key Macroeconomic Assumptions Underlying the DSA for the Baseline Scenario
Current DSA 2013 DSA Historical
averages
2015-2020 2021-2035 2013-2018 2019-2033 2005-2014
Real GDP growth (in percent) 4.0 4.0 4.0 4.0 3.8
GDP deflator in US$ terms (in percent) 1.3 2.1 2.1 1.5 3.6
Non-interest current account (in percent of GDP) -6.8 -6.9 -9.1 -7.1 -8.2
FDI (in percent of GDP) 6.0 5.8 6.0 6.0 6.0
Primary balance (in percent of GDP) -1.4 -1.4 -0.3 -0.1 0.3
Revenue and grants (in percent of GDP) 29.4 30.3 27.6 27.8 26.0
Primary expenditure (in percent of GDP) 30.8 31.7 27.9 27.7 25.7
Average real interest rate on public debt (percent) 1.3 2.3 1.1 0.9 0.5
B. External Debt Sustainability
2. External debt as a ratio of GDP is expected to decline marginally over the projection
period from 79 percent at end-2014 to 76 percent in 2035. Private external debt-to-GDP is likely
to continue to increase until the mid-2020s, but at a more gradual pace than has been observed
ever since the Venezuela oil collaboration began in 2007; current projections for oil prices in effect
imply that Venezuela inflows will be lower than anticipated at the time of the 2013 DSA.
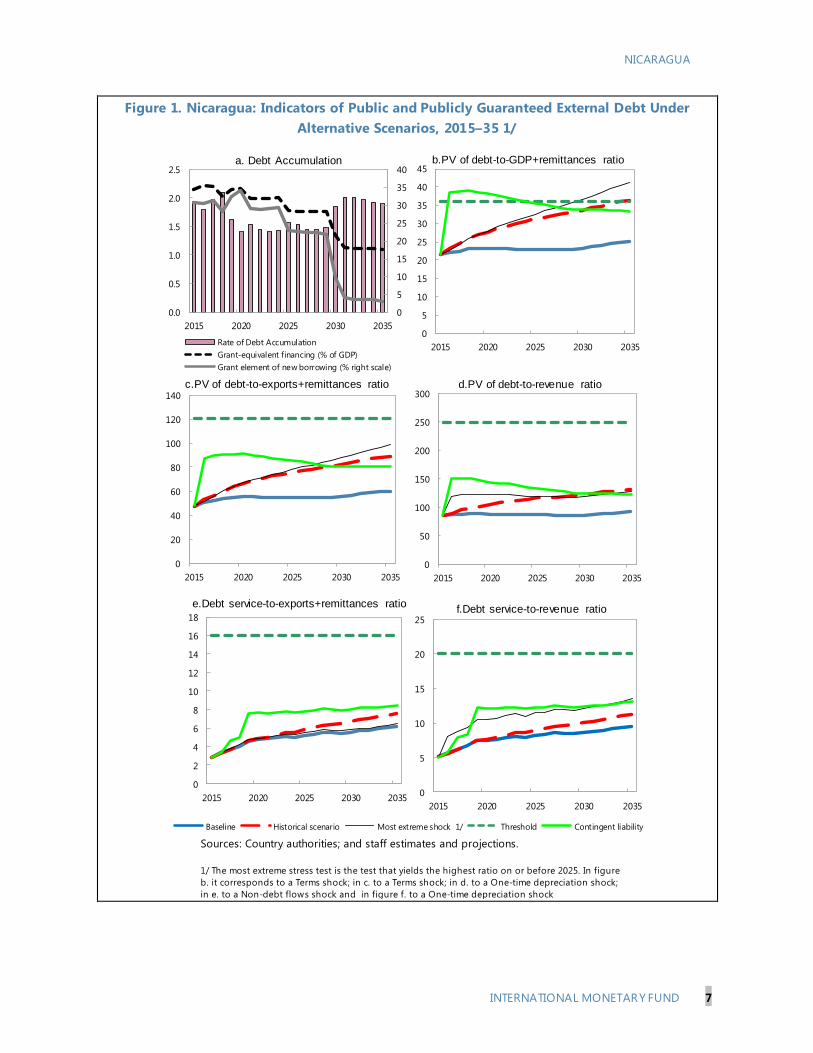
3. Under the baseline scenario, external public debt increases slightly from 33 percent at
end-2014 to 36 percent in 2035.4 The present value of external public debt is projected to remain
3 A joint Bank-Fund technical assistance project, in collaboration with CEMLA, is currently underway to assist the
authorities in upgrading their debt management practices and developing the domestic debt market.

NICARAGUA
4 INTERNATIONAL MONETARY FUND
well below all the relevant thresholds in the baseline scenario. The historical scenario, which notably
assumes a higher current account deficit than in the baseline (8.2 percent, based on the average
non-interest current account balance over the past 10 years) results in a breach in the outer years. A
change in the terms of external financing is also projected to result in a significant (and permanent)
increase in the PPG external debt stock. Given that financing from official sources is typically at fixed
interest rates, the risk of such a shock is low; nevertheless, this highlights the need for caution in
considering external borrowing at market rates.5
4. The rapid increase in private external debt, which includes the debt arising as a result
of the oil collaboration with Venezuela, requires continuous monitoring. While the government
has stressed that it is their policy not to extend public guarantees on this debt, this DSA (as was the
case in the 2013 DSA) includes a scenario whereby the government of Nicaragua absorbs about
60 percent of private external debt6 onto its balance sheet. This results in a breach of the PV of PPG
external debt-to-GDP+remittances threshold of 36 percent, with the ratio increasing to 38 percent
in 2016 (compared to 23 percent in the baseline).7 While the nominal amount of the additional debt
is large (about US$3.2 billion or 25½ percent of GDP), the concessional terms in the debt with
Venezuela imply less of an impact in present value terms.
C. Public Debt
5. Public debt-to-GDP has decreased slightly since the 2013 DSA, standing at
40.8 percent at end-2014. Under the baseline scenario, public debt-to-GDP is projected to stabilize
at around 41 percent by 2020, or 30 percent in present value terms, comfortably below the
56 percent benchmark. However, in the absence of further policy actions to enhance INSS’s
sustainability, the INSS fund is projected to be fully depleted by 2024.8 If this materializes, the central
government will need to transfer resources to INSS to help cover its obligations, as reflected in the
baseline of this DSA update report (from 32 percent of GDP in PV terms in 2015 to 48 percent
in 2035). Of all the standardized stress scenarios, a shock to real GDP growth in 2016–17—where
growth falls to 1.3 percent in these two years—will result in the least favorable outcome for all
indicators. The unchanged primary balance scenario is also worth noting as it highlights the need for
4 As in the 2013 DSA, remittances are included in denominator of the baseline and standardized stress scenarios.
Over the past 3 years, remittances have averaged 10 percent of GDP and 22 percent of exports of goods and
services, which is on the borderline of the Fund’s thresholds for taking them in to account in the DSA. However,
excluding remittances has little impact on this assessment.
5 The DSA considers, among other shocks, a scenario where key variables are set at 10-year historical averages, and a
two percentage point increase in the interest rate over the period of the analysis
6 This private debt includes the obligations of ALBANISA and CARUNA; the former is a limited liability entity jointly
owned by PDVSA and PETRONIC and the latter is a private financial cooperative. The authorities have informed staff
that the credit risk on the oil collaboration debt is borne exclusively by PDVSA.
7 It is assumed that the same concessional terms would apply to this new debt (specifically, 2 percent interest rate,
2 years grace period, 25 year maturity and a 5 percent discount rate), and that the government will not absorb any
additional debt generated from future oil imports.
8 This assessment is sensitive to assumptions about future growth in coverage, real wages, and healthcare costs .

NICARAGUA
INTERNATIONAL MONETARY FUND 5
fiscal consolidation—if the fiscal policy stance of 2015 is maintained over the long term, public debt
will come close to breaching the benchmark in 2035.
6. The contingent liability scenario described above in the external DSA is also applied to
the public DSA. The PV of public debt to GDP would increase to 50 percent of GDP
in 2016 compared to 32 percent in the baseline scenario. This scenario would eventually exceed the
benchmark over the longer term. Not considered in this DSA update is the risk that a deterioration
in the financial conditions or levels of the Venezuela oil cooperation could lead to certain projects
currently financed by CARUNA being absorbed by the budget. Staff estimates that these projects
could amount to about 1 percent of GDP. This risk is one of the factors motivating staff’s
recommendation to build fiscal buffers beginning in 2017 and also contributes to the staff’s
assessment that Nicaragua is at a heightened risk of overall debt distress.
D. Conclusion
7. The staff considers that Nicaragua remains at a moderate risk of external debt distress .
The concessional nature of most of the government’s external borrowing and their track record of
relatively prudent macroeconomic management results in a manageable baseline scenario. However,
the customized scenario and two of the standardized stress scenarios breach the external PPG debt
threshold in present value terms. Staff also considers Nicaragua to be at a heightened risk of overall
debt distress, given the magnitude of private external debt, the quasi-fiscal nature of some of this
debt, and the likelihood that some projects currently financed by Venezuela resources might end up
being absorbed by the budget. Moreover, public debt dynamics have worsened since the previous
DSA due to a more expansionary fiscal policy, and debt could become unsustainable in the event
that no additional action is taken to improve the INSS finances.
8. The authorities broadly concurred with the findings of the analysis, but noted some
important differences with their own debt sustainability analysis. First, the authorities’ growth
assumptions are more positive, with an average of 4.7 percent over the 2015–19 period and
5 percent thereafter, consistent with their expectation that stepped-up investment in infrastructure
will shift the growth path. Second, the authorities’ fiscal balance projections are more optimistic than
staff’s, owing in particular to higher revenue assumptions. Finally, while the authorities acknowledge
that INSS will need reform to ensure its long-term sustainability, they do not include any central
government transfers to INSS in their analysis, assuming that additional reforms will be undertaken
before any such transfers are required. The authorities reiterated that the debt owed by ALBANISA
and CARUNA to PDVSA is private and staff welcomes that the government’s policy is neither to
absorb nor to extend public guarantees on this debt. They also highlighted the significant progress
made on achieving debt relief from non-Paris Club creditors during 2014 and 2015.

Table 1. Nicaragua: External Debt Sustainability Framework, Baseline Scenario, 2012–35 1/ (Percent of GDP unless otherwise indicated)
Historical 6/ Standard 6/
Average Deviation 2015-2020 2021-20352012 2013 2014 2015 2016 2017 2018 2019 2020 Average 2025 2035 Average
External debt (nominal) 1/ 77.6 81.8 78.6 82.0 83.3 84.8 86.3 87.4 88.3 88.3 76.0of which: public and publicly guaranteed (PPG) 32.8 33.6 32.5 34.0 34.5 35.1 35.8 36.2 36.3 36.9 36.2
Change in external debt 4.3 4.2 -3.1 3.3 1.3 1.5 1.5 1.1 0.8 -0.5 -1.5Identified net debt-creating flows -1.1 1.8 -5.9 -1.5 -1.3 -0.7 -0.7 -0.6 -0.7 -0.7 -0.4
Non-interest current account deficit 9.1 9.5 5.5 8.2 1.9 6.2 6.6 7.1 7.0 6.8 6.9 6.8 6.9 6.9 6.9Deficit in balance of goods and services 20.1 20.8 16.7 17.4 17.5 17.8 17.6 17.4 17.2 17.2 17.2
Exports 45.3 42.5 42.4 40.0 38.7 38.1 37.8 37.2 36.5 36.5 36.5Imports 65.4 63.3 59.2 57.4 56.2 55.9 55.5 54.7 53.8 53.8 53.8
Net current transfers (negative = inflow) -12.5 -12.6 -12.2 -13.3 0.8 -12.3 -12.2 -12.0 -11.9 -11.7 -11.5 -11.5 -11.5 -11.5of which: official 0.0 0.0 0.0 0.0 0.0 0.0 0.0 0.0 0.0 0.0 0.0
Other current account flows (negative = net inflow) 1.5 1.3 1.0 1.2 1.3 1.3 1.2 1.1 1.2 1.2 1.2Net FDI (negative = inflow) -6.8 -6.5 -6.4 -6.0 1.7 -6.4 -6.2 -6.1 -5.9 -5.7 -5.8 -6.0 -5.8 -5.8 -5.8Endogenous debt dynamics 2/ -3.4 -1.2 -5.0 -1.2 -1.7 -1.6 -1.8 -1.7 -1.7 -1.8 -1.4
Contribution from nominal interest rate 1.6 1.6 1.6 1.8 1.6 1.5 1.4 1.6 1.6 1.5 1.5Contribution from real GDP growth -3.5 -3.4 -3.5 -3.1 -3.3 -3.1 -3.2 -3.2 -3.3 -3.3 -2.9Contribution from price and exchange rate changes -1.4 0.6 -3.1 … … … … … … … …
Residual (3-4) 3/ 5.4 2.5 2.8 4.8 2.6 2.2 2.2 1.7 1.5 0.2 -1.1of which: exceptional financing 0.0 0.0 0.0 0.0 0.0 0.0 0.0 0.0 0.0 0.0 ...
PV of external debt 4/ ... ... 68.3 71.5 73.0 74.4 75.8 76.6 77.2 76.5 67.0In percent of exports ... ... 160.9 178.9 188.7 195.4 200.3 205.9 211.2 209.4 183.5
PV of PPG external debt ... ... 22.2 23.6 24.1 24.7 25.3 25.4 25.2 25.1 27.2In percent of exports ... ... 52.3 59.0 62.4 64.9 66.9 68.1 69.0 68.7 74.5In percent of government revenues ... ... 86.0 85.5 85.9 87.6 88.9 88.7 87.7 86.2 92.2
Debt service-to-exports ratio (in percent) 13.0 13.5 14.4 16.6 17.4 17.9 18.2 19.2 19.6 20.1 18.1PPG debt service-to-exports ratio (in percent) 2.1 2.1 2.4 3.5 4.2 4.6 5.0 5.7 5.9 6.5 7.7PPG debt service-to-revenue ratio (in percent) 3.7 3.4 4.0 5.1 5.8 6.3 6.7 7.4 7.5 8.1 9.6Total gross financing need (Millions of U.S. dollars) 1324 1559 1163 1332 1562 1707 1841 1977 2108 2679 3876Non-interest current account deficit that stabilizes debt ratio 4.8 5.3 8.6 2.9 5.3 5.5 5.5 5.7 6.0 7.4 8.4
Key macroeconomic assumptions
Real GDP growth (in percent) 5.1 4.5 4.7 3.8 2.5 4.0 4.2 4.0 4.0 4.0 4.0 4.0 4.0 4.0 4.0GDP deflator in US dollar terms (change in percent) 2.0 -0.7 3.9 3.6 3.1 -1.4 1.1 1.8 2.1 2.3 2.3 1.3 2.1 2.1 2.1Effective interest rate (percent) 5/ 2.3 2.1 2.2 2.1 0.2 2.4 2.1 1.9 1.8 2.0 1.9 2.0 1.8 2.1 1.9Growth of exports of G&S (US dollar terms, in percent) 13.6 -2.5 8.5 15.8 13.5 -3.4 1.9 4.2 5.5 4.6 4.4 2.9 6.1 6.1 6.1Growth of imports of G&S (US dollar terms, in percent) 8.4 0.5 1.6 11.9 13.5 -0.6 3.3 5.3 5.3 4.8 4.6 3.8 6.1 6.1 6.1Grant element of new public sector borrowing (in percent) ... ... ... ... ... 30.8 30.4 31.2 28.4 32.3 34.2 31.2 22.9 3.0 17.1Government revenues (excluding grants, in percent of GDP) 25.6 25.9 25.8 27.6 28.1 28.2 28.5 28.6 28.7 29.1 29.5 29.3Aid flows (in Millions of US dollars) 7/ 216 180 132 286 322 336 315 345 371 406 395
of which: Grants 216 180 132 148 160 145 135 150 161 217 395of which: Concessional loans ... ... ... 138 162 191 180 196 209 189 0
Grant-equivalent financing (in percent of GDP) 8/ ... ... ... 2.2 2.2 2.2 2.0 2.2 2.2 1.8 1.1 1.6Grant-equivalent financing (in percent of external financing) 8/ ... ... ... 50.6 50.2 46.9 42.6 46.6 48.9 40.1 24.7 35.6
Memorandum items:Nominal GDP (Millions of US dollars) 10460 10851 11806 12102 12754 13497 14327 15238 16207 21842 39672Nominal dollar GDP growth 7.2 3.7 8.8 2.5 5.4 5.8 6.1 6.4 6.4 5.4 6.1 6.1 6.1PV of PPG external debt (in Millions of US dollars) 2557 2786 3003 3254 3538 3772 3987 5346 10537(PVt-PVt-1)/GDPt-1 (in percent) 1.9 1.8 2.0 2.1 1.6 1.4 1.8 1.6 1.9 1.7Gross workers' remittances (Millions of US dollars) 1014 1078 1136 1174 1221 1274 1332 1390 1447 1950 3542PV of PPG external debt (in percent of GDP + remittances) ... ... 20.2 21.5 22.0 22.6 23.2 23.2 23.1 23.0 25.0PV of PPG external debt (in percent of exports + remittances) ... ... 42.6 47.5 50.0 52.0 53.7 54.7 55.4 55.2 59.9Debt service of PPG external debt (in percent of exports + remittance ... ... 2.0 2.8 3.4 3.7 4.0 4.6 4.7 5.2 6.2
Sources: Country authorities; and staff estimates and projections.€ 1/ Includes both public and private sector external debt.2/ Derived as [r - g - ρ(1+g)]/(1+g+ρ+gρ) times previous period debt ratio, with r = nominal interest rate; g = real GDP growth rate, and ρ = growth rate of GDP deflator in U.S. dollar terms. 3/ Includes exceptional financing (i.e., changes in arrears and debt relief); changes in gross foreign assets; and valuation adjustments. For projections also includes contribution from price and exchange rate changes.4/ Assumes that PV of private sector debt is equivalent to its face value.5/ Current-year interest payments divided by previous period debt stock. 6/ Historical averages and standard deviations are generally derived over the past 10 years, subject to data availability. 7/ Defined as grants, concessional loans, and debt relief.8/ Grant-equivalent financing includes grants provided directly to the government and through new borrowing (difference between the face value and the PV of new debt).
Actual Projections
NICARAG
UA
6 IN
TERNATIO
NAL M
ON
ETARY FUN
D
NICARAGUA
INTERNATIONAL MONETARY FUND 7
Figure 1. Nicaragua: Indicators of Public and Publicly Guaranteed External Debt Under
Alternative Scenarios, 2015–35 1/
Sources: Country authorities; and staff estimates and projections.
1/ The most extreme stress test is the test that yields the highest ratio on or before 2025. In figure
b. it corresponds to a Terms shock; in c. to a Terms shock; in d. to a One-time depreciation shock;
in e. to a Non-debt flows shock and in figure f. to a One-time depreciation shock
0
5
10
15
20
25
2015 2020 2025 2030 2035
Baseline Historical scenario Most extreme shock 1/ Threshold Contingent liability
f.Debt service-to-revenue ratio
0
5
10
15
20
25
30
35
40
0.0
0.5
1.0
1.5
2.0
2.5
2015 2020 2025 2030 2035
Rate of Debt Accumulation
Grant-equivalent f inancing (% of GDP)
Grant element of new borrowing (% right scale)
a. Debt Accumulation
0
5
10
15
20
25
30
35
40
45
2015 2020 2025 2030 2035
b.PV of debt-to-GDP+remittances ratio
0
20
40
60
80
100
120
140
2015 2020 2025 2030 2035
c.PV of debt-to-exports+remittances ratio
0
50
100
150
200
250
300
2015 2020 2025 2030 2035
d.PV of debt-to-revenue ratio
0
2
4
6
8
10
12
14
16
18
2015 2020 2025 2030 2035
e.Debt service-to-exports+remittances ratio

NICARAGUA
8 INTERNATIONAL MONETARY FUND
Table 2. Nicaragua: Sensitivity Analysis for Key Indicators of Public and Publicly Guaranteed
External Debt, 2015–35
(In percent )
2015 2016 2017 2018 2019 2020 2025 2035
Baseline 22 22 23 23 23 23 23 25
A. Alternative Scenarios
A1. Key variables at their historical averages in 2015-2035 1/ 22 23 24 26 27 28 31 36
A2. New public sector loans on less favorable terms in 2015-2035 2 22 23 24 26 27 28 33 41
A3. Contingent liability scenario 22 38 39 39 39 38 36 33
B. Bound Tests
B1. Real GDP growth at historical average minus one standard deviation in 2016-2017 22 22 23 24 24 24 24 25
B2. Export value growth at historical average minus one standard deviation in 2016-2017 3/ 22 21 22 23 23 23 23 24
B3. US dollar GDP deflator at historical average minus one standard deviation in 2016-2017 22 22 22 23 23 23 23 25
B4. Net non-debt creating flows at historical average minus one standard deviation in 2016-2017 4/ 22 23 24 25 25 25 24 25
B5. Combination of B1-B4 using one-half standard deviation shocks 22 20 17 18 18 18 19 23
B6. One-time 30 percent nominal depreciation relative to the baseline in 2016 5/ 22 29 30 31 31 31 31 33
Baseline 47 50 52 54 55 55 55 60
A. Alternative Scenarios
A1. Key variables at their historical averages in 2015-2035 1/ 47 53 57 60 64 67 76 89
A2. New public sector loans on less favorable terms in 2015-2035 2 47 51 56 60 64 67 78 99
A3. Contingent liability scenario 47 87 89 91 91 91 85 80
B. Bound Tests
B1. Real GDP growth at historical average minus one standard deviation in 2016-2017 47 49 51 52 53 54 54 58
B2. Export value growth at historical average minus one standard deviation in 2016-2017 3/ 47 48 52 54 55 55 55 59
B3. US dollar GDP deflator at historical average minus one standard deviation in 2016-2017 47 49 51 52 53 54 54 58
B4. Net non-debt creating flows at historical average minus one standard deviation in 2016-2017 4/ 47 51 56 58 59 59 58 60
B5. Combination of B1-B4 using one-half standard deviation shocks 47 42 35 37 38 39 40 48
B6. One-time 30 percent nominal depreciation relative to the baseline in 2016 5/ 47 49 51 52 53 54 54 58
Baseline 85 86 88 89 89 88 86 92
A. Alternative Scenarios
A1. Key variables at their historical averages in 2015-2035 1/ 85 90 95 99 102 104 116 131
A2. New public sector loans on less favorable terms in 2015-2035 2 85 88 94 100 103 106 122 152
A3. Contingent liability scenario 85 150 150 150 148 144 133 123
B. Bound Tests
B1. Real GDP growth at historical average minus one standard deviation in 2016-2017 85 86 90 92 91 90 89 94
B2. Export value growth at historical average minus one standard deviation in 2016-2017 3/ 85 83 87 88 87 86 85 90
B3. US dollar GDP deflator at historical average minus one standard deviation in 2016-2017 85 84 87 88 88 87 85 91
B4. Net non-debt creating flows at historical average minus one standard deviation in 2016-2017 4/ 85 89 95 95 95 94 91 93
B5. Combination of B1-B4 using one-half standard deviation shocks 85 77 67 69 69 69 70 84
B6. One-time 30 percent nominal depreciation relative to the baseline in 2016 5/ 85 119 121 123 123 121 119 127
Projections
PV of debt-to-GDP+remittances ratio
PV of debt-to-exports+remittances ratio
PV of debt-to-revenue ratio

NICARAGUA
INTERNATIONAL MONETARY FUND 9
Table 2. Nicaragua: Sensitivity Analysis for Key Indicators of Public and Publicly Guaranteed
External Debt, 2015–35 (Concluded)
Baseline 3 3 4 4 5 5 5 6
A. Alternative Scenarios
A1. Key variables at their historical averages in 2015-2035 1/ 3 3 4 4 5 5 6 8
A2. New public sector loans on less favorable terms in 2015-2035 2 3 3 3 3 4 4 5 9
A3. Contingent liability scenario 3 3 5 5 8 8 8 8
B. Bound Tests
B1. Real GDP growth at historical average minus one standard deviation in 2016-2017 3 3 4 4 5 5 5 6
B2. Export value growth at historical average minus one standard deviation in 2016-2017 3/ 3 3 4 4 5 5 5 6
B3. US dollar GDP deflator at historical average minus one standard deviation in 2016-2017 3 3 4 4 5 5 5 6
B4. Net non-debt creating flows at historical average minus one standard deviation in 2016-2017 4/ 3 3 4 4 5 5 6 6
B5. Combination of B1-B4 using one-half standard deviation shocks 3 3 3 3 4 4 4 5
B6. One-time 30 percent nominal depreciation relative to the baseline in 2016 5/ 3 3 4 4 5 5 5 6
Baseline 5 6 6 7 7 7 8 10
A. Alternative Scenarios
A1. Key variables at their historical averages in 2015-2035 1/ 5 6 6 7 7 8 9 11
A2. New public sector loans on less favorable terms in 2015-2035 2 5 6 5 6 7 7 8 15
A3. Contingent liability scenario 5 6 8 8 12 12 12 13
B. Bound Tests
B1. Real GDP growth at historical average minus one standard deviation in 2016-2017 5 6 7 7 8 8 8 10
B2. Export value growth at historical average minus one standard deviation in 2016-2017 3/ 5 6 6 7 7 7 8 10
B3. US dollar GDP deflator at historical average minus one standard deviation in 2016-2017 5 6 6 7 7 7 8 10
B4. Net non-debt creating flows at historical average minus one standard deviation in 2016-2017 4/ 5 6 6 7 8 8 9 10
B5. Combination of B1-B4 using one-half standard deviation shocks 5 6 6 6 7 7 7 9
B6. One-time 30 percent nominal depreciation relative to the baseline in 2016 5/ 5 8 9 9 10 10 11 13
Memorandum item:
Grant element assumed on residual financing (i.e., financing required above baseline) 6/ 13 13 13 13 13 13 13 13
Sources: Country authorities; and staff estimates and projections.
1/ Variables include real GDP growth, growth of GDP deflator (in U.S. dollar terms), non-interest current account in percent of GDP, and non-debt creating flows.
2/ Assumes that the interest rate on new borrowing is by 2 percentage points higher than in the baseline., while grace and maturity periods are the same as in the baseline.
3/ Exports values are assumed to remain permanently at the lower level, but the current account as a share of GDP is assumed to return to its baseline level after the shock (implicitly assuming
an offsetting adjustment in import levels).
4/ Includes official and private transfers and FDI.
5/ Depreciation is defined as percentage decline in dollar/local currency rate, such that it never exceeds 100 percent.
6/ Applies to all stress scenarios except for A2 (less favorable financing) in which the terms on all new financing are as specified in footnote 2.
Debt service-to-revenue ratio
Debt service-to-exports+remittances ratio

Table 3. Nicaragua: Public Sector Debt Sustainability Framework, Baseline Scenario, 2012–35 (Percent of GDP, unless otherwise indicated)
Estimate
2012 2013 2014 Average5/ Standard
Deviation
5/
2015 2016 2017 2018 2019 20202015-20 Average 2025 2035
2021-35 Average
Public sector debt 1/ 41.9 43.0 40.8 42.6 41.9 41.8 41.5 41.0 40.8 42.6 56.7of which: foreign-currency denominated 40.2 41.4 39.5 41.4 40.8 40.8 40.7 40.3 40.2 42.4 56.8
Change in public sector debt -1.3 1.1 -2.2 1.8 -0.8 -0.1 -0.2 -0.5 -0.2 0.8 1.9Identified debt-creating flows -2.2 -0.2 -1.6 1.6 0.3 0.4 0.2 0.0 0.3 0.6 1.4
Primary deficit -0.4 0.2 0.9 -0.3 1.5 1.5 1.4 1.6 1.5 1.2 1.4 1.4 1.5 1.4 1.4Revenue and grants 27.7 27.6 26.9 28.8 29.4 29.3 29.4 29.6 29.7 29.4 30.1 30.5 30.3
of which: grants 2.1 1.7 1.1 1.2 1.3 1.1 0.9 1.0 1.0 1.0 1.0Primary (noninterest) expenditure 27.3 27.8 27.8 30.3 30.7 30.8 30.9 30.7 31.1 30.8 31.5 31.9 31.8
Automatic debt dynamics -1.8 -0.4 -2.4 0.1 -1.1 -1.2 -1.3 -1.2 -1.1 -0.9 0.0Contribution from interest rate/growth differential -1.7 -1.4 -1.6 -0.8 -1.1 -1.2 -1.2 -1.1 -1.0 -0.9 0.0
of which: contribution from average real interest rate 0.4 0.4 0.4 0.7 0.6 0.4 0.4 0.5 0.5 0.7 2.1of which: contribution from real GDP growth -2.1 -1.8 -1.9 -1.6 -1.7 -1.6 -1.6 -1.6 -1.6 -1.6 -2.1
Contribution from real exchange rate depreciation -0.1 0.9 -0.9 0.9 0.0 0.0 0.0 0.0 0.0 ... ...Other identified debt-creating flows 0.0 0.0 0.0 0.0 0.0 0.0 0.0 0.0 0.0 0.0 0.0
Privatization receipts (negative) 0.0 0.0 0.0 0.0 0.0 0.0 0.0 0.0 0.0 0.0 0.0Recognition of implicit or contingent liabilities 0.0 0.0 0.0 0.0 0.0 0.0 0.0 0.0 0.0 0.0 0.0Debt relief (HIPC and other) 0.0 0.0 0.0 0.0 0.0 0.0 0.0 0.0 0.0 0.0 0.0Other (specify, e.g. bank recapitalization) 0.0 0.0 0.0 0.0 0.0 0.0 0.0 0.0 0.0 0.0 0.0
Residual, including asset changes 0.8 1.3 -0.6 0.2 -1.0 -0.5 -0.4 -0.5 -0.4 0.2 0.5
Other Sustainability IndicatorsPV of public sector debt ... ... 30.5 32.2 31.5 31.3 31.0 30.2 29.7 30.8 47.7
of which: foreign-currency denominated ... ... 29.1 30.9 30.4 30.4 30.2 29.5 29.1 30.6 47.8of which: external ... ... 22.2 23.6 24.1 24.7 25.3 25.4 25.2 25.1 27.2
PV of contingent liabilities (not included in public sector debt) ... ... ... ... ... ... ... ... ... ... ...Gross financing need 2/ 7.6 6.9 7.9 6.4 5.9 5.7 5.5 5.0 5.4 5.0 8.7PV of public sector debt-to-revenue and grants ratio (in percent) … … 113.3 111.7 107.4 107.0 105.5 102.2 100.0 102.5 156.5PV of public sector debt-to-revenue ratio (in percent) … … 118.2 116.7 112.2 111.1 109.0 105.7 103.5 106.0 161.8
of which: external 3/ … … 86.0 85.5 85.9 87.6 88.9 88.7 87.7 86.2 92.2Debt service-to-revenue and grants ratio (in percent) 4/ 19.7 15.2 16.6 9.5 9.9 9.9 10.0 10.3 10.6 12.2 26.0Debt service-to-revenue ratio (in percent) 4/ 21.3 16.2 17.3 9.9 10.4 10.2 10.3 10.7 11.0 12.7 26.9Primary deficit that stabilizes the debt-to-GDP ratio 1.0 -0.9 3.0 -0.3 2.1 1.7 1.7 1.7 1.5 1.4 0.7 -0.5 0.2
Key macroeconomic and fiscal assumptionsReal GDP growth (in percent) 5.1 4.5 4.7 3.8 2.5 4.0 4.2 4.0 4.0 4.0 4.0 4.0 4.0 4.0 4.0Average nominal interest rate on forex debt (in percent) 3.0 2.7 2.7 2.8 0.7 2.9 2.7 2.8 3.0 3.4 3.6 3.1 3.9 6.2 4.7Average real interest rate on domestic debt (in percent) -1.7 1.1 -3.5 -3.4 3.4 0.8 2.0 1.2 1.1 2.1 -1.9 0.9 -1.7 -1.7 -1.7Real exchange rate depreciation (in percent, + indicates depreciation -0.2 2.4 -2.2 -1.4 2.7 2.5 ... ... ... ... ... ... ... ... ...Inflation rate (GDP deflator, in percent) 7.1 4.2 9.1 8.7 3.3 3.5 6.1 6.8 7.2 7.4 7.4 6.4 7.2 7.2 7.2Growth of real primary spending (deflated by GDP deflator, in percen 8.9 6.5 4.8 2.1 3.4 13.5 5.6 4.4 4.2 3.5 5.1 6.0 4.4 4.0 4.2Grant element of new external borrowing (in percent) ... ... ... … … 30.8 30.4 31.2 28.4 32.3 34.2 31.2 22.9 3.0 ...
Sources: Country authorities; and staff estimates and projections.1/ [Indicate coverage of public sector, e.g., general government or nonfinancial public sector. Also whether net or gross debt is used.]2/ Gross financing need is defined as the primary deficit plus debt service plus the stock of short-term debt at the end of the last period. 3/ Revenues excluding grants.4/ Debt service is defined as the sum of interest and amortization of medium and long-term debt.5/ Historical averages and standard deviations are generally derived over the past 10 years, subject to data availability.
Actual Projections
NICARAG
UA
10 IN
TERNATIO
NAL M
ON
ETARY FUN
D

NICARAGUA
INTERNATIONAL MONETARY FUND 11
Table 4. Nicaragua: Sensitivity Analysis for Key Indicators of Public Debt, 2015–35
2015 2016 2017 2018 2019 2020 2025 2035
Baseline 32 32 31 31 30 30 31 48
A. Alternative scenarios
A1. Real GDP growth and primary balance are at historical averages 32 30 28 27 24 22 16 20
A2. Primary balance is unchanged from 2015 32 32 31 31 31 30 31 49
A3. Permanently lower GDP growth 1/ 32 32 32 32 32 33 40 84
A4. Contingent liability scenario 32 50 50 49 48 47 45 58
B. Bound tests
B1. Real GDP growth is at historical average minus one standard deviations in 2016-2017 32 33 35 37 37 38 47 79
B2. Primary balance is at historical average minus one standard deviations in 2016-2017 32 31 31 31 30 29 30 47
B3. Combination of B1-B2 using one half standard deviation shocks 32 31 30 31 31 31 37 62
B4. One-time 30 percent real depreciation in 2016 32 46 45 44 43 42 44 74
B5. 10 percent of GDP increase in other debt-creating flows in 2016 32 41 41 40 39 39 40 56
Baseline 112 108 107 106 102 100 103 157
A. Alternative scenarios
A1. Real GDP growth and primary balance are at historical averages 112 103 97 90 82 76 53 65
A2. Primary balance is unchanged from 2015 112 108 107 106 104 102 105 161
A3. Permanently lower GDP growth 1/ 112 109 110 110 109 110 134 274
A4. Contingent liability scenario 112 171 170 167 162 157 151 190
B. Bound tests
B1. Real GDP growth is at historical average minus one standard deviations in 2016-2017 112 113 121 124 126 129 155 257
B2. Primary balance is at historical average minus one standard deviations in 2016-2017 112 107 106 104 101 99 101 156
B3. Combination of B1-B2 using one half standard deviation shocks 112 106 104 105 105 105 122 204
B4. One-time 30 percent real depreciation in 2016 112 156 153 150 145 142 147 242
B5. 10 percent of GDP increase in other debt-creating flows in 2016 112 139 139 137 134 131 132 182
Baseline 10 10 10 10 10 11 12 26
A. Alternative scenarios
A1. Real GDP growth and primary balance are at historical averages 10 10 9 9 8 7 5 14
A2. Primary balance is unchanged from 2015 10 10 10 10 10 11 12 27
A3. Permanently lower GDP growth 1/ 10 10 10 10 11 12 16 42
A4. Contingent liability scenario 10 10 12 12 15 15 16 29
B. Bound tests
B1. Real GDP growth is at historical average minus one standard deviations in 2016-2017 10 10 11 12 13 14 19 40
B2. Primary balance is at historical average minus one standard deviations in 2016-2017 10 10 10 10 10 10 12 26
B3. Combination of B1-B2 using one half standard deviation shocks 10 10 10 9 10 11 15 33
B4. One-time 30 percent real depreciation in 2016 10 12 13 14 15 16 21 44
B5. 10 percent of GDP increase in other debt-creating flows in 2016 10 10 13 16 16 17 16 29
Sources: Country authorities; and staff estimates and projections.
1/ Assumes that real GDP growth is at baseline minus one standard deviation divided by the square root of the length of the projection period.
2/ Revenues are defined inclusive of grants.
PV of Debt-to-GDP Ratio
Projections
PV of Debt-to-Revenue Ratio 2/
Debt Service-to-Revenue Ratio 2/

NICARAGUA
12 INTERNATIONAL MONETARY FUND
Figure 2. Nicaragua: Indicators of Public Debt Under Alternative Scenarios,
2015–35 1/
Most extreme shock Growth
Sources: Country authorities; and staff estimates and projections.
1/ The most extreme stress test is the test that yields the highest ratio on or before 2025.
This corresponds to a shock to real GDP growth of one std. dev. in 2016-2020 for the top two charts
and a real depreciation of the exchange rate of 30 percent in 2016 for the bottom chart.
2/ Revenues are defined inclusive of grants.
Baseline
Public debt benchmark
Most extreme shock 1/
Contingent liabilityHistorical scenario
Fix Primary Balance
0
50
100
150
200
250
300
2015 2017 2019 2021 2023 2025 2027 2029 2031 2033 2035
PV of Debt-to-Revenue Ratio 2/
0
10
20
30
40
50
60
70
80
90
2015 2017 2019 2021 2023 2025 2027 2029 2031 2033 2035
PV of Debt-to-GDP Ratio
0
5
10
15
20
25
30
35
40
45
50
2015 2017 2019 2021 2023 2025 2027 2029 2031 2033 2035
Debt Service-to-Revenue Ratio