nhs fife acute services scheduled care demand & capacity 25 august 2015
TRANSCRIPT

NHS Fife Acute Services
Scheduled Care Demand & Capacity
25 August 2015

Context of this piece of work
Scheduled Care Demand & Capacity
Acute
Whole System
Unscheduled Care Demand & Capacity
H&SC
Winter Plan
Operational SGHSCD IJB
Finance, Performance & Resource cycle

Operational Performance Financial Governance
Staff Governance Clinical Governance
Patient

Who we are asked to see
Who we arrange to see
Who we end up seeing
Where we see them
How long it takes
How much it costs
What the future holds
Models, Reality & Recovery

Demand
Capacity
Activity
QueueCost
Performance
Finance, Performance & Resource cycle
NHS Fife Acute Services
Scheduled Care Demand & Capacity
OUTPATIENTS

New OutpatientsActual Projected
Indicator
14-15 Total
Monthly Average
15-16 Total
Monthly Average
Current Wait List
Size 25/06/15
Number Waiting over 12 weeks
25/06/15
% Waiting over 12 weeks
25/06/15
Outpatient Referrals 92,710 7,726 94,800 7,90014,583 2,553 18%Outpatient Core Capacity 83,732 6,978 86,906 7,242
Capacity Surplus/Deficit -8,978 -748 -7,894 -658
New Outpatients 1 2 3 4 5 6 7 8 9 10 11 12Actual
Indicator
14-04 14-05 14-06 14-07 14-08 14-09 14-10 14-11 14-12 15-01 15-02 15-03 14-15 Total
Monthly Average
Outpatient Referrals 7,452 8,257 7,730 8,371 7,246 7,950 8,076 7,436 7,145 7,300 7,265 8,482 92,710 7,726Outpatient Core Capacity 7,001 7,001 7,001 7,001 7,001 7,001 7,001 7,001 7,001 7,001 6,861 6,861 83,732 6,978Capacity Surplus/Deficit -451 -1,256 -729 -1,370 -245 -949 -1,075 -435 -144 -299 -404 -1,621 -8,978 -748

New OutpatientsActual
Indicator
14-15 Total Monthly Average
Outpatient Activity 82,198 6,850Outpatient DNAs 8,234 686Outpatient Core Capacity 83,732 6,978
90,432 seen, vs core capacity of 83,732 = +6,700 (108%)
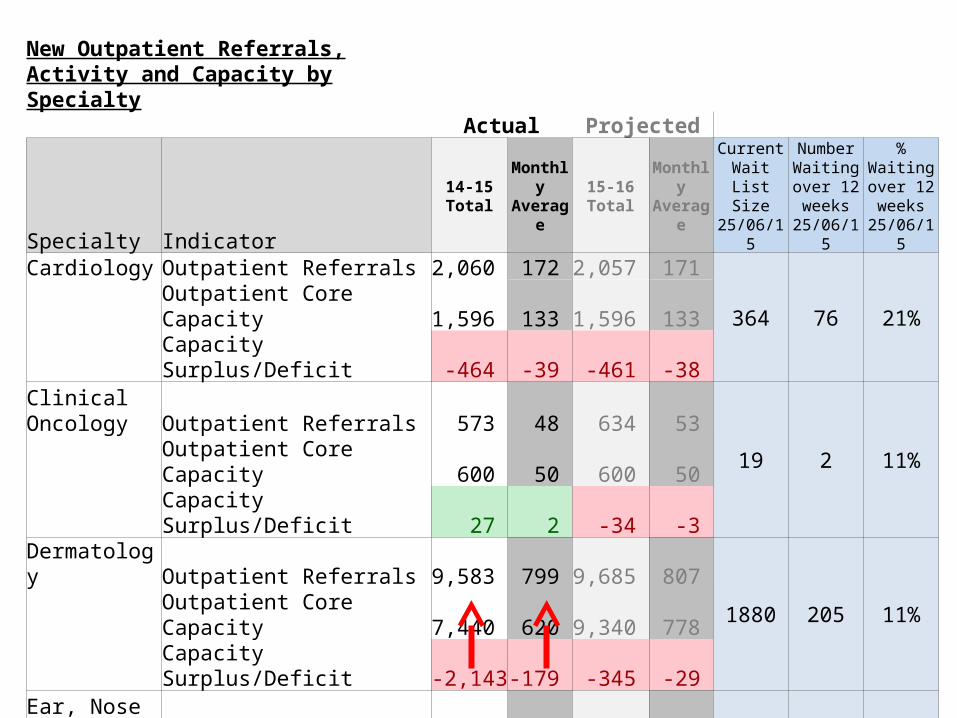
New Outpatient Referrals, Activity and Capacity by Specialty
Actual Projected
Specialty Indicator
14-15 Total Monthly Average 15-16 Total Monthly
Average
Current Wait List
Size 25/06/15
Number Waiting over 12 weeks
25/06/15
% Waiting over 12 weeks
25/06/15
Cardiology Outpatient Referrals 2,060 172 2,057 171 364 76 21% Outpatient Core Capacity 1,596 133 1,596 133
Capacity Surplus/Deficit -464 -39 -461 -38 Clinical Oncology Outpatient Referrals 573 48 634 53 19 2 11% Outpatient Core Capacity 600 50 600 50 Capacity Surplus/Deficit 27 2 -34 -3 Dermatology Outpatient Referrals 9,583 799 9,685 807
1880 205 11% Outpatient Core Capacity 7,440 620 9,340 778 Capacity Surplus/Deficit -2,143 -179 -345 -29 Ear, Nose & Throat Outpatient Referrals 9,154 763 9,338 778 1101 1 0% Outpatient Core Capacity 8,720 727 9,360 780 Capacity Surplus/Deficit -434 -36 22 2

New Outpatient Referrals, Activity and Capacity by Specialty
Actual Projected
Specialty Indicator
14-15 Total Monthly Average 15-16 Total Monthly
Average
Current Wait List
Size 25/06/15
Number Waiting over 12 weeks
25/06/15
% Waiting over 12 weeks
25/06/15
Endocrinology & Diabetes Outpatient Referrals 772 64 777 65 106 7 7% Outpatient Core Capacity 804 67 804 67 Capacity Surplus/Deficit 32 3 27 2 Gastroenterology Outpatient Referrals 5,580 465 6,419 535 1247 578 46% Outpatient Core Capacity 4,044 337 4,044 337 Capacity Surplus/Deficit -1,536 -128 -2,375 -198 General Medicine Outpatient Referrals 7 1 0 0 0 - Outpatient Core Capacity 0 0 0 0 Capacity Surplus/Deficit -7 -1 0 -General Surgery Outpatient Referrals 7,414 618 7,890 658 972 43 4% Outpatient Core Capacity 6,804 567 6,804 567 Capacity Surplus/Deficit -610 -51 -1,086 -91

New Outpatient Referrals, Activity and Capacity by Specialty
Actual Projected
Specialty Indicator
14-15 Total
Monthly Average
15-16 Total
Monthly Average
Current Wait List
Size 25/06/15
Number Waiting over 12 weeks
25/06/15
% Waiting over 12 weeks
25/06/15
Gynaecology Outpatient Referrals 6,125 510 6,124 510 716 8 1% Outpatient Core Capacity 6,540 545 6,540 545
Capacity Surplus/Deficit 415 35 416 35 Nephrology Outpatient Referrals 278 23 293 24
53 14 26% Outpatient Core Capacity 276 23 276 23 Capacity Surplus/Deficit -2 -0 -17 -1 Neurology Outpatient Referrals 3,411 284 3,416 285
826 188 23% Outpatient Core Capacity 2,244 187 2,718 227 Capacity Surplus/Deficit -1,167 -97 -698 -58 Ophthalmology Outpatient Referrals 8,580 715 8,400 700 1126 97 9% Outpatient Core Capacity 8,532 711 8,532 711 Capacity Surplus/Deficit -48 -4 132 11 Oral Surgery Outpatient Referrals 3,196 266 3,190 266
708 156 22% Outpatient Core Capacity 2,736 228 2,736 228 Capacity Surplus/Deficit -460 -38 -454 -38
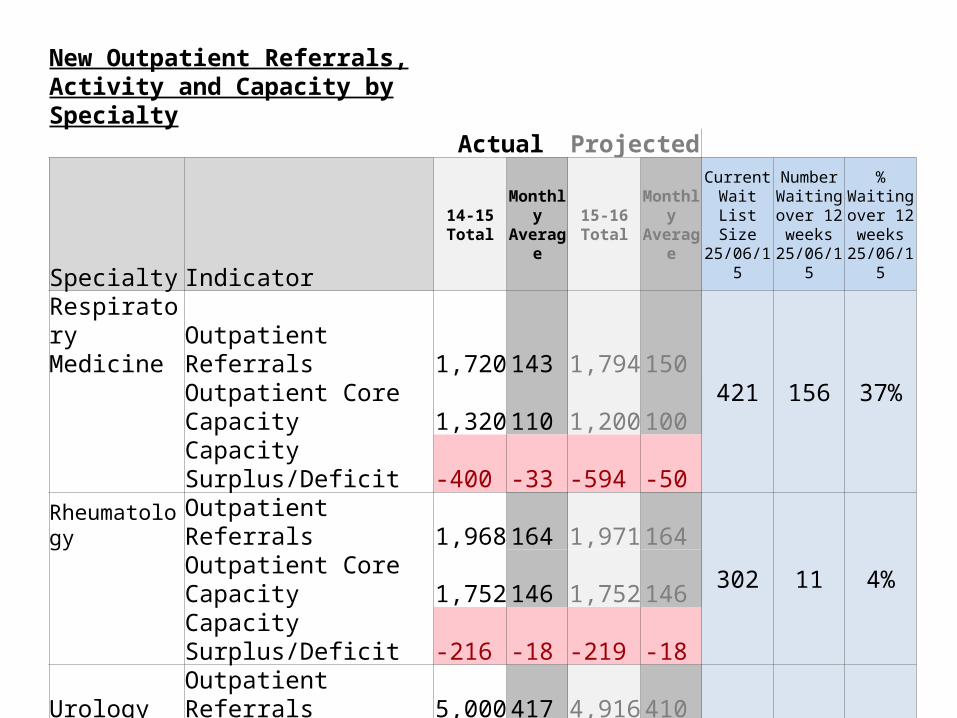
New Outpatient Referrals, Activity and Capacity by Specialty
Actual Projected
Specialty Indicator
14-15 Total
Monthly Average
15-16 Total
Monthly Average
Current Wait List
Size 25/06/15
Number Waiting over 12 weeks
25/06/15
% Waiting over 12 weeks
25/06/15
Respiratory Medicine Outpatient Referrals 1,720 143 1,794 150 421 156 37% Outpatient Core Capacity 1,320 110 1,200 100 Capacity Surplus/Deficit -400 -33 -594 -50 Rheumatology Outpatient Referrals 1,968 164 1,971 164
302 11 4% Outpatient Core Capacity 1,752 146 1,752 146 Capacity Surplus/Deficit -216 -18 -219 -18 Urology Outpatient Referrals 5,000 417 4,916 410
1327 644 49% Outpatient Core Capacity 4,524 377 4,524 377 Capacity Surplus/Deficit -476 -40 -392 -33 Vascular Surgery Outpatient Referrals 1,776 148 1,414 118 308 99 32% Outpatient Core Capacity 1,608 134 1,608 134 Capacity Surplus/Deficit -168 -14 194 16

NHS Fife Acute Services
Scheduled Care Demand & Capacity
INPATIENTS

Specialties with Theatre CapacityActual
Indicator
14-15 Total Monthly Average
IP/DC Additions to List 15,104 1,259IP/DC Removals 1,363 114IP/DC Activity 13,793 1,149IP/DC Core Capacity 12,768 1,064Capacity Surplus/Deficit -973 -81
13,793 treated, vs core capacity of 12,768 = +1,025 (108%)

Elective Inpatient/Daycase
Specialties with Theatre Capacity
Actual Projected
Indicator
14-15 Total
Monthly Average
15-16 Total
Monthly Average
Current Wait List
Size 25/06/15
Number Waiting over 12 weeks
25/06/15
% Waiting over 12 weeks
25/06/15
IP/DC Additions to List 15,104 1,259 15,091 1,2581,946 18 1%IP/DC Core Capacity 12,768 1,064 12,804 1,067
Capacity Surplus/Deficit -973 -81 -929 -77
Elective IP/DC
Specialties with Theatre Capacity
Actual
Indicator14-04 14-05 14-06 14-07 14-08 14-09 14-10 14-11 14-12 15-01 15-02 15-03 14-15
TotalMonthly Average
IP/DC Additions to List 1,289 1,274 1,277 1,238 1,157 1,448 1,224 1,334 1,168 1,258 1,126 1,311 15,104 1,259IP/DC Core Capacity 1,064 1,064 1,064 1,064 1,064 1,064 1,064 1,064 1,064 1,064 1,064 1,064 12,768 1,064Capacity Surplus/Deficit -122 -97 -87 -70 19 -246 -19 -149 4 -81 24 -149 -973 -81

Conversion Rates for Specialties with Theatre Capacity
2014-15 Actual
SpecialtyOutpatient Activity IP/DC Additions to
List Conversion Rate
Cardiology 1,951 164 8%
Ear, Nose & Throat 8,145 1,566 19%General Surgery (Excl. Vascular) 6,792 2,952 43%Gynaecology 5,586 2,075 37%
Ophthalmology 7,839 310 4%
Oral Surgery 2,716 960 35%
Orthopaedic Surgery 14,089 4,507 32%
Plastic Surgery 1,162 457 39%
Surgical Paediatric 383 91 24%
Urology 4,028 1,707 42%
Vascular Surgery 1,613 315 20%
Total/Average 54,304 15,104 28%

NHS Fife Acute Services
Scheduled Care Demand & Capacity
TARGETS & TRAJECTORIES


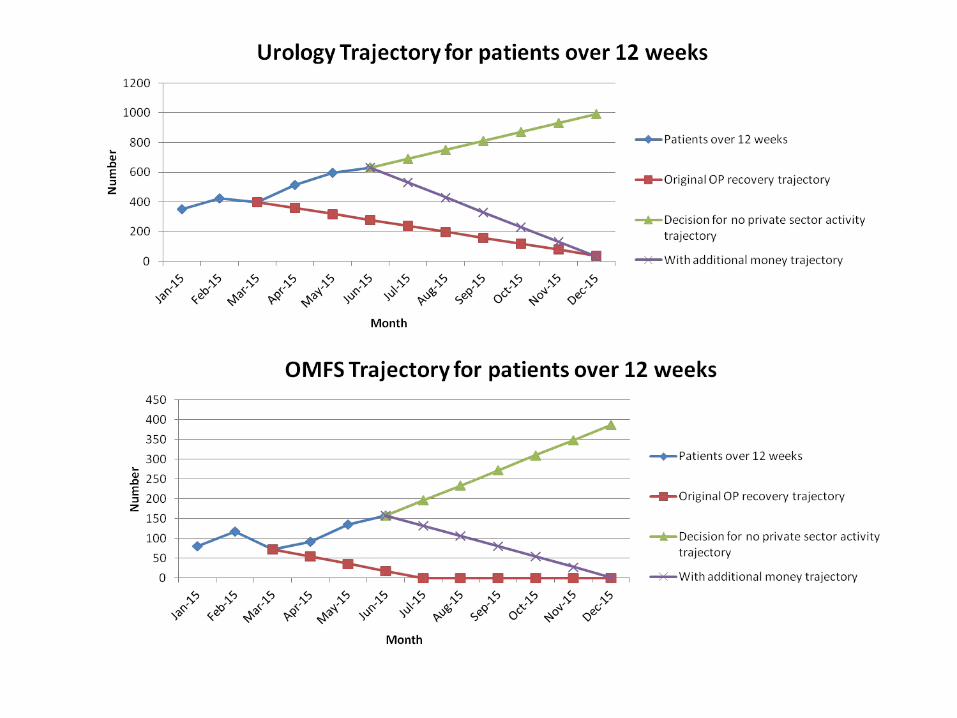


What’s missing?
• Cataracts
• Diagnostics
• Mapping of the money:• Extant budget• Recurring/Historical overspend to achieve the targets• Additional SGHSCD monies

NHS Fife Acute Services
Optimising Efficiencies in Scheduled Care
July 2015

Drivers
• Very high cost part of the business (Planned Care budget is £76m with a forecast variance of >£6m)
• Almost always an opportunity for efficiencies
• Local intelligence that there are significant opportunities for efficiencies
• Efficiencies are clinical, operational and financial

Who we operate on & why
Arriving pts at Theatre
Anaesthesia
Where we operate
Productivity
Efficiency
Thresholds; Benchmarking; Variability; PLCV
Booking timelines; Pre-assessment model; Cancellations; Removals; SEAL
In-theatre vs. out-of-theatre; Daycase rates
Right-sizing; Job-Planning; Maximising operating time; Variability; Thresholds; QMH vs. VHK practice
Start times; KPIs (operational and clinical); Benchmarking
KPIs; Intra-specialty; ?Inter-specialty

Next steps• Resource to do the work
• Start September 2015• Diagnostic phase complete October 2015• Change programme worked up, discussed and project-planned November 2015
• Include beds
• Include unscheduled demand/capacity/activity
• Include conversions to IP/DC outwith Fife

Anticipated Outcomes• Early operational efficiencies
• Identification of more medium/long-term operational and cash-releasing efficiencies
• Improved clinical value and potentially improved clinical care

Anticipated Outcomes
• Increased confidence amongst staff in Surgery that the organisation is interested in and passionate about being a centre of surgical excellence
• Potential reconfiguration of the total surgical bedbase
• Aid to decision-making regarding Orthopaedic theatre and inpatient capacity

Context of this piece of work
Scheduled Care Demand & Capacity
Acute
Whole System
Unscheduled Care Demand & Capacity
H&SC
Winter Plan
Operational SGHSCD IJB
Finance, Performance & Resource cycle

Context of this piece of work
Scheduled Care Demand & Capacity
Acute
Whole System
Unscheduled Care Demand & Capacity
H&SC
Winter Plan
Operational SGHSCD IJB
OPTIMISING EFFICIENCIES IN SCHEDULED CARE
ORTHOPAEDICS