ng flow meters – why calibrate – terry grimley
TRANSCRIPT

Natural Gas Flow Meters - Why Calibrate?
Terry Grimley Ed Bowles, Jr.
Jim Witte Southwest Research Institute
San Antonio, Texas
(…and how to)
Metering Research Facility at SwRI (In operation since 1991)
2
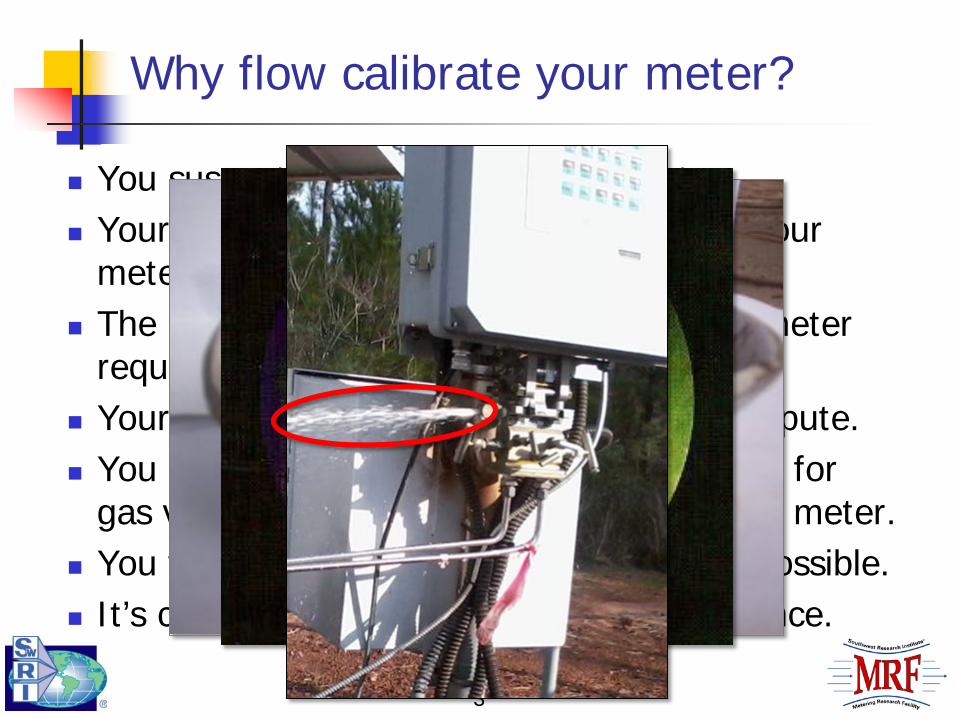
Why flow calibrate your meter?
You suspect a problem with your meter. Your sales contract or tariff requires that your
meter be flow calibrated. The applicable industry standard for your meter
requires flow meter calibration. Your meter is part of a custody transfer dispute. You are conducting a lost and unaccounted for
gas volume investigation that includes your meter. You want the meter to be as accurate as possible. It’s cheap (sometimes VERY cheap) insurance.
3
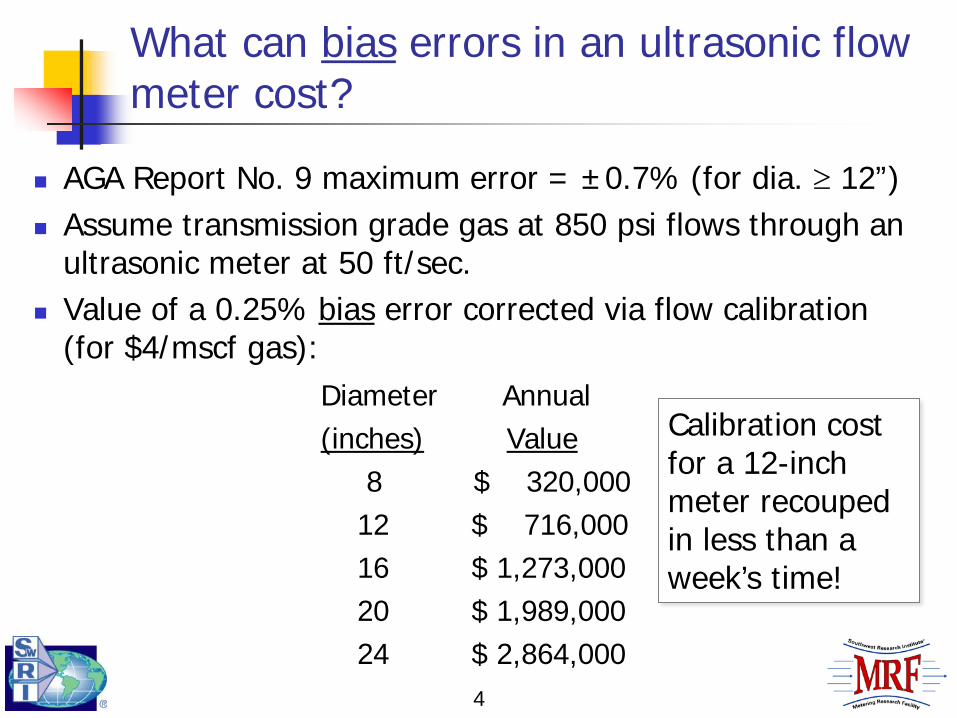
What can bias errors in an ultrasonic flow meter cost?
AGA Report No. 9 maximum error = ±0.7% (for dia. ≥ 12”) Assume transmission grade gas at 850 psi flows through an
ultrasonic meter at 50 ft/sec. Value of a 0.25% bias error corrected via flow calibration
(for $4/mscf gas): Diameter Annual (inches) Value 8 $ 320,000 12 $ 716,000 16 $ 1,273,000 20 $ 1,989,000 24 $ 2,864,000 4
Calibration cost for a 12-inch meter recouped in less than a week’s time!

Let’s begin with some terminology…
Accuracy (a.k.a., error) - A qualitative concept of the closeness in agreement of a measured value and an accepted “reference” or “true” value.
Repeatability (a.k.a., precision) - The variation in measurements taken by a single person or instrument on the same item (e.g., flow meter) and under the same conditions over a short period of time.
Reproducibility - The variation in measurements that occurs when any of the repeatability conditions have changed (e.g., person, instrument, time, etc.).
5

Average Measurement
Magnitude of Sampled Variable, X (e.g., flow rate)
Freq
uenc
y of
Occ
urre
nce
Measurement Uncertainty (a.k.a., the upper limit of the measurement error)
Precise (i.e., Narrow Base)
Imprecise (i.e., Wide Base)
“True” Value (Never known!)
Precise, Biased
Imprecise, Biased
(“Normal” or “Gaussian” Distribution) 6
Precise, Unbiased
Imprecise, Unbiased

What can cause metering errors?
7

Adverse Operational Effects
8

More Operational Effects...
9

Reported Orifice Meter Measurement Error Sources Operational Characteristic Approximate Flow Rate Error (% of reading) Orifice plate surface roughness Up to -0.7%
Notches/grooves on orifice edge -0.6% to +1.0%
Plate thickness and bevel angle -3.7% to +0.4%
Plate installed backwards Up to -20%
Liquid film on plate Up to ±1.5%
Liquid film on meter tube Up to +1%
Grease on surface of plate Up to -13%
Bent/warped plate Over-measurement <+0.5%, if deflection angle < 1° Under-measurement beyond -1.5% for larger deflection
Orifice eccentricity Within ±0.1%, if maintained at allowable limits
Swirl effects Up to +5.2%, depending on swirl type
Location of downstream thermowells < ±0.28% for TWs as close as 1.63 pipe diameters
High differential pressures (ΔP > 100 in. H20) < ±0.1%, if allowable limits are followed
Low differential pressures (ΔP < 10 in. H20) Can exceed ±4%, if ΔP <20” H2O column
Pulsation effects (SRE always over-registers) Can exceed ±0.5%, if ΔPr avg > 0.25 psi
Acoustic noise Can exceed ±0.23%, if pulsations >155 dBA
Over-registration Under-registration Over- or Under-registration 10

The upstream piping geometry can “distort” the flow in the pipe…
Changes in direction or pipe bends Elbows Ys, tees, headers, etc.
Blockages/obstructions Valves Pressure regulators Filters/separators Orifice plates Flow conditioners
11

Meter Sensitivity to Flow Field Distortion
Flow meters sensitive to flow field distortions… Orifice Ultrasonic Straight tube (radial mode) Coriolis Pitot-probe type Turbine (sometimes)
Flow meters not sensitive to flow field distortions… Positive displacement (e.g., rotary & diaphragm) Bent tube Coriolis Turbine (sometimes)
12

Flow Meter Calibration Options
Field (in-situ) proving American Gas Association Report No. 6
“Field Proving of Gas Meters Using Transfer Methods,” March 2013 Proving meters using critical flow devices Proving field meters with “master” meters
Flow lab calibration “Open” system, i.e., side branch on a pipeline Closed-loop (recirculating) system
13

Field Meter Proving…
14

In-situ Sonic Nozzle Meter Proving Field Test (Example data provided by Dr. Frank Ting - Chevron)
Objective: Optimize orifice meter beta ratios & operating conditions
Orifice meter sizes: 2, 4, 6, 8, & 16 inch dia.
Flow range: Up to 200 MMSCFD
Pressure: Up to 1,000 psig
Flow reference: Flow calibrated sonic nozzles (±0.25% of reading uncertainty)
15
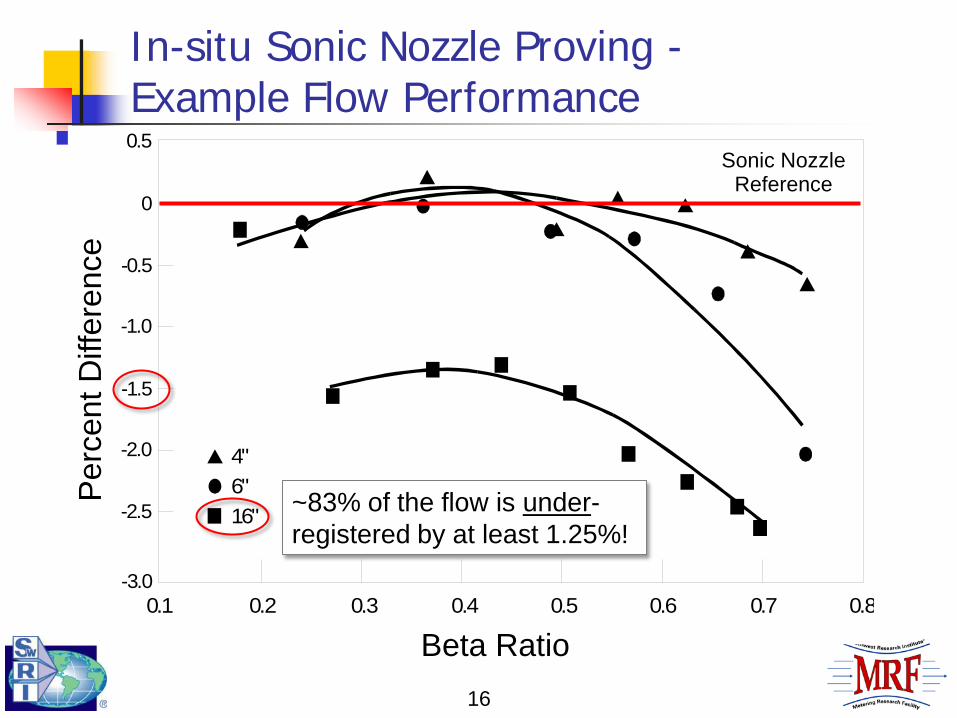
In-situ Sonic Nozzle Proving - Example Flow Performance
16
SonicNozzleReference
Per
cent
Diff
eren
ce
0.1 0.2 0.3 0.4 0.5 0.6 0.7 0.8BetaRatio
4"6"16"
0.5
0
-0.5
-1.0
-1.5
-2.0
-2.5
-3.0
Perc
ent D
iffer
ence
Beta Ratio
Sonic Nozzle Reference
~83% of the flow is under-registered by at least 1.25%!

Field Meter Station with an Ultrasonic Flow Meter Plumbed in Series for Performing In-situ Meter Calibration Checks
18

The Basis of All Flow Meter Calibrations
19
Meter No. 1 (Field meter
being checked @ P1, T1, ρ1,
A1, & V1)
Meter No. 2 (Prover @ P2, T2, ρ2, A2, & V2)
Control Boundary
Flow Direction
Steady Flow (The desired test condition!)
Unsteady Flow (An undesirable test condition)!
Conservation of MASS (simplified) Qm = (ρ A V)1 = (ρ A V)2
Steady Flow (The desired test condition!)

Flow Meter Calibration Facilities
Two basic types of calibration facilities… Open design – uses existing pipeline flow (side branch). Closed-loop – purpose-built flow meter calibration facility.
Secondary measurement (lab “working” standard): Turbine meter(s) Sonic nozzle(s) (a.k.a., critical flow Venturi) Rotary meter(s)
Primary measurement Sliding piston/swept volume Pressure, (fixed) volume, temperature, time (PVTt) system Weigh tank
Inter-lab comparison testing provides information on equivalence of different lab facilities.
22

Primary Gas Calibration System Total Measurement Uncertainty
Primary systems are those that determine flow rate from fundamental measurements of mass, length, & time.
Lowest measurement uncertainty - typically in the range of ±0.02 to ±0.05% of reading.
MRF Weigh Tank 23

Secondary (“Working”) Gas Calibration System Total Measurement Uncertainty
Secondary systems are those calibrated using a primary system.
Typically include empirical calibration coefficients.
Measurement uncertainty is typically in the range of ±0.05 to ±0.15% of reading. MRF Critical Flow Venturis
(i.e., sonic nozzles) 25

Meter Calibration Considerations
Meter only vs. meter with upstream/downstream piping included.
Digital vs. analog flow meter/lab interface. “As-found” testing allows assessment of
potential measurement biases from meter/adjacent piping/flow conditioner fouling for meters removed from service.
Scheduling: Lab backlog times vary (1-3 months is typical), so plan ahead as much as possible.
Flow meter owner/operator/manufacturer test witnessing varies.
26

Flow Meter Installation
Flow meter is shipped pre-assembled or is assembled at the flow calibration facility. On-site assembly of piping components typically
proceeds from upstream to downstream to allow internal inspection of flange alignment.
Meter power, data communication, and secondary instrumentation installation. Lab instrumentation is typically used for pressure and
temperature measurements. Initial meter checkout typically is done prior to the
flow calibration. Example piping configurations follow.
27

Example Single Flow Meter Installation
28

Ultrasonic Meters Flow Calibrated in a Skid
Flow Inlet
8-inch Meter Flow Outlet
6-inch Meter 3-inch Rotary Meter

Meter Calibration Details (Example: Ultrasonic flow meter)
Establish stable flow/pressure and ensure thermal stability.
Test over a range of flow rates: For ultrasonic flow meters, AGA-9 recommends 100, 75, 50, 25, 10, 5, 2.5% of full scale, but other points can be used, depending on the application.
At the MRF, we acquire multiple samples at each flow rate (3 to 6 measurement points, each of 90 to 300 seconds in duration).
Record path-by-path and other diagnostic information and examine for consistency (run log files).
Compare speed of sound measurement to those values produced using AGA-10.
30

Meter Calibration Documentation
AGA-9 recommends 15 items that should be included in the meter calibration report. Examples include: Flow lab calibration procedure Meter manufacturer, model, & serial number Description of mechanical installation Raw data, adjustment factor(s), and test method
used (should include measurement uncertainty estimate)
Final meter configuration, including firmware revision number
31
Some things to consider, depending on your type of flow meter…
32

Ultrasonic Flow Meters (Image courtesy of Sick, Inc.)
33

0 5 10 15 20 25 30 35Velocity (ft/sec)
0.0
0.2
0.4
0.6
0.8
1.0Pe
rcen
t Err
orBare Tube19-tube BundleVORTABTM
CPA 50EGFCTM
Ultrasonic Meter ‘A’ with Flow Conditioning (97 diameters of straight pipe upstream)
34

Ultrasonic Meter Adjustments
AGA-9 references three common methods of correcting the meter output: Flow Weighted Mean Error (FWME) correction Polynomial error correction Multi-point (point-by-point) linearization
Depending on the characteristics of the meter error curve, one of the above methods may be preferred over the others.
35

FWME Correction
36
-1.500
-1.250
-1.000
-0.750
-0.500
-0.250
0.000
0.250
0.500
0.750
1.000
1.250
1.500
0 10 20 30 40 50 60 70 80 90 100
Perc
ent E
rror
Velocity (ft/sec)
As-Found
Estimated As-Left, FWME
00381.1)38.0(100
100=
−+=
+=
FWME100100Factor Meter
This method applies a single meter calibration factor to all of the calibration points. The method does allow for greater importance to be placed on a particular flow rate to ensure that the error at that flow rate is minimized. The calculation method is explained in detail in AGA Report No. 9.

Polynomial Correction
37
y = -2.00258E-04x2 + 3.26980E-02x - 1.49299E+00
-1.500
-1.250
-1.000
-0.750
-0.500
-0.250
0.000
0.250
0.500
0.750
1.000
1.250
1.500
0 10 20 30 40 50 60 70 80 90 100
Perc
ent E
rror
Velocity (ft/sec)
As-FoundEstimated As-Left, PolynomialPoly. (As-Found)
Y = -2.00258(10)-4X2 + 3.26980(10)-2X + 1.49299

Point-by-Point Linearization
38
-1.500
-1.250
-1.000
-0.750
-0.500
-0.250
0.000
0.250
0.500
0.750
1.000
1.250
1.500
0 10 20 30 40 50 60 70 80 90 100
Perc
ent E
rror
Velocity (ft/sec)
As-FoundEstimated As-Left, Point-by-point LinearizationAs-Left, Verfication Points
? ?

Orifice Flow Meters (Built to specifications of American Gas Association Report No. 3)
39
Orifice Plate
Differential Pressure Taps

Orifice Flow Meter Calibration
8-inch diameter β = 0.600
𝑅𝑅𝑅𝑅𝑅𝑅𝑅𝑅 𝑁𝑁𝑁𝑁𝑅𝑁 =𝜌 × 𝑉 × 𝐷
𝜇=𝐼𝑅𝑅𝑁𝐼𝐼𝐼𝑅 𝐹𝑅𝑁𝐹𝑅𝑅𝑉𝐼𝑅𝐹𝑅𝑁𝑅 𝐹𝑅𝑁𝐹𝑅𝑅
Pressure Tap “Separation”
~0.15% difference
40
21 ,m v t Pq N E Yd Pρ= ∗∆dC
Reader-Harris Gallagher
Cd Equation

Turbine Flow Meters
41
Good integral flow conditioning (i.e., conical nose, straightening vanes, contracting inlet cross section, and tapered exit).
Poorer integral flow conditioning (i.e., fewer straightening vanes, no contracting inlet section, and more open cross section).
Rounded nose cone with many straightening vanes
Narrow flow annulus Tapered tail
A rounded nose cone, but few straightening vanes
Wide flow annulus No tapered tail

Turbine Flow Meter Calibration
8-inch diameter meter Error relative to single K-factor Test conditions: 750 psia, 70°F
42

Example Calibration Factor vs. Flow Rate (4-inch diameter meter)
43
140.0
140.5
141.0
141.5
142.0
142.5
143.0
143.5
144.0
144.5
145.0
145.5
0 5000 10000 15000 20000 25000
Q (acfh)
K (p
ulse
s pe
r cub
ic fo
ot)
Atmospheric air
150 psia natural gas
400 psia natural gas
700 psia natural gas
1.9 %
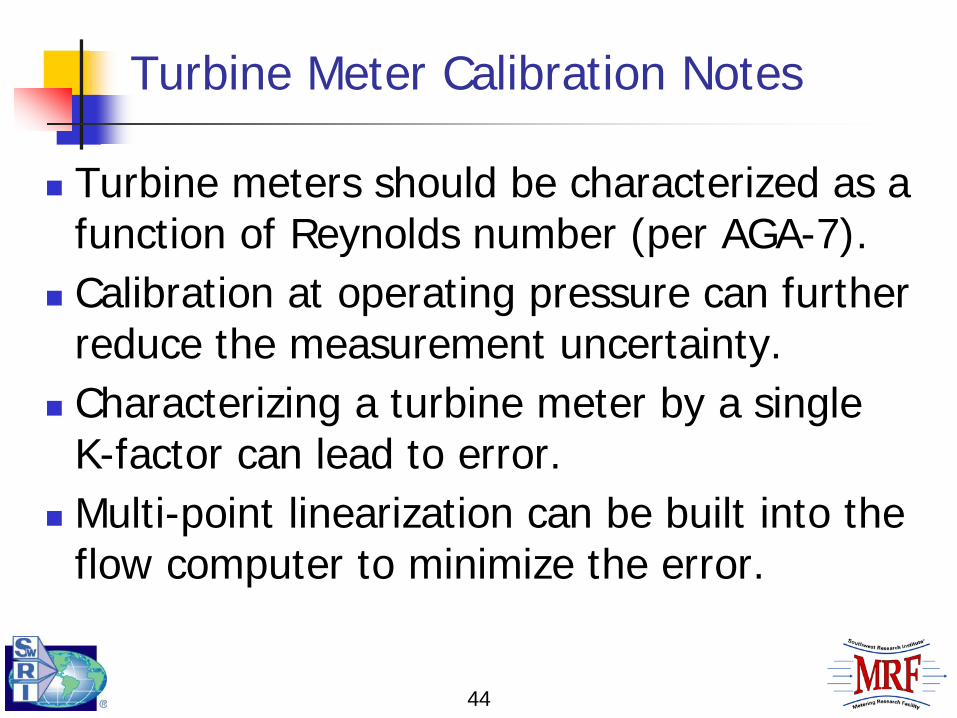
Turbine Meter Calibration Notes
Turbine meters should be characterized as a function of Reynolds number (per AGA-7).
Calibration at operating pressure can further reduce the measurement uncertainty.
Characterizing a turbine meter by a single K-factor can lead to error.
Multi-point linearization can be built into the flow computer to minimize the error.
44

Coriolis Flow Meters (Bent tube and straight tube designs)
45

Coriolis Flow Meter Calibration
◊ - Without meter zeroed □ - With meter zeroed
46

Coriolis Meter Calibration Notes
Zeroing the meter provides the reference condition upon which Coriolis meters are highly dependent.
Gas calibrations at elevated pressure should consider the pressure sensitivity of the meter.
47

Conclusions
Informed users can make good choices for calibration requirements. For instance, decide how accurate your meter needs to be!
Calibration facilities can offer advice to help with your decisions and planning.
Properly calibrated flow meters provide an accurate means of measurement that will reduce system measurement biases - and associated operating costs.
An initial meter calibration prior to field installation provides both verification of meter performance and removal of any measurement bias error - and provides baseline (reference) diagnostic information for monitoring of meter health in the future.
48

Thank you. Any questions?
Southwest Research Institute Website: www.mrf.swri.org [email protected]
SwRI Metering Research Facility
49

Example FWME Calculation & Correction
50
Point Velocity(ft/s)
Error(%)
Full ScaleFraction
Flow Weighted
Error
FWMECorrectedError (%)
1 94.558 -0.169 0.946 -0.160 0.2122 70.983 -0.190 0.710 -0.135 0.1913 52.117 -0.414 0.521 -0.216 -0.0344 37.820 -0.570 0.378 -0.216 -0.1915 23.628 -0.648 0.236 -0.153 -0.2696 14.217 -1.023 0.142 -0.145 -0.6467 9.443 -1.338 0.094 -0.126 -0.961
Sum = 3.028 -1.151
ErrorRate Flow ScaleFull
Rate FlowFWE ⋅=
%380.0028.3151.1
−=−
==∑
∑
Flow RateFull ScaleFlow Rate
FWEFWME
100 ft/s 100 ft/s
Corrected Error =1
𝐹𝐹𝐹𝐹 + 100 × 𝐹𝑁𝑁𝑅𝑁 + 100 − 1

Example Flow Distortion (Swirl) Caused by Two 90° Elbows, 90° Out of Plane
51
“Type 2” Swirl (Counter-rotating vortices) “Type 1” Swirl
(Solid body rotation)
Swirl can persist for 200 to 300 nominal pipe diameters!
Velocity Profile (Axi-symmetric, fully-developed, turbulent)

Wake Downstream of a Cylindrical Body (e.g., thermowell or gas sample probe)
52
Cylindrical Body
Flow Direction

Side Branches or Splits in the Flow Stream
53
First-order orFundamental Mode
Second-order Mode
Flow Direction
Flow Direction
Closed Branch
Closed Branch
Closed Branch
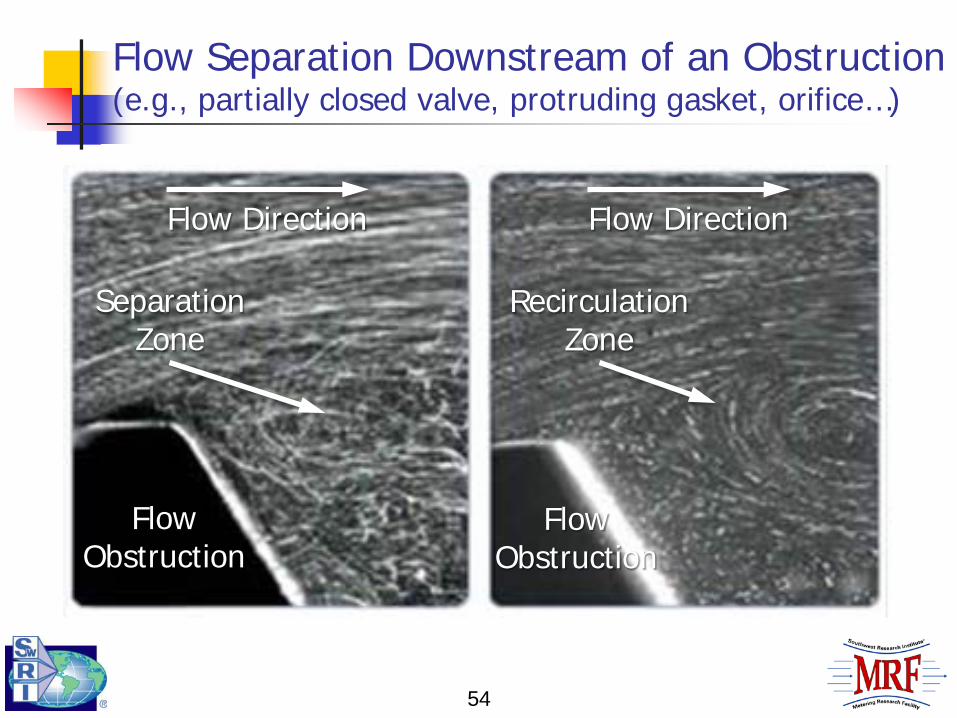
Flow Separation Downstream of an Obstruction (e.g., partially closed valve, protruding gasket, orifice…)
54
Flow Direction Flow Direction
Flow Obstruction
Flow Obstruction
Recirculation Zone
Separation Zone

Partially Closed Valves (Ball valve example)
55

56
Example Flow Distortion (Swirl) Caused by Two 90° Elbows, 90° Out of Plane (Numerical simulation courtesy of E-on Ruhrgas)

Is a flow “conditioner” necessary?
57
CPA Profiler™
GFC™ VAS
19-tube Bundle
GFC™ TAS
Example Flow Conditioners (They do not all perform the same!)

Flow “conditioners” also disturb the flow!
58
“Settling” Distance
Flow Direction
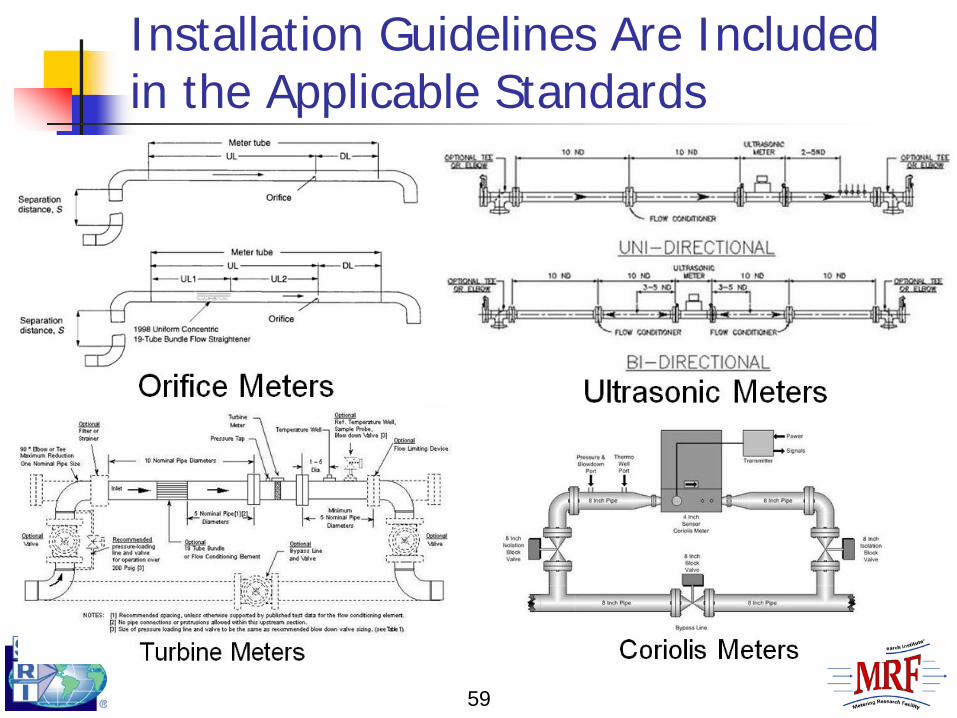
Installation Guidelines Are Included in the Applicable Standards
59

Straight Pipe Installation
60
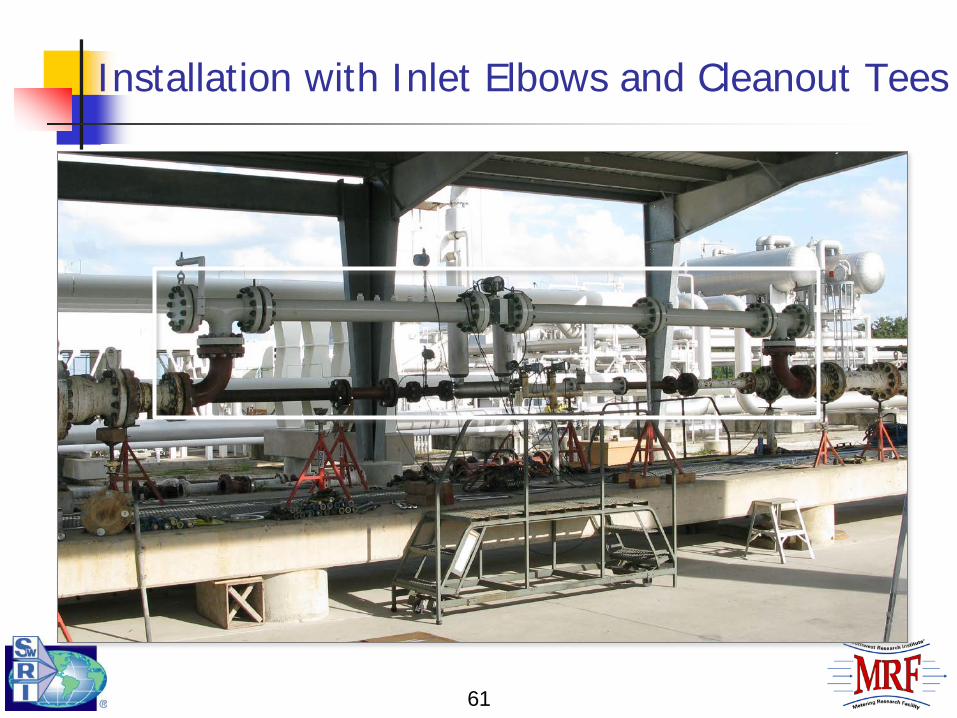
Installation with Inlet Elbows and Cleanout Tees
61

Integral Elbow-Tee-Cleanout Combination
62

Z-pattern - Two Meters in Series in a Header
63
A B
A
B