nextor congestion management project: interim report · nextor congestion management project:...
TRANSCRIPT

NEXTOR Congestion Management Project: Interim Report
National Center of Excellence for Aviation Operations Research
(NEXTOR)1
sponsored by
Department of Transportation
(Federal Aviation Administration and Office of the Secretary)
April 4, 2005
Michael O. Ball, University of Maryland
Frank Berardino, GRA, Inc.
Karla Hoffman, George Mason University
Mark Hansen, University of California, Berkeley
Dave Lovell, University of Maryland
1 An FAA sponsored center of excellence, consisting of five core universities, the University of California at Berkeley, George Mason University, the University of Maryland, Massachusetts Institute of Technology, and Virginia Polytechnic Institute and State University, as well as other affiliate universities and industry partners.
.

Project Sponsor Ms. Sharon Pinkerton Assistant Administrator for Aviation Policy, Planning, and Environment Federal Aviation Administration
Co-Project Leaders Dr. Michael Ball Professor, Robert H. Smith School of Business & Institute for Systems Research, University of Maryland Co-Director, NEXTOR Dr. Karla Hoffman Professor, Professor, Department of Systems Engineering and Operations Research, George Mason University
Senior Technical Contributors Dr. Lawrence Ausubel Professor, Department of Economics, University of Maryland Dr. Cynthia Barnhart Professor, Department of Civil and Environmental Engineering, Massachusetts Institutive of Technology Mr. Frank Berardino President, GRA Inc. Dr. Peter Cramton Professor, Department of Economics, University of Maryland Dr. George Donohue Professor, Department of Systems Engineering and Operations Research, George Mason University Dr. Mark Hansen Associate Professor, Department of Civil and Environmental Engineering, University of California, Berkeley Dr. Adib Kanafani Professor, Department of Civil and Environmental Engineering, University of California, Berkeley Dr. David Lovell Associate Professor, Department of Civil and Environmental Engineering & Institute for Systems Research, University of Maryland Dr. Paul Milgrom Professor, Department of Economics, Stanford University Dr. Amedeo Odoni Professor, Department of Aeronautics and Astronautics, Massachusetts Institute of Technology Dr. David Parkes Assistant Professor, Department of Computer Science, Harvard University

i
NEXTOR Congestion Management Project: Interim Report Executive Summary The NEXTOR congestion management project is investigating possible government actions to be taken upon termination of the slot controls at LaGuardia (LGA) airport in January of 2007; the project has generally focused on market mechanisms. Is any action required? The first question one might ask is whether any action is
required, i.e. would it be reasonable to simply let the current law expire. The extreme delays that occurred after the AIR-21 Legislation as well as other historical evidence and the opinions and intentions expressed by the air carrier community lead us to strongly recommend against no action.
Possible approaches. For LGA airport, where capacity expansion is impractical, the
three general classes of approaches to mitigating congestion include auctions, congestion pricing and administrative measures. Our report provides implementation details and analysis related to the first two classes of options. In fashioning a practical overall approach one should keep in mind the possibility of using combination or hybrid approaches.
Slots vs no slots. A slot is the right to land or take-off at a particular time (and/or to
schedule such an operation). By defining slots, the FAA can control very precisely the number of operations that take place and can exercise strong control over airport delays and flight cancellations. If it is decided to use slots and a market mechanism for allocating them then an auction becomes the natural approach. If there are no slots then, almost by necessity, congestion pricing is required to control congestion.
Advantages of market mechanisms. Market mechanisms properly implemented foster a
vibrant air transportation business environment by encouraging new entrants, expansion into unserved markets, price competition, strengthening of smaller carriers and other characteristics of a well operating market. Our analysis indicates that historical slot control policies have distorted airline behavior by encouraging the use of smaller aircraft, whereas market mechanisms should lead to increases in aircraft size and LGA passenger traffic. Market mechanisms can also provide a new source of revenue to offset distortionary taxes and fees; at the same time, they can impose a new financial burden on the air carriers.
Advantages of a slot/auction approach. A slot/auction approach has the advantage of
providing a high level of control over congestion and delays.

ii
Advantages of a no-slot/congestion pricing approach. A no-slot/congestion pricing approach has the advantage of providing for maximum carrier scheduling flexibility, at the expense of uncertainty related to both delays and the fees charged to carriers.
Recommended auction approach. To provide a smooth transition, our recommended
slot/auction approach initially allocates slot leases via an administrative measure and employs a secondary market mechanism that looks identical to the primary (auction-based) market mechanism from the buyer’s perspective.
Other approaches. We provide details on two possible approaches: a slot/auction
approach and a no-slot/congestion pricing approach. However, we emphasize that other options are worth investigating, particularly options that combine aspects of the three general classes of approaches.
Gates and other resources at LGA. If a carrier wished to increase its number of
scheduled operations, e.g. after obtaining additional slots or in response to the elimination of slots, then that carrier would have to obtain access to appropriate airport resources such as gates, baggage handling facilities, ticket counters, overnight parking spaces, etc. Historically at LGA airport, incremental changes in schedules have been accommodated through gate trading, subleasing and other such actions. However, current leasing arrangements could provide a substantial roadblock to a carrier’s expansions plans. A promising approach to addressing this issue might be to exchange gate reallocation flexibility from the current lease holders for certain property rights, e.g. initial slot leases or vouchers, ceded to them in initiating a new slot regime. The Port Authority of NY&NJ would by necessity play a substantial role in any solution to this problem.
Disposition of new revenues. While the disposition of any new revenues is beyond the
scope of our work, we note that substantial advantages would accrue from using new revenues to partially or completely off-set existing landing fees or PFCs. The agreement governing LGA landing fees automatically adjust fees so as only to cover air field costs. As such, if a portion of a new revenue stream were directed to off-set air field costs, then landing fees would automatically be reduced in a corresponding manner. The manner in which such funds would flow between the Federal Government and the Port Authority of NY&NJ represents an important, sensitive issue. It is also the case that the Port Authority may incur certain expenses in creating an environment, e.g. additional common-use gates that can better accommodate carrier schedule modifications made in response to a new congestion management regime. It would also seem appropriate to direct new revenues to offset such expenses.

iii
Table of Contents Executive Summary …………………………………………………………………….....i 1. Introduction to Report and Summary of Conclusions ................................................ 1
1.1. The Need for Congestion Management, Goals of Project and Overview of Report...................................................................................... 1
1.2. Fundamental Questions Underlying Choice of Best Congestion Management Option ........................................................................ 2
1.3. Design Problems ................................................................................................. 5 1.3.1. Design of a Primary Market for Slots ......................................................... 5 1.3.2. Design of a Secondary Market for Slots ..................................................... 5 1.3.3. Design of Congestion Pricing Scheme ....................................................... 6 1.3.4. Design of Fair Slot Allocation Procedure Based on Incumbency Rights... 6
1.4. Summary of Alternative Options ........................................................................ 7 1.4.1. Summary of Auction Proposal (Slots with Finite Lifetime
Allocated via a Market Mechanism)........................................................... 7 1.4.2. Summary of Congestion Pricing Proposal (No Slots) ................................ 8 1.4.3. Use of Funds ............................................................................................... 9 1.4.4. Other Options............................................................................................ 10
2. Operational Performance of Laguardia Airport........................................................ 11
2.1. History of Congestion Management and Operational Performance of Laguardia Airport ......................................................................................... 11
2.1.1. Introduction............................................................................................... 11 2.1.2. Evolution of Congestion Management Policies........................................ 12 2.1.3. Trends in Operational Performance at Lga............................................... 13 2.1.4. Trends in Rates And Capacities................................................................ 18 2.1.5. Multivariate Analysis of Arrival Delay .................................................... 19 2.1.6. Conclusions............................................................................................... 21
2.2. Service Type and Average Aircraft Size .......................................................... 21 2.2.1. Data Used.................................................................................................. 22 2.2.2. Service Type Analysis .............................................................................. 23 2.2.3. Aircraft Size Analysis ............................................................................... 25 2.2.4. Concluding Remarks................................................................................. 33
3. Criteria for Impact..................................................................................................... 34
3.1. Efficiency.......................................................................................................... 34 3.2. Effectiveness ..................................................................................................... 34 3.3. Distributional Consequences ............................................................................ 35
4. Functional Description and Analysis of Market Mechanisms.................................. 36
4.1. Design of a Primary Slot Auction Mechanism ................................................. 36 4.1.1. Justification for a Primary Market ............................................................ 36 4.1.2. Specification of the Limit on Laguardia Arrivals During Peak Periods... 37 4.1.3. Definition of Arrival Authorization .......................................................... 40

iv
4.1.4. Determination of the Initial Assignment of Arrival Authorizations
and Length of Initial Authorizations......................................................... 41 4.1.5. General Information About What Is Being Auctioned
and the Lease Period ................................................................................. 44 4.1.6. Overview of the Package Bidding Auction Design .................................. 45 4.1.7. Relationship of Primary Market to Secondary Market ............................. 49 4.1.8. Responses from the Industry about the Proposed Auction Design........... 50
4.2. Congestion Pricing............................................................................................ 52 4.2.1. Overview................................................................................................... 52 4.2.2. Implementing Congestion Pricing ............................................................ 53 4.2.3. Use of Funds and Gate Access.................................................................. 61 4.2.4. Expectations about Congestion Pricing at Laguardia ............................... 64 4.2.5. Review of Congestion Pricing Simulation................................................ 67
5. Discussion of Related Issues..................................................................................... 77
5.1. Slot Property Rights.......................................................................................... 77 5.2. Operation of Secondary Markets ...................................................................... 78 5.3. Constraints and Resource Allocation at Lga..................................................... 80
5.3.1. Physical Constraints.................................................................................. 81 5.3.2. Adminstrative and Fiscal Constraints ....................................................... 83
References......................................................................................................................... 87 Appendix 2A……………………………………………………………………………..90 Appendix 2B……………………………………………………………………………..92 Appendix 2C……………………………………………………………………………..93 Appendix 4A……………………………………………………………………………101 Appendix 4B……………………………………………………………………………107

v
List of Figures Figure 2.1 Average Weekday Scheduled Arrivals at LGA, by Month……………....... 15
Figure 2.2 Monthly Flight Time and Scheduled Time Indices, LGA Airport………… 17
Figure 2.3 Monthly Airborne and Flight Time Indices, LGA Airport 17 Figure 2.4 Decomposition of LGA Average Arrival Delay by Causal Factors, by
Time Period..………………………………………………………………. 20
Figure 2.5 Segment length vs. traffic density…………………………………………. 23
Figure 2.6 Average seats per flight vs. traffic density…………………………………. 26 Figure 2.7 Average seats per flight vs. segment length 26
Figure 2.8 Average seats per flight vs. passenger-mile………………………………... 27
Figure 2.9 Average seats per flight vs. HHI…………………………………………… 27 Figure 2.10 Estimated average seats per flight vs. traffic density……………………... 31
Figure 2.11 Estimated average seats per flight vs. segment length……………………. 32
Figure 2.12 Estimated average seats per flight vs. HHI……………………………….. 32
List of Tables
Table 2.1: Airport Operational performance at LGA………………………………….. 15
Table 2.2: Estimation Results for Tobit Arrival Capacity Model for LGA…………….19 Table 2.3: Estimation Results………………………………………………………….. 25 Table 2.4: Estimation Results………………………………………………………….. 30

1
1. INTRODUCTION TO REPORT AND SUMMARY OF CONCLUSIONS
1.1. THE NEED FOR CONGESTION MANAGEMENT, GOALS OF
PROJECT AND OVERVIEW OF REPORT
The NEXTOR congestion management project was initiated in anticipation of the termination in January of 2007 of the legislation authorizing the existing slot rules governing operations at LaGuardia (LGA) and John F Kennedy International (JFK) Airports. By defining a limited number of slots over the course of a day and only allowing operations to be scheduled into defined arrival and departure slots, the FAA has been able to limit the amount of congestion and delay at LGA airport. Without new government action, starting in January of 2007, the slot limitation will expire and there will be no constraints on the ability of air carriers to schedule operations at LGA. Thus, the possibility exists for a significant increase in the number of scheduled operations over current levels, which would lead to a significant increase in congestion and delays at LGA.
The product of the NEXTOR research activities should be the definition and
evaluation of alternative government actions for effectively controlling congestion levels at LGA. We should note that, in general, congestion can be decreased by either increasing capacity or limiting demand. Because of physical constraints around LGA airport, the option of increasing capacity is not considered to be viable.
Before proceeding it is useful to set forth a set of goals to be achieved by the proposed government actions.
Control of congestion and delays: This is clearly the principal motivation behind all efforts in this area. If it were felt that congestion and delay would be “naturally” maintained without government action then no action should be taken.
Maintenance of a vibrant air transportation business environment:
Generally, this objective would be achieved if no government action were taken. However, given that a government action is taken to address congestion, certain goals related to economic efficiency should be pursued, including: i) maintaining a variety of competitive, economic, efficient low-priced services, ii) maximum reliance on competitive market forces, iii) avoiding increased prices, reduced services and excluding competition, iv) developing and maintaining an air transport system based on actual or potential competition, v) encouraging entry by new or existing carriers, vi) continued strengthening of small carriers to insure competition.
Support for certain societal and community objectives: Congress has clearly
indicated that certain important objectives should be pursued even if they require special support mechanisms; these include: i) maintenance of a reasonable level

2
of service to small communities, ii) providing that consumers (including those in rural and small communities) have adequate and affordable access to the air transport system.
Consistency with international obligations: Clearly, these obligations must be
respected.
We note that the above objectives have been previously enunciated by the Department of Transportation, most recently in a Notice for Proposed Rulemaking issued on March 25, 2005.
This is an interim project report. It defines a set of alternative government actions
and provides related analysis. In some cases, the actions are specified and analyzed in detail. However, suggested alternative approaches are also described; these would require further research in order to be fully specified.
In the remainder of this section, we first provide a list of fundamental questions or
decisions that must be addressed in formulating a final action plan. We then give four basic design problems that are addressed in more detail in the report. Finally, we define two alternatives for government action and give suggestions for other possible approaches. Section 2 gives background on LGA airport and the history of congestion management there. Section 3 describes constraints on operations at LGA and also challenges related to a carrier’s ability to obtain resources necessary to increase operations there. Section 4 gives a detailed design and analysis of the two basic market mechanisms: auctions and congestion pricing. Section 5 addresses a variety of important related issues. 1.2. FUNDAMENTAL QUESTIONS UNDERLYING CHOICE OF
BEST CONGESTION MANAGEMENT OPTION
In this section we frame some basic questions whose answers would eventually lead to a decision on an appropriate congestion management option.
Action vs no action? The laws governing the current HDR rule will expire on January 1, 2007. If no action is taken then there is a significant risk that over-scheduling would occur, leading to extreme levels of delays and flight cancellations. While one might argue that changes in the airline industry and overall demand patterns have occurred so that over-scheduling is no longer as likely, the extreme conditions that occurred after the AIR21 legislation were dire enough to make it somewhat foolhardy to pursue a “no action” course. Thus, we recommend strongly that some action be taken.
Slots or no slots? A slot is the right to land or takeoff at a particular time (and/or
to schedule such an operation). By defining slots, the FAA can control very precisely the number of operations that take place and can exercise strong control

3
over airport delays and flight cancellations. As history has demonstrated, slots become significant financial assets that can be used as collateral on loans and that can be exchanged on a secondary market.
In order to control congestion, the no-slot option would have to be combined with some form of congestion pricing. The no-slot option has the advantage of a high level of simplicity – any operator can land at any time, as long as the operator pays the appropriate (congestion) fee; among other advantages, each air carrier can autonomously plan its own schedule. The distortionary effect of the use-it-or-lose-it rule is eliminated; also, there is no need for auctions or a secondary market. The main disadvantages of the no-slot option is that there would still be a (potentially high) level of uncertainty associated with airport congestion and delay and also uncertainty regarding fees paid by the air carriers. We should note that hybrid strategies are possible both as long-term solutions and as a transition step. We provide an overview of certain hybrid approaches and intend to investigate some of these in the next phase of this project.
If slots are used, then should slots have finite lifetimes? Under the current
system, slots have no defined termination dates. Of course, the expiration of the HDR legislation in January of 2007 provides an effective termination date. The question is: should future slots have well-defined lifetimes? The advantage of having well-defined lifetimes is that there is a formal mechanism that forces slot turnover, allowing, for example, the entrance of new carriers and the expansion of existing carriers. Lack of slot termination dates and associated administrative rules for ensuring their use, e.g. “use-it-or-lose-it” rules, can, and have, led to poor use of slots. For example, airlines have significant incentives to hold slots in order to keep them away from competitors. Thus, if there is no termination date and little penalty for keeping a slot, then, even if a given airline cannot effectively use a slot, the airline has a strong incentive to keep it and use it ineffectively. Of course, if slots have a finite lifetime, then choosing the length of the lifetime becomes an important question.
If slots are used and slots have a finite lifetime, then should an administrative
measure or a market mechanism be used to reallocate them? Certainly, the process of defining administrative measures would be challenging due to the significant political pressures that likely would be brought to bear on this process. Further, historical evidence suggests that even after the process was defined, there would be political pressure brought to make exceptions and/or change it. On the other hand, if an administrative measure is put in place, it must be one that provides better access to LGA slots for new entrants and carriers wishing to expand and also that encourages the most productive use of slots.
The only reasonable market mechanism for this process would be some type of auction.

4
If slots are used, then how should an initial slot allocation be determined? The two most likely possibilities are i) to use a market mechanism or ii) to base the initial allocation on the current HDR allocation.
If a market mechanism were used, then it would, almost by necessity, take the form of some type of auction. If the current slot level were left in place, then the current (HDR) allocation could be used as the initial allocation (differences in current slot types – HDR vs. AIR21 – would lead to certain complications). If the current slot level were reduced then presumably some sort of pro rata formula could be used to reduce, in an appropriate way, the incumbents’ slot holdings. The design of such a formula does not represent an extremely challenging problem but, nonetheless, should be done with careful study.
How can gate and other airport resources be reallocated in a manner
consistent with slot reallocations? Any of the schemes proposed here have the potential to cause significant changes in carrier schedules. When such changes occur, carriers will request appropriate corresponding airport resources. It will be important for the Port Authority to be able to respond with such resources. Typically, such resources can only be obtained by reallocating gates, baggage handling facilities, etc. from one carrier to another. These facilities are typically governed by complex lease/ownership arrangements. Thus, mechanisms must be put in place to allow for fast, flexible reassignment of such resources. We should note that certain facets of slot allocation proposals, e.g. vouchers or incumbent ownership allocations, could be used as leverage/compensation for cooperation on gate reallocations.
What is the appropriate level of congestion? Any option used will result in a
certain level of airport delay. A fundamental question is what is the most appropriate level of delay. In concept this level should be determined by trading off the cost of delay with other system costs. In order to reduce delays, the number of operations must be reduced either by reducing the number of slots or increasing a congestion price. Both of these actions impose a significant cost on the carriers, which must be traded off against the costs of delay. It is possible that certain market mechanisms could allow the market to determine the appropriate level for this tradeoff.
What is an appropriate time window size for slot or pricing control? Under a
slot option, slots are defined relative to a particular time window, e.g. a 9:00 to 9:15 slot. Under a congestion pricing option, prices change from time window to time window. In each case, the time window width is an important design question.
How are special public good considerations, such as access to small
communities, handled? Historical experience as well as NEXTOR and other

5
studies have shown that service between certain smaller communities and LGA could be curtailed and/or eliminated under certain options, particularly those employing market-based approaches. On the other hand, the U.S. Congress has clearly shown that access to such communities is considered important to the public good and, as such, such access should be preserved. The manner in which access to small communities is naturally preserved, or can preserved by special mechanisms, should be demonstrated for each option under consideration.
1.3. DESIGN PROBLEMS
The various specific alternatives we propose in the next section all employ multiple elements, e.g. primary and secondary slot market, initial allocation based on incumbency with secondary market, etc. These build on basic market mechanisms, which are described in detail in Section 4 of the report, and are listed below. 1.3.1. DESIGN OF A PRIMARY MARKET FOR SLOTS
We call the process by which the government sells slots to air carriers (and possibly others) the primary slot market. A primary market would be required under several scenarios. Of course, if the initial slot allocation were based on a market mechanism, then the primary slot market design would be used. In addition, as slot terms expire or as carriers release slots to the government, then the government would use the primary slot market to reallocate these slots. The primary market has the format of a slot auction, which was demonstrated in the second NEXTOR strategic simulation.
The slot auction design is a simultaneous clock auction. “Simultaneous” refers to
the property of this auction that multiple products are sold simultaneously, and “clock” refers to the manner in which prices evolve over time. A product in this case is the right to land in a particular time window, e.g. 9:00 – 9:15, and the right to depart within 90 minutes after arrival. The number of products equals the number of time windows and there are multiple units of each product sold. In each round, the auctioneer will announce prices for each product, and participants will bid the quantities of each product that they wish to buy at the announced prices. The auctioneer then announces the aggregate demand for each product, compares the aggregate demand for each product with the available supply, and adjusts the prices accordingly. The process iterates in a series of rounds until demand approximately equals supply for every product, and the participants win the final quantities that they bid at the final prices.
Details on the slot auction design are given in Section 4 of this report and in the Appendix.
1.3.2. DESIGN OF A SECONDARY MARKET FOR SLOTS
We call the process by which air carriers exchange slots among each other the secondary slot market. It would be quite appropriate, and almost essential, to have a secondary market for slots under any slot scenario. Of course, currently there is a

6
secondary market however, this market has not been very effective. The two primary types of transactions historically observed in the existing secondary market are:
barter transactions to help with schedule smoothing, e.g. airline A trades an 8 AM slot with airline B for a 9 AM slot;
large slot sales associated with airline bankruptcies. The lack of robustness in this secondary market is attributed to the high incentive
for airlines to hold on to slots in order to preserve their competitive position and the ability of new entrants to use the political process to obtain slots directly from the government. Nearly all historical secondary market transactions are private negotiated deals that, in many cases, have many special side conditions. There is significant doubt that an effective secondary market for slots can be created without either 1) slot term limits and/or 2) significant costs associated with holding slots. A goal in secondary market design would be to create a transparent market in which multiple parties could participate and compete for available slots.
An analysis of the existing secondary market and a preliminary secondary market
design is given in Section 5 of this report. The secondary market design looks identical to the primary market from the perspective of a buyer. Specifically, a seller privately provides the auctioneer (the government) with a list of those slots to be sold together with reservation prices. The government augments the lease lengths of all slots offered for sale to the standard length. For example, if a slot owner had 2 years left on a lease it wished to sell, then the government would offer for sale a lease of 5 years and pro-rate the proceeds, with 2/5 going to the original slot owner and 3/5 going to the government. If the seller’s reservation price was not covered then the slot would not be sold. Thus, from the perspective of the buyer, the process of bidding on slots would be identical in the secondary and primary markets, except for constraints imposed by reservation prices. In fact, at the appropriate times secondary market and primary market slots would be mixed in a manner invisible to the buyers. 1.3.3. DESIGN OF CONGESTION PRICING SCHEME
If there are no slots, then in order to limit operations a congestion pricing scheme must be devised. An effective design must address such questions as who sets the prices, how often can they be adjusted, what is the give-and-take between price setting and schedule adjustments, what action initiates a charge, etc.
An analysis of a variety of congestion pricing issues and a design for a congestion
pricing scheme is given in Section 4 of this report. A summary of the recommended approach in given in below in Section 1.4.2.
1.3.4. DESIGN OF FAIR SLOT ALLOCATION PROCEDURE BASED ON
INCUMBENCY RIGHTS
7
Certain alternatives employ slots but do not use a market mechanism for the initial slot allocation. Rather, the initial allocation is based on the current HDR-based allocation. In the simplest case, where the level of operations was set to its current level, the allocation would be exactly what exists today. However, if it were decided to reduce the level of operations or if priority was to be given based on the length of time a slot has been held, e.g. discounting the “value” of slots gained after the AIR21 legislation, then a more complex procedure would have to be used. This procedure has not yet been designed; it will be the subject of a research effort in the coming two months.
1.4. SUMMARY OF ALTERNATIVE OPTIONS
1.4.1. SUMMARY OF AUCTION PROPOSAL (SLOTS WITH FINITE
LIFETIME ALLOCATED VIA A MARKET MECHANISM)
Slots employed with a finite lifetime of 5 years (however, we intend to conduct further research to finalize this value)
An administrative measure based on incumbency right used to produce the
initial slot allocation (procedure summarized in Section 1.3.4).
The initial slot lifetimes (lease lengths) would be staggered so that each year approximately 20% of the slot leases would expire.
In order to initiate the process, the remaining lifetimes on slots would be
staggered so that approximately 20% would have 1 year remaining, 20% 2 years remaining, etc.
An additional transition increment would be added to each lease lifetime.
That increment would be set to 0, 1 or 2 years. If the transition increment was 2 years, then approximately 20% of the initial slot allotment would have a life time of 3 years, 20% 4 years, 20% 5 years, 20% 6 years and 20% 7 years.
In the initial allocation, the lifetimes of the slots allocated to each carrier
would be uniformly distributed among all of the slots owned by that carrier.
A transparent secondary market would be created with a slot sale held quarterly. From the buyer’s perspective, the secondary market would look identical to the primary market (see Sections 1.3.2 and 5.2).
For the initial 1, 2, or 3 years, there would only be a secondary market – this
would allow for all parties to become familiar with the market operation and also for the government to adjust the market operation if desired before the primary slot market became operational. Of course, from a buyer’s perspective, the principal difference between the primary and secondary markets would be that, at the end of each year when a large number of leases would expire, the market would have a much larger number of slots offered for sale. The first transparent

8
secondary market would be operated on January 1, 2007 (this date could be delayed if desirable). Subsequent operations would occur on April 1, 2007; August 1, 2007; etc. The first combined secondary and primary markets would be conducted on January 1, 2008; January 1, 2009; or January 1, 2010 depending on the length of the transition increment.
In order to encourage small community access, once the primary slot market
begins and slot fees are paid to the government, rebates will be given to those carriers who use slots to provide access to small communities. In the transition period, where slots are initially allocated by administrative measures, current small community slot designations will remain in effect.
Advantages:
Use of slots insures congestion is controlled. Initial allocation based on incumbency provides easy transition. Limited slot lifetimes and use of market mechanism for allocation insures slot
turnover and efficient use of slots. Secondary market will encourage early mechanism for slot turnover and transition
phase to primary market. New source of revenue to offset distortionary taxes and fees.
Disadvantages:
Transition period may lengthen time before real changes are seen. New financial burden on airlines, but mitigated to the extent revenues offset
existing taxes and fees. Use of slots limits airline flexibility.
1.4.2. SUMMARY OF CONGESTION PRICING PROPOSAL (NO SLOTS)
The following proposal is preliminary and is subject to change.
Independent pricing board created to set congestion prices
FAA-defined delay targets used to identify two categories of congested airports
o Trigger point to determine when an airport is reaching unacceptable congestion – could vary by time of day and/or days of the week (Type A).
o Identification of chronically congested airports (Type B).
Pricing mechanism for Type A airports o For those time periods where a Type A airport is identified as congested,
current weight-based landing fees would be replaced by flat revenue-neutral congestion fees.

9
o If revenue-neutral fees do not adequately address congestion, pricing board would calculate higher congestion prices needed to achieve delay target.
o Congestion fees can be adjusted at any time with 24 hours notice and will be monitored and withdrawn as activity dictate.
Pricing mechanism for Type B airports (to reduce risk of severe congestion)
o Non-scheduled operations limited to a fixed number per time period and pay same congestion fees as other non-exempt operators
o FAA identifies specific exempt operations in each time period – subject only to flat revenue-neutral fees.
o Carriers submit confidential proposed schedules 120 days in advance, including gate information.
o Pricing board examines schedules and publishes proposed congestion fees within 3 days.
o Carriers submit revised schedules within 3 days. o Process continues until pricing board determines that congestion target
will be met. o Board shall have flexibility to allow some positive or negative deviation
from final schedule on a case-by-case basis.
Advantages:
No need to set or administratively assign slots Carrier scheduling flexibility Reduced strategic behavior – no incentive to hoard slots
Disadvantages:
Political feasibility Possible pricing inefficiencies Scheduling variability and market uncertainty if congestion fees change
1.4.3. USE OF FUNDS
Both slot auctions and congestion pricing would create a new revenue stream. While the disposition of such revenue is beyond the scope of our work, certain aspects of how such funds are allocated impact the carrier and air transportation system performance. Thus, we feel it is important to provide some inputs in this area.
The existing fee structure can have a substantial impact on airline behavior. For
example, the current weight-based landing fee effectively encourages the use of small aircraft and, thus, it can distort airline scheduling behavior over what might happen if no fees were charged. Further, the arrival/departure capacity occupied by an aircraft depends on aircraft size mix and sequence but certainly does not generally decrease with aircraft size. Thus, if one seeks a system where usage charges are approximately equal to

10
usage costs, then one should move away from this fee structure. For these reasons, it is important that new access charges should fully or, at least partially, displace certain current access charges. Thus, we recommend that any new fees collected be used to partially or fully displace current landing fees and Passenger Facility Charges (PFC’s).
It is also the case, that the effective implementation of a new congestion
management scheme will place new burdens on the Port Authority, e.g. for the maintenance of common use gates. It certainly would seem appropriate for new fees to offset such new financial burdens. Finally, capacity expansion should always be encouraged to alleviate the need for demand reduction, so fees should be earmarked for capacity expansion efforts, particularly those that directly impact LGA and the adjacent airspace. 1.4.4. OTHER OPTIONS
Once a decision is made to use a market mechanism for rationing airport capacity, it becomes clear that a second key decision is whether to define slots and ration capacity based on slots. On a basic level, slots + market mechanism leads to auctions and no-slots + market mechanism leads to congestion pricing. However, there are hybrid solutions certainly worthy of consideration. For example, under the congestion pricing proposal, the air carriers submit schedules 120 days in advance. If the carriers are required to maintain levels of operations within the limits defined by their schedules for the upcoming period, then slots have de facto been defined. These slot definitions would have very limited lifetimes, e.g. 3 months, but, to the extent that they set hard limits on the allowed operations, they serve the fundamental slot function. Another hybrid approach could be created by starting with a basic no-slot approach, with an auction of long term contracts in lieu of slot fees. For example, such a contract might specify that the holder would pay a monthly fee and would be allowed to land in a given time window without paying the appropriate congestion-based landing fee. The key to making this a no-slot approach would be that operators not holding long-term contracts could land in a given time window but would be required to pay the congestion-based fee. Effectively, this would be a marketplace in which one could choose between paying for access based on a long-term contract or using a “spot market” to pay whenever access was desired.
Alternatively, a purely administrative approach could be used. It would seem to
be necessary to maintain slots under an administrative option since it would be difficult to provide non-monetary incentives to keep demand down to reasonable levels, i.e. the strict limits provided by slots would appear to be necessary to control congestion. On the other hand, it could be quite appropriate to assign limited lifetimes to slots under an administrative measure and/or to provide incentives for more efficient slot utilization, e.g. aircraft up-gauging.

11
2. OPERATIONAL PERFORMANCE OF LAGUARDIA AIRPORT
In this section, we discuss important operational issues related to congestion management at LGA. The first subsection provides historical background on relevant LGA issues. The second subsection investigates the question of whether LGA slot policies have distorted the aircraft gauge mix at LGA.
2.1. HISTORY OF CONGESTION MANAGEMENT AND OPERATIONAL PERFORMANCE OF LAGUARDIA AIRPORT
2.1.1. INTRODUCTION
For many years, LGA has been recognized as an airport that cannot accommodate the air traffic that would result if there were no administrative or economic measures to manage congestion. As a result, there has been a succession of congestion management regimes, beginning with the High Density Rule (HDR), followed by the virtual elimination of restrictions under the Wendell H. Ford Aviation Investment and Reform Act for the 21st Century (AIR-21), and the imposition of a slot lottery after that. Congress has mandated that the current demand management policy at LGA end in 2007.
In conjunction with an examination of possible policy options, it is useful to review how congestion management policies at LGA have evolved, and how these policies, along with other factors, have affected airport operational performance. Of particular interest is the effect of AIR-21, which was widely perceived to have been disastrous and created a conviction that some form of demand management is absolutely necessary for LGA to be operationally viable. Operational trends after AIR-21 are also of interest, because they help determine how current policies are working, and may work in the future, in containing delay.
Section 2.1 analyzes recent operational experience at LGA and explores how operational results have changed under the various demand-management regimes. Section 2.1.2 summarizes the policy history and describes the different regimes that have been in place since the year 1968. Section 2.1.3 compares the operational performance of LGA under the different regimes. Section 2.1.4 considers trends in rates and capacities at LGA, and Section 2.1.5 presents simultaneous, multivariate models of delay at LGA and the rest of the NAS. This allows differences in delay at LGA under the different regimes to be decomposed by causal factors, and the spillover effects of LGA delay on the rest of the NAS (and vice versa) to be assessed. Section 2.1.6 provides some concluding remarks on operational experience at LGA.

12
2.1.2. EVOLUTION OF CONGESTION MANAGEMENT POLICIES
In much of the developed world congestion management through slot restrictions is a common practice. In Europe, for example, slots are allocated based on EEC and IATA rules [Slot Allocation, 1992]. The guiding principles of slot allocation are mainly “grandfather rights” and the “use-it-or-lose-it” rule. When slots become available because of added capacity, insufficient use, or voluntary relinquishment, they are put in a “pool” and redistributed giving priority to new entrants [Fan and Odoni, 2002]. Airlines are allowed to exchange slots, but without financial transfers. These policies have been used at some airports, such as London Heathrow and Paris Charles de Gaulle, since the early 1970s.
The U.S. has a large domestic airline industry, with more than 500 commercial airports. In contrast to the European situation, access of airlines to airports in the U.S. is more of a domestic policy issue. At virtually all U.S. airports, runway access is on a first-come-first-served basis. Airport access in these cases is only restricted by the availability of terminal facilities. Slot controls have been used at five U.S. airports. In 1968, the High Density Rule (HDR) was promulgated to reduce delays at Chicago O’Hare, Washington National Airport, and three New York airports: Kennedy, Newark, and LaGuardia (the rule was terminated in the 1970s at Newark airport). The HDR was supposed to expire at the end of 1969 but was extended several times, indefinitely in 1973. At LGA, the HDR limited the hourly slots (landing or takeoff rights) to 68 between 6:00 am and midnight. Six slots were reserved for general aviation, military and charter flights, leaving 62 slots per hour for commercial airline flights [Crowley, 2001]. Initially, slots were distributed by a scheduling committee, composed of representatives from different airlines. After deregulation, the scheduling committee process was replaced by the use-it-or-lose-it and buy-sell rules issued by the FAA in 1985. While in principal these rules created a market for slots, airlines proved reluctant to sell them, particularly to new competitors [U.S. Congress, 2000].
In the early 1990s, the FAA granted 42 slot exemptions for air service to LGA
authorized by the Federal Aviation Authorization Act. Unlike regular slots, these could not be sold, and were authorized for specific types of flights: new international flights, new entrant airlines, and essential air services. The exemptions and the restrictions on their use reflected compromises between competing forces, including those concerned that slot restrictions stifled competition, and airport neighbors who wished to maintain controls because of noise impacts [U.S. Congress, 2000]. The granting of slot exemptions posed another obstacle to the slot market, as potential buyers conjectured that, through exemptions, they could obtain access to LGA without paying for slots.
More recently, AIR-21 was enacted in April 2000. This four year reauthorization
bill required that slot controls be eliminated after January 1, 2007. It also encouraged service to connect the HDR airports and small hub or non-hub airports. AIR-21 granted immediate exemptions to the slot restrictions for flights by regional jets with less than 72

13
seats and providing nonstop service to small-hub or non-hub airports, while permitting new entrant carriers and limited incumbent carriers to apply for additional exemptions [U.S. Congress, 2000]. By the fall of 2000, over 300 exemption requests per day had been approved for LGA, with a similar number still pending. Delay at LGA dramatically increased. Many observers believe that after AIR-21, these delays had a severe impact on operations throughout the NAS [Metron Inc., 2000; Donohue, 2002; U.S. House of Representatives, 2001]. One analysis by MITRE showed that, on one particular day, “some 376 flights traveling to 73 airports experienced flights delays because their aircraft had passed through LaGuardia at least once that day.”
The airport operator, the Port Authority of New York & New Jersey, considered
the LGA situation to be untenable, and, on September 19, announced that it was imposing a moratorium on additional flights there. Following this lead, the FAA announced a plan to rescind the AIR-21 slot exemptions that it had already granted and to redistribute some of those exemptions by a lottery. The FAA described this as only a “temporary” solution that would terminate on September 15, 2001. The FAA capped the number of operations per hour for commercial flights at 75. In this way, more than 100 flights permitted under AIR-21 were eliminated, and the remaining exemptions allocated by a lottery on December 4, 2000. The same slot limits and methods for allocating slots continue in place today, but the AIR-21 mandate to remove slot controls at LGA by January 1, 2007 also remains.
In a 2001 Notice of Proposed Policy Options, the FAA and the Port Authority of
New York and New Jersey proposed several potential options for “managing capacity at LaGuardia Airport” [LaGuardia Airport, 2001]. The options included congestion-based landing fees, auctioning of landing and take-off rights, and various administrative alternatives. The latter included one giving priority to larger aircraft by having successive rounds of scheduling slots in the early rounds restricted to larger planes. A second administrative option called for gradually reallocating slots by withdrawing a percentage from large slot holders and redistributing them using a lottery. Under a third option, slots were allocated in four “tranches” including a baseline allocation of 20 per day, a set of small community slots, a set of slots that would be allocated based on airlines passenger traffic, and a set that would be auctioned.
2.1.3. TRENDS IN OPERATIONAL PERFORMANCE AT LGA
In this section, we assess LGA operational performance from 2000 through 2004. We divided this period into several epochs corresponding to demand management policies and other events, most notably 9/11, that affected demand at LGA. Starting in 2002, the periods correspond to calendar years. Figure 2.1 identifies the epochs and plots weekday average scheduled flight demand for the associated months. Altogether, we have a total of seven periods:
The HDR period, from January through August of 2000. Although AIR-21 took effect in May of 2000, we see from Figure 2.1 that it was not until September that scheduled flights increased significantly.

14
The AIR-21 period, from September, 2000 through January of 2001.
The slot lottery period, from February 2001 through September 10, 2001.
Post 9/11 period, through the end of 2001.
Year 2002.
Year 2003.
Year 2004.
The data that we used in our analysis is from the Aviation System Performance
Metrics (ASPM) and Airline Service Quality Program (ASQP) data bases, both maintained by FAA’s Aviation Policy and Planning Office (APO). In our study, we used quarter-hourly data on delay, cancellations, throughput, demand, and called arrival rates. We also used ASQP individual fight data. Our analysis focuses on arriving flight operations. At most airports, arrival capacity constraints pose a bigger problem than departure constraints. Moreover, much departure delay is propagated arrival delay. Thus the general trends that are the focus of this chapter can be adequately captured by considering arrivals only.
Table 2.1 summarizes operational performance at LGA for each of the seven
epochs. A particularly important statistic is the average arrival delay per flight. Arrival delay is measured against the scheduled arrival time, and counts early arrivals as having zero (as opposed to negative) delay. The observed arrival delays under VMC and IMC conditions have similar trends. They increased 17 and 10 minutes, respectively, after AIR-21, reaching 35 minutes under VMC and 43 under IMC. With the introduction of the slot lottery, the delays dropped approximately to HDR levels. They fell even more precipitously with the reduction in traffic after 9/11, and have been climbing slowly but quite consistently as traffic has recovered in the years since.

15
0
100
200
300
400
500
600
700
800
Aug-99 Mar-00 Oct-00 Apr-01 Nov-01 May-02 Dec-02 Jun-03 Jan-04 Aug-04 Feb-05
Month
Arr
ival
s pe
r Day
HDRAIR-21SlotteryPost-9/11200220032004
Figure 2.1: Average Weekday Scheduled Arrivals at LGA, by Month
Table 2.1: Airport Operational performance at LGA
Period Average Delay Cancellation Rate Saturation Rate AAR
VMC IMC VMC IMC VMC IMC VMC IMC HDR 17.80 33.29 0.03 0.07 0.31 0.27 8.69 8.29 AIR-21 34.84 42.93 0.07 0.14 0.40 0.30 8.94 9.09 slot lottery 15.31 31.33 0.05 0.14 0.35 0.27 9.00 8.69 Post 9/11 5.90 10.41 0.02 0.02 0.23 0.19 8.60 8.93 Year2002 9.88 21.55 0.02 0.05 0.28 0.27 8.93 8.74 Year2003 10.88 19.07 0.03 0.08 0.33 0.29 8.81 8.58 Year2004 11.95 25.21 0.06 0.08 0.40 0.40 8.19 8.00 * For those quarter hours with arrival demand larger than acceptance rate. * AAR: Arrival acceptance rate
Another metric that reflects airport operational performance is the cancellation rate, which is the cancelled arrival count divided by total scheduled arrivals. From Table 2.1, we can see that cancellation rates doubled under AIR-21 and remained high even

16
after the implementation of the slot lottery. The rates plummeted after 9/11 and then steadily increased during the following years, reaching AIR-21 levels under VMC conditions during the first half of 2004.
Table 2.1 also includes the saturation rate, which is the proportion of quarter-
hours when arrival demand was greater than the airport arrival acceptance rate (AAR). Aside from the year 2004, the AIR-21 period has the highest saturation rates under both VMC and IMC conditions. The saturation rates decreased after the implementation of slot lottery and dropped sharply after 9/11. They come back to the same level as the HDR period in year 2002 and matched the rates in the slot lottery period in 2003. In the first half of year 2004, the saturation rates were exceedingly high. This may be related to changes in how the AARs are set, which we will consider below.
While Table 2.1 shows trends in overall delay against schedule, this statistic does
not capture changes in operating performance that are absorbed into the schedule itself, through the phenomenon sometimes known as schedule padding. Schedule padding is the practice of building anticipated delay into the schedule in order to maintain on-time performance. To explore trends in schedule padding at LGA, we developed a monthly scheduled time index (MSTI) for that airport. The MSTI is a weighted average scheduled OAG gate-to-gate time across 12 service segments for which LGA is the destination and that have had at least 10 completed flights per month from 1995 to 2004. A consistent set of weights is used in order to remove the effect of changes in the mix of segments over this time period. A monthly flight time index (MFTI), which tracks actual flight time from scheduled gate departure to actual gate arrival, was developed in a similar way. The MSTI and MFTI for LGA are plotted in Figure 2.2. Both indices surged beginning in the summer of 2000. For example, the MSTI increased about 10 minutes between the October of 1999 and October of 2000, when the effects of Air-21 were in full force, while the MFTI increased about 12 minutes. Thus, in this particular comparison, additional schedule padding masked 10 of the 12 minutes in flight time increase. The MFTI dropped sharply after the slot lottery, and again after 9/11, when it reached mid-1990s levels. Since then it has trended upward slightly. The MSTI, in contrast, has decreased since its peak in early 2001, and in late 2004 was about 9 minutes below its value 3 years earlier. Thus a sizable part of the increased delay against schedule since just after 9/11 is a result of more aggressive scheduling rather than increased congestion.

17
100
105
110
115
120
125
130
135
140
145
Jan-
95
May-9
5
Sep-9
5
Jan-
96
May-9
6
Sep-9
6
Jan-
97
May-9
7
Sep-9
7
Jan-
98
May-9
8
Sep-9
8
Jan-
99
May-9
9
Sep-9
9
Jan-
00
May-0
0
Sep-0
0
Jan-
01
May-0
1
Sep-0
1
Jan-
02
May-0
2
Sep-0
2
Jan-
03
May-0
3
Sep-0
3
Jan-
04
May-0
4
Sep-0
4
Month
Tim
e (m
in)
Scheduled
Total
Figure 2.2: Monthly Flight Time and Scheduled Time Indices, LGA Airport
80
85
90
95
100
105
110
115
120
125
130
135
140
145
Jan-9
5
May-95
Sep-95
Jan-9
6
May-96
Sep-96
Jan-9
7
May-97
Sep-97
Jan-9
8
May-98
Sep-98
Jan-9
9
May-99
Sep-99
Jan-0
0
May-00
Sep-00
Jan-0
1
May-01
Sep-01
Jan-0
2
May-02
Sep-02
Jan-0
3
May-03
Sep-03
Jan-0
4
May-04
Sep-04
Month
Tim
e (m
in)
Airborne
Total
Figure 2.3: Monthly Airborne and Flight Time Indices, LGA Airport
Another distinction overlooked in Table 2.1 is between airborne and ground
delay. To consider this, we decomposed the MFTI into two components, airborne time and ground time. Airborne time is the time between wheels-on and wheels-off, while ground time includes gate delay, taxi-out time, and taxi-in time. The total and airborne MFTI for LGA are plotted in Figure 2.3. The plots show that airborne time varies much less than total time—the ranges of variation are 9 minutes and 33 minutes respectively. On the other hand, there was some increase—on the order of 3-4 minutes—in airborne time in the aftermath of Air-21. Moreover, in contrast to the overall flight time, airborne

18
time remained at historically high levels even after the slot lottery, before declining in the aftermath of 9/11.
2.1.4. TRENDS IN RATES AND CAPACITIES
Several of the metrics reported in Table 2.1 are based the concept of a “saturated” period, which we defined as one in which demand exceed the reported AAR. Table 2.1 shows that the average AARs have varied over time, increasing after AIR-21 and fluctuating thereafter. While the called rate is supposed to reflect controllers’ estimates of airport arrival capacity in a given quarter-hour, it may also be affected by other factors. For example, in recent years FAA has used the ratio of count to AAR to calculate an airport efficiency metric. This practice may encourage lower rates to be called, in order to make the airport look more efficient. Other factors, including fleet mix and the level of demand, may also influence the called rate. To investigate how called rates have varied over the different periods in our study, we estimated a regression model in which quarter-hourly AAR is a dependent variable that depends on the scheduled arrivals, visibility, wind speed, operating conditions, and fixed effects for time period and season. Appendix 2A provides details of the estimation. The estimation results suggest that, controlling for factors such as weather, visibility, and season, acceptance rates jumped about 2 flights per hour during the period of high demand after Air-21. Rates fell somewhat with the easing of demand under the slot lottery, and still further after 9/11. From the post-9/11 period, rates climbed, almost reaching AIR-21 levels in 2003, before falling sharply (by about 3 per hour) in 2004. Overall, the analysis shows that AARs respond somewhat to traffic pressure at LGA, but that other factors, perhaps of a political nature, can also play an important role.
These results suggest that AAR may not be a reliable measure of the capacity at
LGA. To obtain an alterative estimate, we used quarter-hourly ASPM data to find the capacity by using Tobit regression. Details are provided in Appendix 2B. The basic idea is that, by observing both how many aircraft want to arrive (the demand) and how many actually do arrive (the count) over a set of time periods we can identify the boundary between demand levels that can and cannot be satisfied. That boundary can be interpreted as the capacity. We performed this analysis for each runway configuration and visibility condition at LGA, and for each of the historical time periods identified above. The results appear in Table 2.2. In 2004, the most recent period, capacity varies between 8 and 10.5 (per quarter-hour) under VFR and between 5.5 and 9.2 under IFR. The more common configurations have VFR capacities over 10 and IFR capacities between 8 and 9. However, there are several configurations when IFR capacity drops below 8 under IFR. These are generally cases where, as a result of crosswinds, a single runway must be used.
Table 2.2 suggests that VFR capacities declined somewhat under AIR-21 for the
most common configurations. For example, in the HDR period the VFR capacity for runway configuration 22|13 was 10.7 while during the Air-21 period it was 9.7. More generally, results suggest an inverse relationship between VFR capacity and the amount

19
of traffic in the system. This may be related to congestion in the airspace in the eastern US that, under high traffic, impairs the delivery of flights to the LGA terminal area at the planned times used to construct the demand variable. Fleet mix changes engendered by Air-21 may have also played a role. Whatever the cause, the effect seems to exist only under VFR conditions.
Table 2.2: Estimation Results for Tobit Arrival Capacity Model for LGA
Configuration Visibility PCT HDRAir-21
slot lottery
Post 9/11 2002 2003 2004
22|13 V 18.7% 10.7 9.7 10.5 11.0 10.9 10.7 10.5 22|31 V 19.7% 9.5 9.5 10.2 10.5 10.3 10.2 10.2 31|4 V 16.6% 11.0 9.7 10.2 10.8 10.8 10.4 10.5 4|13 V 9.3% 11.5 9.9 10.5 11.9 10.9 10.9 10.4 31|31 V 7.5% 8.3 8.6 8.1 8.0 8.1 8.2 8.8 4|4 V 2.1% 11.5 8.3 7.3 10.4 7.8 9.1 7.9 22|22 V 2.0% 7.7 9.3 6.9 6.4 8.3 9.2 8.9 4|31 V 1.3% 9.6 9.5 9.1 9.0 10.3 9.2 8.2 13|13 V 1.3% 11.6 9.0 10.1 7.2 8.8 10.3 9.4 13|4 V 0.4% 10.9 9.9 11.0 na 9.7 11.1 10.3 ns V 2.4% 8.4 8.6 8.4 na 11.4 11.4 9.7 22|13 I 4.9% 8.9 8.4 8.5 9.1 9.1 9.0 8.8 22|31 I 1.0% 7.9 9.3 9.3 9.4 9.3 8.9 8.9 31|4 I 0.7% 8.3 8.8 8.9 9.0 8.5 9.4 8.8 4|13 I 8.0% 8.5 8.3 8.3 9.2 8.5 8.9 8.8 31|31 I 0.2% 5.2 8.9 10.2 na 5.8 8.1 9.2 4|4 I 1.2% 6.6 7.9 4.7 na 5.7 5.6 7.7 22|22 I 0.2% 8.3 10.5 7.2 na 6.4 8.3 7.4 4|31 I 0.8% 7.5 8.5 6.5 na 8.4 8.4 8.0 13|13 I 0.6% 5.6 6.4 5.5 4.4 6.1 6.2 5.5 13|4 I 0.4% 9.2 6.7 6.8 2.4 6.5 4.3 5.8 na I 0.6% 5.9 8.1 7.9 na 9.9 27.6 na
2.1.5. MULTIVARIATE ANALYSIS OF ARRIVAL DELAY
We estimated a system of multivariate regression models to analyze daily variation in average arrival delay at LGA and in the rest of the National Airspace System. The goals of this analysis were twofold. First we wanted to assess the contribution of different causal factors to delays at LGA, and to changes in these delays over time. A second goal was to assess the spillover effect of delays at LGA on delays elsewhere in the system. If such spillovers exist, then congestion management at LGA is matter of national concern, rather than one that can be left for the airport operator and users to work out on their own.

20
-5
0
5
10
15
20
25
30
35
HDR AIR_21 Slottery Sep_11 Year2002 Year2003 Year2004
Ave
rage
arr
ival
del
ayConvective Weather
IFR_ratio
Average predicted delay at other airports
Average arrival queuing delay at LGA
Fixed effect
Figure 2.4: Decomposition of LGA Average Arrival Delay by Causal Factors, by Time Period
Appendix 2C presents the details of our methodology and estimation results; here we present the major findings. Figure 2.4 decomposes LGA average arrival delays in each of the seven epochs defined above into components caused by each variable in our model. The average delay in a given epoch is the difference between the positive bar and the negative bar—for example for the slot lottery period it is 22-1=21 minutes. In general, the most important delay drivers are delays at other airports, queuing delay, prevalence of IFR conditions, and fixed effects for the different time periods that reflect delay differences not explained by the other factors (“Fixed effect”). Figure 2.2 reveals that the delay increase under AIR-21 is caused by a combination of increased queuing delay (which accounts for about half the increase), higher delays at other airports, and more adverse convective weather. Additionally there is a 2-minute increase in delay during the Air-21 period that is not explained by the other variables. One possible source of this delay is gate congestion at LGA. The primary cause of delay change since AIR-21 have continued to be queuing and delay at other airports, with the fixed effect also playing a significant role in the period just after 9/11.
Our estimate of the spillover effect is based on the coefficient on predicted LGA
delay in the NAS-wide average delay model. That coefficient is 0.06, implying that a 1 minute increase in average arrival delay at LGA causes a 0.06 minute increase in average
21
arrival delay at other airports. To convert these per flight results into aggregate ones, we use the fact that LGA accounts for about 1/34 of flight arrivals at all benchmark airports. This means that a 1 minute increase in total delay at LGA causes an additional 34x0.06=2 minutes of delay elsewhere. This large spillover confirms that congestion management at LGA is a problem of national scope.
2.1.6. CONCLUSIONS While congestion management (or demand management) is a common practice at
busy airports in much of the world, in the U.S. it is the exception rather than the rule. The preferred approach has always been to accommodate demand by providing adequate capacity rather than suppressing traffic through economic or administrative measures. The handful of U.S. airports where some form of demand management is in place must therefore operate in an environment outside the norm for the U.S. This tension was heightened by airline deregulation, which eliminated regulatory barriers to airline entry and exit and discouraged airlines from acting cooperatively to manage congestion and allocate scarce capacity. The inherent conflict between policies aimed at limiting air traffic to manageable levels and maintaining a competitive market place has been exacerbated by an airport use pricing policy based on cost recovery rather than resource allocation. A regulated airport industry was very limited in its ability to use market signals to shape the behavior of a deregulated airline industry. As a result, management of this problem has fallen on the sholders of the FAA and Congress.
No airport has been more strongly affected by these tensions than LGA. There,
the slot exemptions mandated by Air-21 caused a surge of traffic beginning in the summer and culminating in the fall of 2000. This traffic brought major increases in delays, most of them related to runway queuing delay. The slot lottery policy was successful in reversing this degradation, while 9/11 reduced traffic to the point where delays related to congestion at LGA virtually disappeared. Flight activity and associated delay have been gradually coming back since; as of 2004, we are approaching where we were during the pre-9/11, slot lottery period.
Although delay has certainly responded to changes in traffic at LGA, it is
important to recognize that much of the delay there is caused by factors other than local congestion. In particular delay elsewhere in the NAS has been the primary source of delay at LGA throughout the period we have analyzed. On the other hand, delay at LGA has also contributed significantly to delay at other airports. It is this mutual dependency that makes airport congestion management a national rather than a local problem.
2.2. SERVICE TYPE AND AVERAGE AIRCRAFT SIZE
A given level of air traffic can be served with more flights on small aircraft or fewer flights on large ones. The factors that influence this tradeoff include the cost of owning and operating aircraft, airline passenger service preferences, market

22
competitiveness, and the cost and availability of airport and air traffic control infrastructure. Slot controls, such as exist at LGA and other airports, may affect this tradeoff in several ways. First, under AIR-21 airlines are required to operate small (71-seat and below) aircraft to qualify for slot exemptions. Second, an airline may seek to preserve slot ownership — which is subject to a “use-it-or-lose-it rule” — by operating smaller aircraft. Third, airlines with limited slots will seek to maximize their productivity by upgauging.
In this section, we compare LGA flight segments with other (non-LGA) markets
in terms of service type (commuter or non-commuter) and average aircraft size to investigate if there are systematic differences in the service type and the size of aircraft used, or in the influence of factors such as stage length and market density on aircraft size. First, we describe the data used for our study. Then we analyze the service types of segments. We employ graphs to explore relationships between average aircraft size and various factors. An econometric model of average aircraft size is presented in the third section. According to the estimated results of the econometric models, some concluding remarks are offered in the last section.
2.2.1. DATA USED We use Data Base Products’ “Onboard Domestic“(from DOT T100) data to study
aircraft size patterns. These data are for U.S. domestic non-stop segments, disaggregated by airline and by aircraft type. From this database we get the numbers of onboard passengers, seats, distances and flights of segments. We use the numbers of onboard passengers to calculate HHI’s of segments.2
Monthly data from year 1999 to 2004 were collected. Here, we consider only
selected time periods to do the graphical analysis and to estimate our models. To compare LGA segments with non-LGA segments, we chose the segments whose origin, destination, or both were the benchmark airports. In service type analysis, to avoid segments with very light traffic, we discarded segments with (1) traffic less than 100 passengers per month, or (2) frequency less than 20 flights per month. We investigate the segments with traffic greater than 1000 passengers per month in aircraft size analysis.
For the aircraft size analysis, because, before October 2002, this database only
includes the carriers who operate at least one aircraft over 60 seats, the data under 60 seats are not representative—we decided to delete them. Therefore, we use the segment data observations in which the aircraft are larger than 60 seats.
2 HHI is the Herfindahl-Hirschman Index, calculated as the sum of the squared airline passenger
shares. It is a measure of the degree of concentration of traffic on a segment.

23
2.2.2. SERVICE TYPE ANALYSIS Graphical Analysis Using the data of November 2004, we plot segment length against segment traffic
density (passenger per month) for different services3 and for LGA and non-LGA segments, as shown in Figure 2.5. Each point in these figures corresponds to one of the 4,063 segments. From Figure 2.5, we observed that we may draw a negatively sloped frontier separating the two sets of segments (commute vs. non-commuter). Segments under the line (lower traffic and shorter distances) are generally commuter, although segments in the transition area (either side of the line) may receive either type of service. In addition, LGA-commuter seems to have different characteristics from other commuter.
3
4
5
6
7
8
9
4 5 6 7 8 9 10 11 12
Traffic Density, ln(pax per month)
Segm
ent L
engt
h, ln
(mile
)
non-CommuterCommuterLGA-CommuterLGA-non-Commuter
Figure 2.5: Segment length vs. traffic density
Econometric Model We apply a binary (commuter or non-commuter) probit to modeling service type.
We consider traffic density and segment length as the causal variables. The specification for the model is:
3 We define two sets of service segments: one in which the traffic is more than 80 percent
commuter, and the other in which the traffic is more than 80 percent non-commuter.

24
ijijijijijij DistLGAPaxLGALGADistPaxV εββαββα ++++++= )ln(**)ln(**)ln()ln( 431210
Where
ijV : The service potential function of segment ij (origin i and destination j)
LGA : The dummy variable for LGA, if origin i or destination j is LGA, then 1=LGA ; otherwise 0=LGA
ijPax : Onboard Passengers of the segment ij
ijDist : Average Stage Length (miles) of segment ij
s'α and s'β : Parameters to be estimated
ijε : A stochastic error term for the segment ij
We are interested in the signs and magnitudes of 3β and 4β (associated with traffic density and distance of LGA), which can tell us if there was significant difference of airline behavior in LGA and non-LGA segments.
Estimation Results Using the data from November 2004, we estimated two models: the simple
version model, in which LGA has a different intercept from the other benchmark airports, and the preferred model in which the effects of other the other factors are allowed to differ for LGA. The estimation results are shown in Table 2.3. Most of the parameters are significantly different from zero, and 1β and 2β have the expected signs. Comparing these two models, we find that their estimated coefficients are close to each other. The only difference is that the LGA dummy becomes insignificant when we add other LGA variables. This implies the differences between LGA and non-LGA segments are captured by the LGA dummy in the simple model, but captured by the other LGA coefficients ( 3β and 4β , which are significant) in the preferred model. This implies that the major difference in airlines’ service type decisions between LGA and non-LGA segments is their response to traffic density and segment length.
The positive sign on the LGA dummy in the first model implies that, all else
being equal, an LGA segment is more likely to be served by commuters than a non-LGA segment. The signs on 3β and 4β in the second model imply that increasing traffic density is a weaker deterrent to commuter service at LGA, while increasing stage length has a stronger effect.

25
Table 2.3: Estimation Results Models
Associated Variables
Coefficients Nov-04 Simple
Nov-04 Preferred
Intercept 0α 8.867 8.901
Ln(Onboard Pax) 1β -0.919
-0.951
Ln(Distance) 2β -0.576
-0.540
LGA Dummy 1α 1.341 4.178LGA*Ln(Onboard Pax) 3β - 0.395
LGA*Ln(Distance) 4β - -0.992
Adjusted Rho-squared 0.479 0.488 Probability of service type equal to commuter Coefficients in bold italics significant at 1%, two-tailed test Coefficients in bold significant at 5%, two-tailed test
2.2.3. AIRCRAFT SIZE ANALYSIS
Graphical Analysis Using the data of November 2004, we plot average seats per flight against
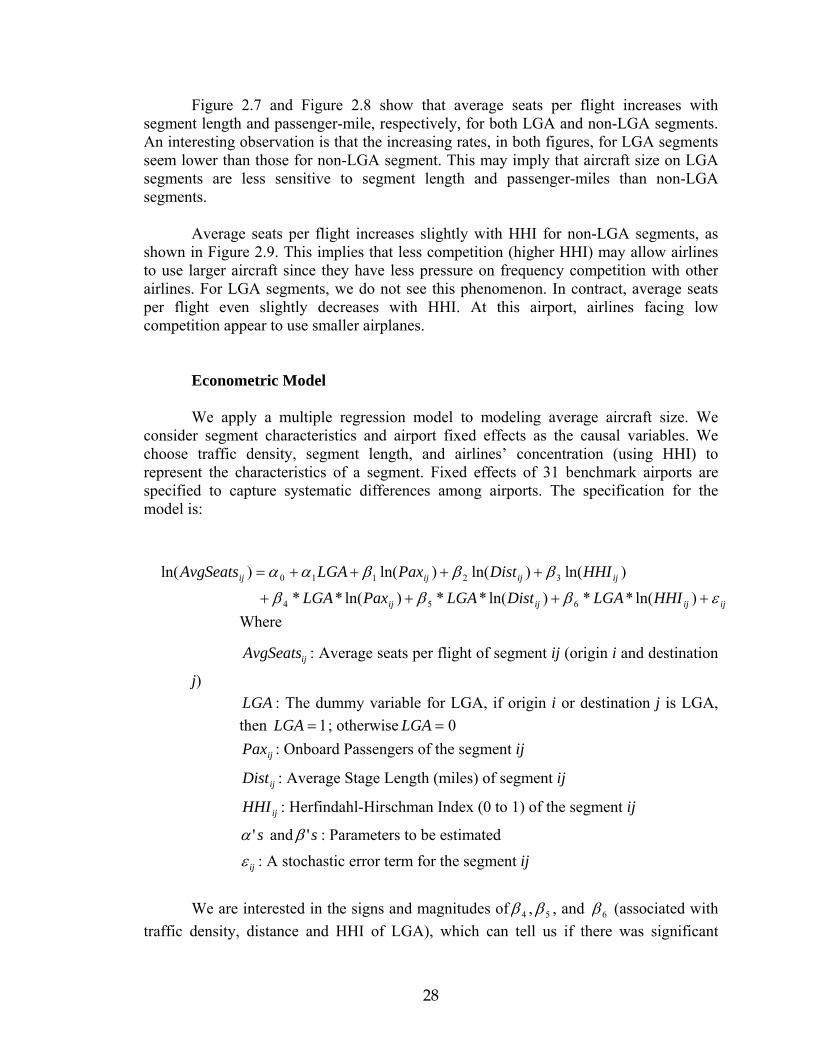
segment traffic density (passenger per month), segment length (distance), the product of traffic density and segment length (passenger-mile), and Herfindahl-Hirschman Index (HHI), as shown in Figure 2.6 to Figure 2.9, respectively. Each point in these figures corresponds to one of the 2,733 segments.
As we can observe from Figure 2.6, for non-LGA segments, average seats per
flight increases with traffic density, especially when traffic density is low. This may imply that airlines enjoy economies of scale, especially when traffic grows from low levels. When traffic passes a certain amount, airlines may add more flights, instead of using bigger aircraft. However, average seats per flight seems unrelated to traffic density for LGA segments. This suggests that large jet operators seek to conserve slots by operating larger aircraft in low-traffic markets.

26
0
50
100
150
200
250
300
0 20 40 60 80 100 120
Pax per Month (Thousands)
Ave
rage
Sea
ts p
er F
light
Non-LGALGA
Figure 2.6 Average seats per flight vs. traffic density
0
50
100
150
200
250
300
0 1000 2000 3000 4000 5000 6000
Segment Length (Mile)
Aver
age
Sea
ts p
er F
light
Non-LGALGA
Figure 2.7 Average seats per flight vs. segment length

27
0
50
100
150
200
250
300
0 50 100 150 200 250
Pax-Mile (Millions)
Aver
age
Seat
s pe
r Fl
ight
Non-LGALGA
Figure 2.8 Average seats per flight vs. passenger-mile
0
50
100
150
200
250
300
0 0.2 0.4 0.6 0.8 1 1.2
Herfindahl-Hirschman Index (HHI)
Aver
age
Seat
s pe
r Flig
ht
Non-LGALGA
Figure 2.9 Average seats per flight vs. HHI
28
Figure 2.7 and Figure 2.8 show that average seats per flight increases with segment length and passenger-mile, respectively, for both LGA and non-LGA segments. An interesting observation is that the increasing rates, in both figures, for LGA segments seem lower than those for non-LGA segment. This may imply that aircraft size on LGA segments are less sensitive to segment length and passenger-miles than non-LGA segments.
Average seats per flight increases slightly with HHI for non-LGA segments, as
shown in Figure 2.9. This implies that less competition (higher HHI) may allow airlines to use larger aircraft since they have less pressure on frequency competition with other airlines. For LGA segments, we do not see this phenomenon. In contract, average seats per flight even slightly decreases with HHI. At this airport, airlines facing low competition appear to use smaller airplanes.
Econometric Model We apply a multiple regression model to modeling average aircraft size. We
consider segment characteristics and airport fixed effects as the causal variables. We choose traffic density, segment length, and airlines’ concentration (using HHI) to represent the characteristics of a segment. Fixed effects of 31 benchmark airports are specified to capture systematic differences among airports. The specification for the model is:
ijijijij
ijijijij
HHILGADistLGAPaxLGA
HHIDistPaxLGAAvgSeats
εβββ
βββαα
++++
++++=
)ln(**)ln(**)ln(**
)ln()ln()ln()ln(
654
32110
Where
ijAvgSeats : Average seats per flight of segment ij (origin i and destination
j) LGA : The dummy variable for LGA, if origin i or destination j is LGA, then 1=LGA ; otherwise 0=LGA
ijPax : Onboard Passengers of the segment ij
ijDist : Average Stage Length (miles) of segment ij
ijHHI : Herfindahl-Hirschman Index (0 to 1) of the segment ij
s'α and s'β : Parameters to be estimated
ijε : A stochastic error term for the segment ij
We are interested in the signs and magnitudes of 4β , 5β , and 6β (associated with
traffic density, distance and HHI of LGA), which can tell us if there was significant

29
difference of airline behavior in LGA and non-LGA segments. We expect that 1β , 2β , and
3β (associated with traffic density, distance and HHI, respectively) have positive signs. Our general hypotheses are as follows.
The more passengers in a segment the higher possibility that airlines use larger aircraft for that segment.
The longer distance of a segment, the larger average aircraft size.
The less competition (higher HHI) the larger aircraft airlines use, because they do not have to compete by frequency, which may reduce the aircraft size.
Estimation Results We estimate the models for two different months (May 2004 and November
2004) in order to assess the stability of the parameters. In addition, we also estimate a simple version model, in which LGA only has a different intercept than other benchmark airports. The estimation results are shown in Table 2.4. Most of the parameters are significantly different from zero and 1β , 2β , and 3β have the expected signs. For non-LGA segments, a segment with twice the traffic density, or twice the segment length of another segment, is expected to have 15%, or 17%, respectively, larger aircraft. Other things being equal, the average aircraft size of a segment served by a monopolist is expected to be about 16% larger than one of a segment served by two airlines with equal market shares. The models explain about 47% of the observed variation in average seats per flights. Since estimates of the two period models are close in terms of significant coefficients, our discussions below will focus on November 2004 models.
If our hypothesis is that LGA segments only have a different intercept than other
Non-LGA segments, we check with the November-2004 simple model. The insignificant coefficient of LGA fails to reject the hypothesis; i.e., we do not find significant evidence that airlines behave differently in LGA segments. However, we will find the story is not so simple for the November 2004 Preferred model, in which our hypotheses are LGA segments have different intercepts and slopes from non-LGA segments. Specifically, our hypotheses are that airlines behave differently in LGA segments than non-LGA segments when they face similar changes in traffic density, segment length, and HHI.

30
Table 2.4: Estimation Results Models
Associated Variables CoefficientsNov-04 Simple
Nov-04 Preferred
May-04
Intercept 0α 2.071 2.023 2.053
Ln(Onboard Pax) 1β 0.152 0.154 0.154Ln(Distance) 2β 0.171 0.174 0.170Herfindahl Index (HHI) 3β 0.323 0.331 0.311
LGA Dummy 1α 0.031 1.892 1.737
LGA*Ln(Onboard Pax) 4β - -0.066
-0.081
LGA*Ln(Distance) 5β - -0.152
-0.121
LGA*(HHI) 6β - -0.297
-0.153
Adjusted R-squared 0.465 0.470 0.4821. Dependent variable: Ln(seats per flight) 2. Coefficients in bold italics significant at 1% (based on heteroskedastic-
consistent standard errors), two-tailed test 3. Coefficients in bold significant at 5% (based on heteroskedastic- consistent
standard errors), two-tailed test 4. 4β in Nov. 2004 preferred model is marginally significant—p-value 0.08.
To visualize the above discussions, we plot figures 2.10, 2.11, and 2.12, based on
the mean values of variables (except for the X-axis variable of each figure) of LGA and non-LGA segments. For each of these three figures, we plot three curves: an LGA representative segment (means of other variables for LGA), a non-LGA representative segment (means of other variables of non-LGA segments); and an LGA-Benchmark segments (means of variables for non-LGA, but assuming it is an LGA segment). In addition, we provide the mean values of X-axis variables, for LGA and non-LGA segments, in the figures.
Figure 2.10, for example, has the following interpretation. LGA segments on
average have higher traffic densities than non-LGA segments (26 vs. 14 thousand a month). At these higher densities, we would expect, based on our model, to observe higher average aircraft sizes at other airports than at LGA (157 vs. 144 seats). If LGA segments had the same stage length and market concentration as non-LGA segments, the aircraft size on them would be slightly larger (146 vs. 144 seats).

31
Figure 2.11 shows that LGA segments are on average somewhat longer than non-LGA segments (1000 vs 750 miles). At the 1000 mile distance, our model predicts that LGA aircraft sizes are slightly larger than aircraft sizes at other airports, assuming a market density and market concentration representative of these other airports. The interpretation of Figure 2.12 is analogous.
In sum, our results support the claim that airlines’ fleet mix patterns at LGA are
quite different from those elsewhere in the domestic system.
100
110
120
130
140
150
160
170
180
0 10 20 30 40 50 60
Pax per Month (Thousands)
Ave
rage
Sea
ts p
er F
light
LGA
AP=30Benchmark
LGA-Benchmark
Mean(LGA)
Mean(30Benchmark)
Figure 2.10 Estimated average seats per flight vs. traffic density

32
100
110
120
130
140
150
160
170
180
0 500 1000 1500 2000
Se gment Le ngth (Mile )
Ave
rage
Sea
ts p
er F
light
LGA
AP=30Benchmark
LGA-Benchmark
Mean(LGA)
Mean(30Benchmark)
Figure 2.11 Estimated average seats per flight vs. segment length
100
110
120
130
140
150
160
170
180
0.0 0.2 0.4 0.6 0.8 1.0
HHI
Ave
rage
Sea
ts p
er F
light
LGA
AP=30Benchmark
LGA-Benchmark
Mean(LGA)
Mean(30Benchmark)
Figure 2.12 Estimated average seats per flight vs. HHI

33
2.2.4. CONCLUDING REMARKS We built econometric models to investigate the service type and average seats per
flight of LGA and non-LGA markets. The historical data provides evidence that there was a systematic difference in airline behavior in LGA and non-LGA segments: (1) airlines are more likely to use commuter service at LGA for a segment of given density; (2) airlines tend to use smaller aircraft in LGA segments for given traffic density, distance and HHI; (3) airlines’ decisions of aircraft size in LGA segments are less sensitive to traffic density and competition compared to non-LGA segments. These results suggest that, at the present time, the incentives toward using smaller aircraft resulting from Air-21 slot exemptions and the use-it-or-lose-it rule have been more important than the pressure to up-gauge in order to maximize slot productivity.

34
3. CRITERIA FOR IMPACT In this section, we discuss some metrics that might be used to evaluate different congestion management alternatives. We classify the metrics into three categories:
Efficiency Effectiveness Distributional Consequences
Each is discussed below.
3.1. EFFICIENCY The primary goal of any congestion management program should be to improve
upon the efficiency in the use of scarce resources. One goal would be to create an environment where there is less incentive for carriers to engage in strategic manipulation to affect their competitors’ positions in the market. In addition, gate utilization should increase, turn-around times should decrease, the average aircraft gauge should increase, load factors should increase, and passenger enplanement opportunities (and the number of actual enplanements) should increase.
Under market based congestion management, all operators (except those made
exempt for air service policy or other reasons) will confront the cost of scarcity. This in turn will cause the improvement in the efficiency of the use of facilities and equipment—faster turn times, bigger aircraft, etc. Furthermore, in a market environment, the allocation of access to the facilities should remain dynamic, so that over time, those with higher or better uses of the facilities will be able to gain access to them. This is the essential difference between a market and administrative approach.
It may be possible to develop administrative approaches that would result in
improved efficiency, at least for initial allocations. The greater difficulty is creating a dynamic environment so that over time those with higher or better uses can gain access to the facilities.
3.2. EFFECTIVENESS
The primary metric for judging the effectiveness of a congestion management policy would be the resulting experience with delays and congestion. There are essentially two approaches: allocating slots either via administrative or market (auction) mechanisms, or using congestion prices to match capacity and demand. Clearly, a slot approach may create a more certain delay outcome, at least during the initial phases of a policy application. However, there are ways to restrict or constrain the market for access in order to reduce uncertainty if congestion pricing is selected as part of a policy solution.

35
A second important area of effectiveness will be related to changes in how
carriers gain access to airport facilities. In order to make airport access more dynamic (and thus more efficient), some portion of the gate and related facilities at subject airports should be common or otherwise more easily available as the industry evolves. This in turn could necessitate the need for the airport authority to incur the costs of operating and making significant investments in common gate and other facilities. One consequence of this may be that airlines may in the future be less inclined to invest in their own facilities at the subject airports. To the extent that there are excess funds resulting from a congestion management policy, some of these funds may be needed to fund future capital investments and the cost of operating common facilities.
3.3. DISTRIBUTIONAL CONSEQUENCES
Because the slot rule has had a long life, there are bound to be changes in the pattern of service both among cities served and among airlines. Distributional changes are the logical consequence of increases in efficiency, where higher and better uses are found for scarce assets. Among the more important distributional issues are:
The effects on service to small communities and the need to accommodate
such service in any policy prescriptions Uses for excess funds including the potential need to invest in airport facilities
(as discussed above) Providing excise tax offsets (PFCs and some portion of user taxes) in order
not to distort the market Potential compensation to airlines for gates released for common use Loss of service to some communities The potential inability of carriers to pass on higher access fees to consumers Benefits to consumers not currently adequately served because of access
restrictions at the airport
It is important to note that if a congestion management tool is both more efficient and effective (as defined above), then the benefits of such programs will outweigh the costs. With adequate compensation, the air transportation system should therefore improve.

36
4. FUNCTIONAL DESCRIPTION AND ANALYSIS OF MARKET MECHANISMS
4.1. DESIGN OF A PRIMARY SLOT AUCTION MECHANISM
We refer to the auction process by which the government sells slot leases to air carriers (and possibly others) as the primary slot market; trades of leases among airlines will be referred to as the secondary market. This section describes an auction design that allows the allocation of slots through a transparent bidding mechanism whereby slots of specified duration are put up for auction, the auctioneer provides prices for each item and the bidders respond with the number of slots within each time period that they desire (for the given lease period) at that price. The auction ends when the market clears, i.e. when there is no excess demand for the slots. This auction design can be used both for an initial slot allocation and on a seasonal or yearly basis to provide a means for carriers to trade or sell slots (secondary market). It can also be used by the FAA to re-allocate leases as the leases expire or in the event of wholesale slot foreclosures, such as airline bankruptcy. The slot auction described here was demonstrated in the second NEXTOR strategic simulation. 4.1.1. JUSTIFICATION FOR A PRIMARY MARKET
The Federal Register 52180-52201 (December 20, 1985) called for efficient use of the airspace and specified: “Overall, the scheduling committees are not currently functioning in a manner which provides for the efficient allocation of slots, for rapid adjustment to market conditions and shifting carrier needs and preferences, for adequate opportunity for expansion of operations, or for new carriers to serve high density airports.”
In NPRM 14 CFR Part 93 “Congestion, Delay Reduction and Operating
Limitations at Chicago O’Hare International Airport; Proposed Rule and Notice”, the FAA details the objectives of any allocation of slots at capacitated airports to be:
Keeping available a variety of adequate economic, efficient, and low-priced air services.
Placing maximum reliance on competitive market forces and on actual and potential competition.
Avoiding airline industry conditions that would tend to allow at least one air carrier unreasonably to increase prices, reduce services, or exclude competition in air transportation.
Encouraging, developing and maintaining an air transportation system relying on actual and potential competition.
Encouraging entry into air transportation markets by new and existing air carriers and the continued strengthening of small air carriers to ensure a more effective and competitive airline industry.

37
Maintaining a complete and convenient system of scheduled air transportation for small communities.
Ensuring that consumers in all regions of the United States, including those in small communities and rural and remote areas, have access to affordable regularly scheduled air service.
Acting consistently with obligations of the U.S. Government under international agreements.
Similarly, we note that the Port Authority is seeking to accomplish several
strategic objectives at LGA: Ensure efficient airport operation with an acceptable level of delay. Allow LGA to reach at least 30 million annual air passengers. Allow sufficient service to small communities within 300 miles of LGA. Promote diverse and competitive service at LGA. Ensure that the Port Authority financial returns are not diminished. Recognize the linkage between slots and available airport gates (i.e.,
ensure every operation has a gate). Discourage growth in “shoulders” (operations before 6:00 a.m. and after
10:00 p.m.). We believe that an open, competitive market mechanism as described here and in
the Mock NPRM accomplishes the goals of both the FAA and of the Port Authority of NY/NJ. It allows new entrants and low cost carriers the ability to enter LGA; it places maximum reliance on market forces; it assures that competition continues at LGA; and addresses the small community issues. In addition, it is consistent with the goal specified under 49 U.S.C. 40103, that authorizes the FAA “to develop plans and policy for the use of navigable airspace and to assign the use that the FAA deems necessary to its safe and efficient use.” In terms of the goals of NY/NJ Port Authority, it provides a more predictable and level use of the airport; is likely to encourage some up-gauging, thereby bringing more passengers to the airport; and it ensures that the Port Authority receives the finances necessary to maintain the airport (revenue neutral to the Port Authority). The current plan does not discourage growth in the shoulders, but if such growth became a problem, we could auction slots during these periods.
We first present the reasoning behind the specification of the limit on LaGuardia
arrivals during peak periods, and the rights and obligations that confer with an Arrival Authorization during such periods. We next present a proposal for initial arrival assignment and then the proposed auction design and its associated rules.
4.1.2. SPECIFICATION OF THE LIMIT ON LAGUARDIA ARRIVALS DURING PEAK PERIODS We now describe our proposed rule; some of the parameters are subject to further
refinement. The FAA would limit the number of scheduled flight arrivals at LaGuardia from 6:00 a.m. to 10:00 p.m. local time. Scheduled arrivals would be limited to 35 per

38
hour (and to no more than 9 in any 15 minute period). 32 of these 35 arrival times per hour would be determined first by an allocation scheme described below and thereafter by auction. Unscheduled flight arrivals (such as arrivals by general aviation, the military, and certain charter services) would be restricted to 3 arrivals per hour, under the advance reservation system used currently at LaGuardia. Unscheduled flights will be priced on the day of operation at the pro rata price (i.e. daily rate) determined in the most recent auction for slots, multiplied by an adjustment factor; e.g., a discount or surcharge could be applied.
The proposed hourly arrival limits are based on a variety of analysis done as part
of the delay-reduction studies funded by the FAA and by evaluating the FAA’s actual experience with operations at LaGuardia under the HDR.
In a January 19, 2005 report to the FAA, GRA summarizes analyses conducted by
the Port Authority of New York and New Jersey regarding runway capacity. They present the results of a 1994 study by Leigh Fisher entitled “Impact on Aircraft Delay from Increased Aircraft Operations During Slot-Controlled Hours at JFK and LGA.” This study presents LGA Runway System Capacities under various arrival percentages and VFR/IFR conditions. The data indicate that the hourly combined arrival and departure capacity is never more than 81 per hour and this occurs only under VFR conditions (arrive runway 4, depart runway 13, mix of 40% arrivals to 60% departures). On the other hand, under a 50% arrival mix, the highest attainable runway capacity is 78 (arrive 4, depart 13 and mix 50/50), but this condition occurs only 22.8% of the time. The LGA report then considers the four airport configurations in both IFR and VFR conditions. The capacity at LGA is quite sensitive to the percent of operations that are arriving and to the airport configuration/weather conditions. Under VFR conditions, and a 50% arrival rate, the average weighted runway capacity is 71.1 and goes down to 60.1 during IFR conditions. The weather-related average capacity is 70.4 per hour. The LGA report also shows that maintaining balance between arrivals and departures maximizes available capacity at LGA, but during the early morning hours when departures dominate, it may be possible to increase operations without incurring substantial delays.
Stochastic queuing theory predicts that without an escape valve (e.g. nighttime
hours for queues to disappear), setting the arrival rate close to the service rate (in this case, the runway capacity) will result in unbounded delays. We acknowledge that some delay is inevitable under optimal usage but delay above a certain level is costly to the overall system – both to the air carriers and to the customers. Some of the current delay at LaGuardia is masked because the airlines “pad” the schedule to take account of the time that they expect to wait. We have therefore set the target of 35 arrivals per hour, which is close to the average capacity at LaGuardia and acknowledges that there will be some delay during the peak period of 4:00 to 8:00 pm because of possible build-up of delays from earlier in the day. We acknowledge that there are likely to be some delays and cancellations due to mechanical problems, unexpected staffing shortages, and delays at other airports. We also acknowledge that some delay has value both to the airlines (the ability to schedule more flights) and to the public (more frequent service). There is an optimal tradeoff between the number of flights and the level of delay. More research

39
needs to be done to determine the “optimal” number of slots in each time period at LaGuardia.
ATA argues that the proposed limit on arrivals per 15 minute increment reduces
total operations from the current 81 per hour and this reduction in capacity is not explained and is not justified given the strength of passenger demand for service. We acknowledge that more research should be done on this important issue. Still our target of 35 arrivals per hour is supported by both network simulation and actual experience. Thus, both simulation runs and actual data regarding the capacity of the airport runways argue that there should be some reduction in the total number of flights at LaGuardia. We hope that the FAA will consider reviewing the data available and determining the appropriate level of wait at LaGuardia.
Finally, ATA argues that “Consumer demand for scheduled operations at LGA
has created a unique level of demand that should be uniquely recognized. Slots should not be held back for non-scheduled slot pricing operations or, in the alternative, the price for those slots should be set high enough to discourage non-scheduled operations. Significantly higher non-scheduled slot pricing also would more fairly recognize the actual costs that non-scheduled operations impose on the airport and airway system”. In the current approach, the number of slots kept back for the non-scheduled flights is consistent with the average number that they currently use. Also, the non-scheduled flights would pay the same rate as scheduled flights and must adhere to the same departure rules. We recognize that many of these unscheduled flights are smaller planes which require a larger separation on the runway. We welcome further comments on both the fee structure and the number of slots allocated to the unscheduled users of LaGuardia.
Another approach to handling the variability in capacity at LaGuardia due to
weather conditions is for the FAA to consider a more precise handling of capacity issues by creating an auction with both priority and non-priority slots. That is, one could allocate slots that would always be given predictable (small delay) service regardless of weather conditions and then a second collection of slots that could expect good service during VFR conditions but would experience greater delays during IFR conditions. Interestingly, the vast majority of the arrival slots (25 of the 30 per hour) could be “high quality” and only 5 of 30 per hour could be of “low quality” (The exact number that should be allocated to high and low could be varied somewhat to allow greater or lesser wait for the low priority slots). We can envision an airline choosing to purchase these low quality slots for either low-cost service or to allow more flexibility in choosing which slots to delay or cancel during poor weather conditions. We seek comment on this idea. The Port Authority argues that a study of the operational implications of such changes is necessary. We agree, although we think that the current CDM process can accommodate this prioritization.

40
4.1.3. DEFINITION OF ARRIVAL AUTHORIZATION Throughout this document, when we discuss a slot, we mean this term to be
consistent with the term Arrival Authorization4, as defined in 14 CFR Part 93 (March 25, 2005). For auction purposes, we propose to elaborate on this definition. We auction an arrival right but with this right is conferred both the right to schedule an arrival at LaGuardia during the specified 15 minute period as well as the right to schedule a departure from LaGuardia within a particular window, e.g., 1.5 hours after the landing time. We will use the term “slot” throughout this discussion although when bidding on a “slot,” one is actually bidding on both an arrival and a departure. The time specified will be for the arrival. Slots for arrivals after 8:30 p.m. must depart by 8:00 a.m. the following morning. Slots are to be auctioned for each 15-minute period from 6:00 a.m. through 10:00 p.m. Only air carriers and airport proprietors are allowed to participate in the auction.
When these definitions were first provided to the industry, many were concerned
about the linking of departures with arrivals. Specifically, some argued that the 1.5 hour duration might not be long enough (some flights arrive during non-peak times and purposefully postpone their departure until the peak period) while others argued that allowing longer times between takeoffs and landings creates ground facility problems (not enough gates) and the NY/NJ Port Authority worries that the definition might allow too many planes to overnight. Simulation studies and discussions with NY/NJ Port Authority officials may provide more insight into this question.
When the airlines were surveyed about the time interval preferred for the slot
auction, of the eight who responded, the responses were as follows: 1 hr (1), 45 min (1), 30 min (2), 15 min (3). One respondent commented that it may be difficult to commit, long term, to scheduling in specific 15 minute intervals. However, generally it was admitted that one hour intervals might lead to traffic bunching and congestion and most agreed that 15 minute intervals might be necessary to control congestion. When this group was surveyed on the 90 minute window between an arrival and a departure, most thought that it was appropriate, some thought maybe even too generous. There was some concern about overnight issues and there was a concern that there may need to be an exception for flights coming from or going to Canada.
The Port Authority supports the proposed annual auction period, the five year
license terms and the 20% annual turnover. It does worry, however, that although “1.5 hours may sound like a reasonable figure; however, feasible and preferred aircraft turn-around times will vary according to such factors as the airline’s business model and the size of the aircraft. Consideration needs to be given to how this arrival-departure slot relationship may advantage certain users and disadvantage others. Also, the potential for problematic departure congestion (“bunching”) needs to be considered. According to the scheme outlined in Appendix H, arrivals are scheduled in 15-minute windows, with a
4An Arrival Authorization is the operational authority assigned to an air carrier or foreign air carrier by the FAA to conduct one scheduled arrival operation within a specific 15-minute time period each day of the week.

41
departure required within 1.5 hours of an arrival. As an example, arrivals for all the 15-minute slots between 6:00 a.m. and 7:30 a.m. could be paired with departures very close to, say, 7:35 a.m. This bunching of departures at 7:35 a.m. would create congestion problems with runways, air traffic control resources, etc. One means of addressing this potential problem would be to dispense with the 1.5 hour spread and instead auction 15-minute windows for departures simultaneously with the 15-minute windows for arrivals. Bidders would be constrained to submitting bids that contained an equal number of arrival and departure slots.” If the separation of arrivals and departures is necessary, the auction design proposed can accommodate this. However, we note that the recent March 25, 2005 NPRM uses a definition for their Arrival Authorization that completely ignores departures at O’Hare. We believe that more study about how our current definition might impact LaGuardia is required and we welcome working with the Port Authority on this matter. We should also note that currently there is a very active “swap market” in which airlines exchange slots on a temporary basis to facilitate seasonal scheduling. It is quite possible that small problems arising from the slot limitations discussed above could be resolved in this market.
American Airlines recommends managing arrivals and departures separately in 5 minute intervals, and managing total operations in one-hour intervals. Separately managing arrivals, departures, and total operations could be implemented in an auction, but we doubt that the benefits would justify the complexity.
We look forward to further comments on the definition of a “slot” as it will be
used within an auction context. 4.1.4. DETERMINATION OF THE INITIAL ASSIGNMENT OF ARRIVAL
AUTHORIZATIONS AND LENGTH OF INITIAL AUTHORIZATIONS
In order to initiate the process and assure that the carriers currently at LaGuardia have sufficient time to adjust to a new allocation scheme, the FAA would initially assign Arrival Authorizations based on the current allocation under the High Density Rule, 50 FR 52180, December 20, 1985 with a slight compression in the allocation due to the reduction in the total number of available slots from 82 to 70. By assigning Arrival Authorization to each carrier in a manner that corresponds with the arrivals actually scheduled by carriers under HDR, the FAA intends to minimize the operational or economic disruption to the airline industry upon implementation of the proposed rule. Such an assignment to carriers currently holding them would avoid immediate disruption of air service to the public and will provide the NY/NJ Port Authority with the ability to transition the airport to any changes in air carrier and/or fleet mix. We note that each Arrival Authorization would be allocated solely to the carrier that actually operated the flight, regardless of any code-sharing agreements. At the same time, in making our initial Arrival Authorization determinations, the FAA will not assign Arrival Authorizations to a carrier that is essentially operating the service as a contractor for another carrier and does not market its services independently. Thus, under the proposal, where the operating carrier conducts the flight solely under the control of another carrier, the carrier controlling the inventory of the flight would receive the assignment.
42
The proposed assignment method is also consistent with the FAA’s handling of
similar issues in the past. Since this allocation is only for an interim period prior to a market clearing mechanism, it does not provide to these carriers a long-term financial windfall nor does it adversely affect new entrants since those wishing entry into LGA can procure slots on the newly established secondary market.
We propose that Arrival Authorizations will, after this initial allocation, have a
finite lifetime of 5 years, but seek comment on the authorization period. For the initial Arrival Authorizations, the lifetime will be staggered to assure that, in the long term, 20% of the leases will be available for auction every year. Thus, to initiate the process the remaining lifetimes on slots would be staggered so that approximately 20% would have 4 years remaining, 20% 5 years, remaining, etc. Thus, the first primary auction for slots would take place between one and three years following the initial allocation. For the initial 1 to 3 years, there would be only a secondary market. The secondary market would allow for all parties to become familiar with the market operation and also for the government to adjust the market operation if desired before the primary slot market became operational. Of course, from a buyer's perspective, the principal difference between the primary and secondary markets would be that, at the end of each year when a large number of leases would expire, the market would have a much larger number of slots offered for sale. The air transport association argues that only a viable secondary market is necessary to assure that slots are utilized in an economically efficient manner. We believe that a primary market that allocates leased slots with finite end terms assures that there will be a viable secondary market. The reverse is not necessarily the case.
The advantages of this assignment and authorization length are that this provides
the incumbents with a transitional period to adjust their schedules; it limits slot lifetimes; and it provides a long-term market mechanism for slot turnover and efficient use of slots. Having a secondary market in addition to the primary market will encourage a mechanism for slot turnover during the transition period. However, having this transition period will lengthen the time before significant changes occur.
One airline worries that a “constant turnover of slots is problematic when carriers
are trying to produce schedules to meet passenger demand and build market presence.” We recognize this and have purposefully provided property rights that extend over five or more years. We welcome the discussion of lease duration and also welcome a discussion on whether there should be varying lease durations and whether the auction should allow a carrier to relinquish some slots in exchange for extending the lives of other slots.
An alternative to the initial allocation described above is for each incumbent to receive a voucher that can be used within the auction. Vouchers are equivalent to cash and can be used by incumbents as (partial) payment toward any slots that they acquire within the auction. One voucher will be provided to each current holder of slots for each time period based upon their current allocation of slots during that time period. Vouchers represent a share of the revenue stream from the auction to incumbents. Vouchers are transferable and divisible. In particular, vouchers are equivalent to cash and

43
can be used as payment in the purchasing of slots at this auction or any future FAA auction. Incumbents are able to track the value of their vouchers during the auction and use the value to meet deposit eligibility requirements. Similar to the initial allocation process, when the number of slots auctioned is less than the total number of slots allocated presently, a slot compression factor is used to determine the revenue share provided by a voucher. The slot compression factor is the ratio between the number of slots made available in each time period in the auction (i.e. eight) and the existing number of slots allocated in that time period. The value of each voucher is determined by taking the incumbent’s current allocation during a given time period and multiplying by both the slot compression factor and the average fee-adjusted price5 for the time period. If vouchers are used in lieu of an initial allocation, then they will be provided to incumbents only in the first year of the auction. The concept of vouchers may be retained in future auctions to allow for reconfiguration of airport slot capacity. Vouchers may also be used in future auctions to allow the winner of a lease in an earlier auction that has yet to expire to sell the remaining duration of the lease. In this case the seller would introduce the slot into the auction and receive a voucher for the appropriate share of the revenue proceeds if the slot was ultimately sold to another airline. The Port Authority argues that, rather than vouchers, one should impose “as a condition of accepting any slots, all carriers agree to participate in good faith, audited negotiations to resolve any property allocation imbalances resulting from the slot auction. Such a process should be overseen by both the airport operator, who has intimate knowledge of the terms and financial value of existing leases, and by the federal government, who has an overriding interest in preventing incumbents from thwarting the slot auction by refusing reasonable accommodation of real estate and other facilities needed to exercise slots.” It argues that with such a rule, “remedies such as vouchers would be unnecessary since no airline will want to continue to pay for a facility that will be largely unused (or underused).” We seek comment on whether to use an initial allocation process or a voucher process.
We end this section by noting that Arrival Authorizations are not purchases but
rather leases that have a finite lifetime and then automatically revert back to the FAA. The right provided under this authorization is the authority to publish a schedule that includes an arrival and departure operation. If the FAA determines that the capacity must be reduced for a specified period of time (for example, if a runway were temporarily closed), then the Arrival Authorization would be withdrawn for that period. Once the capacity is resumed, the withdrawn Arrival Authorizations would be returned to the carriers from which they were withdrawn.
5 Landing fees are accounted for in determining the average fee-adjusted price for a time period. The NYNJ Port Authority will be given the authority to extract fees from final prices to be revenue neutral with current fees and cover operating costs. The “landing fee rate” in the auction is determined as the ratio of the total operating costs at LaGuardia and the total revenue when the auction closes. The average fee-adjusted price is defined as the average price multiplied by (1 – Landing Fee Rate). We note that this is consistent with one airline’s suggestion that “the FAA should be pursuing a policy of removing perverse economic incentives (e.g. weight-based landing fees) for small aircraft use in medium/large.” We agree and have specified an auction plan that would keep NY/NJ Port Authority whole (in terms of fees) but would remove the weight-based landing fees.

44
4.1.5. GENERAL INFORMATION ABOUT WHAT IS BEING AUCTIONED
AND THE LEASE PERIOD As described above, the auction will determine the allocation of Arrival
Authorizations (“slots”) to air carriers. These slots will be grouped into 15-minute time periods. The number of slots auctioned will be based on the current average throughput at LaGuardia. The leasing of a slot provides the lessee with the right to schedule an arrival and departure at LaGuardia. One bids on an arrival and a departure follows. These rights are conferred for the entire period of the lease (every day—both weekdays and weekends) and the lessee is charged for the use of that slot regardless of delays/cancellations during the day of operations. In addition, one slot in each time period will be excluded from the auction and used for unscheduled flights. Slots for unscheduled flights will be priced on the day of operation at the pro rata price (i.e. daily rate) based on the auction prices of slots in the same time period. All unscheduled flights must adhere to the restriction of only one arrival (and one departure) per 15-minute time period. A regulatory process is proposed to provide carriers serving certain small communities with rebates on slot fees6.
The airport will work with airlines acquiring slots to attempt to locate gates,
baggage, and ticketing within a single terminal. We have already noted that the Port Authority recommends that the FAA impose as a condition of acceptance of any slots that the air carriers agree to participate in good faith in the negotiations for gates.
The LaGuardia Slot Auction will be for slot leases with several different
durations. This will facilitate a regular, yearly, auction for a fraction of the total slots. During the first three years, only secondary market slots will be available. As leases expire they will be re-auctioned. Therefore, by year 4, at least 20% of the slots will be available for re-auction. Any holder of a lease always has the opportunity to place that lease into any such auction and sell it for the duration of the period of the holding. The
6 To clarify: All airlines bid on an equal basis, and then if ex post a carrier decides to provide service to a small community, it gets a rebate based on the extent of that service. We believe that the definition of a small community should be reexamined. We provided, as a strawman, the following definition: “A small community is defined as any community with a population below 750,000 that has been underserved by air carriers in the NY/NJ metropolitan area.” The Port Authority believes that it should be involved in setting the definition of small communities and in determining the level of service. It argues that the definition of small communities should be limited to those within 300 miles of LGA since those communities outside this radius can benefit from connecting service over airline hubs to LGA. We agree and welcome this conversation with the Port Authority and the FAA on what other attributes should be included in this definition. Carriers obtaining a discount for servicing such communities, must service these communities with no smaller than 50-seater jet aircraft. The FAA will decide the size of the rebate (% of slot price). This process allows the airlines to decide where to fly ex post, in negotiation with the small communities. Once the carrier receives approval by the FAA that specific flights qualify for discounts, the carrier receives a check for service provided the previous month. Appendix H contains a proposal that auction winners could receive rebates if they used their slots to service small communities. Or, as an alternative, some number of slots could be set aside for small community use only.

45
holder of a lease will have complete rights to use the lease. If the lease holder wishes to sell the lease, it must be placed in the secondary market for blind sale.
At no time can an individual bidder possess leases on more than 35% of the slots
at LaGuardia. We note that many commented on this rule. We recognize the role of hubs in this industry and we did not intend for this rule to be applied uniformly throughout all airports. It serves as a placeholder and the FAA will choose the appropriate percentage based on the characteristics of the given airport. It is used to preclude a single carrier, with extremely deep pockets relative to the rest of the industry, from taking control of a highly capacitated airport. During times of high competition and many players, the rule is unlikely to be binding.
Because we believe that these airline slots have complementary values and
because the airline industry requires arrays of slots in order to deploy service to LaGuardia airport, we are proposing an auction design that allows bidders to bid on any aggregation of the slots auctioned, as a package and on an all-or-nothing basis.
All slots within a given time period for a given lease period will be considered
fungible and identical. Bidders will be provided with a per unit price for each time period and they will respond by specifying the total number of slots that they wish to acquire during a given time period (and with a given lease period) at the auctioneer’s specified price.
ATA argues that “the proposed auction, in which 20% of the slots would be re-auctioned annually, creates uncertainty regarding the ability of air carriers to provide efficient and competitive service, and therefore may inhibit, rather than encourage entry and competition. Carriers are less likely to invest in new or expanded service if they risk losing a significant portion of their slots annually. Short term slot leases are inconsistent with the kind of long term investment decisions that air carriers, particularly network carriers, must make. The proposal also would affect the ability of air carriers to leverage slots as they do today, further restricting the already limited ability of air carriers to acquire needed working capital.” We argue that having a regular auction provides the industry and the regulators with a continual assessment of the value of slots at LGA. We also believe that a five-year lease is a relatively long lease given the changes in the industry that occur during that time period. How the auction process begins, however, is open for discussion. Indeed, there has been much debate as to the best way to initiate this process. We provide two alternative proposals above. We welcome comments.
4.1.6. OVERVIEW OF THE PACKAGE BIDDING AUCTION DESIGN
The auction design we propose is an ascending clock auction with package bidding, in which a bidder submits bids for any package of the slots. The auction is proposed as a practical design for a large-scale auction for many related items. The approach combines the simple and transparent price discovery of the clock auction with the efficiency of combinatorial auctions. We request comment on this clock auction design. Air carriers with service at LGA were invited to participate in a mock auction in

46
February 2005 using this auction design. The auction design blends features from the “Clock-Proxy Auction” [Ausubel et al, 2006] and uses linear pricing throughout the clock auction. An optional final proxy round is based on ideas from [Parkes and Ungar, 2000] and [Ausubel and Milgrom, 2002].
The clock auction is a simple iterative auction procedure where the bidders
specify the number of slots they desire at the prices announced by the auctioneer. This design has been used commercially in a number of industries in recent years. It generalizes the eBay-style online auction to accommodate multiple items, and it utilizes an “activity rule” that prevents last-minute “bid sniping.”7 The auction proceeds in rounds whereby no item is “won” until the end of the auction. Since more than one slot will be auctioned in a given time period, a bidder specifies the number of slots desired in each time period at the specified price.
At the end of each round of the auction, new prices for the next round are
computed. These prices will increase on slots where aggregate demand exceeds the supply, and the bidders will again specify desired slot quantities at the new prices. Prices on packages are defined as the sum of the prices of all slots within a package. The auctioneer announces the total number of bids (aggregate demand) for all slots within each time period and the new prices of the slots. This process is repeated until either the auction closes naturally (when there is no excess demand) or can be stopped by the auctioneer when total auction revenue increases by less than a target figure (to be announced prior to the auction) in two successive rounds, at which point a “last and best round” is declared. Intra-round bidding – the ability for bidders to provide information about slot demand between the last round and current round bid prices – is used to accelerate the auction process. Thus, the clock auction is an ascending auction in which new prices are announced each round. In this auction design, the bidder can submit bids on packages of slots, and each package bid is treated as an all-or-nothing bid.
A well-functioning slot auction needs rules that discourage last-minute bidding. In
order to avoid this problem, the clock auction phase utilizes an activity rule that requires bidders to bid for minimum quantities of slots at the beginning of the auction in order to continue to be eligible to bid for equivalent quantities at the end of the auction. This rule creates incentives for each bidder to place realistic bids throughout the auction, making each round of bid data informative and improving the auction performance.
This auction design has a number of positive features. The auction is similar to
the simultaneous multi-round auctions used by the Federal Communications Commission (FCC) for spectrum licenses. Although these auctions have been quite successful and have been adapted to many other applications, the present auction design makes a number of improvements over the previous non-package design: 7 Bid sniping occurs at the last minute of an auction with a fixed-time ending. The purpose of sniping is to give other bidders no chance to respond to an offer to buy. Similar actions occur when a bidder prefers to not disclose the value that it places on a bid. This bidder acquires price information from other bidders but does not reciprocate since throughout most of the auction, the bidder is silent.

47
It enables bids on packages of slots and protects bidders against the risk of
winning only a portion of the slots needed for their business plans;
The auction groups functionally equivalent slots into fungible classes, thereby expediting the auction;
The auction design limits the amount of non-essential information provided to the
bidders, thereby reducing potential problems of collusion and retaliatory bidding. Price and demand information are provided to the bidders after each round, but information about the specific behavior of particular bidders is not provided;
There is a requirement for advance deposits to ensure that the bidders are capable
of paying for the slots won.
In principle, there may be an extraordinarily large number of packages to consider and evaluate. However, given the competitive market structure at LaGuardia, we can anticipate that price discovery in the clock auction phase will be substantial. Thus, the price discovery allows bidders to understand the cost of slots over the day and limit their evaluation to packages that they consider the most profitable consistent with their business plans.
The concept behind intra-round bidding is to allow a larger price increment
between rounds without jumping past the maximum price that bidders will pay for slots. The auctioneer announces lower and upper bound on round prices and the bidders can provide up to five different price points that are linear combinations between the beginning and ending prices at which they can provide a package. For instance, assume that the beginning price for a given time period is $10 and the ending price is $20. Between $10 and $13.99, the bidder wants 4 slots. Between $14.00 and $16.50, it wants 3. And any price between $16.51 and $20.00, it is willing to buy only 2 slots. This bidder would then provide three bids: one at the beginning price of $10.00, one at $14.00 and one at $16.51. If there is more demand for this item than supply at the $20.00 price, then the starting price in the next round is $20.00 and the ending price is somewhere above $20.00, determined by the auctioneer. If, on the other hand, not all items sell at $20.00, then the auctioneer determines at what price all items clear and announces that price as the starting price of the next round.
At the end of the clock auction phase, the auctioneer may declare a last and best
round in which bidders can submit final bids. These bids must comply with the activity rule. Unlike bids earlier in the auction, the bidders can provide final bid prices that exceed current end prices. The final round can then proceed as a normal auction round to determine the outcome of the auction. As an alternative, the auctioneer may declare a final “proxy auction” round to implement this last and best round. The auction will close with the final allocation that maximizes revenue given these final bids and all bids in previous rounds. If the final round is a regular round then a combinatorial optimization

48
procedure is applied to determine the winners and the slot prices. The result is a “uniform price” for equivalent slots.
If the final round is done as a proxy round, the last and best round would
determine prices based on an automated ascending-price “proxy auction”. An automated “proxy agent” takes the final bids for each bidder and bids in an ascending auction that mimics the progress of the entire auction up until this round but with prices on packages rather than slots. This is fully automated with no further bids submitted from bidders. The proxy agent operates on the same principle as proxy bidding in eBay and other online auctions. In eBay, a bidder may enter a proxy bid of $250, but if the final bid by any opponent is placed at $200, the proxy agent submits a bid of $201 and stops. Similarly, in the proxy auction, the bidders can indicate maximum prices for various combinations of slots. The proxy agent then submits bids on behalf of the bidder—never for more than the indicated maximum prices, and only as needed to remain a high bidder. The proxy agent always selects the best profit opportunity for the bidder given the bidder’s specified maximum prices. The auctioneer sequentially selects provisionally winning bids that maximize revenues until the proxy agents have no new bids to submit.
The effect of this procedure is that bidders need not pay their maximum bid
amount, but rather only the minimum required to overcome another coalition of competitive bids. Thus, as in an eBay auction, the winning bidder pays the lowest price that prevents another bidder from winning, rather than paying its maximum bid amount. As a result, the identity of the winning bidders remains the same; only the prices that they pay are affected. For a complete description of the underlying economic properties of the proxy auction, see [Ausubel and Milgrom. 2002].
At the end of the auction, winners will be announced. All winners will need to
provide a payment of the total slot fee that will accrue from use of these slots during the lease period. This fee must be provided to the FAA within two weeks of the close of the auction. Failure to provide this payment will result in a 5% penalty and the loss of landing rights at LaGuardia airport.
We propose a regulatory process to provide carriers serving certain small
communities with rebates on slot fees. To clarify: All airlines bid on an equal basis, and then if a carrier decides to provide service to a small community after the auction closes, it gets a rebate based on the extent of that service. We note that the definition of small community has not been revised since the mid 1960s. A redefinition of small community is needed.8 Carriers obtaining a discount for servicing such communities, must service these communities with no smaller than 50-seater jet aircraft. The FAA will decide the size of the rebate (% of slot price). This process allows the airlines to decide where to fly once the auctions clear, and in negotiation with the small communities. Once the carrier
8We propose that NY/NJ Port Authority in cooperation with the FAA reexamine and determine an appropriate definition of small community. We provide a few examples: Small communities are defined to be: any community within 300 miles of LaGuardia Airport with a population below 750,000 that has been underserved by air carriers in the NY/NJ metropolitan area or alternatively use the definition similar to that provided by [MASSPORT, 2004]

49
receives approval by the FAA that specific flights qualify for discounts, the carrier receives a check for service provided the previous month. ATA argues that “treating service to small communities differently than other service to/from LGA is inconsistent with the principle of allowing the marketplace to determine service decisions by air carriers, and patently inconsistent with the economic principles underlying the proposed auction system.”
There was much discussion over the small community issue. Each of the
exercises (administrative options, congestion pricing and the mock auction) indicated that without some incentives or exemptions from fees, the airlines would tend to remove, at least partially, service to small communities. We, therefore, have included an exemption for small communities whereby those serving such communities would be rebated some portion of the auction fee. This is consistent with a major stated goal of the FAA, that of “ensuring that consumers in all regions of the United States, including those in small communities and rural and remote areas, have access to affordable regularly scheduled air service.” 4.1.7. RELATIONSHIP OF PRIMARY MARKET TO SECONDARY MARKET
The secondary market will have a design similar to that of the primary market. At regular intervals, the FAA will hold an auction and holders of Arrival Authorizations would be allowed – in order to advance the goals of promoting and advancing market forces – to place these Authorizations into that auction. There will be no other mechanism for the sale of ownership of such Authorizations. Thus, sales of Authorizations will be permitted only through the blind market overseen by the FAA. This would ensure that new entrants and all other airlines have an equal opportunity to purchase Arrival Authorizations. See section 5.2 for more on the secondary market. Furthermore, the only consideration permitted for transactions in the auction is cash or vouchers. Use of real property such as gates, non-monetary assets or other services in lieu of cash would not be permitted. No leasing or subleasing mechanism will be supported within this secondary market.
However, the proposed rule would permit the one-for-one exchange of Arrival
Authorizations between airlines so long as no additional consideration is provided; for instance these must only take place on a non-cash basis. These exchanges must be publicly disclosed and could take place outside of the blind market because many of these arrangements are required for (often short-term) operational reasons. Such exchanges are an effective and vital way to deal with variations in seasonal demand and other variations in network operations. The proposed rule would prevent Arrival Authorizations from being used until written confirmation of the transaction is received from the FAA.
We note that ATA agrees that “a well-designed secondary market ensures that air
carriers who value slots are able to acquire them at market-driven prices, ensures vibrant competition among air carriers and encourages carriers to invest financial and human resources in service to LGA.” We have presented rules in the above paragraph that are consistent with those described in the FAA’s NPRM dated March 25, 2005 for O’Hare

50
Airport. We welcome comments on this since we are concerned that there may need to be other transactions outside of this secondary exchange. Specifically, we are not sure that only one-for-one exchanges of Arrival Authorizations are sufficient to overcome seasonal demand changes, and to satisfy the demand for slots for only a small portion of the year and other factors. At a minimum, one might need to hold the proposed secondary market more frequently to accommodate changes in ownership in order to respond to market conditions. We welcome discussions on this rule. 4.1.8. RESPONSES FROM THE INDUSTRY ABOUT THE PROPOSED
AUCTION DESIGN
ATA argues that the proposed auction forces the creation of a complex and expensive system to achieve the same result as the current administrative processes. We respond that, currently, there is no open market mechanism that allows access by airlines to LaGuardia. We have described a process that leads to such a system but provides incumbents with time to adjust to such changes. The auction process is no more complicated than that used by many government agencies for allocating other scarce resources and the design proposed has been successfully used for just such purposes.
ATA also argues that “the proposed auction design, as complex as it is, fails to
address package bidding with slots at other airports. Air carrier operations at LGA are merely one part of a much larger system that must be coordinated and integrated nationally, and, in some cases, internationally. Any auction design must accommodate the need to coordinate schedules at other slot-controlled airports, even if few other airports are slot controlled at this time. Delays and congestion are not unique to LGA, as we know from the extraordinary measures FAA has taken at O’Hare International Airport, and it would be unreasonable to design an auction process that does not account for this obvious connectivity.” The auction design described in this document is capable of handling multiple airports. The NEXTOR team was instructed to restrict this study to LGA. The team welcomes the opportunity to expand the research to consider a network-wide solution or, at a minimum, to consider the interaction of the three major airports in the New York/New Jersey region. We agree that if one limits capacity at one of these airports then it is likely that the other airports will begin to receive the overflow, possibly moving the problem to another location. When participants at the second exercise were asked whether the auction should be expanded to include the entire New York/New Jersey area, the response was generally that trying to plan for one airport is complicated enough – planning for the entire region might be too complicated.
ATA concludes that “Establishing the proposed auction shifts attention away from
the real problem at hand, that is, the inadequate capacity at LGA. FAA has failed to pursue operational and technical measures to significantly increase capacity at LGA. To say simply that it can’t be done is unacceptable and ignores potential technical and structural solutions.” We agree that any and all means to increase capacity at LaGuardia should be considered. However, any such improvement would yield only modest benefits and would require many years to fully realize. The FAA has evaluated whether

51
any near-term air traffic procedural changes, airspace redesign, or equipage upgrades could provide sufficient capacity or efficiency gains to meet the level of airport demand experienced in late 2004 and early 2005 at LaGuardia. Although some equipage changes are possible, they cannot be implemented immediately and will only provide marginal improvements. The auction design proposed in this report will allow the FAA to recognize any future capacity increases realized and supply that capacity to the airline industry by placing additional slots into a future auction. In the meantime, the FAA must determine how to handle the existing and pent-up demand for LaGuardia airport.
The Port Authority argues that “Careful consideration should be given to the
tradeoff between auction designs that approach a theoretical ideal, and designs that will be understood and trusted by bidders. No matter what design is chosen ultimately, it will be critical that sufficient time and effort is provided to educate bidders on the process. We note that the initial FCC spectrum auctions were relatively small and more simplified than later auctions, and that more complex designs involving package bidding have yet to be implemented in the real world. It may be worthwhile to consider a more simplified auction for the first of any slot auctions, and then to move towards a more complex design as bidders gain familiarity with the process.” We agree and have simplified the design (although assured that it still has nice theoretical properties) and propose starting it with fewer goods (only a secondary auction will take place in the beginning years). However, we note that the clock design that we are proposing is close to the auction design that the FCC has been using for many years. It merely improves on some aspects that were found to be problematic (e.g., possibilities for bid signaling, no package bids, no “last and best” provision, an activity rule that did not encourage bidders to bid on all that they wanted at the beginning of the auction). We argue that the current design is no harder to use than the FCC design that has been used for many years. This design has been successfully used by other government agencies.
Finally, the Port Authority is concerned that the proposed auction design does not recognize the current financial arrangements that are in place at LGA. The Port Authority argues that the auction process (or any pricing mechanism) should not assume that the current weight-based, cost recovery flight fees will be blended in with the pricing mechanism. Further, it argues that any revenues resulting from an auction (or any pricing mechanism) must be treated as local airport revenues and be used to maintain the airside, terminal and landside capacity and infrastructure of the airport and local airport system. We acknowledge that there is a need to keep the Port Authority, at a minimum, revenue neutral and acknowledge that the Port Authority may need additional revenues to transform the airport into one that is more of a “common use” facility. Above and beyond that, it seems reasonable to have monies directed towards increasing capacity at LaGuardia and neighboring airports, where possible.

52
4.2. CONGESTION PRICING
4.2.1. OVERVIEW GRA has investigated the possibility of implementing congestion pricing as an alternative to auctions or administrative programs in order to address congestion issues at LaGuardia Airport.9 There are a number of advantages and disadvantages of congestion pricing. Some of the advantages include:
No Slots: With pricing, there is no need to administratively set the number of operations in a particular time period. Instead, prices would be continuously adjusted to reach desired levels of activity at the airport, with the target levels set by the FAA.
Carrier Scheduling Flexibility: In the absence of slots, carriers would be
free to try to reduce frequencies or upgauge in reaction to higher congestion fees knowing that they could go back later (without the need to buy a slot) and add service or reduce gauge should market conditions so dictate.
Potentially Reduced Strategic Behavior: Carriers would have no incentive
or ability to hoard slots in order to prevent their competitors from having adequate access to LaGuardia. All carriers would be free to schedule flights whenever they deemed it appropriate.
But, there are potential disadvantages as well. These include political feasibility,
the likelihood of pricing inefficiencies, potential scheduling instability and lack of practical experience in implementing congestion pricing.
A key to implementing a successful congestion pricing scheme would be the establishment of an independent Pricing Board tasked with varying prices in real time to reach FAA operational targets. Several detailed suggestions for implementation are offered below including ideas to overcome the potential disadvantages noted above.
A congestion pricing simulation for LaGuardia was carried out in November 2004 to help FAA consider some of the issues identified above. The simulation provided mixed results regarding the likely level of fees that may be needed to reach reasonable operational targets at the airport.
9 This report was initially drafted in December 2004 and does not reflect subsequent work efforts
currently being undertaken by GRA.

53
4.2.2. IMPLEMENTING CONGESTION PRICING In the present section, we provide some general comments on congestion pricing and how it compares to auctions and/or administrative programs.
Advantages of Pricing Versus Auction/Administrative Programs There are four major benefits of pricing relative to auctions and administrative programs, both of which require slots:
No Slots: With pricing, there is no need to administratively set the number of operations in a particular time period. Instead, prices would be continuously adjusted to reach desired levels of activity at the airport, with the target levels set by the FAA to produce reliable air transportation service both at LaGuardia and throughout its system.10
Carrier Scheduling Flexibility: In the absence of slots, carriers would be
free to try to reduce frequencies or upgauge in reaction to higher congestion fees knowing that they could go back later (without the need to buy a slot) and add service or reduce gauge should market conditions so dictate. In other words, LaGuardia would become just like any other airport (with the exception that its landing fee would be higher), but carriers would not need to incur the transactions costs of acquiring scarce slots in a secondary market.
Reduced Strategic Behavior With No Slots: Carriers would have no
incentive or ability to hoard slots in order to prevent their competitors from having adequate access to LaGuardia. All carriers would be free to schedule flights whenever they deemed it appropriate subject only to their ability to pay the congestion fee.
Scheduling Discipline from Inter-Airport Competition: Although carriers
might have some strategic incentives to over-schedule in the hopes of driving out weaker competitors, a natural disincentive against such behavior in the New York area would be inter-airport competition. The flight offers available at Newark and JFK would discipline any short-term advantage that carriers might gain by reducing the amount of competition at LaGuardia. In general, it would be difficult to gain a permanent advantage in the absence of slots because competitors could easily reenter markets under a pricing regime.11
10 In theory, there is an optimal level of operations at LaGuardia which depends not only upon
delay levels, but also upon the consumer and producer benefits available given market conditions (demand, cost of production, service to the other New York airports, and service throughout the national network, delay costs not internalized, environmental externalities); we would expect the optimal level of operations to vary with market conditions.
11 Assuming there is adequate gate capacity. DOT has estimated sustainable gate and landside capacity at LGA as 90 and 80 operations per hour respectively. In theory, sufficient gates should be
54
Potentially Reduced Political Activity: The absence of slots might create
the opportunity to reduce special purpose activity (commuter and small community service); under pricing, it would be feasible to allow special purpose users to have access to the facility at a reduced price, but the direct consequences (in terms of higher fees) paid by other users would be much more apparent and arguments against such special purpose uses politically more effective.
What Organization Should Set Prices
In general, airport groups like AOCI have indicated that sponsors would be interested in setting congestion fees, in part as means to raise revenues for expansion. Airlines have expressed fears that airport sponsors would be able to take advantage of airport space-monopolies and charge fees that exceed congestion costs. A critical issue relates to incentives to expand if airports have the option to implement congestion pricing instead. In a recent paper, GRA argued that if airports were given the authority to set congestion fees they should first have an approved expansion program in place. This provides the airport with the incentive to push through the often-cumbersome expansion process before congestion reaches critical levels. As part of the process, congestion fees collected above direct runway costs would be allocated to the expansion program, thereby creating a ready source of financing. When the expansion program was completed, if the demand-capacity relationship was in balance, the above-direct cost portion of the congestion fee would be eliminated.12 From an economic perspective, aligning airport rights to set a congestion fee with a requirement that they commit to an expansion program rectifies one of the important defects in setting fees locally. But, granting airports this right to price above costs would upset a carefully crafted existing set of institutional and regulatory arrangements designed to reign in airport power and would alter the business relationships between airlines and airports significantly. 13 To avoid having to adjust so many institutional relationships, an alternative would be to have DOT/FAA set congestion fees. There is no doubt that these agencies have the industry knowledge and analytical capabilities to undertake this task. There may be some important advantages in integrating congestion pricing into the processes (e.g., ground holds) currently used to handle congestion nationwide. For example, there might be two levels of access made available at LGA –
available to sustain competition especially because it is expensive to carry excess gates costs at LGA. See[U.S. DOT, 1995]
12 At LGA, where there are physical limits to expansion, excess funds could be devoted to regional commercial airport expansion or improvements in air traffic control. See [GRA, 2003].
13 For example, FAA’s “Rates and Charges Policy” requires that fees be based on historic costs and not exceed total costs for building, operating and maintaining runways, taxiways, navaids and land dedicated to aircraft operations. FAA sponsor assurances prohibit unjustly “discriminatory fees” and require “reasonable rates”. Use agreements also typically prohibit collecting more than the direct costs of operating the airport (including finance charges). The Port Authority has an exemption from Federal policies against charging more than direct costs, however.

55
one during good weather and the other during IMC. FAA could then run the ground hold program taking account of the two levels of service. A disadvantage of having DOT/FAA set the prices is that the process might be more heavily influenced by politics than may be desirable. One of the main rationales for eliminating the slot rule was to avoid carrier and other operator lobbying for advantage (e.g., granting or not granting exemptions.) FAA already has enormous responsibilities to manage air traffic control, insure aviation safety, regulate safety and supervise airport programs. Setting congestion fees will be controversial in any case, and having the function inside DOT/FAA could easily lead to unwanted political attention that could affect these other critical missions.
The Advantages of an Independent Pricing Board As conceived, an independent Pricing Board would have only one function: it would adjust congestion fees up or down in order to meet the FAA mandated level of operations for LaGuardia. FAA might provide hourly targets or not-to-exceed figures for consecutive hours. An alternative would be for the FAA to provide instructions regarding expected levels of delay (based on a model to be agreed upon). The Pricing Board would then adjust fees in real time in order to induce operators to reduce operations to the mandated level. The crucial aspect of an independent Pricing Board concept is the Board’s ability and power to adjust fees to any level deemed necessary in its sole discretion to reach the mandated level of operations. Conceivably, Board members would be appointed by the President or his designee, confirmed by the Senate (if appropriate) and removed if their actions were deemed to be causing substantial harm. But in principle, the Board should be given substantial leeway to vary prices frequently if necessary to reach the mandated level. In effect, the Board would be rationing (in effect “auctioning off”) access to LaGuardia, but with the added flexibility inherent in a pricing regime as opposed to an auction.14 There is substantial doubt in the literature about whether it is feasible to accurately estimate optimal congestion fees.15 Because the Pricing Board would be continuously adjusting prices, and reacting to schedule changes, there would be no need to attempt to derive optimal prices. Instead, prices would be set only to the levels necessary to reach the operational thresholds.16 Other issues with regard to a monopolization of the facility would be left to other regulatory authorities (DOT and DOJ).
14 This observation was first made by Larry Phillips of DOT. 15 See, for example: [Brueckner, 2001] which discusses the need to account for a carrier’s ability
to internalize congestion costs; and [Pells Verhof, 2003] who are more concerned that in oligopolistic markets standard congestion fees might exceed optimal levels and could result in carriers acquiring market power through monopolization of key facilities.
16 [Fan, 2004] finds that “coarse” pricing without the benefit of detailed knowledge of the demand curve results in congestion fees near optimal levels.

56
Some Concerns About Pricing and an Independent Pricing Board While congestion pricing via an independent Pricing Board may have some advantages over auctions, there are obvious disadvantages as well. Many of these problems would remain if the airport or DOT/FAA set the prices.
Political Feasibility: One obvious concern about the Pricing Board's congestion pricing format is whether it is politically feasible to establish such a panel. FAA and DOT would not be ceding authority over the level of operations at LaGuardia (which they currently establish) but, instead, would be substituting a pricing board for the current allocation mechanism. The plan would almost certainly be attacked because of fears of unstable prices in the marketplace. These fears might be justified for the initial period of time after the process was begun because carriers might exhibit some strategic behavior in an effort to gain advantage (see below).
Pricing Inefficiency: Unlike auctions where quantities are pre-determined
and users "reveal" market-efficient prices through their bids, a mechanism such as the one described here potentially would face difficulties in reaching the appropriate market-clearing prices. There are many ways in which the prices set by the Pricing Board could be inefficient. For example, a set of time-of-day prices could simply be too low or too high (in which case they could be adjusted during succeeding pricing rounds) . On the other hand, it could well be that the overall level of delay associated with a given set of prices could hit the Board's target, yet the distribution of prices could still be inefficient, i.e., there may exist an alternative set of prices that, on average, are lower but lead to the same overall average delay. It could be difficult for the Board to identify exactly when it is at or near the most efficient (lowest) set of prices for any observed level of average delay.
Strategic Behavior With Over-Scheduling: As is the case with auctions, the relative financial positions of operators at the time congestion management is put in place may have an effect on the outcome. With respect to prices, some carriers may choose to publish inflated schedules in the hope that some of their competitors will drop out of markets as the Pricing Board increases prices in order to reach the target level of operations. Of course, when they publish their schedules, the carriers hold out seats for sale on those flights. This provides some natural disincentive against at least some gaming, although the carriers can control the amount of capacity put in the marketplace via their revenue management systems. Some consideration should be given to devising a mechanism to ensure that flight offers represent real intentions to fly as opposed to contingent flight offers dependent upon the reactions of competitors (see below).
Scheduling Instability: Especially in the initial phase of implementation of
congestion pricing, when slots are eliminated and carriers are free to

57
reschedule in any way they desire, experience in the immediate past Air 21 environments suggests that there may be a fair amount of over-scheduling by carriers for strategic purposes. After Air 21, numerous carriers filed additional flights into LaGuardia. Almost certainly, many of these flights had very little chance of being economically viable unless competitors, seeing the congestion levels at the airport, chose to exit. We might expect that the Pricing Board would face this type of jockeying for position, at least in the initial stages of implementation.
Market Uncertainty: It is possible that congestion pricing would cause a
high degree of cost uncertainty for carriers as the pricing board varies the time-of-day fees up and down. Obviously, this would be a more important issue for operations with smaller aircraft where such fees could represent a relatively large portion of total operating costs. How this would play out in terms of the level and composition of total operations at the airport could depend importantly on the extent to which operators take a short-term or longer-term view of their activity at LGA. In the short term, large changes in congestion fees from one period to the next could cause correspondingly large changes in activity. But over the longer term, operators will be able to form better expectations about future congestion fee changes and they may also consider long-term strategic interests, leading to relatively small changes in activity even with significant price changes. Some of this behavior was evident in the pricing game exercise where there was very little response to the price increases imposed in Round 2.
Market uncertainty may also cause problems in cases where a carrier is faced with incurring substantial fixed costs (say, to set up a shuttle operation). A business plan that relies on a certain level of landing fees may no longer be viable if those fees were to change substantially after such costs were incurred.
Practical Experience: While there has been experience in Europe in setting
congestion fees at airports (for example Dublin, London, and Brussels assess peak fees) most of these fees continue to rely on weight-based components. The fees, themselves, are relatively static and have been used more to collect additional revenue for the purposes of adding capacity than to manage congestion. As will be seen below in the discussion of simulation results for LaGuardia, analysis conducted by GRA suggests that per-operation fees at LaGuardia would need to be far higher than comparable fees in Europe in order to actually manage the congestion problem. Furthermore, reaping the main benefits of pricing (avoiding slots, increasing carrier flexibility and reducing political seeking) will require a far more dynamic environment. There is very little, if any, experience in such an environment, which creates additional risk, especially relative to auctions where there is a great deal of experience.
58
Some Comments on the Process for Implementing Congestion Pricing To address these problems and avoid a potentially unstable environment, the following discussion describes preliminary congestion pricing mechanisms for airports just beginning to experience delay and for airports already subject to extreme delays (LaGuardia would likely fall into the latter category). What follows in NOT a recommendation, but instead a set of possible for tools for addressing some of the unique issues involved in pricing airport access. The tools are subject to change and modification as additional information and research is completed. The primary objectives would be to:
Control delay Account for small community and new entrant services (exempt
commercial services) Allocate non-exempt access to highest and best use
A key distinction of pricing (as opposed to auctions or slot controls) is that the airport would be just like any other except the access (landing) fees would be higher during certain periods of time.
1. Independent pricing board: An independent pricing board would be established to set congestion surcharges at airports found by the FAA to be experiencing unacceptable delays. Rationale: The Board would have only one objective, to set prices that clear the market for airport access. While it would be free to consider the views of all parties (FAA, the airport and operators), it would be judged solely on whether the prices it sets reach the operational targets set by FAA (see 2 below).
2. Trigger for action: FAA would define a trigger when an airport is reaching unacceptable congestion. FAA would define the trigger on a case by case basis and rely on its established tools of analysis e.g., actual delays reported in Opsnet exceeding a defined level, expected delay in VFR in excess of 15 minutes during a defined period of time of day and/or days of the week. An airport would be defined as chronically congested if its demand also exceeded the airport’s VFR capacity by some defined percentage. Rationale: FAA would retain control over the integrity of the national system and would set in motion various actions to prevent delays from reaching crisis proportions. In all cases, FAA would retain the right to set operations levels (as at ORD) in the event that other actions did not reduce delay exposure to acceptable levels.
3. Adjustment to landing fees: To reduce the growth in delays, when an airport
meets the above criteria for certain times of the day or days of the week, FAA would encourage the sponsor (via sponsor assurances or the competition plan

59
process) to alter, change its landing fee calculation methodology so that all operations pay the identical fee during each congested time period and adjacent time periods (as determined by FAA) and the total funds collected remains the same (revenue neutral flat fees). Rationale: Traditional weight based fees provide the wrong incentives in cases where one flight precludes another. The higher fees on heavier aircraft provide incentives for operators to fly lighter aircraft. A flat fee is neutral as to weight or size of aircraft. Congestion pricing or auctions could work without flattening landing fees but the fees may have to be higher to offset the incentive to fly lighter aircraft. Alternative: One alternative would be to use excess funds from congestion pricing to offset the cost of the airfield cost center; this would have the effect of reducing landing fees (perhaps to zero), thus reducing the effect of the incentive to fly light aircraft.
4. Surcharges: The Pricing Board would set surcharges above the landing fees at
airports where the actions taken in (3) proved insufficient. The Board would be empowered to set surcharges at whatever level is necessary to reduce delays to acceptable levels.
The Board could adjust surcharges at any time with 24 hours notice.
The Board would in no case assess a surcharge if the FAA determines that the
conditions in (2) no longer exist – for example, if an expansion program has increased capacity so that actual delays are below the threshold in (2).
Rationale: The Board will require the power to change prices at any time to prevent carriers from feigning entry or additional operations in the hopes of driving competitors from the market. The Board will want to maintain stability in pricing to provide operators with less uncertainty about the costs of operations at the subject airport; having the power to change prices is just one of the tools the Board will require to maintain order and stability in the market (see 5 below).
5. Special provision for chronically congested airports: For chronically congested airports as defined in (2), special provisions to establish a market would be undertaken:
Non-scheduled operations at the airport would be limited to some pre-
determined number per time period and would be required to pay the same surcharge and landing fee as all other non-exempt operators; the Board could at its discretion adjust this number based on use. Rationale: Unscheduled operations are by definition less predictable than scheduled ones. This rule would be implemented via the IFR reservation system (on a first come first served basis, except for charter operators who will have the opportunity to obtain a reservation at least three months in advance). Because these operations at congested facilities may prevent others

60
from having access, they should confront the same prices as all other non-exempt operators.
The FAA/ DOT would determine the number of exempt operations in each
hour and will identify the flights using an OAG format; such flights would not be subject to the surcharge but would pay the revenue neutral flat fee. Rationale: This proposal provides continuing access to exempt operators (new entrants; small community service) but requires them to pay the minimum price (a flat landing fee) at a congested facility.
120 days before the first day of each month, all carriers would submit a confidential future schedule of non-exempt flights to the Board to include all information normally provided to the OAG, CRS or other schedule vendor and will also include the gate the carrier proposes to use; the carrier would certify that the schedule reflects its intentions.
The Board would aggregate the schedules, examine the impacts on delays and
issue (within three work days) congestion surcharges for congested time periods and any shoulder periods (to be defined by the Board).
The carriers then would have three work days to resubmit their schedules in
light of revised surcharges.
The Board would continue to adjust surcharges in successive rounds until it is satisfied that congestion targets have been met. • In conjunction with the airport operator, the Board would assess whether
the schedule that satisfies the congestion target can feasibly be operated using available ground facilities (including gates and associated infrastructure). In instances where small deviations in schedule will result in a feasible solution, the Board could suggest schedule changes to the affected airlines. If these are accepted, the schedule will be declared final. If they are not accepted, certain flights may be excluded from the final schedule.
• The Board would then declare the carrier schedules final; the final schedule would include the feasible gate assignments.
Rationale: These pricing sessions are required at airports where likely demand far exceeds capacity in order to provide the Board with enough information to set prices. The number of rounds and duration of the pricing sessions (including the effort made by the Board and the carriers) will likely taper off relatively quickly once initial prices have been set.
Carriers who choose to schedule and (within their control) operate according to their final schedule would be assessed only the surcharge that applies to each time period; carriers choosing to schedule or operate in different time frames may do so but would be assessed a surcharge premium (to be defined by the Board based on the size of the variance and the effect on delays).

61
Rationale: This feature reduces any temptation to game the pricing rounds.
No carrier would be permitted to operate at the airport in the subject month unless it has received a final schedule. Some allowance could be made to permit carriers to operate a certain small percentage of flights in excess of those specified in the final schedule. Rationale: This feature reduces any temptation to game the pricing rounds.
The Board would have the power to require carriers to abide by their final
schedule for the month if it deems this appropriate, except carriers may choose to fly fewer flights in a month than their final schedule for that month. If a carrier chooses to fly some predetermined number of fewer flights than are shown in its final schedule for a month, its flights in the next month would be capped at the actual number of flights flown in the subject month and the carrier would be required to pay surcharges on all flights not flown. Rationale: This feature reduces any temptation to game the pricing rounds.
The Board could choose to reduce surcharges in any time period if there are
large negative variances in the number of flights actually flown. Rationale: This feature is needed in the event of sudden changes in air service so as not to discourage replacement operations or to price scarcity that no longer exists.
4.2.3. USE OF FUNDS AND GATE ACCESS An important question is how to disburse any excess funds (above current landing charges) that are collected from a congestion pricing scheme. Obvious candidates for these funds would be sponsor-related projects, regional projects or national projects. A potentially attractive alternative would be to reduce certain other user taxes at the subject airports and apply any excess funds from the congestion fee to projects that would otherwise be funded by the taxes. For example, operations at LaGuardia could be exempted from PFCs, segment charges and some allocated portion of ad valorem taxes related to support of airport infrastructure and the AIP program. The obvious attraction of this alternative would be to reduce the fiscal burden on users, while still realizing most of the benefits of congestion pricing.
For example, funds collected under the surcharge could be applied first to offset PFC’s paid by individual airlines at LaGuardia, and then to, say, 30% of FAA user charges for flights at the airport. Any remaining funds would be ear-marked for (a) FAA approved capacity expansion at LaGuardia or to eliminate constraints to capacity expansion; (b) approved expansion of the terminal area (ATC) system including purchase and training for on-board systems; (c) expansion of airport or ATC terminal capacity at other commercial service airports operated by the PANYNJ, at other commercial service airports in the FAA region, or at other commercial service airports.

62
In order to be reimbursed for PFC’s and user tax funds, carriers could be asked to voluntarily relinquish gate capacity in each concourse in which they operate.17 The relinquished gates would then be operated on a common use basis by the airport operator. Funds from congestion pricing would be used to pay the airline for its unamortized investment in the gate. Additional funds would be laid aside for the modernization of the gate including use of CUTE terminals. The airport operator would have the right to decline any relinquished gate, in which case the carrier would be reimbursed in any case. By relinquishing the gate, the carrier would not be precluded from using the common use gate, but use of such gates would be determined by the airport operator. There are at least two arguments against the user-fee exemption proposal. First, some would argue that if the exemption results in no net increase in total cost to the carriers (LGA access fees just offset PFC’s and ad valorem charges), there will little or no change in carrier behavior. But, the purpose of congestion fees or auctions is not to punish airlines; it is instead to encourage a new set of behavior. Changing the relative costs of flights by different size aircraft, fees (whether from pricing or auctions) will encourage more efficient use of the facility during congested periods of time.
The effect of relative price changes is illustrated in Exhibit 1 below. The top part of the exhibit shows that a smaller 50 seat aircraft has a higher operating margin than the larger 150-seat operation. However, once a $1,000 congestion fee is imposed and carriers are exempted from certain user fees, the relative profitability of the flights is reversed. There is no change in the operating margin for the 150-seat operation but the 50 seat flight is considerably less attractive. Clearly, at the margin, carriers would have incentives to upgauge and/or change their schedules as a result of higher peak fees even if they were exempted from some current user fees.
17 A gate would be defined as the ramp, gate, bridge, holding room, access to baggage claim, ticket
counter, back office room; RON on the gate.

63
Exhibit 1
Seats SeatsAssumptions 50 150
Load Factor 0.75 0.75Miles 500 500Pasengers 37.5 112.5
Fare 115 71Other Revenue 5% per Pax 5.75 3.55
Base Case: Current User and Landing FeesTotal Revenue $4,528 $8,387Operating Cost (Excluding Fees to be Exempted) -$3,384 -$6,483Fees to be ExemptedPFC at $3 -$113 -$338Landing Fee -$118 -$428Ad valorem tax: 3% of Total Revenue -$136 -$252Total Fees to be Exempted -$366 -$1,017
Operating Profit $778 $887
Operating Margin 17% 11%
Effect of Charging $1000 Congestion Fee and Exempting Carrier from PFC, Old Landing Fee and 3% of Ad Valorem Tax)
Total Revenue $4,528 $8,387Operating Cost (Excluding Congestion Fee) -$3,384 -$6,483Congestion Fee -$1,000 -$1,000
Operating Profit $144 $904
Operating Margin 3% 11%
EFFECT OF $1000 CONGESTION FEE ON RELATIVE PROFITABILITY OF 50SEAT VS. 150 AIRCRAFT
The second argument against exempting carriers from certain user fees in exchange for the imposition of congestion prices (via pricing or auction) is political. Changing how user fees work and to whom they apply is complicated and opening up the subject may result in unintended political consequences. But, on the merits, parties that currently benefit from user fees should be indifferent. The airport would receive at least the same amount of revenues as it does now from both landing fees and PFC’s; to do otherwise would require opening up bond documents and other contracts that would be cumbersome and costly in terms of time. As noted above, the airport sponsor could receive a Federal guarantee for the expected exempted user fee receipts. Similarly, the FAA budget for ATC and AIP funding could also be made whole from the congestion fee receipts. There would be no effect on the amount of monies collected, nor would it be necessary to disturb how Congress appropriates funds to the FAA. Airlines would clearly benefit in two ways: first, the total fees collected from airlines would be lower if they were made exempt from certain user fees at LGA (or other congested facilities). Second, they would have the freedom to realize a net improvement in profitability (relative to the
64
case where congestion fees are imposed without offsetting other fees) by re-optimizing their schedules.18 4.2.4. EXPECTATIONS ABOUT CONGESTION PRICING AT LAGUARDIA There is substantial literature on airport congestion pricing but very little direct experience in the United States and only limited experience overseas with actual applications. Following are our a priori expectations about possible airline behavior if congestion pricing were implemented at LaGuardia:
Levels of Fees to be Effective: In Appendix 4B, we have published our expected levels of fees to reduce operations at LaGuardia by approximately 200 per day. The analysis is based upon the November 2000 schedule when there was a substantial increase in scheduled operations due to the change in regulations under Air 21. The analysis takes account of the network effects of changes in schedule (revenues behind and beyond LaGuardia) by utilizing a detailed model of commercial air carrier network profitability (taking account of connection traffic across each airline’s entire network).19 In our analysis of the November 2000 schedule, the peak fee was $1800, with shoulder fees set at $1200 and off-peak prices set at $275 per operation. As we note in Appendix 4B, the peak price seemed to be slightly high and would have needed to be readjusted if more time were available to continue the analysis.
Smaller Commercial Aircraft Would be Disproportionately Affected:
LaGuardia has historically had a substantial proportion of its operations conducted by smaller commercial aircraft (under 50 seats). Because all aircraft consume approximately the same amount of runway capacity, when that capacity becomes scarce, economic theory suggests that all users should pay the same price for access regardless of the size of aircraft. With fewer seats, smaller aircraft would be less able to pay congestion fees than larger aircraft because prices per seat would have to increase due to the elimination of the weight component in the landing fees as well as the overall increases in fees needed to manage congestion.
18 In the preceding, we are assuming that the net receipts from the congestion fees will exceed
those from the exempted fees. This will almost certainly be the case for LGA but deserves more study. 19 If a congestion fee were assessed, it would affect the profitability of one or more of an airline’s flight segments at the airport. A carrier might then reasonably ask whether it would be better off canceling one or more of its flights, especially those that show negative profits as a result of the congestion fee. To answer this question, the carrier would be interested in how much network revenue and profit it would lose in the event that the flight were cancelled. That is, it would be interested in revenue lost net of any passengers it might be able to keep on its network by attracting them to other flights not cancelled. All carriers would go through a similar process and make their evaluation on a network basis. Note that this sort of “opportunity cost” procedure may well result in the cancellation of a flight that appears profitable on a simple own-flight accounting basis. Conversely, a flight that appears to lose money on an accounting basis may well be profitable when evaluated on a network opportunity cost basis. Our model assumes that carriers cancel the least credible flights first (measured by percentage change in network profit), which results in a reallocation of passengers among the remaining flights. The cancellation process ends when there are no longer any flights that are unprofitable net of the new congestion fee.

65
Shorter-Haul Operations Would be Disproportionately Affected: In
theory, the elasticity of demand exhibited by shorter-haul operators should be higher and therefore more responsive to congestion fees. The reasoning is that there are better substitutes for air transportation for short trips than for longer ones. If prices for short-haul air transportation increase, the net advantages to consumers of flying are likely to fall.
General Aviation Operators may be Less Responsive to Congestion Fees
at LaGuardia: Most operations by general aviation at LaGuardia are by turbojet or large turboprop aircraft, with very few operations conducted by smaller piston aircraft. The cost per occupied seat is high and can easily run into the thousands of dollars. Even very high congestion fees (e.g., $1800 per operation) may be cost justified for high end users.
Carriers Would Reduce Frequency in Some Markets: Most studies
suggest that carriers gain both market-share and fare premiums by offering high frequency service, especially in business markets. Because demand at LaGuardia includes a substantial portion of business origin-destination traffic, many markets exhibit very high frequency (e.g., three carriers offering shuttle operations to both Washington and Boston). Congestion fees would be expected to make some of these operations less attractive.
Carriers Would Choose to Exit Some Low Frequency Markets: To have a
viable pattern of service in most markets, the carriers would want to have three or four daily frequencies. This provides the carrier with the opportunity to utilize aircraft efficiently and to address desirable time channels during the day. When some of these operations (and especially peak operations) are no longer economically viable because of congestion fees, the carrier may choose to exit some markets entirely in order to redeploy their flight assets in markets where they can be better utilized.
Carriers Will Also Exit Markets When They Lose the Opportunity to
Hoard Slots: We would expect carriers to exit markets currently operated using slots they are holding for strategic purposes. In general, carriers utilize relatively small aircraft in such markets and so would be highly sensitive to the congestion fees.
Carriers Would Up-gauge, Especially in Markets Where They Reduce
Frequency: In instances where a carrier reduces frequency, it may try to maintain its market presence by increasing aircraft size. Its success will depend, in part, upon whether its frequency levels rise or fall relative to competition. However, it is important to note that any specific up-gauging decisions made in the game may not accurately reflect what we would expect in a real-world situation because such decisions typically would require access to internal aircraft scheduling models to ensure that up-gauging would work

66
logistically. In addition, because during the game the perimeter rule was assumed to remain in place, carriers would not have the opportunity to choose to fly longer distances with larger aircraft as one means to offset the effects of congestion fees. For example, in the absence of the perimeter rule, we might expect carriers to increase frequencies to the West Coast and to the Caribbean, but these opportunities are not available at LaGuardia.
Operators Would Reschedule Some of Their Flights To Miss Peak
Periods: We would expect all operators to move some flights to earlier or later hours subject to lower fees after congestion pricing is imposed. Particularly early in the morning and in the early evening, when congestion fees remain low, we would expect operators to bunch their flights as close as possible to the peak hour in order to maintain the viability of service they might otherwise delete.
It is important to note that individual carrier decisions to either exit markets completely or to reduce flights (and possibly upgauge) may have dramatically different impacts on overall social welfare. In general, market exits are more likely to have a net negative impact (depending on the level of offset due to the associated decreased delay at LGA), while reductions in flights accompanied by upgauging may be more likely to yield a net positive impact. Obviously, these societal impacts (which if measured properly would account for the social cost of delay as well as any economic losses due to carrier market power) may not coincide with the private profit-maximizing decisions that carriers could make regarding entry, exit and/or equipment changes.
Combining Congestion Pricing and Auctions
There may be important advantages in having both auctions and congestion pricing at LaGuardia. A portion of the airport capacity could be slot controlled and auctioned off and operators with slots would be guaranteed access to the facility. The remaining increment of capacity would be available in a spot market, with congestion fees varying to keep the level of operations within target levels set by FAA. The advantage of such a combination is that operators would be able to lock in a minimum required level of activity via the auction and then could experiment with alternative schedules by buying short-term (two-month) access by paying congestion prices [Fan, 2004]. However, if congestion prices are not set appropriately, then the inefficient delay consequences could affect both spot market and auction buyers. Other difficult coordination issues also would have to addressed, e.g., whether and how to co-mingle auctioned slots with spot market slots over the course of a day, whether and how to place limits on a single carrier's combination of spot and auctioned slots, etc.

67
4.2.5. REVIEW OF CONGESTION PRICING SIMULATION A congestion pricing simulation was conducted by NEXTOR at George Mason University on the afternoon of November 4th and morning of November 5th 2004. The simulation appeared to be very well organized and participants, including the airlines, appeared to be changing their operations in a manner consistent with the economic incentives embedded in the congestion prices. A great deal of useful information was collected during the two rounds of play. Following is a brief description of the simulation.
Format
An independent Pricing Board set prices to reach an operational goal established by FAA (approximately 1,250 operations per day). This panel was employed in part because neither the airport sponsor nor the FAA wanted to play that role.
There were no set asides or distinctions for small communities or commuter
aircraft.
There were no limitations on when or what operators might fly.
The perimeter rule remained in force.
The passenger bill of rights (described elsewhere) was suspended for the congestion pricing game.
Schedule
The schedule contained 1,428 operations per day with an average expected
delay per operation of 49.3 minutes.
The schedule was constructed from the November 2004 OAG with additions created by GMU.
Participants
Airlines: Delta, American, Spirit, and a team playing USA Airlines as well as
another team playing all other carriers
A team representing general aviation
The FAA
The Port Authority of New York and New Jersey

68
Number of Price Adjustments
There were two rounds of airline reactions to new prices. Each round took
approximately three to four hours to conduct, with the carrier and general aviation teams adjusting their schedules according to changes in prices set by the Pricing Board. Exhibit 2 shows the schedule of prices for each round.
Exhibit 2
At LaGuardia, the revenue neutral fee per operation fee in 2004 is estimated to be approximately $275. This is the minimum fee in the pricing schedules. Higher fees were designed to address both peak hours and shoulder hours during the day. The Round 1 prices were presented to the players on the afternoon of November 4th. The airlines took the remaining part of the afternoon to adjust their schedules. The following morning, the second round of prices were presented and a new rescheduling effort was undertaken. Net changes in operations are also shown in Exhibit 2.
Beginning of Hour
Base Schedule Round 1
Round 1 Schedule Round 2
Round 2 Schedule
0430 $275 1 $275 10530 27 $275 42 $275 420630 75 $600 67 $600 670730 93 $800 66 $800 760830 94 $800 87 $1,000 730930 90 $800 71 $1,000 671030 84 $600 97 $1,000 961130 84 $600 92 $1,000 711230 97 $800 61 $800 811330 86 $800 63 $800 801430 84 $600 85 $1,000 711530 83 $600 101 $1,000 1011630 85 $800 62 $1,200 541730 89 $800 86 $1,200 821830 92 $800 94 $1,200 811930 91 $800 73 $800 852030 81 $600 80 $600 792130 58 $600 36 $600 392230 25 $275 38 $275 382330 10 $275 8 $275 8All Other 0 $275 0 $275 0Total Operations 1428 1310 1292Fees are in-lieu of existing departure fees
CONGESTION PRICING at LGAAll Fees Are Per Operation

69
Distribution of Excess Funds Participants were told that funds collected from the new fees would be distributed in the following order:
To recompense the Port Authority for their existing departure fees; the U.S. Government would guarantee existing bond holders that sufficient funds would be available to pay for the runway cost area, as defined in the bond documents.
To offset the cost of the Port Authority runway/airspace expansion programs
at LaGuardia or other Port Authority airports.
To offset the cost of other regional runway/airspace expansions.
To be applied to the airport improvement program. The Port Authority and FAA held negotiations on the distribution of these funds. The results of these negotiations are described elsewhere.
Results of the Simulation
Airline participants appeared to be making reasonable scheduling decisions based on their business cases and the economics of congestion pricing. But two rounds of pricing are probably inadequate for some airlines to make final decisions on markets, or for the market itself to settle down completely. For example, after several rounds of back and forth, more airlines may have decided to exit some markets after having more information on how much higher prices would go and on the competitive landscape they were facing. Nor did carriers have sufficient time to up-gauge very much of their fleets, or change their schedules to optimize aircraft utilization. Thus, the results of the simulation are not predictive, but the behavior observed is suggestive of what might happen in the real world. As can be seen in Exhibit 3, the relatively modest fees in Round 1 had a measurable effect on demand. The fees ranged from $275 in off-peak periods (reflecting the revenue neutral fee for the airport) to between $600 and $800 per operation. It is important to note that these fees are in lieu of the current weight-based landing fees paid by operators. Thus, these fees actually represent a net decline in costs for some larger aircraft at certain times of the day. Two hundred twenty-eight of the 428 flights in the schedule were deleted (16 percent). There were 110 added flights: 22 by general aviation operators, 70 by incumbents and 18 by new entrant airlines. The actions taken by operators in Round 1 are summarized in Exhibit 4.
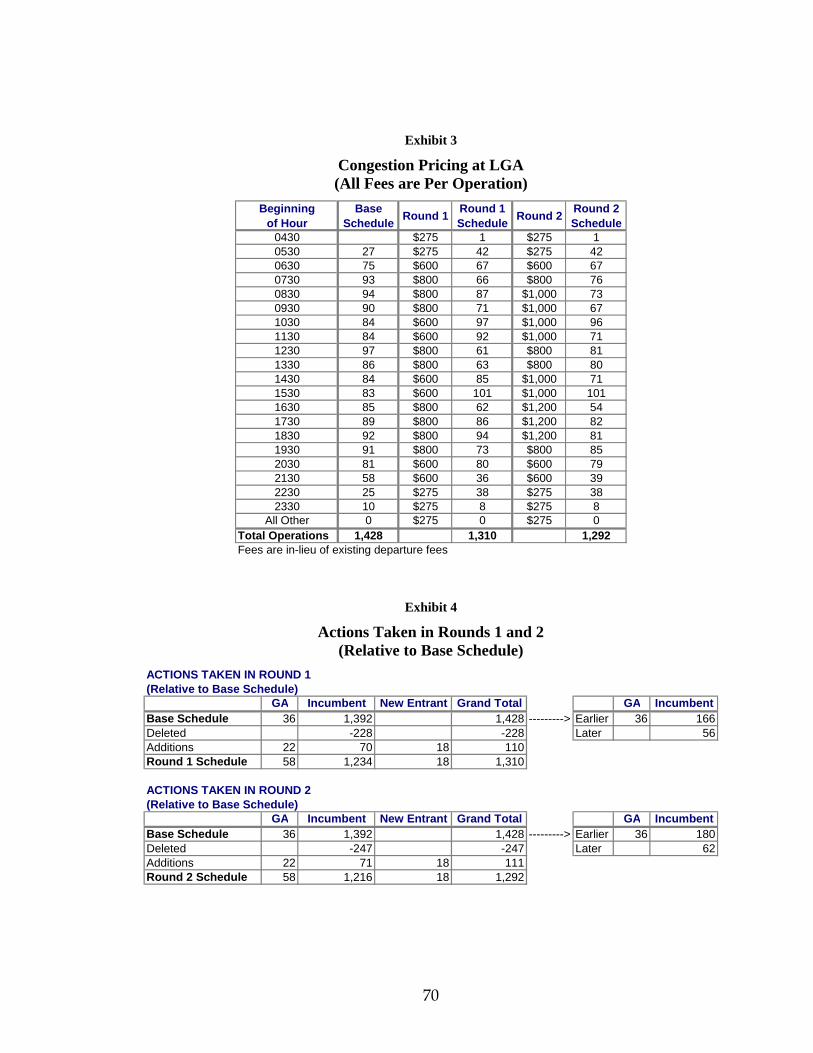
70
GA Incumbent New Entrant Grand Total GA IncumbentBase Schedule 36 1,392 1,428 ---------> Earlier 36 166Deleted -228 -228 Later 56Additions 22 70 18 110Round 1 Schedule 58 1,234 18 1,310
GA Incumbent New Entrant Grand Total GA IncumbentBase Schedule 36 1,392 1,428 ---------> Earlier 36 180Deleted -247 -247 Later 62Additions 22 71 18 111Round 2 Schedule 58 1,216 18 1,292
ACTIONS TAKEN IN ROUND 2
ACTIONS TAKEN IN ROUND 1(Relative to Base Schedule)
(Relative to Base Schedule)
Exhibit 3 Congestion Pricing at LGA (All Fees are Per Operation)
Exhibit 4
Actions Taken in Rounds 1 and 2 (Relative to Base Schedule)
Beginningof Hour
BaseSchedule Round 1 Round 1
Schedule Round 2 Round 2Schedule
0430 $275 1 $275 10530 27 $275 42 $275 420630 75 $600 67 $600 670730 93 $800 66 $800 760830 94 $800 87 $1,000 730930 90 $800 71 $1,000 671030 84 $600 97 $1,000 961130 84 $600 92 $1,000 711230 97 $800 61 $800 811330 86 $800 63 $800 801430 84 $600 85 $1,000 711530 83 $600 101 $1,000 1011630 85 $800 62 $1,200 541730 89 $800 86 $1,200 821830 92 $800 94 $1,200 811930 91 $800 73 $800 852030 81 $600 80 $600 792130 58 $600 36 $600 392230 25 $275 38 $275 382330 10 $275 8 $275 8
All Other 0 $275 0 $275 0Total Operations 1,428 1,310 1,292Fees are in-lieu of existing departure fees

71
The same exhibit also shows the actions by carriers in the second round, when fees per operation increased substantially to between $1,000 and $1,200 in the shoulder and peak hours. Operations fell to 1,292. Two hundred and forty-seven flights were deleted by incumbent carriers, 19 more than in Round 1. There were no other deletions or additions in the second round. In comparison to the relatively large responses to the Round 1 prices, this limited response in Round 2 may suggest that reactions to price changes might become less elastic over time as carriers. This could be due to a number of factors, e.g., carrier familiarity with the particular pricing mechanism, willingness to consider more long-run factors over time, etc. It also suggests the potential importance of setting the initial pricing levels as efficiently as possible. The same exhibit also showed how operators altered the timing of their flights in response to the congestion fees. In the first round, general aviation operators changed all of their flights to earlier hours in the day, while incumbent operators moved to both earlier and later hours of the day to avoid congestion fees. This same pattern was repeated in the second round. Exhibit 5 shows the average fees paid by user groups in the baseline schedule and the two rounds of congestion pricing. Paired with the results in Exhibit 4, this exhibit suggests the following:
GA Behavior: It is apparent that the players representing general aviation updated their schedule to reflect new industry developments, including substantial growth by air taxi operators in the future. No general aviation flights were cancelled during either round, and there was substantial entry despite average increases in access fees at LaGuardia ranging from 336 to 432 percent.
Incumbent Scheduled Operators: In the first round, these operators reduced
their operations by 11.3 percent (158 of 1,392) in response to an average increase in fees of 147 percent. In the second round, they reduced operations by 12.6 percent (176 of 1,392) in response to a 221 percent increase in average fees.
New Entrants: Most of the new entrant’s scheduled operations are due to
one carrier (JetBlue) and the team playing for the new entrant carriers was apparently updating the schedule to reflect recent JetBlue entry at LaGuardia. It is interesting to note that in the second round, the new entrants paid the highest average fee.

72
Exhibit 5
Average Fee by User Group
In our view, the behavior in the two rounds for incumbent air carriers is probably fairly representative of what might happen with the imposition of congestion fees. The behavior of general aviation operators is probably not representative. While these operators would likely exhibit inelastic demand, we would expect some reductions in operations at the fee levels in the game. It is difficult to gauge whether the behavior of new entrants is representative, but it should be noted that very high access fees might be inconsistent with most low cost carrier business models—the most likely new entrants among scheduled operators.
Effect on Smaller Aircraft In both rounds of the game, smaller commercial aircraft (new entrants and scheduled incumbent carriers) showed net declines in operations by aircraft fewer than 100 seats and net increases in aircraft larger than 100 seats. In both rounds, the largest reductions in operations (over 35 percent) were by aircraft between 50 and 99 seats, for the most part large turboprops and regional jets. In the under 50-seat category, there was an offsetting increase in general aviation operations in both Rounds 1 and 2. In the second round, the GA increase exactly offsets the reduction in operations by scheduled operators.
LGAHOUR2 Baseline Round 1 Round 2 Round 1 Round 2 Baseline Round 1 Round 20430 275 2750530 275 275 275 275 374 275 2750630 20 600 600 287 600 6000730 110 800 800 235 800 8000830 200 800 1000 800 1000 262 800 10000930 200 800 1000 800 1000 271 800 10001030 200 600 1000 600 1000 285 600 10001130 200 600 1000 600 1000 269 600 10001230 200 800 800 269 800 8001330 200 800 800 277 800 8001430 200 600 1000 600 1000 258 600 10001530 200 600 1000 600 1000 268 600 10001630 200 800 1200 800 1200 262 800 12001730 200 800 1200 800 1200 293 800 12001830 200 800 1200 800 1200 293 800 12001930 200 800 800 800 800 261 800 8002030 110 600 600 600 600 259 600 6002130 20 600 600 600 299 600 6002230 20 275 275 364 275 2752330 20 424 275 275
Grand Total 150 654 799 671 915 275 680 883Percent Increase 336% 432% NA NA 147% 221%
New Entrant Scheduled Incumbent ScheduledGA

73
If we exclude the behavior of general aviation, then we find a more reasonable pattern for aircraft under 50 seats. The reduction in operations in this seat category still trails that for regional jets and larger turboprops (50 – 99 seats). These changes in operations by user group and seat category are summarized in Exhibit 6.
Exhibit 6
Change in Operations by User Groups and Seat Size (Relative to Base Schedule)
Effects on Shorter-Haul Markets The results from the game indicate that shorter-haul markets (except those under 100 miles) were not disadvantaged by congestion pricing. On an a priori basis, we would assume that very short haul operations would exhibit higher elasticities of demand and a higher percentage fare increase than longer haul flights. However, Exhibit 7 shows that the cumulative percentage of flights deleted by mileage block does not increase in either Round 1 or 2. Over 30 percent of the very short haul (less than 100 mile) flights are deleted. Thereafter, the cumulative deletions hover around 17 to 20 percent showing a relatively constant rate of deletion over the mileage blocks at LaGuardia.
>100 Seats <50 Seats 50-99 SeatsGA NA 22 NANew Entrant Scheduled 18 NA NAIncumbent Scheduled 30 -14 -174
Round 1 Total 48 8 -174Round 1 Percent 6.3% 4.3% -35.8%
GA NA 22 NANew Entrant Scheduled 18 NA NAIncumbent Scheduled 24 -22 -178
Round 2 Total 42 0 -178Round 2 Percent 5.5% 0.0% -36.6%
Incumbent Scheduled + New Entrant Scheduled OnlyRound 1 Percent 6.3% -9.5% -35.8%Round 2 Percent 5.5% -14.9% -36.6%
Aircraft Size
Round 1
Round 2

74
Exhibit 7
Cumulative Percent of Flights Deleted by Mileage Block Due to Pricing
Effects on General Aviation As indicated in our earlier discussion above, general aviation was not affected by congestion pricing during the game. Players representing general aviation adjusted the baseline schedule to reflect forecast growth in air traffic operations and deleted no flights. While we would expect general aviation operators to exhibit relatively low elasticities of demand, we would also expect some reductions in operations resulting from the relatively high fees posited in the game.
Scheduled Carrier Responses Scheduled service reductions occurred in both large and small markets. In large markets with very high frequency levels, carriers tended to reduce the number of flights per day, although the responses varied considerably for different carriers. In smaller markets, carriers tended to delete flights, and in several cases exited markets entirely. This is consistent with our a priori expectations that carriers would tend to avoid non-economic levels of flying for both logistical and marketing reasons. However, there remain a number of cities that may have non-economic levels of service (1 or 2 flights per day). In part, this may reflect carriers’ interest in remaining in markets until they know fully what the congestion fees will be and what their competitors will do in those markets.
0.0%
5.0%
10.0%
15.0%
20.0%
25.0%
30.0%
35.0%
0 200 400 600 800 1000 1200 1400 1600 1800
Mileage Block
Cum
ulat
ive
Perc
ent o
f Flig
hts
Round 1 Round 2

75
Some of the players in the game were fairly aggressive by actually entering the hub cities of rivals and offsetting these increased frequencies by making small cutbacks in cities where they already had a large presence.
Other players took a different tack by exiting many smaller markets in Round 1 while maintaining or slightly increasing service at their fortress hubs. For one player, this was accompanied by a companion strategy of moving into several entirely new markets. Overall, ten cities lost all service to LaGuardia, while four cities with no previous operations gained service. Of the ten who lost service, four currently have alternate service to Newark (as of November 2004). In general, the changes in scheduled operations probably do not fully reflect a reduction in hoarding that we would have expected. In part, this was because the game was posited to take place in 2007 after projected declines in the number of relatively small markets operated with small aircraft were already excluded from the base schedule.
Carrier Rescheduling to Miss Peak Time Periods
Exhibit 8 shows that all operators were responsive to the imposition of peak load fees. In Round 1, there were significant changes in operating times (either earlier or later) during both shoulder and peak hours. The same pattern occurred in Round 2. A comparison between the two rounds in Exhibit 10 shows that in the second round operators were responsive to the change in the rate schedule, with additional peak periods in both the morning and late afternoon/evening hours driving changes in operating times.

76
Exhibit 8 Changes in Flight Times Due to Higher Fees
(Relative to the Base Schedule)
Round 1 Round 1 Round 2 Round 2Per Operation Fee Earlier or Later Per Operation Fee Earlier or Later
0530 $275 0 $275 00630 $600 13 $600 120730 $800 20 $800 200830 $800 11 $1,000 230930 $800 20 $1,000 181030 $600 11 $1,000 101130 $600 12 $1,000 171230 $800 32 $800 271330 $800 14 $800 111430 $600 12 $1,000 161530 $600 8 $1,000 91630 $800 22 $1,200 261730 $800 7 $1,200 81830 $800 12 $1,200 171930 $800 23 $800 232030 $600 13 $600 132130 $600 16 $600 162230 $275 9 $275 92330 $275 3 $275 3
258 278
LGAHOUR2
Grand Total

77
5. DISCUSSION OF RELATED ISSUES
5.1. SLOT PROPERTY RIGHTS
FAR Part 93, Section 213 paragraph (a) (2) defines “slot” as “the operational authority to conduct one IFR landing or takeoff operation each day during a specific hour or 30 minute period at one of the High Density Traffic Airports, as specified in the subpart K of this part.” Part 93 Section 213 is applicable to HDR airports. In the sense that slots have been in use in the U.S. for many years there would seem to be little need to review the associated property rights. On the other hand, if a market mechanism is implemented in which slot leases are bought and sold then it would seem appropriate to review the associated property rights and to perhaps make more explicit the rights that have, de facto, been associated with slot ownership under HDR legislation. We view this as a worthwhile pursuit. On the other hand, in order to limit the complexity of the policy change, at least initially, the rights previously associated with slots will be the same as those associated with slots under a market regime. Specifically,
slot ownership provides the right to publish a scheduled operation (arrival or departure) in a particular time window; in the specific auction design given in this report, an airline would obtain the right to publish a scheduled arrival during a specific 15 minute time window and a subsequent departure (within 90 minutes of scheduled arrival time);
further, the FAA air traffic management system would provide the normal
services and priorities associated with that scheduled operation; we should note that on a practical basis, on a given day, an airline has the right to conduct its operation any time after its scheduled time.
Airlines will retain the right to trade or sub-lease slot ownership on a short term
basis, or to release its ownership to the FAA for secondary market transactions. A discussion of secondary markets is presented in the next section. Some of the issues related to transfer of slot property rights during sub-lease are as follows. When the transfer takes place from one scheduled carrier (or airline) to another, the latter assumes the exact same rights to publish scheduled operation during the specified time window associated with the slot and also to conduct the operation any time after it is scheduled. We note that the sub-lease of a slot from a scheduled to non-scheduled operator could generate certain problems in the sense that, de facto, the scheduled operator has the right to conduct an operation any time after it is scheduled. This right would seem somewhat problematic when transferred to a non-scheduled operator in that there would not necessarily be any incentive for the non-scheduled operator to conduct an operation close to the slot time, e.g. a non-scheduled operator, in concept, could sub-lease a 1 PM slot and then conduct an operation at 4:30 PM. We propose that, when a non-scheduled operator takes control of a sub-leased slot it obtains the right to conduct an operation in

78
the specific time window of the slot (subject to a possible delay imposed by the air traffic control system).
5.2. OPERATION OF SECONDARY MARKETS
In allocation methods where long-term slot leases are allocated to operators (or other slot holders), a secondary market (or exchange) will reduce the financial risk of investing in long-term slot leases and will maintain ongoing liquidity and mobility of slots between periodic primary allocations. The key difference between the primary allocation market and a secondary market is that the secondary market operates more frequently, being designed to support ad-hoc exchanges of leases; of course, any slot owner may put leases up for sale on the secondary market whereas only the FAA sources leases in the primary allocation.
To maintain efficiency in the use of slots, it is important that secondary trading
decisions be made for reasons of profitability rather than for strategic reasons such as creating barriers to entry for a direct competitor. For this reason, in contrast to the current European practice of using brokers, we recommend a blind exchange operated by the FAA or other disinterested intermediary. A blind exchange conceals the identity of the seller. A seller can make a slot or set of slots available, with a reservation price, to the intermediary, who will then periodically solicit bids and clear the market.
The secondary market will operate with the same fundamental mechanism as the
proposed auction design. However, while the primary auction design specifies an annual auction cycle, the secondary market exchange will occur on a more frequent basis, e.g. monthly or quarterly. It is anticipated that fewer slots will be traded in the secondary market and that bidders’ processes for valuation of those slots will be simpler than that for the primary auction. Therefore, less time should be required for such transactions.
Under our design, the secondary market will look essentially identical to the
primary market from the buyers’ perspective. This has many advantages including simplifying the slot buying process for buyers, simplifying the auction and software design task and allowing the initial operational period of the secondary market to provide a test-bed for the later operation of the primary market.
Because slots are leased on a periodic basis and the secondary market handles ad-
hoc transactions, slots offered for sale in a secondary market will have varying effective dates and varying durations. Slots put up for sale on the secondary market must have an effective date of transfer specified, which is the date on which ownership of the slot is to change. Remaining lease durations can range from one day to the full five years of the originally allocated lease. Bidder valuations would, of course, take into account the offered remaining lease duration.

79
Despite the enforced anonymity in the secondary market, some slot lease attributes might still be used to infer the identity of a seller. For example, if an 11:00AM slot in March of the third year of its lease appears in the market, a potential bidder might be able to identify the seller as an operator who held an 11:00AM slot in its third year and who discontinued service requiring that slot in February or March.
In comparison with the potential for a wide variety of lease types in the secondary
market, in the primary allocation market all offered slots will have the same effective (lease start) date and will have the same standard duration (proposed to be 5 years). Indeed, further standardization of the lease product in a secondary market will provide two very important benefits:
It becomes more difficult to identify the seller of the lease, which, as
described above is highly desirable.
The number of different products to be auctioned is reduced simplifying the auction design and improving the ability of buyers to design bidding strategies.
The variations in effective dates and durations pose a challenge relative to
creating a secondary market that is nearly identical to the primary market. We address the issue of variations in effective date as follows.
All slot leases offered in a given secondary market execution, will have an
effective start date equal to the date of the next time at which the secondary market will clear, for instance next month or next quarter, depending on the frequency of the secondary market.
The government will work with the buyers and sellers after the fact if the
seller wished to release the lease earlier or later than the standard start date. For example, if the seller wished to release the lease earlier then the stated effective date (next month or next quarter), then the government could waive the monthly obligation or if the seller wished to release the lease a month later the government could allow a temporary increase in the level of scheduled operations.
By appropriate government lease augmentation, uniform duration could be
offered to the buyers on the secondary market. We propose the following mechanism to extend leases offered in the secondary market:
All slot leases will have the same duration (between 4 and 5 years) so that
the lease terminates on the standard termination date. In order to offer a standard termination date, the government will add an appropriate number of years to the end of the lease. Because adding years to a lease will increase its value, the revenue from the secondary market will be divided between the seller and the primary auction revenue fund. The seller will get a proportion of the revenue exactly equal to the selling price prorated by the seller’s lease’s remaining days of lease duration divided by the remaining days of duration of the lease as it appears on the sub-lease. As an

80
example, if an operator wishes to sell a lease with 412 days remaining on it, the lease will appear on the sub-lease as having 1507 days remaining (412 + (3 * 365)), and the selling operator will receive 412 / 1507 times the selling price while the remainder is contributed to the primary auction revenue fund. This process will result in all listings on the exchange have remaining ease periods between 4 and 5 years remaining duration.
Sellers in the secondary market will not be permitted to bid on leases they
are selling. They will, however, be able to specify a reserve price so that a bidder must bid more than the reserve price for the transaction to occur. This constraint will prevent leaseholders from using the exchange mechanism to uncompetitively extend their leases.
We note that his approach to a secondary market design was based on the goals of
simplicity and compatibility with the primary market. Other approaches are certainly possible and worthy of consideration. There is a growing body of research and also practical experience with so-called combinatorial exchanges in which sellers offer multi-product combinations for sale and buyers wish to buy similar multi-product combinations, see [Parkes et al., 2001] and [Parkes et al., 2005.] For example the owner of 3 slots might wish to sell only 3 slots (and not 1 or 2 out of the 3) and might also specify a minimum price for the set of 3 (and not for each one individually). In our secondary market design, buyers specify a specific combination of slots that they desire but sellers essentially put individual slots on the market, leaving open the possibility of selling one but not all of a combined set put up for sale. A combinatorial exchange would also allow a seller to make the availability of a block of slots contingent on acquiring one or more other slots in the exchange.
A combinatorial exchange design could also be extended to include other airport
resources. For example, a seller could offer for sale the combination of a set of slots and a set of gate leases. A well-designed combinatorial exchange would not require that each seller’s offer be matched to a single buyer’s offer. For example, seller A might offer 3 gate leases and 10 slots and seller B 8 slots. These offers might be satisfied by Buyer C’s offer for 2 gate leases and 9 slots and buyer D’s offer for 1 gate lease and 6 slots and buyer E’s offer for 3 slots. Such combinatorial exchanges typically provide the users with expressive languages that allow them to specify a variety of complex conditions on the combination of products they wish to buy or sell. While we recommend proceeding with a simpler design, at least initially, the use of more complex combinatorial exchanges can offer substantial added advantages in market efficiency.
5.3. CONSTRAINTS AND RESOURCE ALLOCATION AT LGA
In this section we discuss a number of constraints that exist at LGA airport that impact the manner in which airlines can adjust operations in response to congestion management initiatives. We also discuss challenges related to the ability of the airlines and the Port Authority to reallocate resources to accommodate schedule changes.

81
Constraints include primarily physical and logistical constraints on the infrastructure of the airport itself (Section 5.3.1), as well as administrative and financial constraints that hinder the transference of gates and related resources (Section 5.3.2).
5.3.1. PHYSICAL CONSTRAINTS Aircraft Size and Compatibility with Gates
The terminal facilities at LaGuardia are divided among four buildings: from east
to west they are the Delta terminal, the U.S. Airways terminal, the Central Terminal Building (CTB), and the Marine Air Terminal (MAT, housing the Delta Shuttle operation). Each has a different number and configuration of gates. In some cases, the apron area or jet bridge associated with certain gates limits the size of aircraft that can be parked at the gate. It is also the case that while some aircraft sizes are possible when considering certain gates independently, the fact that they are adjacent to other gates makes certain combinations of adjacent aircraft impossible. Finally, additional requirements are imposed on the gates farthest into the alleyways between concourses, particularly the need to be towed in and out because of issues with maneuverability and jet wash under power.
It should be noted that these constraints affect the congestion management policy
that the FAA would want to impose, in order to prevent unacceptable conditions to passengers. They do not necessarily impact airline scheduling practices in the same way. In discussions regarding LGA, representatives of several airlines currently operating at the airport unanimously asserted that their airlines would not bid for slots (assuming an auction for slot allocation) unless the airline knew that gates and other ground facilities were available. This contrasts with the situation following the enactment of the AIR-21 Act, when airlines routinely scheduled operations into LGA without having ground facilities available.
Multiple Terminals and Split Operations
Currently, and for the most part, any individual carrier operating out of LGA does
so from a consolidated set of gates in one or more terminal buildings. The one notable exception is that the Delta Shuttle and Delta mainline operations are on opposite ends of the airport. There is also some difficulty with code-share passengers on United (CTB), US Airways (US Airways Terminal), and Air Canada (CTB). Each terminal building is effectively isolated from the rest in terms of passenger and baggage conveyance, etc. Thus, any gate re-allocation that required a carrier to run a split operation out of more than one building would be very difficult to accommodate. From the perspective of the outbound passenger, since the parking facilities are also physically disparate and clustered around terminal buildings, it would be very frustrating to park near one building only to find out that the assigned gate was in a different building. Round-trip passengers might find themselves departing from one building and returning to a different one.

82
Some airlines also use hardstands for regional jets instead of gates and jet bridges, and in some cases the assigned hardstand areas are separate from the airline’s gates. Hardstands always cause logistical issues with passenger and baggage conveyance, but these are made more difficult when physical separation and intervening active taxiways are in play, which is the case at LaGuardia.
Security Screening and Transfer Passengers
In the Central Terminal Building, Continental Airlines operates out of both concourses A and B, and American Airlines operates on C and D. United Airlines operates on concourse C, and it code-shares some flights with Air Canada, which operates on concourse A. In all cases, transfer passengers from one concourse to the other have to exit and re-enter through a security screening area. LaGuardia serves primarily O-D traffic, so the fraction of total passengers facing this obstacle is small, but it is an ordeal nonetheless.
Remain Overnight (RON) Parking and Taxiway/Runway Conflicts
In addition to parking at the gates, LGA also has 21 remain-overnight (RON) parking spaces for aircraft. These are located primarily in four banks, three of which are immediately adjacent to hangars or terminals owned by a single carrier and thus serve aircraft from that carrier almost exclusively. The fourth is on the west end of the airport, past both runways and a series of taxiways. The heavy demand for RON spaces is evidenced by the fact that all of them are used every day, despite extreme difficulties (delays up to an hour) crossing taxiways and runway 22 in the morning to get aircraft to gates during the morning push. The sum of the gates (approximately 75, depending on how they are configured) and the RON parking spots effectively limits the number of possible outbound flights during the morning push.
Baggage Handling
None of the baggage handling facilities within LGA are consolidated. Within the
CTB, several distinct baggage makeup and baggage claim areas exist, all served from different access points. The Marine Air Terminal has very limited baggage facilities. Thus, distributions of gate assignments that are drastically at odds with baggage partitions would be difficult. Additionally, the MAT effectively can only serve shuttle operations with only carry-on baggage.
Communications Infrastructure
Having been built before modern methods of computer connectivity were in place, the computer lines used by each airline at their gates are hardwired, and none of them are functionally compatible. Coupled with information security issues, this creates a transaction cost that would affect any transferal of gates between carriers.

83
Old-Fashioned and Capacitated Terminal Design
The Central Terminal Building has narrow corridors, small seating areas, very limited post-security concessions, and in-concourse security screening areas that are really inappropriate for the modern realities of airport operations. These circumstances do not necessarily translate directly into operational constraints on the parts of the carriers. However, the Port Authority has a number of major facility improvement projects in planning stages, including drastic revisions of the CTB. Any mechanism for allocation of physical resources would have to be appropriate both for the existing configuration of the airport as well as future changes.
The airport in general is capacitated, on a variety of fronts. The physical space
for terminal buildings, hangars, aprons, runways, taxiways, etc., is used maximally. The same can be said for parking – the only option there is to build vertically, which is very expensive. This is why re-allocation at LaGuardia is markedly different than a similar process might be at an airport that has room to grow – it is zero-sum exercise at LaGuardia, and the resources are very valuable. Additionally, some benefit can be realized by keeping resources away from competitors, even if they are not used in a functionally efficient manner. The Port Authority has a variety of construction plans under consideration, which basically involve the demolition of Hanger 2 (and perhaps 4) to make room for an additional concourse in the Central Terminal Building. The design standards for the new concourse would be consistent with modern comfort and security requirements. At the same time, they are considering options that involve the complete re-construction of the old concourses (reducing their number from four to three) to bring them into compliance with these same standards. This is an enormously costly and disruptive option, but it may make long-term sense nonetheless. It should be expected that the resource allocation problem associated with the new CTB configuration will be complicated, and hopefully the congestion management scheme adopted will be easily adaptable to this expansion.
5.3.2. ADMINSTRATIVE AND FISCAL CONSTRAINTS Freedom Agreement
The airfield cost recovery mechanism currently in place is the Freedom
Agreement, which dates to 2004. It provides to carriers the right to access the airfield (it does not explicitly cover terminals, gates, aprons, etc.), in exchange for the payment of weight-based flight fees. The cost recovery mechanism is revenue neutral; i.e., the flight fees are estimated, collected, and later rectified, to be in accordance with an agreed schedule of continuing maintenance costs for the airfield. In sum, this agreement generates on the order of $90-$100 million per year. This was an extensively negotiated agreement. One challenge of a fee-based congestion management scheme is compatibility with this agreement. One option is to dissolve the agreement, which both the carriers and the Port Authority may be wont to do, because of the large effort required to negotiate the agreement. (The challenge could be exacerbated if some parties

84
involved were opposed to the new congestion management scheme.) On the other hand, a simple solution may be possible. Specifically, the Freedom Agreement adjusts charges so that they exactly cover airfield costs. If an alternative revenue stream, e.g. from auctions or congestion pricing, were directly earmarked to cover some or all of these costs, then the landing fees would be automatically adjusted to cover only the remaining costs. This approach must be subjected to closer scrutiny but it appears to offer a simple way of directing some or all of a new revenue stream to offset existing landing fees.
Gate Leases
Property ownership at LaGuardia is a contentious issue. The airport property itself is owned by the City of New York, and is leased to the PANYNJ for the purposes of operating the airport. One might imagine, then, that all permanent structural features on the property are also owned by the city. This is the view taken by PANYNJ, but not necessarily by all carriers. In the Delta mainline terminal, for example, because Delta paid for the construction of the terminal under an agreement with PANYNJ, it is their stated belief that they own the terminal building and lease the land on which it stands.
That lease (it is either for the land or for the land and the terminal) expires in
2008. Other long-term leases exist with some facilities, but the majority of the gates are technically short-term (but practically indefinite) leases that are renewed annually with 30-day revocation clauses. These clauses give PANYNJ the authority not to renew the lease, and are intended in part to force carriers to comply with certain subjective requirements in the lease agreements, such as the requirement to make a “best effort” to accommodate other carriers requesting access to gates and also to maintain a high level of activity on all leased gates. There are sharp differences in opinion amongst carriers as to how faithfully these requirements have been followed and enforced over the years. It is certainly the case that there have been a variety of sub-lease arrangements over the years and also that gate exchanges have been executed in order to accommodate carrier needs. For example, after American took over TWA, American had gates located in different concourses. The PANYNJ has typically played a strong role in facilitating transactions of this sort. On the other hand, it is certainly true that gate utilization differs significantly among carriers, with spare capacity existing for some carriers and very high utilization for others. Further, very few existing leases have failed to be renewed. Of course, new entrants have been given slot rights and folded into the operational mix, so over the years the PANYNJ has had to make an active effort to facilitate their being granted access to gates.
There are a number of reasons why the lease revocation clauses are not an
attractive enforcement tool, setting aside their political distastefulness. For airlines that have made significant capital investments (American, Delta, U.S. Airways, among others), the lease agreements require the PANYNJ to assume remaining debt burden on those improvements in the event the leases are not renewed. These debts are significant, and the PANYNJ is very hesitant to assume the financial risk. Secondly, the fact that carriers have made such investments in the face of these short-term leases suggests that there is an implicit understanding that the leases will automatically be renewed, which

85
gives carriers the confidence to undertake the financial risk associated with these improvements. Any change in this situation would likely reduce their willingness to front such costs themselves.
The existing balance of interests at LGA was carefully negotiated, but (hopefully)
with the realization by all parties that the existing slot control mechanism would be ending in 2007. The extent to which various parties thought that the status quo could be continued after that date is uncertain. What is certain is that there are entrenched positions, both politically and economically, that will have to be overcome to varying degrees under new congestion management schemes. This section is concerned mainly with financial constraints – the need to assume the debt burden on gates transferred to something more like common use could be significant. The second-order effect of a likely need for increased Port Authority involvement in terminal maintenance and aesthetic upkeep should also not be discounted.
While not strictly a financial issue, it makes sense at this point to clarify how the
term “common use” might be interpreted. Currently, there are only two common use gates at LaGuardia, and they are used throughout the day by ATA, Frontier, JetBlue, Westjet, and AirTran, and perhaps by others. Thus, no single carrier is able to establish a brand identity with either of these gates. Accordingly, the current colloquial understanding of the phrase “common use gate” at LGA is something along this vein – a generic gate that many carriers use alternately throughout the day. Probably without exception, a carrier would prefer to operate out of a dedicated gate in order to put in place appropriate signage and computer facilities. Operating out of a gate shared over the course of the day also can be very challenging in times of irregular operations, since accommodating delayed aircraft can involve inter-carrier negotiations. A concern, if LGA were to transition from being predominantly exclusive carrier gates to common use gates, is that this definition would be extrapolated to the airport as a whole. It is safe to assume that this concern is unfounded, because the number of gates is much greater than the number of potential carriers. Even under a common use scheme, it would make most sense for gates to be partitioned into contiguous blocks that single carriers would use exclusively, allowing them to establish their own brand identity on those gates. The difference, in a common use environment, is that these partition boundaries could change, smoothly and moderately, as resource re-allocation takes place over the years, and that carriers would not be able to stake out property claims on gates without paying for that privilege.
Jet Bridges
The Port Authority owns some of the jet bridges at LaGuardia, but not all of them. Under any re-allocation scheme, any carrier whose final holdings are commensurate with the number of jet bridges they own or can acquire from LaGuardia will be happy. A carrier that does not own enough but that wants to expand can simply acquire more. A carrier that loses ground at LaGuardia may not be willing to sell or otherwise make available their jet bridges, creating additional costs for other carriers and/or the PANYNJ.

86
A similar and important argument can be made for any other non-permanent equipment that is expensive and necessary in quantities proportional to gate allocation.
Service contracts Various agreements exist between carriers and service providers at LaGuardia, either for food service or fueling or baggage handling or a variety of other services. To the extent that long-term contracts have been signed for these services, and to the extent that the quantity of service under any of these agreements might change in a resource re-allocation, these contracts would need either to be re-negotiated or paid off, which could create additional costs to the PANYNJ.

87
REFERENCES [Ausubel and Cramton, 2004] Ausubel, Lawrence M., Peter C. Cramton, “Auctioning Many Divisible Goods” Journal of the European Economics Association, 2, 480-493, April-May 2004. [Ausubel and Milgrom, 2002] Ausubel, Lawrence M., Paul Milgrom, “Ascending Auctions with Package Bidding”, Frontiers of Theoretical Economics, 2002. [Ausubel and Milgrom, 2006] Ausubel, Lawrence M., Paul Milgrom, “Ascending Proxy Auctions,” Chapter 3 in Peter Cramton, Yoav Shoham, and Richard Steinberg (eds.), Combinatorial Auctions, forthcoming, MIT Press, 2006. [Ausubel et al., 2006] Ausubel, Lawrence M., Peter C. Cramton, and Paul Milgrom, “The Clock-Proxy Auction: A Practical Combinatorial Auction Design”, Chapter 5 in Peter Cramton, Yoav Shoham, and Richard Steinberg (eds.), Combinatorial Auctions, forthcoming, MIT Press, 2006. [Ausubel, 2004] Ausubel, Lawrence M. “An Efficient Ascending-Bid Auction for Multiple Objects,” American Economic Review, Vol. 94, No. 5, pp. 1452-1475, December 2004. [Barnett et al., 2001] Barnett, Arnold, Robert Shumsky, Mark Hansen, Amadeo Odoni, and Geoff Gosling, “Safe at Home? An Experiment in Domestic Airline Security”, Operations Research, 49, 2, pp. 181-195. [Brueckner, 2001] Brueckner, J. “Airport Congestion When Carriers Have Market Power,” Institute for Government and Public Affairs, University of Illinois at Urbana-Champaign; May 2001. [Business Aviation, 2000] “'Choke Point' Plan to Tackle Delays, Business and Commercial Aviation”, vol. 7, no. 4, p. 26, October 2000. [Crowley, 2001] Crowley, J. “LaGardia Airport: Can the airport and the community coexist?”, April 3, 2001, http://crowley.house.gov/issues/laguardiareport.pdf [Day and Raghavan, 2004] Day, Robert W., S. Raghavan, “Generation and Selection of Core Outcomes in Sealed-Bid Combinatorial Auctions”, Working Paper, 2004. [Donohue, 2002] Donohue, George L. “Air Transportation is a Complex Adaptive System-Not an Aircraft Design: Innovation at the Interface of Disciplines”, July 29 2002, NASA Langley Research Center, http://www.icase.edu/series/Misc/Donohue.pdf [Fan and Odoni, 2002] Fan, Terence P. and Amedeo R. Odoni, “A Practical Perspective on Airport Demand Management”, Aircraft Traffic Control Quarterly, Vol. 10, No. 2, 2002.
88
[Fan, 2004] Fan, Terrence. P. “Market-Based Airport Demand Management – Theory, Model, Application,” MIT, Ph.D. Thesis, Engineering Systems, February 2004, p. 97. [GRA, 2003] “National Policy Analysis of Market-Based Solutions to Address Airport Congestion”, GRA Report prepared for USDOT, May 20, 2003. [Hansen, 2002] Hansen, Mark, “Micro-level Analysis of Airport Delay Externalities Using Deterministic Queuing Models: a Case Study”, Journal of Air Transport Management, 8, 2002, pp. 73-87. [Hoffman et al., 2004] Hoffman, Karla, Dinesh Menon, Susara van den Heever, “A Bidder Aid Tool for Dynamic Package Creation in the FCC Spectrum Auctions”, Working Paper, 2004. [Hoffman et al., 2006] Hoffman, Karla, Dinesh Menon, Susara van den Heever, Thomas Wilson, “Observations and Near-Direct Implementations of the Ascending Proxy Auction,” Chapter 17 in Peter Cramton, Yoav Shoham, and Richard Steinberg (eds.), Combinatorial Auctions, forthcoming, MIT Press, 2006. [LaGuardia Airport, 2001] “Notice of Alternative policy Options for Managing Capacity at LaGuardia Airport and Proposed Extension of the Lottery Allocation”, Federal Register, Vol. 66, No. 113, Tuesday, June 12, 2001. [MASSPORT, 2004] “Proposed demand management for Boston Logan International Airport”, http://www.massport.com/about/pdf/c_demand_draft_5_04.pdf [Metron Inc., 2000] “LGA Before and After Air-21”, Metron Inc., Dec. 13, 2000, http://cdm.metronaviation.com/analysis/analysisdocs/ [Parkes and Ungar, 2000] Parkes, David C. and Lyle H Ungar, “Iterative Combinatorial Auctions: Theory and Practice” Proc. 17th National Conference on Artificial Intelligence (AAAI-00), pages 74-81, 2000. [Parkes et al., 2001] Parkes, D.., J. Kalagnanam, and M. Eso, “Achieving Budget-Balance with Vickrey-Based Payment Schemes in Exchanges”, Proc. 17th International Joint Conference on Artificial Intelligence (IJCAI-01), pages 1161-1168, 2001. [Parkes et al., 2005] Parkes, David C., Ruggiero Cavallo, Nick Elprin, Adam Juda, Sebastien Lahaie, Benjamin Lubin, Loizos Michael, Jeffrey Shneidman, Hassan Sultan, "ICE: An Iterative Combinatorial Exchange," to appear in Proc. ACM Conference on Electronic Commerce, 2005. [Pells and Verhof, 2003] D. Pells and E. Verhof, “The Economics of Airport Congestion Pricing,” Tinberg and Institute Discussion Paper T1 2003-083/3, University of Amsterdam, 2003.

89
[Pindyck and Rubinfeld, 1998] Pindyck, Robert S. and Daniel L. Rubinfeld, “Econometrics Models and Economic Forecasts”, the McGraw-Hill Company, 1998. [Schaefer and Millner, 2001] Schaefer, Lisa and David Millner, “Flight Delay Propagation Analysis with the Detailed Policy Assessment Tool”, Proceedings of 2001 IEEE Systems, Man, and Cybernetics Conference, 2001. [Slot Allocation, 1992] “Slot Allocation, Commission on Air Transport”, July 10, 1992, http://www.iccwbo.org/home/statements_rules/statements/1992/slot_allocation.asp. [U.S. Congress, 2000] “The Subcommittee on Aviation Hearing on the Slot Lottery at LaGuardia Airport”, Dec. 5, 2000,http://www.house.gov/transportation/aviation/hearing/12-05-00/12-05-00memo.html [U.S. DOT, 1995] “A Study of the High Density Rule”, U.S. Department of Transportation Report to Congress, May 1995, page 81. [U.S. House of Representatives, 2001] US House of Representatives, Committee on Appropriations, Subcomittee on Transportation and Related Agencies. Statement of the Honorable Jane F. Garvey, Federal Aviation Administrator, Concerning Air Traffic Control Delays and Capacity, March 15, 2001.

90
APPENDIX 2A: REGRESSION MODEL FOR AIRPORT ACCEPTANCE RATE
Our specification of the model is:
∑ ×+∑ ×+××+×+×+×+=
jjj
iii tDtQtIMCtVisibility
tWindspeedtVisibilitytScharrtAAR)()())()((
)()()()(4
3210ηγα
αααα
where: Qi(t) is a seasonal dummy variable; it is set to 1 when the observation
occurs in quarter i; Dj(t) is a demand management regime dummy variable; it is set to 1 when
the observation occurs in epoch j. For the stochastic disturbance we used a Generalized Autoregressive Conditional Heteroskedastic (GARCH) model of the form:
)1,0(~110
21
12
1
21
INehGARCHARCHARCHh
eh
vARvARv
t
ttt
ttt
tttt
−−
−−
×+×+=
⋅=
×−×−=
ε
ε
ε
The estimation results appear in Table 2A-1. The model explains about 72 percent of the variation of AAR, certainly enough to make the coefficient estimates meaningful. As expected, AAR increases with visibility and decreases with wind speed. The estimated coefficient of IMC dummy variable is positive. This means that, all else equal, the AAR tends to be higher in IMC. In fact, visibility is lower under IMC, and this effect counteracts that of the IMC dummy. This is reflected in Table 2.1 where we can see that AARs at LGA are very close under the two operating conditions. Examining the time period effects, we see that AARs increased under AIR-21, perhaps because the perceived queuing pressure in this period pushed managers to raise the rates. As elaborated below, the AIR-21 period also witnessed an initiative to relieve chokepoints in the New York airspace, which may have affected rates. The called rates fell back somewhat after the Slot lottery and declined sharply in the months after 9/11. Rates increased again in 2003 but have fallen back significantly in 2004. This probably accounts for the increased prevalence of saturated conditions during this period shown in Table 2.1. Compared to first quarter of the year, used as a basis in our model, AAR is lower in quarter 2, slightly lower in quarter 3 and higher in quarter 4. These differences probably derive from factors such as wind angle or precipitation not explicitly included in the model.

91
Table 2A-1: Estimation Results of Arrival Acceptance Rate (AAR) at LGA
Description of Explanatory Variables Estimate Standard Error p-Value
Intercept 8.487 0.022 <.0001 Scharr Scheduled arrivals at LGA in quarter-hour 0.011 0.000 <.0001 Visibility Visibility at LGA 0.009 0.001 0.042 Wind Speed Wind speed at LGA -0.002 0.001 <.0001
IMC Dummy variable for operation condition, 1 if under IMC condition, 0 otherwise 0.042 0.001 <.0001
AIR-21 Dummy variable for the AIR_21period 0.498 0.024 <.0001 Slot lottery Dummy variable for the Slot lottery period 0.188 0.022 <.0001 Post 9/11 Dummy variable for the post 9/11 period -0.153 0.042 0.003 Year2002 Dummy variable for Year 2002 0.069 0.022 <.0001 Year2003 Dummy variable for Year 2003 0.427 0.023 <.0001 Year2004 Dummy variable for Year 2004 -0.364 0.025 <.0001 Quarter2 Dummy variable for Quarter1 -0.325 0.016 <.0001 Quarter3 Dummy variable for Quarter2 -0.030 0.018 0.198 Quarter4 Dummy variable for Quarter3 0.142 0.020 <.0001 R-square 0.718
92
APPENDIX 2B: TOBIT MODEL OF LGA CAPACITY
The results of Appendix 2A suggest that AAR may not be a reliable measure of arrival capacity at LGA. To obtain an alterative estimate, we used quarter-hourly ASPM data to find the capacity by using Tobit regression. The data that we used is from January 2000 to June 2004, and included quarter-hour arrival counts, arrival demand, runway configuration, and visibility condition (IFR or VFR). In the quarter hours when arrival demand is greater than the capacity, the arrival count reveals the capacity. For the time periods when the arrival demand is less than the capacity, the observed count is a reflection of demand rather than capacity. Let *
iC represent the capacity, iC the observed arrival count, and iA the arrival demand for quarter hour i. The mathematical formulation of above is:
*
**
iiii
iiii
CAforAC
CAforCC
<=
≥= (1)
We assume a simple expression for capacity at LGA such that iiconi aC ε+= )(
* , where
)(icona is the average capacity of LGA under condition i (where by condition we refer to both runway use and visibility) and iε is a random error term which we assume to be normal. This model is called a Tobit model and unbiased and consistent estimates for the average capacities can be obtained using data for demand and count for time periods in which a given condition prevails. We carried out this estimation for each of the seven epochs identified above. The estimates are shown in Table 2.2. In 2004, the most recent period, capacity varies between 8 and 10.5 (per quarter-hour) under VFR and between 5.5 and 9.2 under IFR. The more common configurations have VFR capacities over 10 and IFR capacities between 8 and 9. However, there are several configurations when IFR capacity drops below 8 under IFR. These are generally cases where, as a result of crosswinds, a single runway must be used.

93
APPENDIX 2C: MULTIVARIATE MODEL OF LGA AND NAS DELAY In this section, we present a simultaneous model of delay at LGA and in the rest of the NAS. We use the model to decompose average daily delay at LGA into components related to different delay causes, and to assess the spillover effects of LGA delay. The assessment of spillover effects through simultaneous estimation provides an alternative to previous studies of delay spillover [Schaefer and Millner, 2001; Barnett et al., 2001], that rely on simulations. In addition to having a stronger empirical base, the econometric approach reflects the overall experience during a large sample of days instead the single of handful or days typically considered in a simulation. For LGA, the explanatory variables include congestion and weather conditions at LGA itself, delay at other airports, convective weather, and other factors. Our model of NAS delay includes as explanators delay at LGA, congestion at airports other than LGA, convective weather, and other factors. The models form a simultaneous system because LGA delay is explained partly by NAS delay, and NAS delay is explained partly by LGA delay. To estimate the models, we exploit the fact that each model contains variables that are not included in the other model. In econometric terms, the equation system is over identified. This allows us to use two-stage least squares (as described, for example, in [Pindyck and Rubinfeld, 1998] for estimation. Below we describe the variables in the two models. 2C.1. Model Variables 2C.1.1 Arrival Delay One cause of arrival delay at a given airport is congestion at other airports. At the individual flight level, delays propagate forward to create additional delays downstream. Aggregated to the daily level, we expect higher congestion at other airports result in higher average arrival delay at LGA and vice versa. In our models, we use arrival delay against schedule as our delay metric. This is reasonable because, at the daily level, arrival and departure delays are very highly correlated. Thus for LGA average arrival model, we use daily average arrival delay at other airports on the right hand side. The average is based on all flights arriving at the 31 benchmark airports other than LGA. Similarly the NAS average delay model contains the LGA average delay on the right hand side. To accomplish the simultaneous estimation, we actually use predictions of the two delay variables on the right hand sides, based on the fully exogenous variables in the two models. 2C.1.2 Deterministic Queuing Delay Deterministic queuing delay indicates the operation demand and supply relationship at the airport. For a given day, we used scheduled arrival demand at LGA based on the Official Airline Guide (OAG), cancellations, and the arrival capacities for different runway configurations from Tobit model (see Appendix 2B) to construct our daily deterministic queuing delay variable (Figure 2C-1). The cumulative flight demand at quarter-hour i is the sum of scheduled arrival demand minus all cancellations until time i. The arrival count in each quarter-hour is restricted either by arrival demand or capacities, which assures that the curve of cumulative arrival counts is always below the demand

94
curve. The area between these two curves is the total delay. We calculated the daily average queuing delay at LGA by dividing this total delay with the total number of LGA arrivals in that day. For NAS queuing delay, we used the same method, aggregated to obtain an average for arrivals at the 31 benchmark airports other than LGA. 2C.1.3 Adverse Weather Adverse weather is introduced in two ways. First convective weather is modeled using a daily summary of en-route weather information based on the hourly data obtained from the Surface Summary of the Day (SSD) data base maintained by the National Oceanographic and Atmospheric Administration. That data base contains various weather observations for 1500 weather stations in the US. Each observation contains binary variable indicating weather the station had recorded thunderstorms during that day. We divided the whole country into regions of 10 degree latitude by 10 degree longitude (Figure 6) and computed the proportion of weather stations in each region reporting thunderstorms. Convective weather makes certain portions of the en route airspace unflyable, forcing reroutes, ground holds, and other restrictions. It also disrupts operations in terminal areas. As a second weather metric for the LGA, we used the proportion of the day in which the airport was under instrument meteorological conditions (IMC). So-called IFR_ratio in this report is calculated as the quarter hours operated under IMC condition divided by the number of quarter hours in the whole day at LGA. 2C.1.4 Total Flight Operations As an additional variable in the NAS model we include the total flight operations to all 32 benchmark airports. This captures effects of traffic volume not reflected in the other variables. 2C.2 Model Specification and Estimation We estimated two multivariate models of average arrival delay with the factors that we discussed in previous paragraphs. In addition, to compare the effect of different time periods, we introduce dummy variables which are set to 1 if the day is within one of the specified time periods, 0 otherwise. We also employ a set of dummy variables to capture the seasonal effects. Thus, our base specifications of average arrival delay as the following, where the “hatted” variables represented predictions based on exogenous variables in the two models: Model 1 (Daily average arrival delay at LGA)
)()()()()()()()(ˆ)( 2
4321
ttDtQtWtItItLQtDtD
jj
jLii
iLk
kkL
LLSLL
νθωλ
ββββα
++++
×+×+×+×+=
∑∑∑
Model 2 (Daily average arrival delay at rest of Benchmark Airports)
)()()()()()(ˆ)()( 321
tutDtQtWtSQtDtOPtD
jj
jSii
iSk
kkS
LSS
++++
×+×+×+=
∑∑∑ θωλ
γγγα
where:

95
)(tDL is the daily average observed arrival delay against schedule at LGA on day t; )(tDS is the daily average observed arrival delay at other airports other than LGA
in day t; )(tLQ is the daily average arrival deterministic queuing delay at LGA in day t; )(tSQ is the weighted daily average arrival deterministic queuing delay of system in
day t; OP(t) is the total operations (arrivals) of the system in day t;
)(tI L is the daily IMC_ratio recorded at LGA in day t; )(tWk is the weather index of different regions in day t; )(tQi is the seasonal dummy variable, set to 1 if the daily arrival delay is observed
in quarter i and 0 otherwise; )(tD j is the demand management regime dummy variable, set to 1 if the daily
arrival delay is observed in time period j and 0 otherwise. )(tν , )(tu are stochastic error terms.
In a standard regression, we assume that the error term is normally, identically, and independently distributed. However, initial estimation experience reveals that the errors are heteroskedastic and autocorrelated. In Model 1, the heteroskedasticity was related to the departure delay at other airports and the queuing delay at LGA, the higher value of O(t) or Q(t), greater variance of error term. In Model 2, there is no systematic heteroskedasticity but only that related to time series. Thus, we used a similar approach as what we did in section 2.1.3, applying, for the model 1, a GARCH model of form:
)1,0(~))(2)(1(*110
1
12
1
1
INetLQHettSOHethGARCHARCHARCHh
eh
vARv
t
ttt
ttt
ttt
×+×++×+=
⋅=
×−=
−−
−
ε
ε
ε
The model 2 specification is analogous except that the Het1 and Het2 terms are excluded. These models were estimated using two-stage least squares following the procedure described in (14). Taking autocorrelation and heteroskedasticity into consideration, in each stage, models are estimated by using feasible least squares instead of ordinary least squares. 2C.3 Estimation Results Estimation results are shown in Table 2C-1 and 2C-2. Looking first at the bottom of Table 2C-1, we see that the LGA model explains about 46 percent of the variation in average daily arrival delay at LGA. The estimated coefficient for average queuing delay is 0.95, which means that 1 minute increase of the average queuing delay will cause about same amount of average arrival delay at LGA. Non-local factors also contribute to delay at LGA. One minute of delay at other airports causes about 1.4 minute of increased delay at LGA. Of the convective weather variables, three of them were found statistically significant and left in the model (see Figure 2C-2 for the particular regions). It should be noted that convective weather may also affect LGA delays by causing delays at other airports, factors that are separately accounted for in our model.

96
Examining the fixed effects, we see that seasonal differences in delay are fairly small once we account for other factors. The only significant seasonal effect is for the spring, during which average delays are about 2 minutes less, all else equal. The time period fixed effects, in contrast, are somewhat larger and more significant. They imply that, compared to the HDR period (used as the baseline) and controlling for the other factors, LGA delays were 2 minutes higher starting with AIR-21 and then dropping in the slot lottery period. The time fixed effect reaches the lowest in the time period after 9/11 and then comes back gradually through the present. Air traffic procedures were changed in the New York airspace initiated in the fall of 2000 under the FAA’s chokepoint program. These included new routes for propeller aircraft and an additional East route for New York- bound traffic from the Atlantic Seaboard, New England, and Europe [Business Aviation, 2000]. However, these improvements still was not able to alleviate the congestion brought by over-scheduling. Using the results in Table 2C-1 and our daily data, we decomposed the average arrival delay at LGA by causal factors that we included in the delay model, and aggregated results to compare the different time periods (see Figure 2.2). The average delay in a given period is the difference between the positive and negative bars. The bars are decomposed into the different factors included in the LGA delay model. For example, in the HDR period the average arrival delay was 23 minutes, of which 17 minutes is associated with delay at other airports, 3 minutes with the average arrival queuing delay, and so on. The most consistent contributor to arrival delay LGA is delay at other airports, which generates from 11 to 18 minutes. That contribution declined slightly during the Slot lottery period, and sharply after 9/11, but steadily increased in following time periods. The most variable contributor is the average arrival queuing delay. It increased 5 minutes from HDR to AIR-21 and cause the same amount of observed delay. Table 2C-2 shows the results of the NAS delay model, which explains average arrival delay for flights to 31 benchmarks airports other than LGA. This model explains about 70 percent of the variation in average arrival delay. The prevalence of queuing delay, total operations, and thunderstorm activity in the eastern U.S. are all significant factors. Of particular interest here is the effect of LGA delay. We see that a 1 minute increase in average arrival delay at LGA causes a 0.06 minute increase in average arrival delay at the other benchmark airports. To put this in perspective consider that the ratio of non-LGA to LGA arrivals is about 34 to 1, thus the increase in total arrival delay at non-LGA airports from a 1 minute increase in total arrival delay at LGA is 206.034 ≈⋅ minutes. This supports the claims that the congestion at LGA resulting from AIR-21 had substantial spillover effects throughout the NAS. Further analysis is necessary to determine if this spillover was widely dispersed across flights and airports or more concentrated.

97
50
100
150
200
250
300
11:00
11:30
12:00
12:30
13:00
13:30
14:00
14:30
15:00
15:30
16:00
16:30
17:00
17:30
18:00
Time of day
Cum
ulat
ive
num
ber o
f airc
raft
Arrival CountsArrival Demand
Figure 2C-1: Queuing Diagram of Arrivals at LGA

98
Table 2C-1: Estimation Results of Arrival Delay at LGA
Description Estimate Standard Error p-Value
Intercept -2.32 1.80 0.00
Ds(t) Predicted arrival delay for NAS 1.37 0.11 <.0001 LQ(t) Average queuing delay at LGA 0.95 0.11 0.06
I(t) IFR_ratio (Proportion of the day operated under IMC condition) 12.56 2.34 <.0001
I(t)2 Square of IFR_ratio -4.04 2.71 0.14
W3(t) Thunder storm ratio (number of stations reported thunderstorm / total amount of stations) in Region 5 -7.02 2.44 0.00
W1(t) Thunder storm ratio (number of stations reported thunderstorm / total amount of stations) in Region 5 -5.45 2.10 0.01
W5(t) Thunder storm ratio (number of stations reported thunderstorm / total amount of stations) in Region 5 28.82 2.89 <.0001
D1(t) Dummy variable for the AIR-21period 2.13 1.05 0.04 D2(t) Dummy variable for the Slot lottery period -0.69 1.15 0.55 D3(t) Dummy variable for the post 9/11 period -4.00 1.82 0.03 D4(t) Dummy variable for Year 2002 -1.03 1.09 0.35 D5(t) Dummy variable for Year 2003 -0.62 1.05 0.55 D6(t) Dummy variable for Year 2004 -0.37 1.08 0.73 Q1(t) Dummy variable for Quarter1 -1.68 0.83 <.0001 Q2(t) Dummy variable for Quarter2 -1.32 0.99 <.0001 Q3(t) Dummy variable for Quarter3 0.48 0.98 <.0001 R-Square 0.46

99
Figure 2C-2: Regions for Weather Index Calculation

100
Table2C-2: Estimation Results of Arrival Delay of NAS
Description Estimate Standard Error
p-Value
Intercept 3.59 1.13 0.00 OP(t) Total operations (Arrivals) in the system 0.00 0.00 <.0001 DL(t) Predicted average arrival delay at LGA 0.06 0.01 <.0001 SQ(t) Average arrival queuing delay of system 1.07 0.04 <.0001 W1(t) Thunderstorm ratio in Region 1 2.46 0.62 <.0001 W2(t) Thunderstorm ratio in Region 2 4.36 0.85 <.0001 W3(t) Thunderstorm ratio in Region 3 4.23 0.71 0.00 W4(t) Thunderstorm ratio in Region 4 4.50 0.53 <.0001 W5(t) Thunderstorm ratio in Region 5 5.66 0.99 <.0001 W6(t) Thunderstorm ratio in Region 6 8.56 0.84 <.0001 D2(t) Dummy variable for the AIR-21 period -0.51 0.63 0.42 D3(t) Dummy variable for the Slot lottery period -1.06 0.50 0.03 D4(t) Dummy variable for the post 9/11 period -2.36 0.87 0.01 D5(t) Dummy variable for year 2002 -2.46 0.50 <.0001 D6(t) Dummy variable for year 2003 -2.48 0.48 <.0001
D7(t) Dummy variable for year 2004 (half of the year) -1.64 0.52 0.00
Q1(t) Dummy variable for quarter 1 -0.19 0.49 0.69 Q2(t) Dummy variable for quarter 2 -3.09 0.53 <.0001 Q3(t) Dummy variable for quarter 3 -3.90 0.55 <.0001 R-Square 0.66 Thunderstorm ratio: the number of stations reported thunderstorm / total amount of stations

101
APPENDIX4A: SAMPLE AUCTION DESCRIPTION Here we briefly describe the auction procedure used in the NEXTOR Mock Slot Auction. It embodies the major elements of the design described in this report but has some slight differences, e.g. 1 hour rather than 15 minute intervals. The auction, through a series of bidding rounds, will determine the assignment of rights for arrival and departure capacity as well as the prices paid for such rights. The auction is a simultaneous clock auction. “Simultaneous” refers to the property of this auction that multiple products are sold simultaneously, and “clock” refers to the manner in which prices evolve over time. In each round, the auctioneer will announce prices for each product, and participants will bid the quantities of each product that they wish to buy at the announced prices. The auctioneer then announces the aggregate demand for each product, compares the aggregate demand for each product with the available supply, and adjusts the prices accordingly. The process iterates in a series of rounds until demand approximately equals supply for every product, and the participants win the final quantities that they bid at the final prices. There will be 16 products—landing rights during each hour beginning 0600 to 2100 together with the associated takeoff rights. Thus, the auctioneer will announce 16 prices in each round, and bids will consist of 16 quantities. Generally speaking, the auction will begin with announced prices that are lower than the expected clearing prices, and the prices will increase during the course of the auction. Depending on the realization of aggregate demand, it is also possible that individual prices will decrease. The diagram below illustrates how the auction might develop, simplified to show the demand aggregated over all products and aggregated across all bidders. Figure 4A-1: Auction bids and clearing price (aggregate demand)
Price ($)
Round 5P5 Round 5P5
Round 4P4 Round 4P4
Round 3P3 Round 3P3
Round 2 P2 Round 2 P2
Round 1 P1 Round 1 P1
Aggregate demand (slots)
Supply
P6 Round 6P6 Round 6
Clearing Price P6 Round 6P6 Round 6
Round 5P5 Round 5P5
Round 4P4 Round 4P4
Round 3P3 Round 3P3
Round 2 P2 Round 2 P2
Round 1 P1 Round 1 P1 Round 1 P1 Round 1 P1

102
Participants’ bids will generally be subject to four overall constraints:
no participant will be allowed to bid for more than 150 slots in aggregate;
no participant will be allowed to bid for more than 32 slots in a single time period;
as the prices evolve, participants will be subject to an activity rule that will generally prevent any participant from increasing its aggregate quantity as prices increase, but will permit any participant to substitute among slots in different time periods according to a particular formula; and
no participant may exceed certain limits on their bids derived from the value of financial guarantees submitted during the qualification stage.
In the current auction, financial guarantees will not be required, so participants’ bids will only be subject to the first three constraints. Intra-Round Bidding The auction software implements a state-of-the-art feature called “intra-round bids.” This feature solves the problem in clock auctions often referred to as “overshoot.” In any clock auction, there is concern that the auctioneer may increase the price by a small amount, but the aggregate quantity bid may drop dramatically, below available supply. With intra-round bids, participants may submit quantities at individually-chosen points between the previous round’s prices and the current round’s prices. Suppose that the previous round’s price for each product was $100,000 and the current round’s price for each product is $200,000. A participant may, for example, elect to submit quantities at a price point of 20%, representing the point 20% of the distance from the previous round’s to current round’s prices (i.e., prices of $120,000 for each product), another set of quantities at a price point of 50% (i.e., prices of $150,000), and another set of quantities at a price point of 100% (i.e., prices of $200,000). The price points work similarly when there is a different price for each of the 16 products. In each round, bidders are able to express quantities at up to five price points. Thus, a bid consists of between one and five price points (each between 0.01% and 100.00%) and quantities for the 16 products (each quantity a nonnegative integer) at each price point. Revealed-Preference Activity Rule In clock auctions, participants’ bidding is generally constrained by an activity rule. The purpose of an activity rule is to prevent any bidder from hiding as a “snake in the grass” and avoiding bidding until near the end of the auction, for the purpose of concealing its true interests or values from opponents in the auction. A familiar example of this type of bidding behavior is the “bid-sniping” seen on eBay, where an auction may last a week, but all of the meaningful bids may be submitted in the last five minutes. Such bidding

103
behavior would undercut the objective of price discovery in a dynamic auction; and therefore the activity rule seeks to minimize such undesirable bidding behavior. In an auction with a single type of product, a simple but effective activity rule is to require participants to submit bids for non-increasing quantities as the price goes up. For example, a participant who demanded 4 slots at a price of $100,000 per slot cannot suddenly increase its demand to 15 slots when the price reaches $120,000 per slot. The quantity bid at a higher price is required to be less than or equal to the quantity previously bid at a lower price. This activity rule prevents participants from bid-sniping: the only way that a participant can bid for 15 slots at $120,000 per slot is also to bid for at least 15 slots at lower prices. In an auction with multiple products, such as the 16 different types of slots in the February mock auction, the activity rule needs to be more complicated. It is undesirable to impose non-increasing quantities on each individual product, since it would prevent participants from engaging in a very natural form of substitution. For example, consider the following hypothetical bidding behavior:
Table 4A-1: Bidding permitted under activity rule
Time Period Price p1 Quantity q1 Price p2 Quantity q2
0700 $120,000 8 slots $150,000 8 slots
0800 $120,000 8 slots $150,000 6 slots
0900 $100,000 4 slots $110,000 6 slots
The form of bidding displayed in Table 4A-1 could readily arise from non-strategic behavior. The participant simply recognizes that when prices changed from p1 to p2, the 0700 and 0800 slots increased by $30,000 each while the 0900 slots increased by only $10,000 each. The 0700 and 0800 slots became relatively more expensive than the 0900 slots, and it makes sense for the participant to engage in substitution from 0700 or 0800 slots into 0900 slots. Thus, the participant should be permitted to bid as shown in Table 1, even though the participant displays an increased demand for 0900 slots after a price increase. However, also consider a second hypothetical bidding behavior:

104
Table 4A-2: Bidding not permitted under activity rule
Time Period Price p1 Quantity q1 Price p2 Quantity q2
0700 $120,000 8 slots $150,000 8 slots
0800 $120,000 8 slots $150,000 10 slots
0900 $100,000 4 slots $110,000 2 slots
The form of bidding displayed in Table 4A-2 should never arise from non-strategic behavior. The 0700 and 0800 slots again became relatively more expensive than the 0900 slots, yet the participant responded by attempting to substitute from the relatively cheaper 0900 slots into the relatively more expensive 0800 slots. The activity rule does not permit the participant to bid in the way shown in Table 4A-2. The above intuition is incorporated into the activity rule used in the February mock auction. The revealed-preference activity rule requires that the following inequality is satisfied for every bid submitted: (RP) (p2 – p1)⋅ q2 ≤ (p2 – p1)⋅ q1. This means that the price change, (p2 – p1), when multiplied product-by-product by the quantity q2 and summed together, is required to be less than the price change, (p2 – p1), when multiplied product-by-product by the quantity q1 and summed together. This constraint is satisfied for the bidding illustrated in Table 1, since:
(30,000 × 8) + (30,000 × 6) + (10,000 × 6) ≤ (30,000 × 8) + (30,000 × 8) + (10,000 × 4).
However, this constraint is violated for the bidding illustrated in Table 2, since:
(30,000 × 8) + (30,000 × 10) + (10,000 × 2) > (30,000 × 8) + (30,000 × 8) + (10,000 × 4).
If the participant attempted to increase its quantities in all products as the prices increased from p1 to p2, then the bidding would violate the revealed-preference activity rule more grossly. The auction software enforces a relaxed version of the revealed-preference activity rule. The purpose of the relaxed constraint is to simplify the process of preparing bids, while

105
still maintaining a rule that largely prevents bidders from holding back their demands. Further details will be provided to participants at the time of the February mock auction. Detailed Sequencing of Each Auction Round The auction will be carried out over a series of rounds. During each round, participants will be asked to submit bids for the number of slots that they would like to buy in each time period, at the range of prices announced by the auctioneer for that round. The sequence of events will be as follows:
Before each round, the auctioneer will announce: (i) the start-of-round prices; (ii) the end-of-round prices; and (iii) the starting and ending times of the round. In all rounds except the first round, the start-of-round prices will be the end-of-round prices from the previous round.
During each round, participants will be asked to submit between one and five bids expressing the quantity of each type of slot they would like to buy over the range of prices from the start-of-round to the end-of-round prices. In this manner, a participant can adjust the quantities demanded in several steps.
In the first round of the auction, each participant must submit a bid at the 0.00% price point (i.e., participants must indicate their demands at the start-of-round prices). In all subsequent rounds, the participants’ demands at the start-of-round prices are implied by carrying forward the quantities bid in the previous round, and the participants may select any price points of their choosing.
Participants may submit their bid(s) at any time during the round.
Only bid(s) satisfying the constraints referred to above for each participant will be accepted.
At the end of each round, bids become binding offers to purchase slots at the specified prices.
After each round, the auctioneer will add up all the bids and determine at which price point to post the round. The auctioneer will then announce to participants the aggregate demand that round for each product at the posted prices. If the auction has not concluded, then the auction will advance to a new round and the above sequence of steps will be repeated.
This round-by-round process continues until a point is reached where aggregate demand approximately equals supply for most products. The auctioneer then selects the price point that best balances supply and demand. Specifically, the auctioneer seeks to find the price point that minimizes the deviation of aggregate demand for each product from 32,

106
subject to the constraint that aggregate demand for each product is never more than 36. Thus, supply is somewhat flexible around 32. To the extent that more than 32 slots are sold in an hourly time period, there would be fewer slots left over for unscheduled operations in that hour. The price point selected determines the clearing prices for all of the products. Each participant wins the quantity of each product that the participant bid for at the clearing prices.

107
APPENDIX 4B: GRA FIRST ESTIMATES OF CONGESTION PRICES FOR LGA Following are estimates of congestion prices based on the demand for operations revealed in the November 2000 schedule at LGA. November showed a marked increase in activity resulting from Air 21 slot exemptions. A total of 1379 operations (including 1350 scheduled operations from the OAG and 29 non-scheduled operations obtained from ETMS) occurred on the model day (November 15). GRA modeled the congestion prices required to cause approximately 200 operations to be removed.
A carrier’s decision to remove a flight from its schedule as a result of higher fees is modeled as follows:
Carriers are assumed to be interested only in their own profitability; they seek
to maximize the contribution to overhead made by each of their flights.
In theory, a carrier will remove a flight (actually one arrival and a paired departure) from operation if the net contribution to overhead (network revenue minus direct costs minus marginal congestion costs) is negative.
A difficulty with the modeling of November 2000 is that Air 21 created a new opportunity for carriers to enter and gain position at an important airport where entry had been more difficult under the HDR. Thus, it is likely that carriers had strategic interests in entering: (1) to try new services with RJ aircraft in the hope that they would be profitable and (2) to outlast some incumbents and/or other new entrants in a highly volatile, congested and competitive environment. Therefore, carriers may have been willing to tolerate short-run losses in the hopes of gaining future long-run profits; this aspect of carrier behavior is only partially accounted for in GRA's model by allowing flights with small negative net contributions to continue to fly. Another implication of such strategic behavior is that the DB1B ticket sample for the period in question (which serves as the basis for estimating market demand) may not fully reflect projected long-run increases in demand that carriers would hope to induce by their added service which was just started as a result of Air 21.
A network-planning model is used to estimate the lost network revenue to a carrier if an arrival and paired departure are eliminated from the schedule.
The carrier’s direct operating costs for the operations are estimated from Form 41 data.
The carrier’s marginal reduction in congestion-related costs if the flight is removed (primarily crew and aircraft time) is estimated using a delay model adapted from University of Maryland simulation results for the airport; the delay model shows substantial increases in delay in the base case over the course of the day as the airport reaches saturation early in the morning and

108
never fully recovers. It is assumed that each carrier will recognize only its own delay costs and that it will internalize only a portion of delay savings net of the actions of other carriers if it removes a flight.
The results are shown in the Table 4B-1. All fees (in the second column) are per operation. The minimum fee is set at $275 per operation—the revenue neutral fee per operation for the airport. Beginning at 7:00AM, congestion fees increase markedly and rise to $1800 per operation in the late afternoon /early evening period. The third and fourth columns report base case and scenario average delay in each hour (the average delay over the course of the day is 100 minutes in the base case and approximately 25 minutes in the scenario case). The remaining columns report base and scenario case operations in each hour for GA (non-scheduled) and scheduled operations. The maximum number of operations in the scenario case (77) occurs at 0900. It is also interesting to note that the number of non-scheduled operations removed from service is relatively low. ETMS data on LGA non-scheduled operations show that most flights are in relatively large jet aircraft; even the very large fees posited here make up a relatively small percentage of the costs of the those flights. Because these users exhibit relatively high willingness to pay, the modest number of flight removals should not be surprising.

109
Table 4B-1Hourly Data:
Hour Fee BaseDelay ScenDelay GA_Base GA_Scen GA_Diff Sch_Base Sch_Scen Sch_Diff Tot_Base Tot_Scen Tot_Diff 0 275 0.74 0.55 1 0 -1 6 6 0 7 6 -1
100 275 0.25 0.22 2 2 0 2 2 0 4 4 0 200 275 0.13 0.12 0 0 0 0 0 0 0 0 0 300 275 0.08 0.08 0 0 0 0 0 0 0 0 0 400 275 0.07 0.07 0 0 0 0 0 0 0 0 0 500 275 0.06 0.06 0 0 0 1 1 0 1 1 0 600 275 0.29 0.28 1 1 0 50 49 -1 51 50 -1 700 1200 2.54 1.39 0 0 0 73 54 -19 73 54 -19 800 1200 19.42 5.2 0 0 0 93 69 -24 93 69 -24 900 1200 70.53 16.1 0 0 0 92 77 -15 92 77 -15 1000 1200 76.8 25.9 0 0 0 74 70 -4 74 70 -4 1100 1400 85.15 29.54 2 0 -2 83 70 -13 85 70 -15 1200 1200 83.12 27.95 1 0 -1 76 66 -10 77 66 -11 1300 1400 87.23 28.02 1 0 -1 82 69 -13 83 69 -14 1400 1400 105.92 34.8 1 1 0 85 74 -11 86 75 -11 1500 1400 107.64 36.47 1 1 0 81 69 -12 82 70 -12 1600 1400 107.99 35.55 1 1 0 83 70 -13 84 71 -13 1700 1800 165.37 34.5 3 3 0 94 -27 97 70 -27 1800 1800 196.37 37.86 0 0 0 89 74 -15 89 74 -15 1900 1800 200.89 37.33 2 1 -1 89 69 -20 91 70 -21 2000 1800 209.83 33.87 5 0 -5 86 69 -17 91 69 -22 2100 1200 78.79 17.86 2 2 0 56 48 -8 58 50 -8 2200 275 16.96 6.96 3 3 0 37 36 -1 40 39 -1 2300 275 3.37 2.07 3 3 0 18 17 -1 21 20 -1 TOT 0 100.28 24.83 29 18 -11 1350 1126 -224 1379 1144 -235