nextera letter and slide presentation to nrc seabrook
TRANSCRIPT

NEXTera" ENERGY~
""
u. S. Nuclear Regulatory Commission Attention: Mr. Art Burritt, Chief Branch 3 475 Allendale Ave. King ofPrussiaPA 19406-1415
Seabrook Station Regulatory Conference Information
~ SEABROOK
September 22, 2009
SBK-L-09206
Docket No. 50-443
On August 28, 2009, the NRC issued inspection report 05000443/2009007 informing NextEra Energy Seabrook, LLC (NextEra) of a preliminary white finding. The finding is associated with a failure to establish adequate design control measures to modify a cooling water flange that led to a failure of emergency diesel generator-B in February 2009. In response to the inspection report, NextEra submitted a letter on September 2, 2009 stating our intention to attend a regulatory conference to discuss the preliminary finding.
During a telephone calIon September 11, 2009, the NRC staff provided NextEra with questions related to the significance of the event. Attachment 1 contains responses to the questions.
Attachment 2 contains NextEra's presentation for the regulatory conference on September 30,2009. This is a preliminary version of the presentation, which may change during final preparations for the conference.
If you have any questions regarding this information, please contact Mr. Michael O'Keefe, Licensing Manager, at (603) 773-7745.
Sincerely,
NextEra Energy Seabrook, LLC
Gene St. Pierre Vice President North
NextEra Energy Seabrook, LLC, P.O. Box 300, Lafayette Road, Seabrook, NH 03874

U. S. Nuclear Regulatory Commission SBK-L-09206/ Page 2
Attaclunents:
1. Responses to NRC Questions 2. Preliminary Presentation for Regulatory Conference
cc: S. J. Collins, NRC Region I Administrator D. L. Egan, NRC Project Manager W. J. Raymond, NRC Resident Inspector Document Control Desk

Attachment 1
Responses to NRC Questions

REGULATORY CONFERENCE - DGB SDP Questions from Chris Cahill (and Larry Scholl & Dan Orr), NRC Region 1
September 11, 2009
I. In an early letter from Cummins, the vendor did not support the conclusions of your Electrical Analysis. What was the basis for Cummins to revise the letter sent to you in response to your July 28, 2009 letter? Provide any additional vendor documentation to support the l-of-2 SEPS success criteria.
Respollse: Tlte vendor {eltel' was received 011 08104109 ami was based 011 n qualitative al/alysis. After tlte vel/dol' was I'equested to provide the respollse of tflegellset lIIuler overloaded COlulitiolls factory testillg results were provided by Cummills Oil 08128109,Tllese test results illdicated a (/if.{el'ellt behavior tllat showed improved gel/set respollse, See Figure 1.
Date: <'} -<'"2-tf}
AITACHMENT F EE09·002 Rev.03 Page 31 of 53

REGULATORY CONFERENCE - DGB SDP Questions from Chris Cahill (and Larry Scholl & Dan Orr), NRC Region 1
September 11, 2009
2. The Engineering Evaluation (Rev 2) page 9 credits additional SEPS power based on break-in. I-low were potential derating factors - such as fuel density/energy/restrictions and air restrictions identified in Cummins letter - dealt with?
Response: If tlte oil-site fllel dellsity is /dgftel' tfulIl tlJe fuel used ilurillg jilctOJY testillg (/II
illcl'ease ill powel' of 1% cml be expected. COllvel'sely, if tile OIl-site jilel ilel/sity is less thell (/ (Iecrease ill pOlVer can be expected. The jilCtOJY fuel density is equivalellf to the filel (Iellslly of tlte SEPS procllredfllel al/(l 110 reductioll OJ' iI/crease ill power outpllt is I/eeded.
If the ail' flow tilll'iJlg factOlY testillg was greater tlum tlte {Iii' flolV for the as installed gel/sets tliell a reductioll ill pOIVer output would be e.\pected, C01lversely, iftlte (Iil'flow (1Ii/'illgfilctaI'Y testing was resfl'icted lllO/'e tlum the air flow for tlte as illstal/ed gensets (III if/crease ill power Olllpul woult! beexpecfed, Tlte gel/sets used tile S(llIIe tlirjiltel's durillg testing as tlte illst(/(led IIl1its, At tilejtlctol'jJ test tlte lest cell air illtake lIsed blli/llillg ail' (IS tile sllpply. Tlte (IS il/stallet/ gellsets lIave a more direct OlltdoOI' ail' SIlPPly. Altfloltglt tile {IS illst(/Iled geltsets have tI/IIore direct sllPPly of (illtdool' ail' the evaltmtiol/ cOllsif/el's tile ail' illtake to be eqlliv(t/ell/ ami II pO wei' I'et/llclioll 01' iI/crease does 1I0t I/eed to be used. AIR INTAKE FILTERS
Factory Test Facility Seabrook Station Installation
ATIACHMENT F EEG9-002 Rev. 03 Page 32 of S3

REGULATORY CONFERENCE - DGB SOP Questions from Chris Cahill (and Larry Scholl & Dan Orr), NRC Region 1
September 11, 2009
3. Part 1 - Explain the dynamic response of the SEPS govemor to increase in load. Specifically address the ultimate fuel injection state (the equivalent to fuel rack position). How does the govemor maintain a 4% frequency reduction at a 108% load? Part 2 - If frequency is not reduced by 4%, would the SEPS genset trip on overload? Part 3 - Is there a possibility that operators would take actions to maintain frequency at 60 hz causing the SEPS genset to trip on overload? Part 4 - If the SEPS genset has never been operated above 100% rated engine output, how is the govemor response determined? Provide supporting data.
Response:
Part 1 - The electronic cOlltrol module (ECM) provides two dijJerellt fuel pressures to tile fllel injectors, Rail Pressure, amI Timillg Pressure. Only part of the fuel supplied to tile injectors is actually used to fllel the ellgine. Tile bltfltllce is recirculated back to the fuel day tallk.
Tile Ilormal engine driven fuel pump pressure iv 380 psia. This pressure is cOllstallt alld 1I0t load depe/ldellt.
The rail pressure is themaillfllelsupplytoilljectorsal/dthep}'essure varies with load. At -1400 J(W the pressure is 100 psia. At 2500 lOY the pressure is 175 psia. Tile actuator valve tltat controls J'ail pressure is electronically cOlltrolled ji'om (/ fllel card ill tile eJlgine control pal/el (SEPS-CP-516).
The timing pressure adjusts injector fllel de/ivelY timillg as the name suggests. Tllis pressure also varies wilh load. At -1400 J(W tile pressllre is 92 psia. At 2500 J(W tlte preSSllre is 80 psia. Tlte actuator valve tllat controls timing pressure is also electronically cOlltrolled from tile fuel card ill tile eJlgine cOlltrol panel (SEPS-CP-516).
The fllel card interacts witlt tile eJlgille's electrollic govemor, The fllel card is prograJ/lmed with limits 011 fuel delivery slIch that the raU pl'essllre alld timi/lg pressure actuator valves will not cOlltil/ue to increase fuel pressure ollce those limits ate reachell. Beyond tltat poim additionalloall challges will cause tlte gellset to settle illto a speed below Ihe target 60 Hz. 'There is a file! boost featllre desigJ/ed to handle step load chal/ges alld retul'Jl tlte gellset to target speed, Based 01/ discllssioJls wittz Cummins, the boost feature will provide extra fuelillg for a shott period of time whell speed dtops by abollt 80 rpm. After tllefllel boost times Ollt, tile eJ/gi/le will retul'll to steady state fuelillg.
The steady state bellavior of tile gellset would be analogolls to a truck ill (/ COl/stallt gear Ihat /tas the fuel pedal fully depressed 011 a hill aJ/d the inclille becomes steepel'. The lIet result of the iI/creased load would be a dec/'ease forward speed. Tlte tmcle does /lot stall as long as the lIill does I/ot become too steep.
Part 2 -If voltage IIlId fl'eqlleJlcy are mailltained at rated values, tlte overcllrreJlI setpoi1lt will 1I0t be reaclted sillce the 509 A cUI'J'ellf correspo1lding to tlte lIdjusted base load (2936 kW14.16 kV.>: SQRT 3 x 0.8 = 509 amp) is less tflall tlte Ampsellt/y threshold setting of 511 A (see the
ATTACHMENTF EE09·002 Rev.03 Page 33 of 53

REGULATORY CONFERENCE - DGB SDP Questions from Chris Cahill (and Larry Scholl & Dan Orr), NRC Region 1
September 11, 2009
SEPS Genemtor Protection EVlIllllltioll section ill Appendix A of tlte Engineering Evalllatioll). Also see response to question]2.
Pllrt 3 - Tltere's 110 proceduml guidllllce to control SEPSfreqllency because this pllrameter is controlled automlltically viII a softwllre sl!tpoint. Tltere is 110 capllbility for opemtor fi'equency adjustment.
Part 4 - Based all overload testing pelformed by Cummins 01/ the QSJ(23 genset tltere were 110
(lI1Omlllies identified with govemor operatio1l (luring operatio1l above] 00% rated engine Olltput
Part 1 Response Preparer: Greg F. Sessler
Res onse Verifiel': Richard R. Belan el'
Pa112&4 Kenneth J. Letourneau Randy C. Jamison
David F. Kell
ATTACHMENT F EE09·002 Rev. 03 Page 34 of S3

REGULATORY CONFERENCE - DGB SDP Questions from Chris Cahill (and Larry Scholl & Dan Orr), NRC Region 1
September 11, 2009
4, Are all of the engine subsystems and SUppOlt systems evaluated to handle the overload under the evaluated condition?
Response:
There arefive SEPS gel/set mechanical subsystems:
Lube Oil Eltgille Cooling Fllel Turbo Chargers Exhallst
Lube Oil:
The Inain engiJze lnbe oil plllllp is engille driven. Wilen tile SEPS genselloading reaches tI,e point where engille speed begins to decrease Ille lube oil J)JlI1IP speed will also start to decrease. The pll11lp flow cltallge will be approximately direclly proportiollal to tlte speed change. A slllall change ill lube oil flow willlwt calise engille compollellts to lose lubricatioll or lose tile ability 10 trausfer !teat to tlte oil. However, bftsed 011 energy balallce principles, tltere will bea slllall illcrease ill metal temperatures tlzrollgMut tlte engine. The engille cooliltg system is coupled to tlte Illbe oil system alld tlte small temperatllre cltanges will be passed alollg to tI,e cooling system.
The lube oil temperatllre change between 1400 KW allll 2500 KW is abollt 25 oF. Tlte operating temperature at 2500 KW ill warln ambient lempemtllre is 225 oF.
Based all tltis data tlte expected oil tempemtllre at 2936 KW with warm ambient ail' temperatm'e wOllld be abollt 235 OF.
A speed reduction will have a linear affect ol/flow alld therefore a lillear affect 011 differential temperatllre. Therefore cOllservatively assuming a 150 OF differential temperature illtlte oil system a 4.2% challge in speed 1V0llld add another 7 OF to tire oil temperature. Tflis would be approximately 242 of.
The engine lube oil sIll/Mown is 260 oF.
Ellgine Coolillg:
Tfte ellgille cooling system is comprise(1 of two coaling loops, each witlz its OWII ellgine driven coolallt pump, radiatdr, (lilt! tftermostatic cOlltrol valves. Olle system is a loIV temperature loop primarily for tllrho cl/{/rger compressed {til' coo/illg amI tlte otber is tfte lIigb temperature loop that cools tlte lube oil, ellgille block, a/l{/ power packs (cylinder assemblies). A single large electric motor drivell fall provides airflow througlJ botl! radiators. Tlte radiators are arranged
ATTACHMENT F EE09·002 Rev,03 Page 35 of 53
REGULATORY CONFERENCE - DGB SDP Questions from Chris Cahill (and larry Scholl & Dan Orr), NRC Region 1
September 11, 2009
ill series with tile low temperatllre radiator IIpstream of the high temperatllre radiator ill tire fall airflow palh.
The two thermostatic collfrolul/its modlliate cooling flow ill their respective cooling loops.
The 1I0fltmi coolillg temperature at 2500 KW is 190 OF for the higll temperature loop alld tllis does 1I0t vary sigllificantly with ambiellt air temperatllre. Tile temperatllre c1umge from 1400 KW to 2500 KW is of/ly 10 OF primarily dlle to the ability of tile thermostatic cOlllrol Vldves to adjust flow t/lrollgll tile ellgine. Tile cllallge from 2500 KW to 2936 !VOIllt! therefore be ollly abollt 4 oF. Sillce we kllOlV tllat factoJY acceptallce testillg did IlOt c/Ull/ellge tile coolillg system, bllt we izave 1I0t observed tile bellavior of the system above factory test loads lets triple litis llailiber to 12 oF. Sillce tile failS alld pumJ!S obey affillity laws a correctioll to differeJltial tempel'atllre /Illlsl also be applied. Usillg a simi/al' cOllservative differelltial temperature of 1 02 OF Iile clumge ill temperatllre would be 2 times 5 OF or 10°F.
Tlterefore tile filial coolallt temperature at 2936 KW would he about 212 oF.
Tlte engine Mglt coolflllt temperatllre shlltdowll is 220 oF.
The low temperatllre coolillg loop does 1I0t have all engine s/Ia/dowllfeatllre.
File/:
Tile fllel systel1l lias sigllificallt excess flow capacity. Botll plll1lpS are ellgille drive. The Oilly cOl/sequellce to a sliglztly lower engifle speed would be sliglltly lower recil'culated fuel. Tire behavior of tile ECM tlllit as speed drops at iflcreased loadillg was demolls/ntted by tlte CUllll1lillS test 011 a similar engille.
Turbo Chargers:
The turbo c//(/rgel's are powered by ex/mllst flow whiciz is a fUllctioll of ellgine power, tizerefore tizere should 1l0t be a sigllijicmlt effect olltllrbo charger pelj'or11lallce.
E;thallst:
The exlrallst stacks are velY large alld tltere would be a Ilegligible effect based Oil flolV rates at /dgller ellgille loads.
E/ecfl'ical Subsystems
.The SEPS gellset electrical sllbsystems cOllsist of lite PCC-3200 cOlltrol cabillet, fuelprimiflg pl/lltp, stm'ters alld gellset sellsors. Tlte PCC-3200 provides 11I01litorillg, l1Ieteriflg, ami cOlltroL The cOlltl'ol provides all operator illteiface to the gellset, digital voltage reglliatioll, digital govemillg, gellemtor set pl'otectiofl alld alltoll/atic pal'lllleliflgfullctilJ/ls. The control power is deriveli from tile gellset startillg batteries. Tlte voltage operatillg rallge is 8 VDC to 35 VDC.
ATIACHMENTF EE09-002 Rev.03 Page 36 of 53

REGULATORY CONFERENCE - DGB SDP Questions from Chris Cahill (and Larry Scholl & Dan Orr), NRC Region 1
September 11, 2009
The starting batteries are charged by all engine driven alternator and 120 VAC battery charger. A slight reduction in engine speed will a/so cause a slight reducti01l ill a/temator speed. This slight speed reductioJl wil/have a minim!l/ affect 011 alteJ'llator Ol/tpllt, The 120 VAC charger I/{IS an operating range 0/ +/-10%. The 120 VAC supply is provitled tltrouglt a 480/120 VAC transformer. Tile calculated voltllge at tile 480 VAC supply is 444 VAC. Using tlte +1-10% range/or tlte cllarger tlte minimum voltage at tile 480 VAC supply JVollltlneed to be 432 VAC. Based 011 tltis assessment tlte PCC-3200 woultl J'eceive adequate voltage to peJiorm tlte reqllired/tmctions amI all gel/set sel/sors would provitle tlte required signal$. The /tIel priming pump alld starters are Ito 10llger required after tile gel/set lUIS started.
Electrical Sub stems
ATTACHMENT F E£09-002 Rev.03 Page 37 of 53

REGULATORY CONFERENCE - DGB SDP Questions from Chris Cahill (and Larry Scholl & Dan Orr), NRC Region 1
September 11, 2009
5. At the calculated 4% frequency decrease, how is the stability of the machine assured? At this elevated load, would the control system be capable of responding to changes in load? For example, if a pump were tripped off, would the engine overspeed?
Response: Wlle1l load is tlpplied to tile geJ/erato/; tile gel/set I engine speerl drops. As speed falls, tlte ellgine speed governor increases fueli1lg, tlte sltaft torque drives tlte e1lgine I generator back toward tlte I'flted speed I frequency. When tile torque from lite applied load "Iltrouglt tlze generator" is less t!zall tlte sltaft torque supplied by tlte increased fueling, tltell tlte engille and gel/set accelerate back to tlze rated speed, al/(I "settle ill" at lite rated speed.
Wilen> 100% load is applied, the beltavior is tile same, except tlte ul/it would "settle in" below lite rated speed. This lVollld be wllere the applied load (now IOlVer actual load dlle to tlte lower steady state speed) "throllgll tlte generator" equals the net sltaft power of tI,e engine. Tlte engil/e speed governor will drive the engine to maximl/m flleling allli power at tile eql/ilibrillm speed.
Wilen (I large load is cycled off the engine speed goverl/or will temporarily deliver reduced fueling al/d tIJe decrease ill lIet torque will decelerate lite gellset toward tlte rated speed. PJ"Ototype tests showell t!tat 011 a Fill! Load Rejectioll tltefollowillg results were obtained:
Voltage Rise: 15. 7 % Recovery Time: 2.5 Secolld Frequellcy Rise: 4.3 % Recovery Tillie: 1.1 Secolld
Althollglt tlte gellset would be operating at a Itigher (oad t/tall tested tile govel'1lor lVould be capable ofrespolldillgfor a load less thUlI tltefullload rejection.
C.Jamison
ATIACHMENTF EE09-002 Rev.03 Page 38 of 53
REGULATORY CONFERENCE - OGB SOP Questions from Chris Cahill (and Larry Scholl & Dan Orr), NRC Region 1
September 11, 2009
6. In reference to ANSI C50.41-2000, American National Standard for "Po Ii - phase Induction Motors," how do you meet the requirements of Section 13.1, specifically section C.
Response: Section 13.1 permits iflduclion motor operatitm al rated load with variatiOlls of (a) +/-10% voltage with ratedfrequem:y, (b) +1-5%frequency with rated voltage, and (c) combined voltage and frequency of 10% provided freqllency is withitl +/-5% of rated, These are the same limits as provided ill NEMA Standard MG-l, Section 12.44.1 to whicll Seabrovk's molvr were purchased (ref. specification 128-1),
Tlteft'equency reductioll witll Olle SEPS gcnset supplying the LOOP load is 4.2%, wlticll is witllill tile +/-5% allowance,
Attachment C provides terminal voltages for variolls loads when supplied by olle SEPS genset. Tile maximlltll voltage reduction at lite tenllillals for all IIIOlo/'s is 9.4% whiclz is witllillthe +10% allowallce.
For tile 4000 V motors, tile maximum voltage redllctioll at tile motor terminals is 4.2% wlliclt when combined witlt tile 4.2%freq{lency reduction results ill 8.4% wlzich is within tile 10% combilled allowance. Aboulltalf of the 460 V motors reqllired for safe slll/tdoWll meet the 10% combined criteria. Tile otller half exceed tile 10% criteria with tlze worst case being a voltage redllctiollat tile motor ter111illa/sof9.6% wltiell wlle1l combined with tlze 4,2%ft'equeflcy redllctioll reslllts /fl 13.8%. Tlte 460 V 1I10tors tllat e,xceed tile 10% criteria are acceptable as follows.
Tile termillal voltages provided in Attachment C were determined using tile cOl/servative loading developed ill tile SEPS loadiflg calculatiofl vs. tile actllalloading discllssed ifl Appel/di>: A oftlte Ellgifleering Evaluatioll. A sel1sitivity voltage dl'op case was rJl1lllsillg tile ETAP program witlt blls loat/iflg more represefltative of tile actllallOfldiflg al/alyzed ifl AppeiulixA of the E1Igineering Evaluatioll. Tile results showed a 1-2% improvemellt ill the 460 V IItOtOl' voltages with a few 1II0f'e of tile safety related motors meetillg tlle 10% comhined criteria. TIle relllailliJlg motors are discllssellfllrtller ill thefol/owing pllragraphs.
A literatllre searcllllsillg text books amI the if/temet was cOl/dllcted amI motor velldol's were consulted to determine tile effect of ti,e reduced voltage {tl/dft'equellcy 011 tile motors til at still do 110t meet tile 10% combilled cf'iteria. The results are asfollows.
Tile most sigflijiCallt effects of the redllced voltage amI frequellcy operatioll (Ire iI/creased motor fleatillg alld a redllctioll in the available horsepower (ltp) the 1110tOl' can supply. These effects are illterrelated ill tllat tile temperature will increase if the Slip plied /zp remaills the sallie as the voltage alldfrequeflcy are redllced bllt tile tempe1'lltllre increase will be millimizelt if tile lip required by the loads decrease as tlte voltage alld frequency reduces.
ATTACHMENT F EE09-002 Rev.03 Page 39 of S3

REGULATORY CONFERENCE - DGB SDP Questions from Chris Cahill (and Larry Scholl & Dan Orr), NRC Region 1
September 11, 2009
Tlte temperature illcrease is typically ill tlte rallge of 6-r c. Given the motors' inslilatioll ratings, this relatively small illcrease ill tempel'atllre would /lot be all immediate fai/ul'e COllcem but could effect the 10llg tel'm insulatioll life if tlte motors operated at tile reduced voltage alld frequency for (m extended period of time. COllsiderillg tile relative short duration of a LOOP evellt as compared to the molors' qualified life, tlte increased temperature should 1101 effecl the capability of Ihe motors to pe/form their safe slzuttloUJfI fllllctiolls. Also, the lemperature illcrease should 1I0t be as great as expected as explailled ill tlte lIext paragraplI.
As explailled ill tlte affillity a1lalysis sectioll of Appendix A of fhe EllgilleeriJlg Evalllatioll, tile pOJVer l'equired by tlte centrifugal pUlllpS (wd fails will be re(iuced to 88% of that required at rtttedfrequency. Most safety reluted 460 Vmolol's are operated at a IIp less tltal/rated. Most of these motors also "uve a service facIal' of 1.15. Together, these.jactors mean l!tat tlte acillal motor load at the reduced voltage alldfrequency sltould be close to tile available capacity such that lite temperature increase shol/id be less than discllssed in the previous paragraph,
It was also foulld Iltal 60 Hz rated molors could gellerally be operated all a 50 Hz system as 10llg as the voltage was relluced 10 mailltaill tile appropriate volts per Iterlz ratio (Vt1Iz) ratio for acceptable motor excitatioJl alld lite motor load was appropriately reduced to limit motor Ilealillg. Tltis provides suppaI'I for acceptable motol' operatioll for tlte sillgle gellset cOllliitioll since tlte reduced voltage alldfrequellcy is less Illall tile 60150 Hz operalioll alld lite Vt1Iz ratio is slightly redllced.
As discussed ill tlte respollse to Questiollll, the crew may take a procedure deviatioll to reduce ellgille load prior to TSC activatioll. At tltat time, vollage (lIId frequellcy W01l1d retllm to rtIted elimillatillg Ihe reduced voltage amlfrequellcy operatioll COllcel'll.
Based 011 the above discussioll, it is coneluded tllat 'lte safety related motors are lIbTe 10 pelf arm their Slife shutdowlI fllllCliolls givell tlte reduced voltage am/ ji'equellcy conditioll for tlte slilgle gel/Sel operatioll, See lite response to qlleslioll 14 f01' adtlitiollal disCllssioll of the effect all motors of/he reduced voltage alldji'equellcy.
ATTACHMENT F EE09·002 Rev,03 Page 40 of 53

REGULATORY CONFERENCE - DGB SDP Questions from Chris Cahill (and larry Scholl & Dan Orr), NRC Region 1
September 11, 2009
7. What is the impact on instrumentation, transformers, and component protection and bus work at reduced voltage & frequency?
RespoJ/se: Seabrook's electrical equipmellt procuremellt specificatiolls typically illclllde power source requireme/l(s witll (I +/-10% voltage alld a +1-5% frequellcy variatioll, as applicable, with 110 specifre requirement to cOllsider combilled variatiolls. In general, electrical compollellt alld cable overcurrent protectioll is sized with a millimulII 1.25 margill so load operatioll at reduced ji'equellcy amI voltage should Ilot result ill spuriolls protective device tripping.
BIIS lVork is 1I0t directly affected by tlle reduced voltage aud frequellcy operutioll, alld there is slIfficiellt lIIargill ill blls ratillgs to accept any illcreased currellt from loads opeJ'{ltillg at reduced voltage flIldfreqllellcy.
Tramformer loadblg should decrease because tile overall load decreases (see questioll 14). Since tile % voTtage decrease is greater thall the % frequellcy decrease, the Volts per Hertz (V/Hz) ratio will be less at tlle redllced voltage fllldfrequellcy poillt so trallsformer excitatioll should 1I0t be a cOl/cel'1l. Likewise, PT alld CT excitatiotl would 1I0t be affected so that they 1:(111 peiform tlteir fUl/ctialls to support electrical protectioll.
Plallt instmlllel/tatioll is typically powel'ed ji'OIII IlIIitlterl'llptible power supplies (UPSs) so the illstrllmellfatioll power SOl/rce is 1I0t directly affected by tlte voltage alld frequellcy variatioll. The UPS has a /'ectifier sectioll supplied by tlte 460 V ac power system alUl an illverter sectioll supplied by the outPllt of file rectifier 01' tlte statioll 125 V dc power system. Because of tlte rectificatioll process, it is expected tflllt the voltage aud freq1lellcy variatioll will lIot effect the rectifier's dc Oil/put. If it is degraded, tltell the il/verter would cOlltillue to operate all the 125 V dc power system providing adequate power to the illstrumentation. Il1stl'llmelltatioll that is Slip plied ji'om the 120 V ae power system is expected to inelude all il/pllt pOlVer SIlPPly which JVould isolate tile instrumentatioll from tlte voltage ami ji'equellcy variatioll.
Tlte station battery cltargers are simi/ar to tlte UPS rectifiers mell that it is expected tltat tile voltage alld ji'eqllellcy variatioll will not affect the charger's dc alit put. If it is degraded, thell the dc system IVolildoperate from tlte statioll batteries wllicll have sufficiellt capacity (i.e., gre(lter tltall 4 Ilollrs) Illltil tile operators take appropriate actiolls to res/ore voltage alld freque1lcy. Based all tltis discussioll, it is cOlleluded that tile 1I011-lIIotor loads 01/ tlte (tc system will tlot be degraded by tile reduced voltage alld frequellcy ill a mallller tflat will effect tlteir capability to peiform tlteir safe SllllidoJVlljilllCtioll. Motol'S are addressed itl Q1Iestioll 6.
Rand C. Jamison Date: Kenneth J. Letoumeau Date:
ATTACHMENT F EE09-002 Rev.03 Page 41 of 53
REGULATORY CONFERENCE - DGB SOP Questions from Chris Cahill (and Larry Scholl & Dan Orr), NRC Region 1
September 11, 2009
8. What loads start on the sequencer - specifically for SEPS? How does operation of sequencer impact single SEPS operation? Is the sequence timing based on the recovery of the large power source?
Respollse:
Tile emergency power sequel/cer (EPS) starts the S(lme safe shutdowfl loads wltetlter tlze emergency bus is I'e-energized after a LOOP by tile emergency diesel generator, both SEPS gellsets operatillg ill parallel, or ol/e SEPS gellset. As discussed ill Appelldix A of the Ellgilleeriflg Evalllatioll, tile sillgle SEPS geJlset load after tlze EPS completes load sequenciJlg exceeds tlte adjusted base ratillg. The acceptability of tllis exceedellce is (lemollstl'll/ed ill tile evaluatioll and tile respollses to tllese questiolls. Tile variolls loads w'e assiglle(lto specific fixed EPS time steps to limit the magllitllde of tlze load step (lIId allow tlze (liesel gellerator voltage audfreq//eucy to recover to acceptable levels prior to st(IJ't of tile loads at tile uext step. The Ulillillllllli EPS tillle step iJlterval is 5 secollds. Surveillallce testillg shows that tile emergellcy diesel gelleratol's (latge power source) are able to restore voltage alld frequellcy prior to st«rt of tile loads all Ilze Ilext EPS step. Tile SEPS demollstl'lltioll test showed tlzat two SEPS gellsets operatillg ill parallel could likewise restore voltage a1l(1 frequency prior to start of tlze loads 011 tlte lIext EPS step. No specific site sequellce testillg is available for tlte sillg/e gellsel operatioll. ell/llmitlS provir/ed prototype test data for step /0(1(/ adtiitiolls of 0-50%, 50-100%, 75-100%, alld 0-100% of rated loall Iflllt sllOwe(l a sillgle gellset couid recover voltage alldfrequellcy itl at least 3.6 secOi/tis which is less tltall the 5 secOlu/s. It is also 1I0tetl tllat for tile LOOP evellt beiJlg analyzed, tlte large 4160 V motors are actually starter! witlt atlellst Olle step between tit em providillg at least 10 secollds for recovery,
ATTACHMENT F EE09-oo2 Rev.03 Page 42 of 53

REGULATORY CONFERENCE - DGB SDP Questions from Chris Cahill (and larry Scholl & Dan Orr), NRC Region 1
September 11, 2009
9, Part 1 - How is the failure-to-run question evaluated? If one engine trips after successful loading, how would the remaining machine respond? Part 2 - If that machine trips, what procedural guidance is available for recovery?
Respollse:
Pllrt 1 - SEPS electrical margill mmlysis is based 011 a siflgle SEPS DG beillg available at tlte begilllliflg oj tlte scellario (i,e., the secolld SEPS DG Jails to start). If botll SEPS DGs illitially start, the load all Bus E6 may exceed the max load capacity Jor olle SEPS DG as additiollal loads that are added by procedure. If aile SEPS DG Jails to cOlltiulle to rUII, the remaillillg SEPS DG couid trip off 011 overload I'esultillg ill allotller loss oj power to tile bl/s.
Part 2 - Operators would re-ellter ECA-O. 0 iu resp01lse to tile statiou blackout ji'tJm trip oj the SEPS gellSet aud peJjol'm copillg actiolls wlziclt iuelude startillg SEPS. If remote pOlVer restol'llti01l Jrom the Mcn is 1Iot successJul, Operators would disable pump loads pel' Step 6 alUl attempt local actiolls to restore emergellcy blls power source, iueludillg startillg SEPS ill Step 8 alld Attachment D. Ollce (III emergellcy bus is euergized, crew wOllld either (1'(IIls}tiou to ECA-O.1 OJ' ECA-O.2 both oj witiclt provide SEPS loading guidance prior to startiug pumps that were (/isabled ill ECA-O.O step 6.
Part 1
David F. Kell
ATTACHMENTF EE09-002 Rev.03 Page 43 of 53

REGULATORY CONFERENCE - DGB SDP Questions from Chris Cahill (and Larry Scholl & Dan Orr), NRC Region 1
September 11, 2009
10. Besides the loads identified in ECA-O.O, what other loads may be on the bus initially and added by the subsequent procedures?
Respollse: For a LOOP (1101l-SI) slllrt, 110 additioll(r1lollils would be expected to be 011 tile bus initially. If only olte SEPS DG is operlltillg, ItO additio11al loads 1V0uld be added ill the short term bllsed 011 tile procedllre guidallce ill Attachmellt A of ECA-O.O.
ATTACHMENT F EE09-002 Rev.03 Page 44 of 53

REGULATORY CONFERENCE - DGB SDP Questions from Chris Cahill (and Larry Scholl & Dan Orr), NRC Region 1
September 11, 2009
11. Part 1 - How long could a single SEPS operate under the proposed conditions? Part 2 -When can it be assumed that operators would take action to reduce load below 100%?
Response:
Part 1 - Wlrell tire gellset is loaded above tlte adjusted base ratillg the speed of the engille reduces resultillg ill a slight llecrease ill /reqllellcy al/d voltage alld settles ill at a cOl/stall1 speed. If tile load challges such as a reductioll ill load tlte gellset is regulated to the llew load lIlItii the gellset reaches the equilibrium poillt. This cyclical operatioll call cOlltil/lle for abollt 250 /tours based 01/ prototype testil/g. As part of Pl'ototype testil/g Cummills condllcted a durability test. During tMs test the generator set WllS subjected to (I millimu11I of 250 hours elldul'(///Ce testillg ami was operated at variable loads to verify structural soulldlless alld durability of tlie- design.
Part 2 - Operators would be loclllly mOllitorillg SEPS status ill approximately 20 mill utes of the station blc(c/wul evellt. At this point, tile Operatillg crew woultl determille if tILe engine load exceeds procedure upper limit aud cOllslllt witll plaut eugineerillg for guitlallce. Tlte crew may take a procedure deviatioll to reduce ellgil/e load priol' to TSC activatioll. The TSC, wlticlt is staffed witllill aile 110111', 1V0llld provide gllidllllce to redllce SEPS 1(llId as lIecess(//y withill tlte SEPS missioll time.
Part 1
David F. Kell Kenneth J. Browne
ATTACHMENT F EE09-002 Rev.03 Page 45 of 53

REGULATORY CONFERENCE - DGB SDP Questions from Chris Cahill (and Larry Scholl & Dan Orr), NRC Region 1
September 11, 2009
12. In the event that the engine perfOlIDs better than analyzed, what would be the impact on overcurrent protection?
Response:
If tlte el/gine peiforms better l/u/1I expected slIch tllat tile engine speed does not decrease to tire same level, frequency and voltage woultf be slightly Iliglter alld tire load 1V0uid not decrease as IItl1cIz wizen using tile affinity law ami tlte load current would increase slightly_ Wizell considering tile fiLlI adjusted buse loud of 2936 kW mid /lOrmal fi-eque1lcy a1ld voltuge the generutor outpul currellt 1V0uid be 509 umps ( 2936 kW/4.16 kV X SQR1' 3 x 0.8 = 509 amp). Tlte overcurrellt tltreslLolrl selling of 511 umps for lI,e AmpSelllry wOllld 1I0t be reached.
To de/nons/rate the effect if tlte engine performs better tlia;;. expected sue!; thut the engine speed does 1I0t decrease to the same level, a case will be analyzed lVitlI a fi'eqllency redllcllon between ruted frequellcy (110 drop) alUl the 4.2% worst case from tlte test. For example, if jreqlle1lcy were 10 decreased by 3.0% tlte voltage 1V0ulddecrease by approximately 4.25% (See Figure 1). Applying tile affinity lilw tlte load would also decrease. WI/ell cOllsideri1lg l/zis example the ge1lerator Olltpllt currellt would be:
Portion of Adjusted base Load applicable to the affinity law = 2936 x 80% =2349 kW
Load not applicable to the affinity law = 2936 kW - 2349 kW = 587 kW
Affinity reduction (Power is proportional to the cube of shaft speed)
Affinity reduction @ 3%/58.2 Hz = (58.2/60)3 = 0.913
Affinity reduced load =2349 kW x 0.913 = 2145 kW
Total load at 58.8 Hz = 2145 kW + 587 kW = 2732 kW
4.25% voltage reduction: = 4016 volts <<<.9575)( 4194 = 4016
Amperage at reduced voltage and reduced power:
I = P/ (V x SQRT 3 x PF) = 2732/(4.016 x SQRT" x 0.8) = 491 amps At this intermediate point the current level of the AmpSentry setpoint is not reached.
AMPSENTRY threshold setting = 511 amps AMPS ENTRY 110% setting = 515 amps
ATIACHMENTF EED9-002 Rev.03 Page 46 of 53

REGULATORY CONFERENCE - DGB SDP
Questions from Chris Cahill (and Larry Scholl & Dan Orr), NRC Region 1 September 11, 2009
Therefore, if the engine pe/forms better tflan e:l.pected sucll that the engine speed does I/Ot decrease to the same level, tile resulting current will be less tlum tlte tllresllOlfllimit sllch that tlte ovel'Clll'ren! protection will not trip.
ATTACHMENT F EE09-002 Rev.03 Page 47 of 53
REGULATORY CONFERENCE - DGB SOP Questions from Chris Cahill (and Larry Scholl & Dan Orr), NRC Region 1
September 11,2009
13. For a single SEPS operation, are there any additional operator actions? If so, have HRAs been completed?
Respollse:
No additiollaloperator actio1ls are required for 10llg term load mallagemellt. HoweveJ', ECA-0.0 Attachment A provides guidance for single SEPS loading. Operators are illstructed /wt to exceed SEPS load limit prior to staNing pumps. Subsequent actions for SEPS load management are 1I0t explicitly modeled ill tile PRA. Such actiolls would be considered long term actiolls, pelj'ormed ill COllsIlltation witll system experts including tlte TSC staff, I/I/d wOllld be (!).pected to be highly reliable.
David F. Keli Kenneth J. Browne
AITACHMENTF EE09-002 Rev.03 Page 48 of 53
REGULATORY CONFERENCE - DGB SDP Questions from Chris Cahill (and Larry Scholl & Dan Orr), NRC Region 1
September 11, 2009
14. The combination of reduced voltage & frequency impact the efficiency of the motors and such things as magnetizing currents. Did you evaluate these conditions for each load to ensure the total load (magnetizing and working current) does not cause you to reach the generator overcurrent setpoint?
Respollse:
Appendi:.: A of tile Ellgineerillg Ewt/u{ftioll evaill{fte(l gellerator overcurrellt protectioll cO/lsideri1lg both reduced frequency {flU/ voltage. First, the effect of tile reduced frequency 011 tlte celltrifug{fl pump Ulld fUll 1Il0tor loud wus {fccollnted for ill tlte uffillity rule u/lalysis by reducillg tlte power required by tlte 11I0tors by a cubed fill/ctioll/rom 2349 kW to 2067 kW. Second, tlte remaillillg 587 kW of 1I01l-celltrifugal pU11IP {fIld fall motor load was cOllservativeiy (fSSllfllea to be COI1St{fllt power iO(fas, i.e., IlOt reduced by tite reduced frequellcy. Third, these were combilled to provide a total load at tlte reduced frequellcy of 2654 kW (2067 kW + 587 kW). Tltis tot(f/ load W(fS thell divirletl by tlte 8% rel/ucell voltage of 3860 V to provide a workil1g currellt of 496 A. Usillg tlte milli1llul1I voltage results ill a worst C(fSe maximum cUI'rellt, i.e., the lower tlte voltage for a givell load, tile /tiglter tIle cllrrmt. Tile 496 A is less tflall tfte 51lamp Ampselltry threshold settillg so the electrical protectioll wlllltot trip. Mag1tetizi1tg Cllrrellt decreases ill direct proportioll to tile voltage reductioll so its cOlltribution was 1I0t separately quafltified.
ATIACHMENT F EE09-002 Rev.03 Page 49 of 53

REGULATORY CONFERENCE - DGB SDP Questions from Chris Cahill (and Larry Scholl & Dan Orr), NRC Region 1
September 11, 2009
Lotourneau, Kenneth
From: Sent:
cary.j,[email protected] Friday, August 28,2009 12;29 PM Letourneau, I(enneth: Jamison, Randy; Kotkowsld. Gerald To;
Co: Subject:
Weaks. Doug; COllins. Michael; Noble, Rick; [email protected] Voltago versus Frequency for QSK23-G3 Test
Ken. Randy and Geny.
Per our discussion. please find here the updated voltage curvo attached showing the actual points run on our tests.
Cary
T(tstina ofOSK23 .. G3 EI\{finEf on Ganser
'104.0%
r-~-Steady State Voltage ~, i,.· 102.0% t----------------{L-...:.:...:=:::::...=~===--~-1
oHaga Doc(eased ... '!iIh Decreased Frequency When Addillonal Load
,, _________ ~~~--=.-=-P=.E=~~~tooenem!=t=o=r==========~
92.o% ~==================~---go.o% +------r-------.------,-----------r-----''''---,-------i
0% 1% 2% 3% 4% 5% E%
Ste~dy Sate Frequl9ncy (% Dro» from Bn$elin~Fr~qu~ncy) '------------------------------------'
Cary J. Marston Chief Engineer, G-Drive Engineering Cummins Power Generation
Voice: 012-377-8333 Cell: 812-343-3992
Figure 1 EE09-002 Rev. 03 Page 50 of 53

REGULATORY CONFERENCE - DGB SDP Questions from Chris Cahill (and Larry Scholl & Dan Orr), NRC Region 1
September 11, 2009
Letourneau. Kenneth
From: Sent: To: Cc;
Subject:
Ken.
[email protected] Friday, August 28, 2009 7:09 AM Letourneau, Kenneth Ws.eks, Doug; Kotkowski, Gerald; [email protected]; Collins, Michael; Jamison, Randy; Noble, Rick RE: FW: FW: Cummins LeUer for Seabrook Stalion Generator Sets
Here are the plots we discussed last night. These show the results obtained for a QSK23-G3 engine on a genset from our test facility.
The first figure shows the stea~y state power versus fre.que.ncy for operation below the target frequency. This is generated by adding load above 100%, which "lugs the engine I genser' dOVln to a lower speed I frequency.
'rhe second figure shows the volts I hz curve for these tests. Please note that lhe voltage at 4.2% lower frequency, is 92% of the baseline voltage.
The second figure shows the same data, with the "customer load" data you provided, based oil your analysis. The intersection of these curves occurs a,t a frequency 4.2% beloVi the baseline frequency, This Is where the genset road matches the "customer load".
Sincerely,
Cary
1
Figure 1 EE09-002 Rev,03 Page 51 of 53

REGULATORY CONFERENCE - DGB SDP Questions from Chris Cahill (and larry Scholl & Dan Orr), NRC Region 1
September 11, 2009
Te$litl!J or QSK23-G3 E'lUinoO on G ........ t
108.0%
-+--stmldy State Gens.ff Power ~ 1 06 .0% -1-----::J
~ ~ 'J 04 .0% +-r.E'iIO~C::lrl;C,;:.:f1 "o;:ut;:P::utC:D;;;."'"'r.""~'d:f--"I---..'::::=:::··-=--=--:::···:::·'··'·::.-=-=-=-=-:::'-=======--j e- ~ with Incmase LoadAp.,Ued 10 8·x '102.0% Oenerato( _____ ~I---- '" r "'S'
.~ ~I 00 .0% r\:~-=;:,j,;;;;;;;:;:::====~-----1 "'-iii * to 98.0% ...
., 96.0% ~-
94 .0% .~===-=-=-::;:, =====..".------..... -,.-----,-0% 1% 2% 3% 4% 5% 6%
Ste.dy S~t .. Frequency (% Drop from B ... ellne F""lueney) '---------------_ ... _ .•.•.•. _ .. -_._-----------'
resting of OSK23·G3 En(Jino on Genset
104.0%
102.0% -1---- « Stea(ly State Voltage
w ~10D.OO~ ~------.------------_c----::=============~ Q)w ~o Q:> 98.0% ::::g ,,= " "' 'j; ~ 96.0%
,, _________ --'~-----Ivoftage Oacreasedwlth Decroased Frequency WI\enAddillonal Load
,, ______________ ~~~-~A=p=p="'\edtoOenefrn=t=or==========~J "Ill .!!! .... W.(. 94,0% +'=2. ~
92.0% +J~~~~====~====~-------~~~------~
90.0% +-----,----.-.-,----,-----,---'_-.------{ 0% 2% 3% 4% 5% 6%
Ste.dy SMa Frequency (% DroOp from B .. "II ..... Fr"qu" ... ey)
2
Figure 1 EE09-002 Rev.03 Page 52 of S3

REGULATORY CONFERENCE - DGB SDP Questions from Chris Cahill (and Larry Scholl & Dan Orr), NRC Region 1
September 11, 2009
Te$1In(J of OSK23·G3 Elluine 011 Gell$et
108.0% 1 - ........ Stea(1y State GensetPawer ~ 106.0% . .,. CU$tome~s Load (Affinity Law)
'" ~ 104.0% l"'''''''''''''''''''='''''''===..----=============::.] "" '"" Elsclric:al Output Decreased So § wah Increase Load Applied to 8 .~{ 102.0% Generato( ~~ .~ .5 1 00.0% ~~ .... ~J;;.:;;;;=====::::-.-----\ .!!!* w ~ 98.0%
Ul .... Q 96.0% Maximum Stearlf State
i I
j I
$ !
~ I I i
LP=o=we=r===8=.~s~~I=n.====~-r ____ ~ _____ .-______ -r ______ ~ 94.0% .. ----.. -
0% 1% 2% 3% 4% 5%
Ste.dy Sot" FI'equ"llcy (% Drop from 6.solloe frequency)
Cary J. Marston Chief Engineer, G·Drlve EngIneering Cummins Power Generation
Voice: 812·377·8333 Cell: 812·343·3992
3
Figure 1 EE09·002 Rev.03 Page 53 of 53
8%
Appendix A
Electrical Analysis of SEPS Capacity
September 22, 2009
Kenneth J. Letoumeau l6tf ~t4llA 4M d{! _ Preparer for Appendix A
Randy C. Jamison gQr~~ ;2, @M (~~!~ Independent Reviiwer To Appendix A
09'22-0") Date
Date
EE09·002 Rev. 03 Page 8 of 53

APPENDIX A
TABLE OF CONTENTS
TITLE PAGE
TABLE OF CONTENTS 9
ENGINEERING EVALUATION 10
ATTACHMENT A - LOADING FOR ONE SEPS DG PROFILE 21
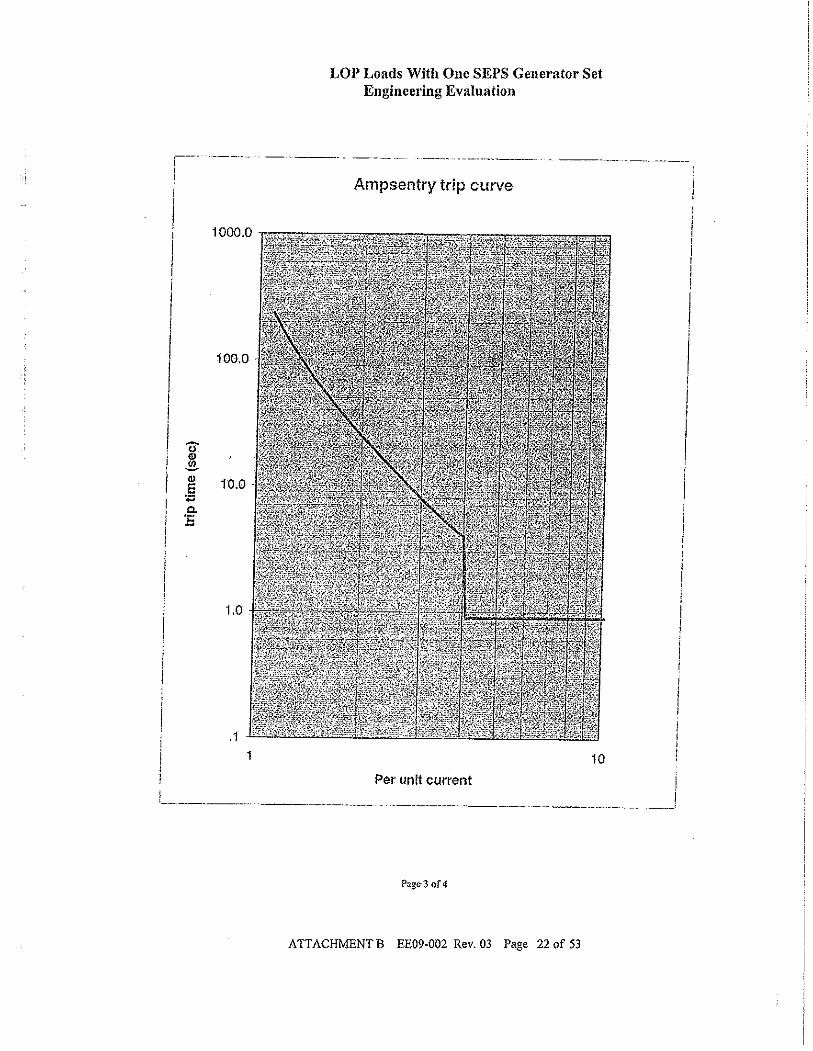
ATTACHMENT B - AMPSENTRY TRIP CURVE 22
ATTACHMENT C - ETAI' VOLTAGE STUDY RESULTS 24
ATTACHMENT D - FREQUENCY REDUCTION ON PUMP PERFORMANCE 26
ATTACHMENT E - FREQUENCY & VOLTAGE RESPONSE GRAPHS 28
ATTACHMENT F - 09/11109, NRC QUESTIONS WITH RESPONSES 31
EE09·002 Rev. 03 Page 9 of 53

LOP Loads With One SEPS Generator Set Engineering Evaluation
The Supplemental Electrical Power System (SEPS) provides two diesel generator (DG) sets for powering the emergency loads during a Loss of Power (LOP) event. This evaluation will determine if one SEPS DG can support the emergency loads based on actual rWllling values.
The design of the SEPS is capable of providing the required safety related loads in the event of a loss of offsite power if both emergency diesel generators fail to start and load. During these events it is assumed that there is no seismic event or an event that requires safeguards actuation (SI, CBS, CVI, CI, etc.). Selection of the required loading connected to SEPS is based on PRA Evaluation 03-007. In addition to providing powel' to the required loads, the total combined output of the SEPS system can supply eithet the RHR pump or the SI pump. The analysis conservatively includes the RHR pump but it would not be sequenced on unless already running prior to the LOP. The SEPS system equipment except the emergency bus breakers are classified as non-safety-related, non-Class lE, non-seismic (Safety Class N) and are not within the requirements ofthe Operational Quality Assurance Program (OQAP).
The Supplemental Electrical Power System provides two 2700 kW (3375 kVA) gensets for a total of 5400 kW capacity with a slight reduction for SEPS auxiliaries (138kW). The highest total calculated load for Bus E6 load is 4425 kW. The emergency power requirements are based on a modified (LOP) load and are described in Calculation C-S-I-38016. During commissioning a test was performed which simulated an LOP event with SEPS aligned to Bus E6. The recorded results show the total connected load after the completion of Emergency Power Sequencer (EPS) step 12 as 2903 kW with a voltage of 4183 volts at SEPS-CP-l.
The rating of a single SEPS generator is 2832 kW (105°C) and the nominal engine gross output kWm is 2790 kW (3740 BHP). The generator 125°C rating is 3024 kW.
An extended load duration factory test was conducted on each genset. Genset B04K395120 obtained an output of2717 kWand genset B04K395130 obtained an output of 2727 kW. The achieved output for these tests are considered the nominal base rating.
After gensets have operated 100 hours the available output increases by one percent as provided by Cummins. This increase is attributed to engine break in. Once the engine operates approximately 100 hours the fi'ictional losses are reduced which increases the available power for output generation. When applying this factor to the test results the available output capacity for genset B04K395120 increases to 2744 kWand genset B04K395130 increases to 2754 kW. These ratings are referred to as the adjusted base rating. The output capacity for genset B04K395 120 the smaller of the two is used for calculations in this evaluation since the loading can be supplied by either gense!.
Cummins Power Generation Division was contacted to ascertain gense! response data during overloaded conditions. The text and tables below provide the expected results for the Seabrook Cummins gensets.
EE09-002 Rev. 03 Page 10 of 53

SEPS Load Evaluation
LOP Loads With One SEPS Generator Set Engineering Evalnation
The SEPS system was tested by Complex Procedure OS05-0 1-02 and documented on Work Order WO 0513168. The test perfOlmed a simulated LOP event with SEPS aligned to Bus E6. The recorded results show the total connected load after the completion of Emergency Power Sequencer (EPS) step 12 as 2903 kW with a voltage of 4183 volts. This is 66% of the calculated load as shown in calculation C-S-I-38016. The loading evaluation will use the actual recorded value since it is more indicative of the real loads as compared to the calculated load.
The SEPS loading was measured at SEPS-CP-I control panel using a Square D Digital Power meter Class 3020. Using the vendor's specifications in FP35421 the accuracy is determined as follows:
Power function meter accuracy (PA) = +/- 0.5% (reading) +/- 0.05% (Full scale adjustment) = +/- 0.55%
Meter drift (MD) = assumed +/- 0.5%
Instrument transformer accuracy (IA) = +/-0.3%
Reading Accuracy = ..J(IAi + (PA + MD) 2 = " 0.09% + 1.1 % =1.09%
Using + 1.09% meter accuracy the kW load reading is applied to the actual test value.
2903 kW x 1.0109 =2935 kW
The test alignment for service water, PCCW, and charging pumps was the same as for responding to an actual LOP using procedure ECA 0.0, Loss of all AC Power.
With only one SEPS genset numing 60 kW for the radiator cooling fan for the INOP genset can be subtracted from the total recorded load. Since the load metered point during the test was at SEPS-CP-l the SEPS auxiliaries were not measured. To account for these loads an additional 78 kW is added to the test load resulting in a load of3013 kW.
SEPS auxiliary loads = 138 kW (Ref. Calculation C-S-I-38016)
138 kW - 60 kW = 78 kW
2935 kW + 78 kW = 3013 kW
During testing all of the 4 k V motors were operatiug in similar conditions as in an LOP event except the RHR and the EFW pump motor. Under normal filII power operations with an LOP without SI the RHR pump would not be loaded on at step three of the load sequencer if it was not already operating before the LOP. During the glycol leak the RHR pump was not operating
EE09·002 Rev. 03 Page II of 53
LOP Loads With One SEPS Generator Set Engineering Eyaluation
which is typical during normal power operations. The RHR pump motor would account for a further reduction. The RHR pump was in the recirculation mode during the test with a load of 203.2 kW. The reduction of203.2 kW would result in a total load of2810 kW.
3013 kW -203.2 kW = 2810 kW
The RHR pump was operated on 02/24/09 for 39 minutes for surveillance. This evaluation assumes the pump as not being available as an emergency load. The PRA evaluation will address the probability of this pump being available as an LOP load.
The EFW pump was in the recirculation mode during the test with a flow of approximately 225 gpm and BHP of 560 (94MMOD52S). In actual operation, the EFW pump, at 650 gpm, requires 720 BHP. This 160 HP difference would result in an additional load to the obtained test load of 125.9 kW resulting in a load of 2936 kW.
2810 kW + 125.9 kW = 2936 kW (2936 kW will be used as adjusted base load)
During the period of 02/02/09 to 03/01/09 the selector switch S8-5441 for FAH-FN-llB was in the NORMAL mode which would not allow the fan to be sequenced on during an LOP except for the time that a surveillance was being performed. Specifically, this fan was on for twelve hours to perform surveillance during the evaluated time period on 02/06/09. When the fan is in the NORMAL mode a deduction of 53 kW is used to reduce the load to 2883 kW.
2936 kW - 53 kW = 2883 kW
However, during this same period that the FAH fan was available (in NORMAL mode), CAHFN-ID was not available for an automatic start during an LOP. When c.onsidering the 106 kW for this fan during this period the SEPS loads would be reduced to 2830 kW.
2936 kW - 106kW = 2830 kW
The FAH fan was also available for a time period between 2/20/09 and 02121/09. The attached plot shows the FAH fan ruillling at the same time the CBA B Train equipment was not available. For all other times this evaluation assumes the FAH fan as not being available as an emergency load during the evaluated period and not included.
The Control Building CBA system equipment CBA-P-435B and CBA-CP-178 were included as loads during the SEPS demonstration test. Pump CBA-P-434B or CBA-P-435B is selected to run but not both for a load of 13 kW. When one of the pumps is in operation the CBA chiller control panel CP-178 also operates with a load of 67 kW. During the evaluated period up until 02123/09, this equipment was in OFF and not available for an automatic stmt for an LOP event. When the equipment was not available the total emergency load would be reduced to 2803 kW.
2883 kW - 13 kW - 67 kW = 2803 kW
EE09-002 Rev. 03 Page 12 of 53

LOP Loads With One SEPS Generator Set Engineering Evaluation
To detelmine a more precise loading fot the evaluated period, the following table and attached plot were used showing the various equipment availability and loading. The following composite loading shows the major time periods and load variations using the adjusted base load of2936 kW from the demonstration test.
Date(Time) Unavailable Loads Base Load Deduction kW Available Load kW 211109(2330) to CBA-P-434B/435B
13]-2697
2/6109 (0105) CBA-CP-178 67 239 FAH-FN-llB 53 CAH-FN-lD 106
2/6/09 (0105) to CBA-P-434B/435B 13}
2750 2/6/09 (1127) CBA-CP-178 67 186
CAH-FN-lD 106 2/6/09 (1127) to CBA-P-434B/435B
13]-2697
219109 (1013) CBA-CP-178 67 239 FAH-FN-llB 53 CAH-FN-lD 106
2/9/09 (1013) to CBA-P-434B/435B 13 } 133
2803 2/20/09 (0504) CBA-CP-178 67
FAH-FN-IIB 53 2120/09 (0504) to CBA-P-434B/435B 13
:::t- 80 2856
2/20/09 (1713) CBA-CP-178 67 2/20/09 (1713) to CBA-P-434B/435B 13
} 133 2803
2/23/09 (803) CBA-CP-178 67 FAH-FN-llB 53
2/23/09 (0803) to FAH-FN-llB 53 2883 311109 Adiusted Base Load 2936
Calculation C-S-I-38016 also analyzed operation of the Cooling Tower pumps on the SEPS DGs. The Train B Cooling Tower pump was not operating between 212109 and 03/01/09 and does not need to be included in this loading evaluation. The Cooling Tower pump and fans are only operated periodically and not included in the nomlal base load.
EE09-002 Rev. 03 Page 13 of 53
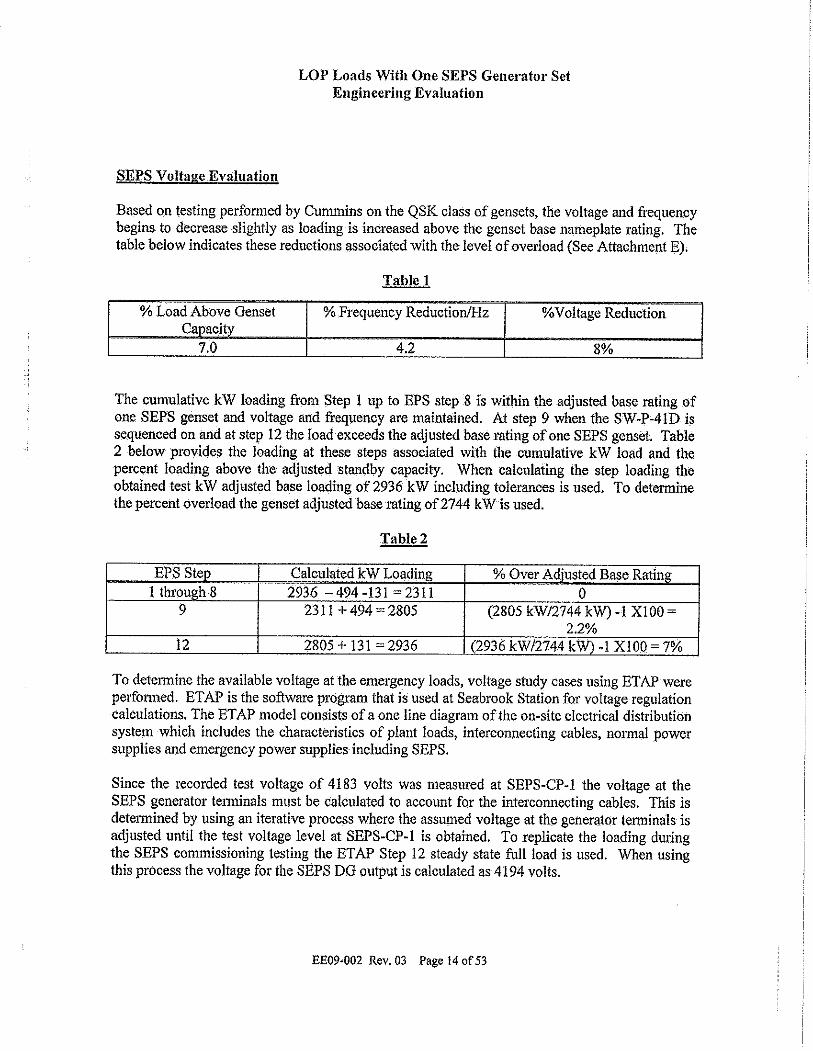
SEPS Voltage Evaluation
LOP Loads With One SEPS Generator Set Engineering Evalnation
Based on testing performed by Cummins on the QSK class of gensets, the voltage and frequency begins to decrease slightly as loading is increased above the genset base nameplate rating. The table below indicates these reductions associated with the level of overload (See Attachment E).
Table 1
% Load Above Genset % Frequency ReductionIHz %Voltage Reduction Capacity
7.0 4.2 8%
The cumulative kW loading from Step I up to EPS step 8 is within the adjusted base reting of one SEPS genset and voltage and fi'equency are maintained. At step 9 when the SW-P-4ID is sequenced on and at step 12 the load exceeds the adjusted base rating of one SEPS genset. Table 2 below provides the loading at these steps associated with the cumulative kW load and the percent loading above the adjusted standby capacity. When calculating the step loading the obtained test kW adjusted base loading of 2936 kW including tolerances is used. To determine the percent overload the genset adjusted base rating of2744 kW is used.
Table 2
EPS Step Calculated kW Loading % Over Adiusted Base Rating 1 through 8 2936 - 494 -131 = 2311 0
9 2311 + 494 - 2805 (2805 kW/2744 kW) -I XIOO-2.2%
12 2805 + 131- 2936 (2936 kW/2744 kW) -I XIOO - 7%
To determine the available voltage at the emergency loads, voltage study cases using ET AP were performed. ET AP is the software program that is used at Seabrook Station for voltage regulation calculations. The ETAP model consists of a one line diagram of the on-site electrical distribution system which includes the characteristics of plant loads, interconnecting cables, normal power supplies and emergency power supplies induding SEPS.
Since the recorded test voltage of 4183 volts was measmed at SEPS-CP-I the voltage at the SEPS generator lelminals must be calculated to account for the intercOlmecting cables. This is determined by using an iterative process where the assumed voltage at the generator terminals is adjusted until the test voltage level at SEPS-CP-I is obtained. To replicate the loading during the SEPS commissioning testing the ETAP Step 12 steady state full load is used. When using this process the voltage for the SEPS DG output is calculated as 4194 volts.
EE09·002 Rev.03 Page 14 of 53

LOP Loads With One SEllS Generator Set Engineering Evaluation
Voltage case studies were performed for steps 7 (FW-P-37B start), 9 (SW-P-41D strut) and for the steady state loading after step 12 which will be referred to as step 12P. For the motor statting cases the previously struted loads are analyzed as running. For step 12P all loads are analyzed as running.
During starting conditions the voltage dip at the generator tetminals is determined by the generator lock rotor statting curve contained in Calculation C-S-1-380l6. This curve is used for study cases 7 and 9. The curve is based on 4160 volts and is adjusted for the SEPSDO output voltage ([100 - % DROP] X 4194). For EPS Step 12P the generator output voltage is reduced by 8% for a 92% DO terminal voltage (92.8 on a 4160 volt base) as a result of the 7% overload. Table 3 below provides the generator terminal voltages that are used for these study cases.
EPS Step 7 (5051 skVA) 9 (4010 skVA)
l2P
Table 3 [2]
% Transient Voltage Drop 24 20 8%
SEPS DQ % V9!!!lge 76.6 3187) 80.7 3357) 92.8 3860)
The obtained voltages at these steps for the equipment are listed in Attachment Cand are evaluated below.
Per REG GUIDE 1.9 the general industry practice is to specifY a voltage reduction of 10-15 percent when starting large motors from large-capacity power systems, and a maximum voltage reduction of 25-30 percent when starting these motors from limited-capacity power sources such as diesel generators. When evaluating the results of the calculated voltages using for the ET AP study cases a maximum voltage reduction between 25-30 percent will be us.ed.
Voltage study case for Step 7 calculates the voltage reduction fot the loads when the EFW pump (FW -P-37B) is started. The calculated voltage for the 4 kV 1Il0tors are in the tange of 78.5% to 78.9%. The calculated voltages for the 460 volt loads are in the range of 72.8% to 78.7%. Using the criteria in REG GUIDE 1.9 the calculated voltages during starting ofthe EFW pump are acceptable.
Voltage study case for Step 9 calculates the voltage reduction for the loads when the Service Water pump (SW-P-41D) is started. The calculated voltage for the 4 kV motors are in the range of 82.3% to 83.2%. The calculated voltages for the 460 volt loads are in the range of 77.4% to 83%. Using the criteria in REG GUIDE 1.9 the calculated voltages during stalting of the SW pump are acceptable.
Voltage study case fOI' Step 12P calculates the steady state voltages for loads when the SEPS DG is overloaded by 7%. The calculated voltage for all 4 kV motors and 460 volt loads receive more than 90%. Using the criteria in REG GUIDE 1.9 the calculated voltages during steady state conditions are acceptable.
EE09-002 Rev. 03 Page 15 of 53
LOP Loads With One SEPS Generator Set Engineering Evaluation
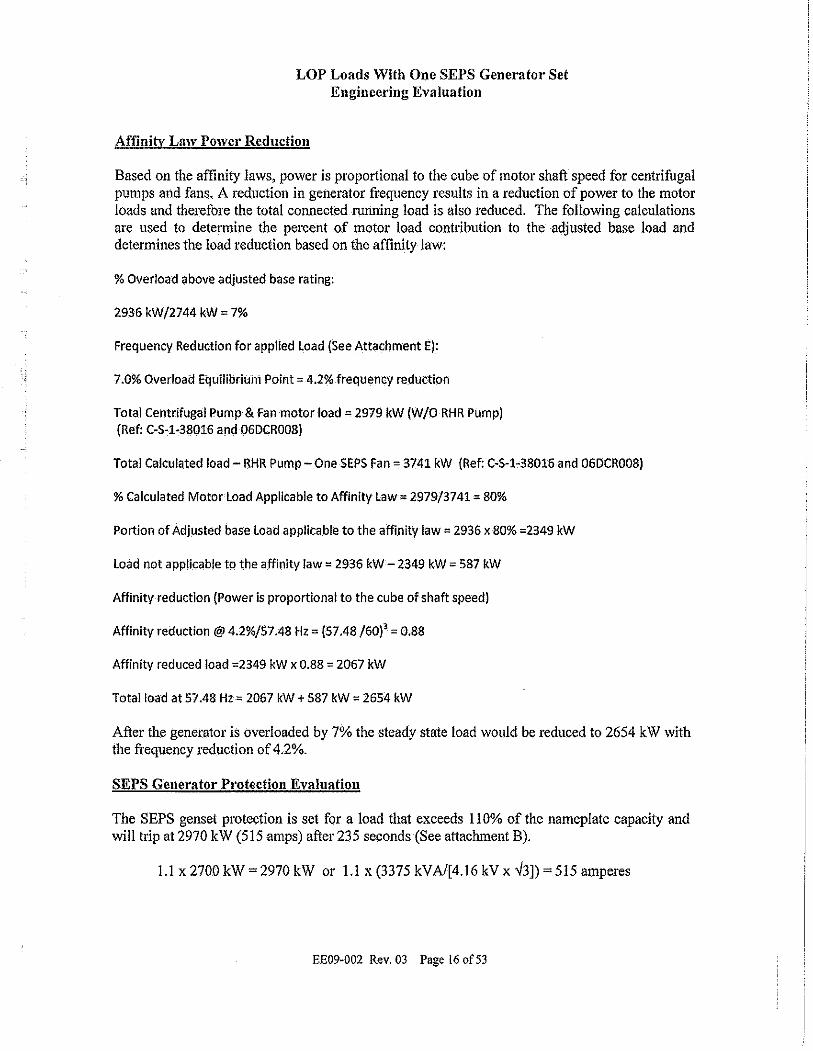
Affinity Law Power Reduction
Based on the affinity laws, power is proportional to the cube of motor shaft speed for centrifugal pumps and fans, A reduction in generator frequency results in a reduction of power to tile motor loads and therefore the total connected lUmring load is also reduced, The following calculations are used to determine the percent of motor load contribution to the adjusted base load and determines the load reduction based on the affinity law:
% Overload above adjusted base rating:
2936 kW/2744 kW = 7%
Frequency Reduction for applied load (See Attachment E):
7,0% Overload Equilibrium Point = 42% frequency reduction
Total Centrifugal Pump & Fanmotor load = 2979 kW (W/O RHR Pump) (Ref: C-5-1-38016 and 06DCROOS)
Total Calculated load - RHR Pump - One 5EP5 Fan = 3741 kW (Ref: C-5-1-38016 and 06DCR008)
% Calculated Motor load Applicable to Affinity law = 2979/3741 = 80%
Portion of Adjusted base load applicable to the affinity law = 2936 x 80% =2349 kW
load not applicable to the affinity law = 2936 kW - 2349 kW = 587 kW
Affinity reduction (Power is proportional to the cube of shaft speed)
Affinity reduction @4,2%/57.48 Hz = (57.48/60)' = 0.S8
Affinity reduced load =2349 kW x 0.88 = 2067 kW
Total load at 57.48 Hz = 2067 kW + 587 kW = 2654 kW
After the generator is overloaded by 7% the steady state load would be reduced to 2654 kW with the frequency reduction of 4.2%.
SEPS Generator Protection Evaluation
The SEPS genset protection is set for a load timt exceeds lJ 0% of the nameplate capacity and will trip at 2970 kW (515 amps) after 235 seconds (See attachment B).
1.1 x 2700 kW = 2970 kW or 1.1 x (3375 kV AI[4.16 kV X'\13]) = 515 amperes
EE09-002 Rev.03 Page 16 of 53

LOP Loads With One SEl'S Generator Set Engineering Evaluation
The overcurrent protection is provided by AmpSentry which is part of the generator protection integral to the PowerCommand control. The AmpSentry uses input signals from instrument transformers that sense the generator output. To determine the accuracy of the CUlTent loop an assumed accuracy of +/- I % will be used. When using this accuracy and applying to the 110% trip setting the minimum trip point is determined as follows:
(110% - 1%) x 2700 kW = 2943kW 01'
(110%-1%)(3375 kVN[4.16kVx ;13])=511 amperes
A load of 109% or 2943 kW will be used as a conservative threshold since the generator long time overload protection at the generator control panel is disabled below 11 0% with consideration of the accuracy ofthe overload protection.
The 2943 kW corresponds to a threshold current of 2943kW /(4.16 kV x 3 SQRT x 0.8) = 511A
The adjusted base load corresponds to a load current of 2936 kW/(4.16 kV x 3 SQRT x 0.8) = S09A
When the running load exceeds the adjusted base genset rating the diesel engine encounters a slight drop in speed. As a result of the slight drop in speed the steady state power reduced with a drop in voltage to 92.0% (8% Voltage reduction) and frequency decreases by 4.2% fora load of 7.0% over base capacity. Power is pl'Opo11ionaI to the cube of shaft speed. A reduction in frequency results in a reduction of power and therefore the total1Ulming load is also reduced to 2654 kW (See affinity law reduction above).
With a voltage reduction of 8% in generator output voltage of 4194 v the output voltage would be 3860 volts. The drop in voltage and frequency will also result in a drop in the steady state loading. To determine the current level of the load when this occurs the steady state power reduction from applying the affinity law and expected voltage reduction will be used.
8% voltage reduction: (See Table 3) = 3860 volts
Total load at 57.48 Hz = 2654 kW
Amperage at reduced voltage and reduced power:
I = PI (V x SQRT3 x PF) = 2654/{3.86 x SQRT3 x 0.8) = 496 amps
AMPSENTRY threshold setting = 511 amps
When using 109% of the genset nameplate capacity it can be seen that one genset would not trip on long time overload for a nOlmal base load of 2936 kW when the power consumed by the motor loads are reduced from the decrease in frequency.
EE09-002 Rev. 03 Page 17 of 53
LOP Loads With One SEPS Generator Set Engineering Evaluation
The maximum calculated load for the normal base load of 2936 k W does not exceed the generator winding thermal limit (125°C). Pel' the generator test certificate the 125°C load capability is 3024 kW.
SEPS Diesel Engine Evaluation
The diesel engine has a power output rating of 2790 k W (flywheel) fOT Standby Service. This rating is less than the ultimate capability of the engine because of inherent conservatism in vendor ratings.
Typically maximum engine power is controlled by the power limiter setting. This setting can be set to limit the maximum power output of the engine. This setting has been disabled such that there is no governed power limit. If the engine monitol'ing parameters are within range, the genset limitation is the generator protection. When monitoring the engine parameters during periodic surveillance tests it was observed that the lube oil and Jacket water cooling systems had high margins to the shutdown points during full load operation. This would indicate the ability to support an increased load above nameplate.
Based on Cummins testing of similar QSK gensets with the same control system aud fuel system the engine response to various incremental load increases over the nominal base rating resulted in slight decreases in frequency and voltage. Although there was a decrease in voltage and fi'equency the engine continued to operate. As discussed in the loading evaluation, the engine is capable of supporting a generator overload over the adjusted base rating to supply the adjusted base load.
Based on the testing (See Table 1) the overClU'rent is likely to trip first since the frequency reduction for 110% overload would not reach the under frequency setpoint. Since the load is not expected to reach the 110% trip point or under frequency trip setting the engine should support the load.
If the load exceeds the engine adjusted base rating there will be a slight decrease in engine speed. Based on the evaluation in Attachment D it was detennined that the safety related pumps would operate to perform their safety related functions with a 4.2% frequency reduction on the SEPS generator.
EE09·002 Rev. 03 Page 18 of 53

Operator Action
LOP Loads With One SEPS Generator Set Engineering Evaluation
Operating a SEPS genset over nameplate rating for an extended period of time is not desirable. In the event that this condition was to occur there is sufficient time to reduce loading after personnel are dispatched to the SEPS equipment enclosures to detel1l1ine the running status.
Emergency Operating Procedure ECA-O.O provides actions to restore emergency bus power in response to a station blackout event. ECA-O.O step 5b provides actions to close the SEPS supply breaker to the emergency bus in the event the main Emergency DGs fail to start. It is estimated that time for the connecting the SEPS DGs to the bus is approximately eight minutes. Once the sequencer connects loads to the bus, ECA-O.O step 5j provides direction to maintain SEPS load limit per Attachment A. This Attachment provides direction to locally dispatch personnel to the SEPSequipment to determine status and load condition. It is estimated that time. to arrive at the SEPS gensets is approximately 10 minutes of being notified by control room. In the event that only one SEPS DG is running and SEPS-CP-5 or CP-6 indicates an overload kW condition, SEPS DG-2N2B Panel SEPS-CP-S/6 local alalID responses would direct operators to reduce load (Ref. LAR-SEPS-CP-5 or LAR-SEPS-CP-6). ECA 0.0, Attachment A also provides instruction to limit start of additional pumps to prevent exceeding SEPS nameplate load capabilities. This action will provide the necessary steps to manage the loading within the nameplate capabilities in the event of an alarm condition and provide the assurance of continued operation of the genset to supply the safety related loads.
References
[1] Calc. C-S-I-38016 (06DCR008); Supplemental System Voltage Regulation
[2] FP35489 2195350 001 .SEPS Genset Data Package
[3] EMAIL,8/27/09, C.J.MarstonlK.Letoumeau (CumminslNextera); Genset response to overloaded conditions
[4] EMAIL, 8/24/09, C.J.MarstonlK.Letoumeau (CumminslNextera); % Overload, frequency & voltage reduction
[5] EMAIL, 8/19/09, C.J.MarstonIK.Letourneau (CumminslNextera); Gensel adjusted base capacity basis
[6] Work Order 0513168; Perform SEPS Demonstration Test on Bus E6
[7] FP35421; Square D Digital Power Meter Class 3020
EE09-002 Rev. 03 Page 19 of 53
LOP Loads With One SEPS Generator Set Engineering Evaluation
Conclusion
When considering the loading profile for the evaluated period of 02/02/09 to 03/01109 and the adjusted base load (2936 kW), the total load is within the capability of a single SEPS genset. The single genset can supply the load without tripping. The loading above the adjusted base rating resnlts in a drop in generator frequency and voltage. The safe shutdown loads can perform their function to mitigate the LOP event at the reduced voltage and frequency values.
See Attachment F for the responses to questions received from the NRC; these responses provide additional support that the safe shutdown loads can perfonn their function.
Prepared by: Kenne/h J. Le/oumeall Date:
Kd'~~C»>- O~-Z2-0?
Reviewed by: Ralldy C. Jamisoll Date:
,$JI(;t R.·J>1M/~.),r/ ffi!~ <f-CZ-d')
MeChaniCalt~"E~lIlaSA. Schulz . Date:
(Systems Input,,&, ~ ".. .si::. H.J4~ PH" ~1..1J!o(o.t ,;a;h MeChalliC2'A:tt~ng ~ieG::'~ut) Chl'is/ille J. Crollill Date:
1/zzi.f'( Approver:" ie/mel b C(ZIIS 0:
\ , \. 1 ) D~e)AA J c'1
EE09·002 Rev. 03 Page 20 of 53

3000
2800
2600
~ 2400
2200
2000
LOP Loads With One SEPSGenerator Set Engineering Evaluation
AITACHMENT A PAGE 1
LOP Loads With One SEPS Generator Set Engineering Evaluation
LOADINGUFORONE SEPS DG --I
GENERATOR CAPABILITY (3024 kW) ....................................................................... ··i·09%GENERATClRClVERCURRENT··(2943kiiii) ...... ··· .. · ...... ··· ............................................. . = :-_-_-:-.=.=.-;:: .. :-:: ... "":"~~.= = -:-_-_-:':::::: = .~~-:"-=--=-.-=---:.":"'_-_""':. = = :-_-_-:'.=-=.-=--=-"":"_-...:::-. = = ':'""_--;:.:-;-=== .--::"-=-"'7-=-.=-."":.,- -:""_-_""':. = = :-_-=
""" ENGINE NAMEPLATE RATING (2790 kWm) 2803 2803 2863 ADJUSTED BASE LOAD (2936 kVV) .~ .. -. . .-. .. ,.-._._._._._._._._._-
21;197
I __ L~ I 1 __ 1 2J2-nJO ;ue...o105
2f6..1127 2/0.1013
TIME
2120.(1$04 ~ 3.11..0012 2120-1713
NOTE; PLOT DOES NOT INCLUDE THE RHR PUMP SURVIELANCE OF 39 MINUTES ON 02124/09
AITACHMENT A EE09-002 Rev.03 Page 21 of 53
I ~ 10.0
'" Co E
1.0
.1
1
LOP Loads With One SEPS Generator Set Engineering Evaluation
Ampsentry trip curve
Per unit current
,----~ .. ,--.--... '---'--~-'-~-'
Page 3 of4
ATTACHMENTB EE09·002 Rev.03 Page 22 of 53
10
--~

LOP Loads With One SEPS Generator Set Engineering Evaluation
PowerCommand control Amp Sentry Time-Over-Current Characteristic Table
t=43.5/(1·.67)A 2
Pltgc 40f 4
ATTACHMENTB EE09-002 Rev.03 Page 23 of 53

LOP Loads With One SEPS Generatol' Set Engineering Evaluation
ETAP RESULTS
ATTACHMENTC PAGE lOF2
BUS AND MOTOR VOLTAGES DURfNG SEPS DIESEL GENERATOR LOAD SEQUENCfNG FOR
BUSE6
Equip, 7 9 12P SEPS-DG-2A or 2B 3187 3357 3860
SEPS-SWG-l 3177 3347 3854 SEPS-CP-l (A5C) 3162 3332 3845
BUS-6 3162 3332 . 3845 CS-P-2B 3157 3328 3841
CC-P-llD 3157 3327 3841 SW-P-4lD - 3290 3834 FW-P-37B 3140 3324 3838
US-61 352 372 431 MCC-611 351 372 430 DG-C-2B - - 429 MCC-612 350 371 430
PAH-FN-42B 346 367 426 EPA-FN-47B 342 363 423
CS-P-3B 335 356 417 EAH-FN-31B 341 362 422 FAH-FN-llB 344 365 424
EAH-FN-180B 335 357 418 AS-V-176 348 368 426 EDE-I-IB 348 369 428 EDE-I-IF 348 369 428 SW-V-5 345 365 424
MCC-614 349 370 429 SWA-FN-38B 347 368 427
SW-V-29 347 367 426 MCC-6IS 351 372 431
CC-P-322B 339 360 420 FW-FV-4214B 346 366 424 US-62 361 382 442 EAH-FN-5B 352 373 434 CBA-CP-178 356 377 438
MCC-62I 361 382 441 CBA-FN-32 - - 440
CBA-FN-16B 358 379 439 RH-FCV-611 355 375 434
EDE-I-lD 359 380 ._-':-=--
440
EE09·002 Rev. 03 Page 24 of 53

LOP Loads With One SEPS Genel'ator Set Engineering Evaluation
ETAP RESULTS
Equip, 7 9 12P US-63 362 379 434
CAH-FN-IA 355 373 429 CAH-FN-lB 355 372 428 CAH-FN-lD - 372 429
SA-SKD-137B - - 423 MCC-631 361 378 434
CS-P-243B 352 370 426 CS-HCV-190 347 363 416 CAH-FN-2B - - 425 CAH-FN-2D - - 427
US-64 364 384 443 MCC-641 364 384 443
SWA-FN-70 362 383 441 SEPS-PP-I 366 385 444
ATTACHMENT C PAGE 20F2
EE09-002 Rev. 03 Page 25 of 53

LOP Loads With One SEPS Generator Set Engineering Evaluation
Frequency Reduction on Pump Performance
Following a LOP event, ECA 0.0 verifies that the following pumps are running:
Charging pump Thermal barrier cooling pump PCCWpump EFWpump SW or cooling tower pump
Cummins has indicated that for the anticipated single SEPS genset loading following a LOP, a frequency decrease of approximately 4.2% could occur. Accordingly, these pumps will be evaluated for operation at reduced frequency.
PROTO-FLO Version 6.0 was used in this evaluation. PROTO-FLO is a Windows based program used to perform steady-state analyses of thermal-hydraulic systems. Seabrook currently has two PROT-FLO models developed for the Service Water System and the Emergency Feedwater System. For the Charging Pump, PROTO-FLO was utilized by inputting pump curve data and then reducing the speed of the pump by 4.2% to obtain the reduced pump curve data.
Thermal Barrier Cooling Pump
Thermal barrier cooling flow is 214 gpm (SDS 8/20/09 0900) or 53.5 gpm/RCP. In accordance with the reactor coolant pump vendor manual, W120-21, the minimum required flow to the thermal barrier cooler ill 40 gpm. The actual flow is 33.75% greater than this minimum flow requirement. Sufficient margin exists to ensure adequate flow with 4.2% underfrequency.
Service Water Pump
In the LOP alignment, the service water system is required to deliver 7800 gpm to the PCCW heat exchangers and 900 gpm to the diesel generator heat exchangers (Ref: 4.3.08.57F). The existing ProtoFlo model of the service water system was modified by adjusting the existing pump to 95.8% of its design speed. The resulting heat exchanger flows are 10,533 gpm and 1,991 gpm respectively, which are higher than the minimum required. There is no adverse impact on service water system flows from the 4.2% underfrequency.
Emergency Feedwater Pump
The EFW system is required to provide a minimum of 470 gpm to three intact steam generators or 470 gpm to 2 steam generators. The existing ProtoFlo model of the EFW system was modified by adjusting the existing pump to 95.8% of its design speed. For all combinations of 2 or 3 steam generators, flows exceed the minimum required flow of 470 gpm (544-546 gpm for 2 SG, 615 - 616 gpm for 3 SG). There is no adverse impact on EFW flows from the 4.2% underfrequency.
ATTACHMENT D EE09-Q02 Rev.03 Page 26 of 53
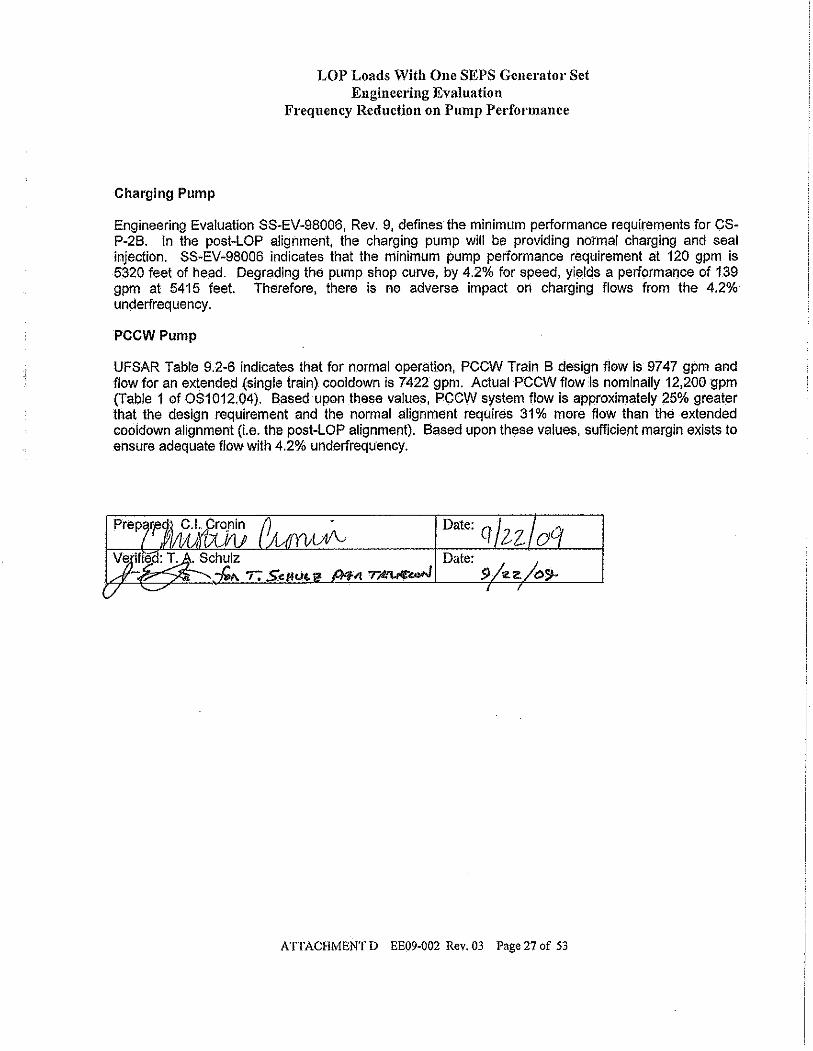
Charging Pump
LOP Loads With One SEPS Generator Set Engineering Evaluation
Frequency Reduction on Pump Performance
Engineering Evaluation SS-EV-98006, Rev. 9, defines the minimum performance requirements for CSP-2B. In the post-LOP alignment, the charging pump will be providing normal charging and seal injection. SS-EV-98006 indicates that the minimum pump performance requirement at 120 gpm is 5320 feet of head. Degrading the pump shop curve, by 4.2% for speed, yields a performal)ce of 139 gpm at 5415 feet. Therefore, there is no adverse impact on charging flows from the 4.2% underfrequency.
PCCWPump
UFSAR Table 9.2-6 indicates that for normal operation, PCCW Train B design flow is 9747 gpm and flow for an extended (single train) cooldown is 7422 gpm. Actual PCCW flow is nominally 12,200 gpm (Table 1 of OS1012.04). Based upon these values, PCCW system flow is approximately 25% greater that the design requirement and the normal alignment requires 31 % more flow than the extended cooldown alignment (I.e. the post-LOP alignment). Based upon these values, sufficient margin exists to ensure adequate flow with 4.2% underfrequency.
Date: II r~""" 5)
ATTACHMENT D EE09-002 Rev. 03 Page 27 of 53
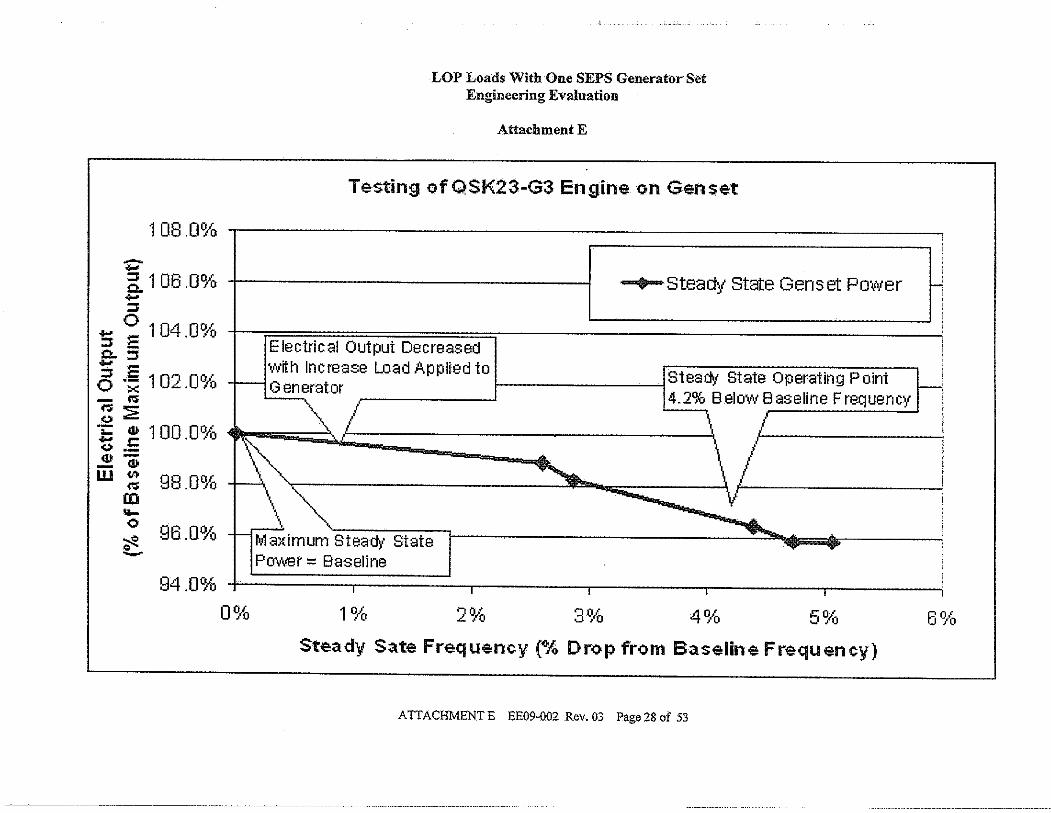
108.0%
-.;;::;-~ 1 06.0% .. :::I
'5 ~ 104.0% C:.:::I ; S o 'x 102.0% - ~ ~2 <>
";: ill 100 00' .. C .;to <> .-ill -_ ill
W : 98.0% OJ .... o ~ - 96.0%
84.0%
I--
LOP Loads With One SEPS Generator Set Engineering Evaluation
Attachment E
Testing ofQSK23-G3 Engine on Genset
• Steady' State Genset PO'lIver
Electrical Output Decreased with Increase Load Applied to Steady State Operating Point Generator 4.2% Below Baseline Frequency
~L -.l L
~ --.... ~l \~ -- . .. -........
r-~imum Steady State . . Power:: Baseline
, . 0% 1% 2% 3% 4% 5~{,
Steady Sate Frequency (% Drop from Baseline Frequency)
ATTACHMENT E EE09-002 Rev.03 Page 28 of 53
I
~ i I i
;--
J
6%

LOP Loads With One SEPS Generator Set Engineering Evaluation
Attachment E
Testing ofQSK23-G3 Engine on Genset
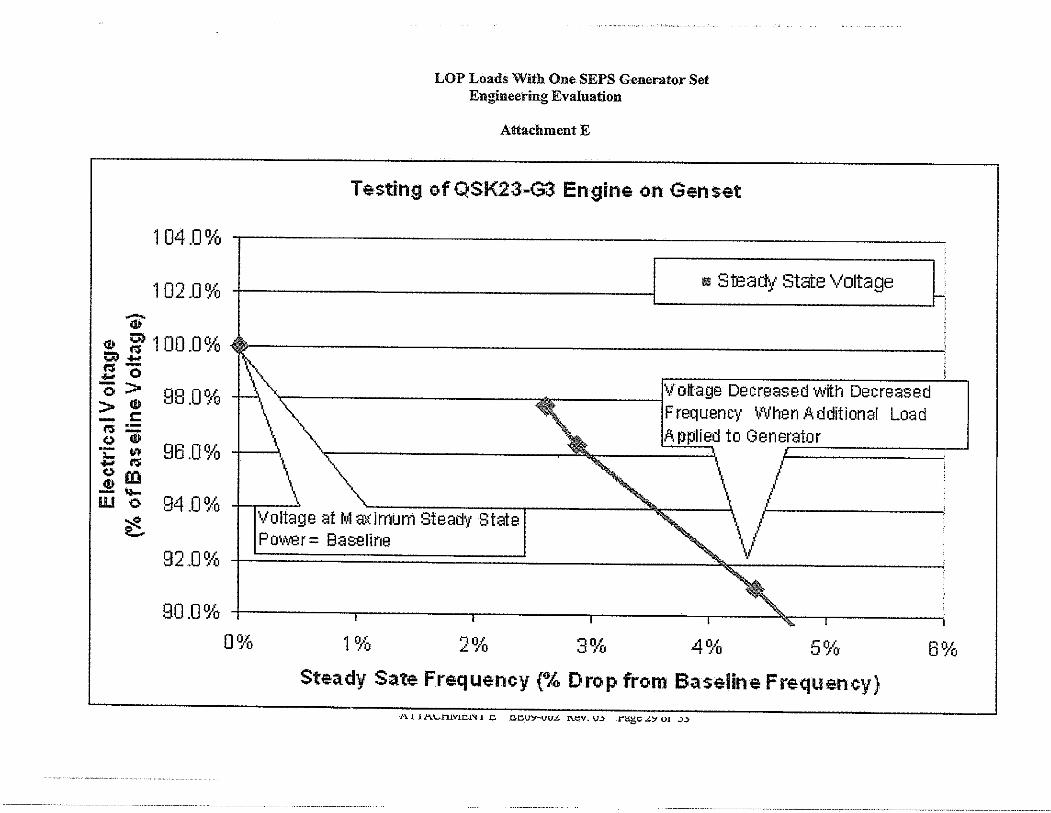
104.0% ~------------~-------------------------------------
1 02.0 % I Il!I Steady State Voltage
~ l--------------------------------------------==========::==~~= 111 ~ 100.0%. ljJo .... ~.... 0 "0:;; 98.0% " IVofiage Decreased WITh Decreased
" .. Frequency When A dditional Load > c: r.i:: .~ = 96.0% '.
\" ..... 1.A.pPlie~ to Genej:.p::::t=o=r=====:::-, .... ~ ~m
iii '0 94.0% Ilvolta'ge at M a:<imum Steady State ~ Power= Baseline
92.0% I ~ 'I
90.0% I " -0% 1% 2% 3% 4% 5% 6%
Steady Sate Frequency (% Drop from Baseline Frequency)
ATTACHMENT E EE09-002 Rev.03 Page 29 of 53

LOP Loads With One SEPS Generator Set Engineering Evaluation
Attachment E
Testing ofQSK23-G3 Engine on Genset
108,0% -r---------------,...-=--=--=--= __________ _ '0 ~ 106.0% -~
~ ~ 104.0% a..~
- E <5 'x 102.0% - ~ ~:::E (,)
.;: l» 1 00 0°' _ l: .:to (,) .-oD_ l»
W ~ 98.0% III .... ~ 96.0% .. -
94.0%
" .. - .. ~
:::iteaay :::irate Genset I-'·aw er .J
Customers Load (Affinity Law)
Electric al Output Decreased with Inc rease Load Applied to Stead!' state Operating Point r---I- Generator 4.2% B elol,ov Baseline Frequency
\1 \ I ~./ ~
! -'"
i ~
i
\~ i
~ . ~. ,
-r-~jmum Steady state .. ! Povv'er= Baseline f
i . • • • • •
0% 1% ,)0/ ~ ,0 3% 4% 5% 6%
Steady Sate Frequency {% Drop from Baseline Frequency}
ATTACHMENT E EE09·002 Rev.03 Page 30 of 53
LOP Loads With One SEPS Gener-ator Set Engineering Evaluation
Attachment E
Testing ofQSK23-G3 Engine on Genset
104.0% .---------------------------------------------------~
102.0% IiiI Steady State Voltage
~ I~------------------------------------------------=============:= l» ~ 100.0% • m_ I'S_ 0
"...-___ ---l,Voltage Decreased with Decreased '0:;: 98.0% > c -;=
Frequency When A dditional Load
.~ =: 96.0% " _ I'S , t ,A pPlie~ to Generator
'{ -ts::: l .. j:.======~--' ~m -.... 0°' ~ at W 0 94. 10 Voltage at Maximum Steady St e
C. Power= Baseline 92.0% I " v .as;:
/ /
90.0% I ' ....
0% 1% 2% 3% 4% 5%
Steady Sate Frequency {% Drop from Baseline Frequency)
1-\.1 1 J-\.t.,..nlvu:!,rOi! c ncu,~vv.t. 1\.(;:v. V.,j rtig~.4';1 01 .,)..)
6%

Attachment 2
Preliminary Presentation for Regulatory Conference

NEXTera" ENERGY~ -/" SEABROOK
~
Seabrook Station Diesel Generator DG B
Significance Determination
NRC Region 1 Regulatory Conference
September 30, 2009

Agenda
• Introduction - Gene St.Pierre • Electrical Analysis - Rick Noble • Risk Analysis - Ken Kiper • Conclusions - Gene St.Pierre
2
NEXTera" ENERGY.
SEABROOK

3
NextEra Team Members
Gene St. Pierre - Vice President North
Rick Noble - Engineering Site Director
Ed Metcalf - Operations Manager
Michael O'Keefe - Licensing Manager
Marjan Mashhadi - Senior Attorney
Ken Kiper - PRA Principal Engineer
Ken Letourneau - Electrical Principal Engineer
Gregg Sessler - Mechanical Principal Engineer
NEXTera: ENERGY~
SEABROOK

4
Purpose
Address the risk significance of the DG B failure at Seabrook Station on Feb 25, 2009. - NextEra Energy Seabrook concurs with the NRC determination
that "NextEra's failure to adequately control design changes implemented on the DG B jacket water cooling system in January 2009 led to the failure of the gasket on flange JTR005 in the DG B jacket water cooling system on February 25."
- Electrical analysis demonstrates additional margin exists in the on-site AC power system (SEPS: Supplemental Emergency Power System).
- One of the two SEPS diesel generators can support LOOP loads based on actual running values.
- Risk analysis crediting this additional margin results in a risk significance of this event below 1 E-6 (GREEN).
NEXTera" ENERGY~
SEABROOK

DG B Failure Event 212512009 EVENT • 1/30109 - During a planned Train B emergency diesel generator (DG B)
maintenance outage, the "B" turbocharger cooling flange and gasket were assembled in accordance with a design change.
• 2/02/09 - DG B started 5 times for post maintenance testing, ran for -10 total hrs.
• 2/25/09 - DG B failed during a surveillance test run. Specifically, the Jacket Water cooling system failed due to a gasket failure on the "B" turbocharger cooling flange. This failure occurred about 60 minutes after DG B started, when the DG had been loaded for about 30 minutes.
• 3/01/09 - DG B was functional after completion of repairs and comprehensive inspections.
UNAVAILABILITY TIME • Total unavailability time (from 2/2109 to 3/1/09) = 26.0 days = 0.0713 yr.
• Unavailability time includes the entire period between last successful run and completed repair. No degradation mechanism affected the component during the standby time period.
NEXTera' ENERGY~
5 ./ SEABROOK

-Q) en Q) .-o ~ c Q)
~ Q)
E w
co

C) c .-c.. .-a.. +J
C co -o o U "'C C CO L-
ID ~ CO .c u o ..c L-
::J I-OJ C) o

CD 0> C CO -U.
+oJ C CO -o o o s-CD e' CO ..c u o ..c s-::J l-CC (9 o
co

Risk Assessment Indicates Green Significance
• Initially, NextEra Energy recognized that this event had the potential to be of low to moderate significance due to the importance of Emergency DGs and the duration of Emergency DG B unavailability
• During our evaluation of this event, NextEra Energy identified additional margin, inherent in the SEPS design, in the onsite AC power system that reduced the risk significance of this event to very low (green).
NEXTera:
9 EN~

SEPS Design
• SEPS supplies 4kV power to emergency buses E5 (Train A) or E6 (Train 8) in the event of a loss of offsite power & failure of both Emergency DGs.
• SEPS supplies backup power to emergency buses when an Emergency DG is out of service for maintenance (14 day TS AOT).
• SEPS is permanently installed with two Cummins diesel generator sets (SEPS DGs) each nominally rated at 2700 kW, for a total SEPS capacity of 5400 kW.
• The SEPS Design LOOP Load of 4425 kW uses conservatively calculated values of LOOP loads plus additional conservatisms such as an RH pump is assumed to be running.
NEXTera
10 EN~
-----~--- -------- - ------------------

SEPS Design
• SEPS is normally aligned to Bus E6 due to motor-driven EFW pump powered from Bus E6.
• Auto starts on LOOP.
• Operator closes one breaker from the Control Room to connect SEPS to Bus E6, per procedure ECA-O.O, Loss of All AC Power.
• The Emergency Power Sequencer functions to connect loads to SEPS.
11 SEABROOK

345 kV BUS 2
13.8 kV BUS 1
Electrical Design 0wl~~~ k~ARD )>-----:L---;
GSU
TG ') BKR I
EO , I)
1 4.16 kV BUS 3
UNIT TURBINE
GENERATOR
12
I) I)
1 1 4.16 kV LOAD
4.16 kV LOAD
4.16kV LOAD
4.16 kV LOAD
4.16 kV LOAD
4.16 kV LOAD
13.8 kV BUS 2
345 kV BUS 2
4.16 kV LOAD
)
1 4.16 kV LOAD
NEXTera ENERGY~

~
co CD C) .r:. u -+oJ .-~
Cf)
"'C C CO en (9 o Cf) (L w Cf)
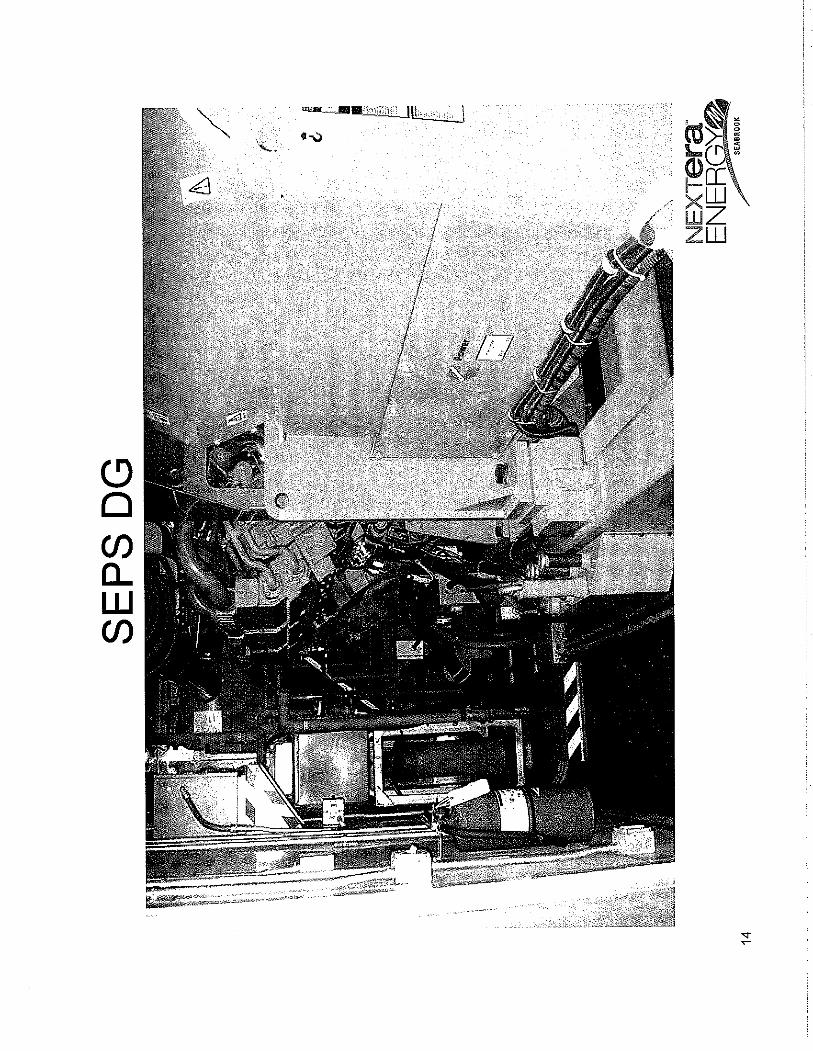
(9 o CJ) a... w CJ)
SEPS Margin Analysis
• Analysis determined that one of two SEPS DGs alone can support the LOOP loads based on actual running values.
• The single SEPS DG vendor Standby Rating of 2700 kW is based on its service application of supplying emergency power during a loss of all AC power.
• The Adjusted Base Rating is the standby rating adjusted to account for factory testing and improved efficiency due to engine break-in.
15
NEXTera" ENEOOY~
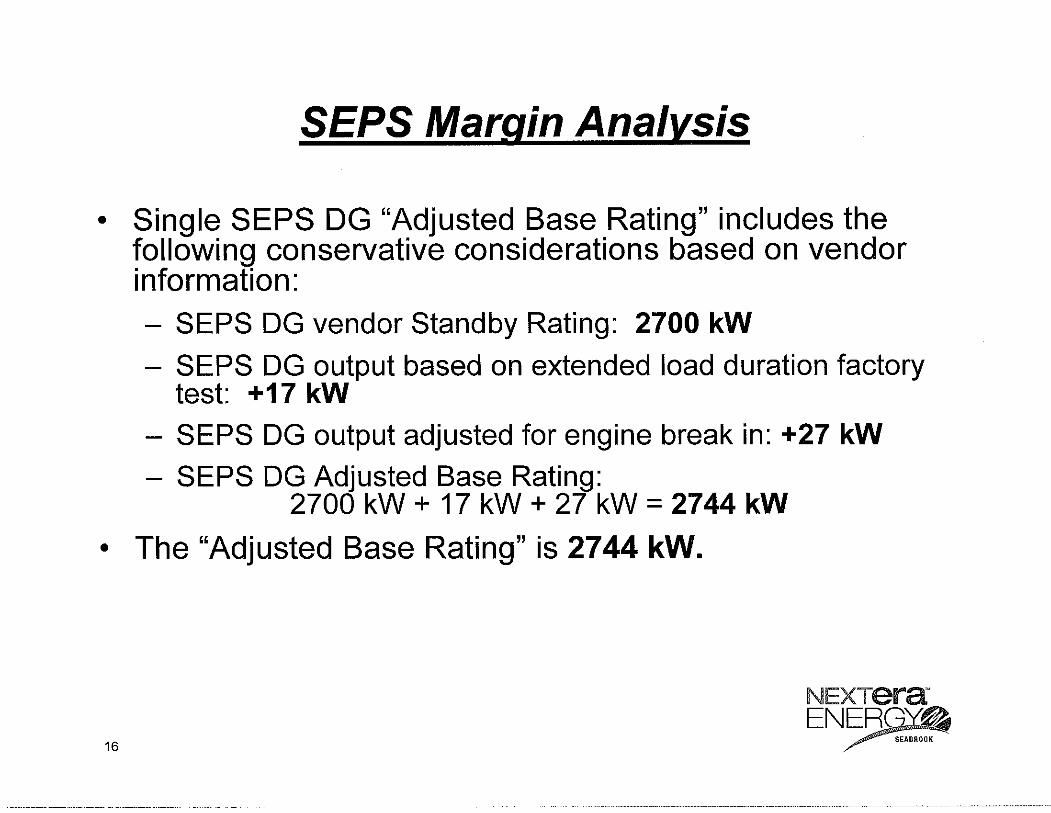
SEPS Margin Analysis
• Single SEPS DG "Adjusted Base Rating" includes the following conservative considerations based on vendor information: - SEPS DG vendor Standby Rating: 2700 kW
- SEPS DG output based on extended load duration factory test: +17 kW
- SEPS DG output adjusted for engine break in: +27 kW - SEPS DG Adjusted Base Rating:
2700 kW + 17 kW + 27 kW = 2744 kW
• The "Adjusted Base Rating" is 2744 kW.
16
NEXTera" ENER0Y~
SEABROOK

SEPS Margin Analysis
• The Adjusted Base Load is calculated to reflect the expected loading during a LOOP by adjusting the on-site commissioning test load value.
• The "Adjusted Base Load" of 2936 kW includes the following considerations:
- Loading based on the site commissioning test versus design calculated loads.
- A nominal plant loading profile for the evaluated period of 2/02/09 to 3/01/09.
- No Operator actions are required to reduce loads.
• The Adjusted Base Load exceeds the single SEPS DG adjusted base rating at normal voltage and frequency.
• The 7% overloaded condition causes a slight reduction in frequency which in turn reduces the load demand below the SEPS DG Adjusted Base Rating.
17
NEXTera' ENERGY~
~ --SEABROOK

SEPS DG Capability Above Adjusted Base Rating
• Vendor testing demonstrated capability above the SEPS DG "Adjusted Base Rating."
18
- Testing performed on a smaller aSK series engine with the same cylinder design, same fuel system, same engine control system and generator control system, and similar air handling and base engine features as the SEPS DG aSK series engines.
- Per the vendor, SEPS DG performance above the Adjusted Base Rating would be expected to provide similar results.
- Loading above the Adjusted Base Rating results in reduced frequency & voltage.
- Reduced frequency & voltage results in reduced power required by connected loads.

Equilibrium Reached at Lower Frequency
• An equilibrium between load demand and supply is reached at a lower frequency.
19
- SEPS will stabilize at new equilibrium point; overcurrent protection setpoint is not reached.
- The evaluation of connected loads showed acceptable design function performance at the equilibrium point.
-- All required pumps evaluated for changes in flow resulting from reduced frequency and determined to be capable of supplying required flow.
-- Effects of lower voltage evaluated on loads and protection devices and all would remain functional.
-- The impact on instrumentation, transformers, component protection and bus work would be insignificant.
SEABROOK

One SEPS DG Can Supply LOOP Loads
Conclusions:
20
- A single SEPS DG can supply the LOOP loads without tripping. The safe shutdown loads would perform their function at the reduced voltage & frequency values that would occur when operating a single SEPS DG above the Adjusted Base Rating.
- The SEPS system has additional defense-in-depth since one of two SEPS DGs is sufficient to power the Adjusted Base Load.
- No operator actions are required to reduce loads.
NEXTera' ENER0Y~
SEABROOK

Risk Assessment Results
Risk assessment using 1-of-2 SEPS DG success criteria shows risk significantly below 1 E-6 (GREEN).
21
Description
NEW BASECASE: SB2009X Average
Maintenance, Modes 1 to 3 -AND- Single SEPS
Success Criteria
NEW BASECASE AND DG B out of service
DG B Status
available
out of service
dCDF: delta core damage frequency
SEPS Model
1-of-2 required
1-of-2 required
ICDP: incremental core damage probability
CDF123 dCDF (CASE X)
I 1.02E-05
1.88E-05
Unavailability I Time (yrs)
ICDP
NEXTera ENER.QV~
SEABROOK

Seabrook PRA
• Seabrook PRA Risk Model used for SOP - Analyzed initiators: internal events, internal flood, internal fire,
seismic events
- Modes 1 to 3: at power, low power, hot standby
- Average test & maintenance unavailability
- Revised in June 2009 to account for latest plant design, procedures, & data (periodic update)
- Meets Cat 2 of ASME/ANS PRA Standard (RG1.200 Rev 1) with minor exceptions
• Risk significance of this event was evaluated using a full scope analysis with detailed plant-specific modeling.
22
NEXTera" ENER0Y~
SEABROOK

PRA Station Blackout Model OFFSITE POWER • LOOP initiators considered: plant-centered (LOSPP), grid-centered
(LOSPG), weather-related (LOSPW), quantified based on generic data from NUREG/CR-6890, updated with plant-specific data.
• Consequential LOOP is modeled for all other initiators, to account for the potential for LOOP resulting from the plant trip.
• Offsite power recovery curves are modeled using generic data from NUREG/CR-6890.
EMERGENCY DGs • Detailed fault tree systems analysis for DG A & DG B, including test &
maintenance unavailability & common cause failure
• System model uses 24-hour mission time for weather-related LOSP sequences; 6-hour mission time for all other LOSP sequences.
• DG A and DG B failure rates are based on generic data from NUREG/CR-6928, updated with plant-specific data.
• DG recovery is modeled using plant-specific data (0.45 non-recovery probability for sequences with at least 4-hours recovery time available).
23
NEXTera ENERGY~
.....a: --

PRA Station Blackout Model SEPS • Detailed fault tree systems analysis for SEPS, includes test & maintenance
unavailability & common cause failure. • SEPS failure rates are based on generic data from NUREG/CR-6928. • Revised model consists of two SEPS DGs which are modeled with a 2-of-2
success criteria for LOOP/SI sequences and a 1-of-2 success criteria for LOOP/non-SI sequences.
TURBINE-DRIVEN EFW PUMP • AC power independent, continues to run as long as DC power is available. • When DC batteries are eventually drained on a SBO sequence, the model
assumes the TO EFW pump fails.
OTHER • Vital DC batteries are modeled to operate for a nominal time period of 4
hours, or for an extended time of 12 hours based on procedural-directed load shedding.
• RCP seal leakage model: for an extended SBO, the RCP seals are modeled to leak at each of threepotentialleakrates: 84 gpm, 728 gpm, or 1920 gpm, based on the standard Westinghouse model.
24
NEXTera' ENERGY~
SEABROOK
Additional PRA Considerations
1. Operator Actions Related to SEPS
2. Fail-to-Run Single SEPS DG Scenario
3. Nominal Plant Model Assumptions
NEXTera'
25 EN~

(1) Operator Actions re SEPS
• SEPS auto starts on loss of offsite power (no action required). • Initial operator action in response to a loss of all AC power,
per emergency procedure ECA-O.O, Loss of All AC Power:
ECA-O.O Step 5b Step 5b RNO
b. Manually start emergency diesel generator(s) from the main control room:
• Emergency start
• Slave relay K603 test switch S909
b. Perform the following: • IF SEPS bus feeder breaker is
aligned to Bus 6, THEN:
1) Place the following equipment control switches in PULL TO LOCK position:
• DG 1 B output breaker • CBS-P-9B • SI-P-6B
2) Manually close SEPS Bus 6 breaker. IF breaker will NOT close, THEN go to Step 6.
• The Emergency Power Sequencer automatically starts the required loads.
NEXTera' ENEf3BY~
26 SEABROOK

(1) Operator Actions re SEPS
• Subsequent steps address load management. Note: no operator actions are required to reduce SEPS load.
27
---- -.-----
ECA-O.O Step 5j Step 5j RNO j. Check emergency bus - POWERED BY
EMERGENCY DIESEL
ATTACHMENT A
j. IE emergency bus is powered by SEPS, THEN maintain SEPS load limit per ATT CHMENT A while performin ctions in other proce res in effect.
SEPS LOAD LIMIT GUIDANCE
Dispatch operator to locally determine SEPS load condition and number of diesels running:
• Verify SEPS load with two diesels running - LESS THAN 5280 KW
-OR-
• Verify SEPS load with one diesel running - LESS THAN 2640 KW
2 Determine pump start load limit from table below prior to starting pumps:
NEXTera' ENERGY~
SEABROOK

(1) Operator Actions for SEPS
Operator Actions Conclusions:
28
- SEPS auto starts - no operator action required.
- Simple operator actions from control room to close the SEPS breaker to the emergency bus.
- Emergency sequencer automatically starts essential loads - no operator action required.
- No operator actions are required to reduce SEPS load. Any SEPS load management would occur in the longer term in consultation with TSC staff.
- The PRA models the critical steps needed to close SEPS breaker. These actions are independent of whether 1 or 2 SEPS DGs are operating.
NEXTera" ENERGY~ =
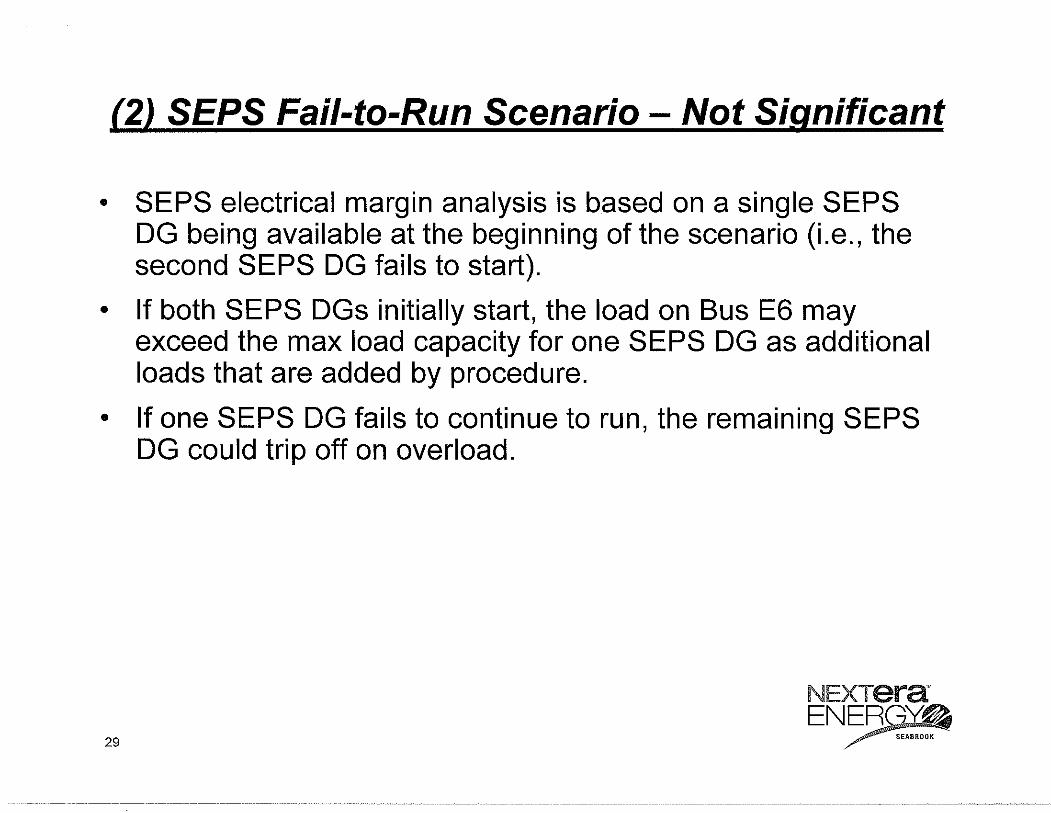
(2) SEPS Fail-to-Run Scenario - Not Significant
• SEPS electrical margin analysis is based on a single SEPS DG being available at the beginning of the scenario (i.e., the second SEPS DG fails to start).
• If both SEPS DGs initially start, the load on Bus E6 may exceed the max load capacity for one SEPS DG as additional loads that are added by procedure.
• If one SEPS DG fails to continue to run, the remaining SEPS DG could trip off on overload.
NEXTera:
29 EN~

(2) SEPS Fail-to-Run Scenario - Not Significant
• Low Frequency Scenario - Based upon the SEPS system analysis, the most likely failure scenario
for SEPS is at time zero (maintenance unavailability or fail-to-start). -- The time-zero failure modes account for the vast majority of SEPS
unavailability: 97% for 6 hr mission time; 84% for 24 hr mission time.
- Thus, the fail-to-run scenario is a low frequency scenario.
• Procedural Path
30
- Given the fail-to-run scenario with both SEPS DGs tripping off, oRerators would re-enter ECA-D.D and at Step 8 restart a single SEPS DG.
- Operators would start required loads from the Control Room as directed by the Emergency Operating Procedures.
- While this procedure path requires more operator actions, there is also more time available due to the decay heat removed while both SEPS DGs operated.
NEXTera" ENER0Y~
SEABROOK
(2) SEPS Fail-to-Run Scenario - Not Significant
• Conclusions:
31
- Electrical analysis is based on fail-to-start loading.
- SEPS DG fail-to-run scenario is low frequency compared to the fail-to-start scenario.
- EOPs handle SEPS restart & loading required for failto-run scenario as well as fail-to-start scenario.
- Based on PRA sensitivity analysis, SEPS DG fail-torun scenario is not significant to the conclusion that risk <1 E-6.
NEXTera' ENER0v~
SEABROOK

(3) Nominal PRA Model • SOP guidance requires use of the "nominal" PRA model. • Electrical analysis is based on a "nominal plant." This includes
assumptions of two system alignments critical to SEPS loading:
32
RHR Pump -- Electrical analysis assumes the RHR pumps are in standby, and thus, would
not auto start given a LOOP.
The nominal PRA model in Mode 1 - 3 includes RHR pumps in standby.
-- If a LOOP occurred in the short period of time when a RHR pump was running in test, the emergency sequencer would restart the RHR pump - a large, additional load.
SW System • Electrical analysis assumes the SW System is aligned to the ocean, and thus,
ocean SW pumps (not cooling tower pumps) would auto start given a LOOP.
• PRA model includes both ocean & cooling tower SW System alignment.
• The nominal PRA model is with the SW System aligned to the ocean. SW Train B is historically aligned to the cooling tower < 1 % of the time.
• If a LOOP occurred in the short period of time when a SW Train was aligned to the cooling tower, the SW cooling tower pump would restart - a larger load than the ocean SW pump.
NEXTera ENER0Y~
SEABROOK
(3) Nominal PRA Model
• Low Frequency Scenarios
- Both the RH and SW off-normal alignments occur for brief periods of time and do not represent the nominal model
- The electrical analysis does not include these off-normal alignment loads.
- These alignments are not explicitly included in the PRA model with regard to the 1-of-2 SEPS DG success criteria.
• Based on PRA sensitivity analysis, these overload scenarios are not significant to the conclusion that risk is <1 E-6.
33
NEXTera' ENERGY~ .... ~ ""'"'-"'.
SEABROOK

34
PRA Sensitivity Analysis • Conservative assumption:
- The 1-of-2 SEPS DG success criteria does not apply for 10% of the exposure time.
• Calculation: ICOP = dCOF(1-of-2 SEPS) x TEXP x 0.90 + dCOF(2-of-2 SEPS) x TEXP x 0.10
= 8.62E-06 x 0.0713 x 0.90 + 1.71E-05 x 0.0713 x 0.10
= 6.14E-07 x 0.90 + 1.22E-06 x 0.10 = S.7SE-07
• Conclusions: - ICOP (sensitivity case) = 6.75E-7
- ICOP is still well below 1 E-6 (GREEN) even when using a conservative success assumption.
Exposure Time = Unavailability Time(DG 8):
TEXP = 0.0713 yrs NEXTera" ENERGY~
SEABROOK
Uncredited Additional Electrical Margin
(1) Peak Load • The Seabrook Station electrical analysis uses the "adjusted base
load" (2936 kW) which is based on actual loading during the SEPS test, adjusted for expected load values.
• However, the average (nominal) load during the month of Feb 2009 was -2800 kW. This is additional margin over the load analyzed.
(2) Instrument Uncertainty
35
• The electrical analysis included -1 % additional load to account for instrument uncertainty.
• Since there is no reason to expect instruments to be biased plus or minus, this is additional margin in this analysis.
NEXTera ENERGY~
SEABROOK

Uncredited Additional PRA Margin
(3) DG B Recoverability - The basecase PRA model includes modest credit for Emergency DG recovery
based on plant-specific experience over the life of the plant.
- Based on discussions with maintenance & operations, the February 25, 2009 DG B failure would have been recoverable within 2 to 4 hours since it was simple to diagnose and the failure was the gasket of a relatively easy to replace two-bolt flange.
This additional recovery credit is not included in the quantitative results.
(4) Time of DG B Failure
36
The DG B failure on February 25, 2009 occurred after about 1 hour run time.
- The time available for recovery assumes the SBO (loss of offsite power & all Emergency DGs fail) at time zero. If an Emergency DG runs successfully for some time, these recovery times will extend due to: (a) reduced decay heat when the SBO occurred, at 1 hour after shutdown and (b) the offsite power recovery which would have begun at the time of loss of offsite power, before the SBO time begins.
This additional recovery credit is not included in the quantitative results.
NEXTera EN~

Risk Assessment Indicates Green Significance
Overall Conclusions
1. SEPS capacity (1-of-2 SEPS DG success criteria) is supported by detailed analysis and vendor test data.
2. Electrical analysis & risk analysis include additional margin.
3. With 1-of-2 SEPS DG success criteria, risk from Feb 2009 DG B failure is GREEN (calculated as 6.14E-7).
37