next-generation immunohistochemistry: multiplex tissue imaging...
TRANSCRIPT

Next-Generation Immunohistochemistry:Multiplex tissue imaging with mass cytometry
Journal Club – Timo Böge
Nat Met, April 2014
Nat Med, April 2014

OverviewIntroduction Conventional Immunohistochemistry Mass Spectrometry Mass Cytometry (Cytof) Multiplexed Mass Cytometry
Paper: Giessen et al, Nat Met 2014 & Angelo et al, Nat Med2014
Discussion: Advantages Limitations

Immunohistochemistry (IHC)Samples preparation: Patients undergo surgery/biopsy
Formalin Fixation and Paraffin Embedding (FFPE) of tissue
fixation time depends on the thickness of the tissue, time:1 mm/h
Staining preparation Cutting (5um) and deparaffinization/rehydration
Heat or enzymatic digestion for antigen retrieval to unmask the antigenic epitope
Immunohistochemical Staining Blocking, Incubation with 1° ab - directly labeled or
washing incubation 2° ab HRP (plus DAB substrate & Hematoxylin counterstaining )
or flourophore coupled
Block slide

Immunohistochemistry (IHC)
Colometric detection:
max. 4 different colours
IF:
max. 11 different colours (Alexa, 2001)
max. 18 diffenerent colours (quantum dots, 2011)
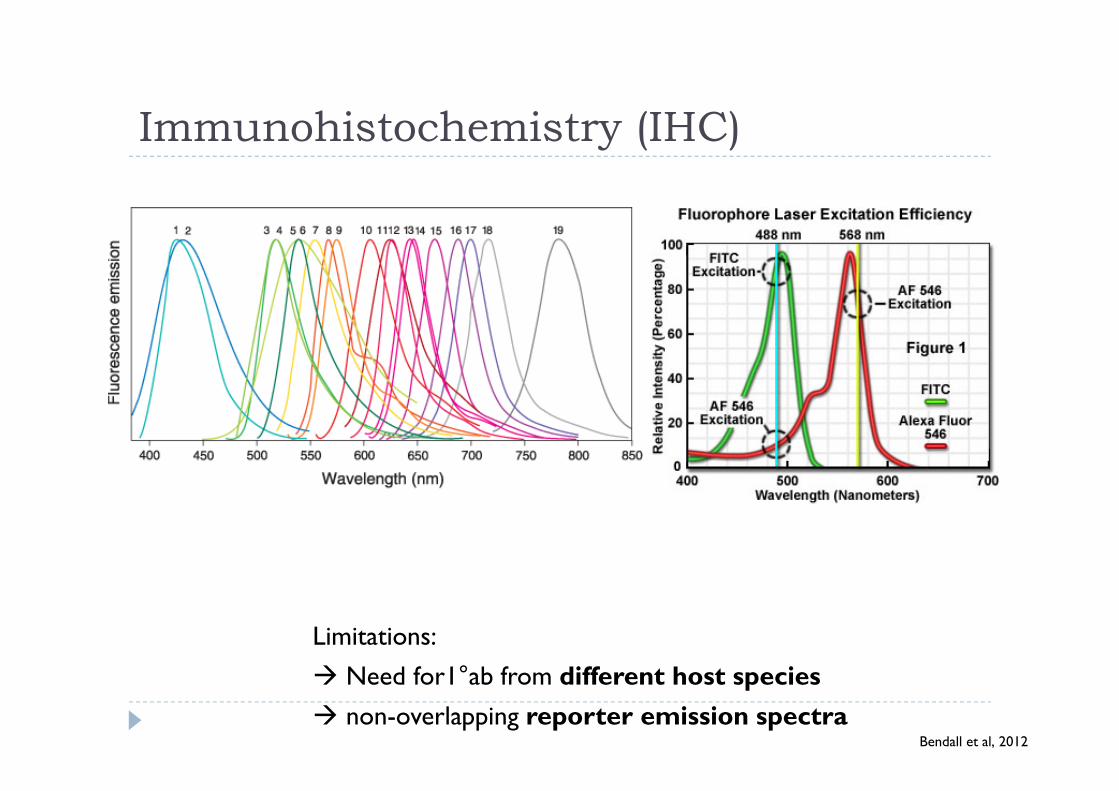
Limitations:
Need for1°ab from different host species non-overlapping reporter emission spectra
Bendall et al, 2012
Immunohistochemistry (IHC)
Limitations:
Need for1°ab from different host species non-overlapping reporter emission spectra
Bendall et al, 2012

Mass Spectometry (MS)Mass spectrometry measures molecules/fragments based on their mass-to-charge ratio (m/z)
1.Ionization
- Molecules bombarded with a stream of electrons
- Produces positively charged ions/fragements
- Protein have «pre-determined breaking points»
2. Acceleration
- same kinetic energy
3. Deflection
- by a magnetic field,
- according to their masses & charges
4. Detection
- mass to charge ratio: m/z

Mass Spectometry (MS)5. Output & Data analysis: atoms positively charged ions, stick diagram
m=100 & z= +1 m/z = 100
m=200 & z=+2 m/z = 100 !
Proteins «fingerprint» of fragments

Mass Spectometry –MADLI-TOF1. Matrix-assisted laser desorption/ionization (MALDI) Improves the fragmentation of large molecules
2. Time of Flight (TOF) Improves the detection of large molecules/fragments

Mass Cytometry (CYTOF) Single cell Flow cytometry combined with Mass Spectometry
- Antibodies are labeled with rare transition element isotypes
- no fluorochromes no spectral overlapp
- Read-out: time-of-flight mass spectrometry
Workflow:1.Cells are labeled with metal tagged antibodies
2. Cells are vaporized
3. Analysis by time-of-flight mass spectrometry
4. Read-out: fcs files («FACS plots», SPADE trees)

Antibody tagging with a unique isotope
1. Metal chelating ligand show high affinity to Lanthanids2. Ligand and polymer are combinde3. Metal-chelating polymer with reactive –SH residues is added to the ab
ligandpreparation
Polymer-ligandcombination
Lou et al, 2007
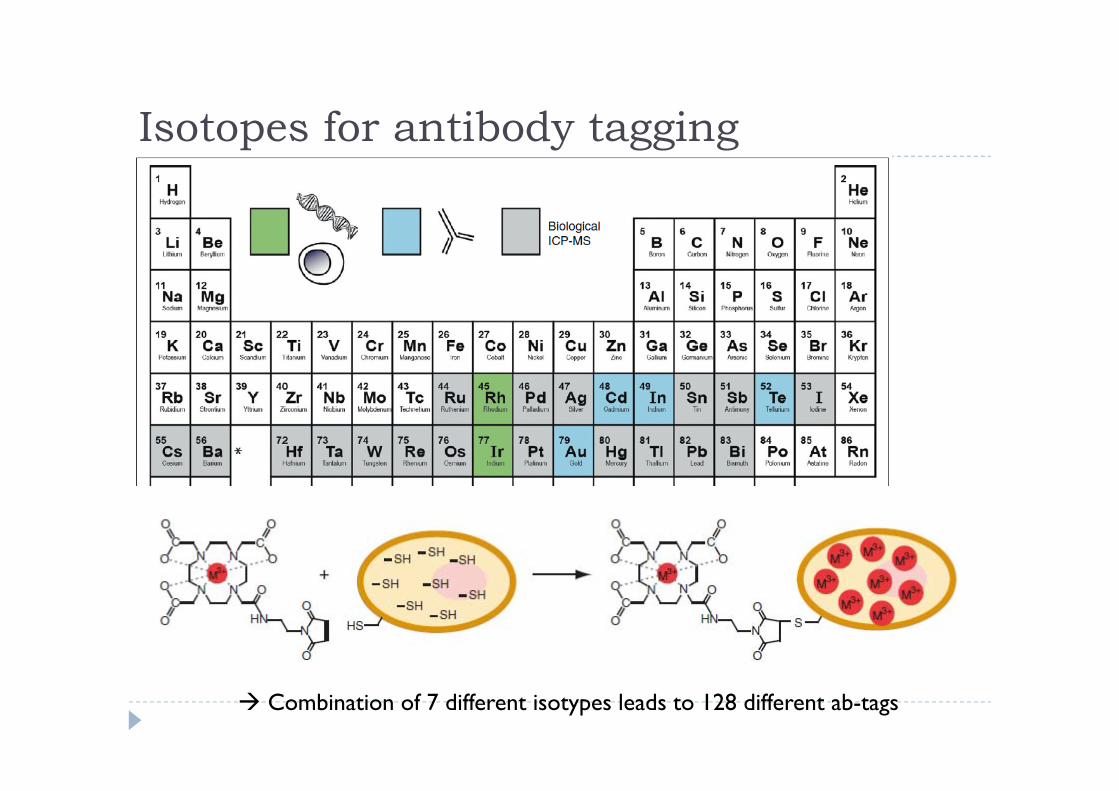
Isotopes for antibody tagging
Combination of 7 different isotypes leads to 128 different ab-tags
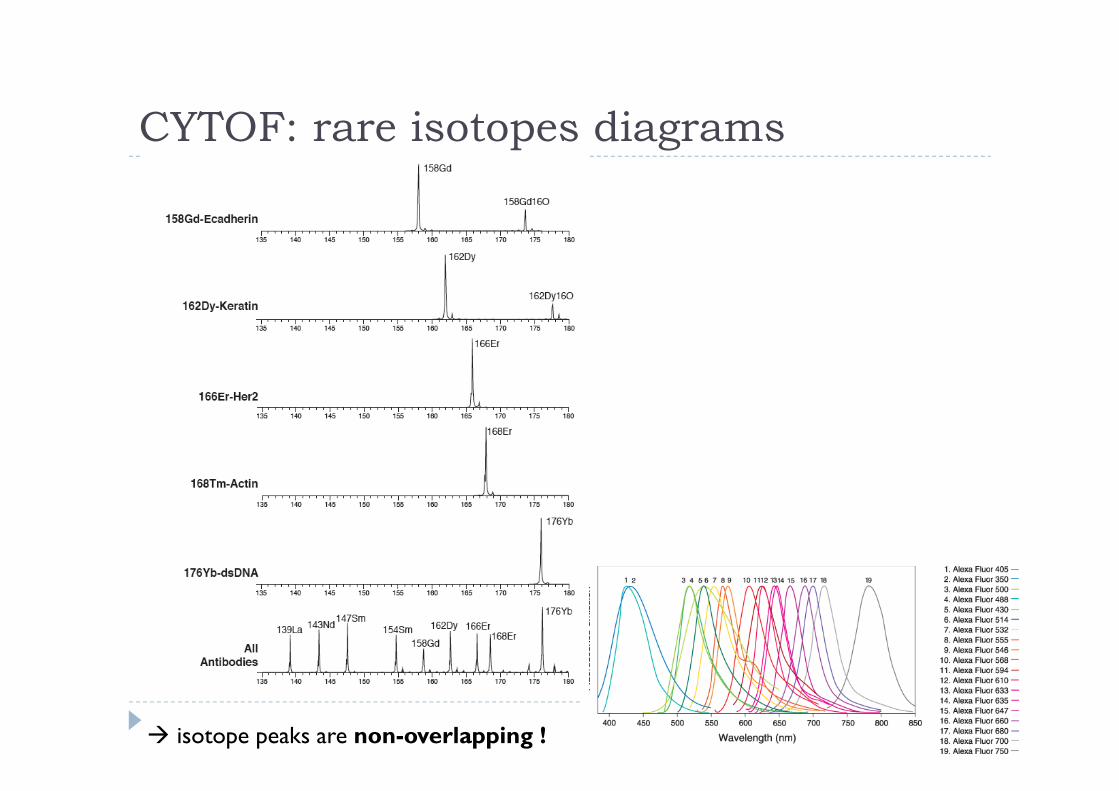
CYTOF: rare isotopes diagrams
isotope peaks are non-overlapping !

CYTOF: Work-flow

CYTOF: Read-outa) «FACS plots» b) Clustering: «FLAME»
C) GEMSTONE Analysis D) SPADETree

CYTOF: SPADE Trees
Bodenmiller et al, 2012
Stimulation of PBMCs with LPS activates e.g.:- pSTAT3 in CD4+ T cells after 60min- NFKB acitvation of CD14» monocytes

Highly multiplexed imaging of tumor tissues with subcellular resolution by mass cytometry (Giessen et al, 2014)
Aim: Combine conventional IHC with Mass Spec (CyTOF) and
high resolution laser ablation for multiplex imaging atsubcellular resolution in human breast cancer samples
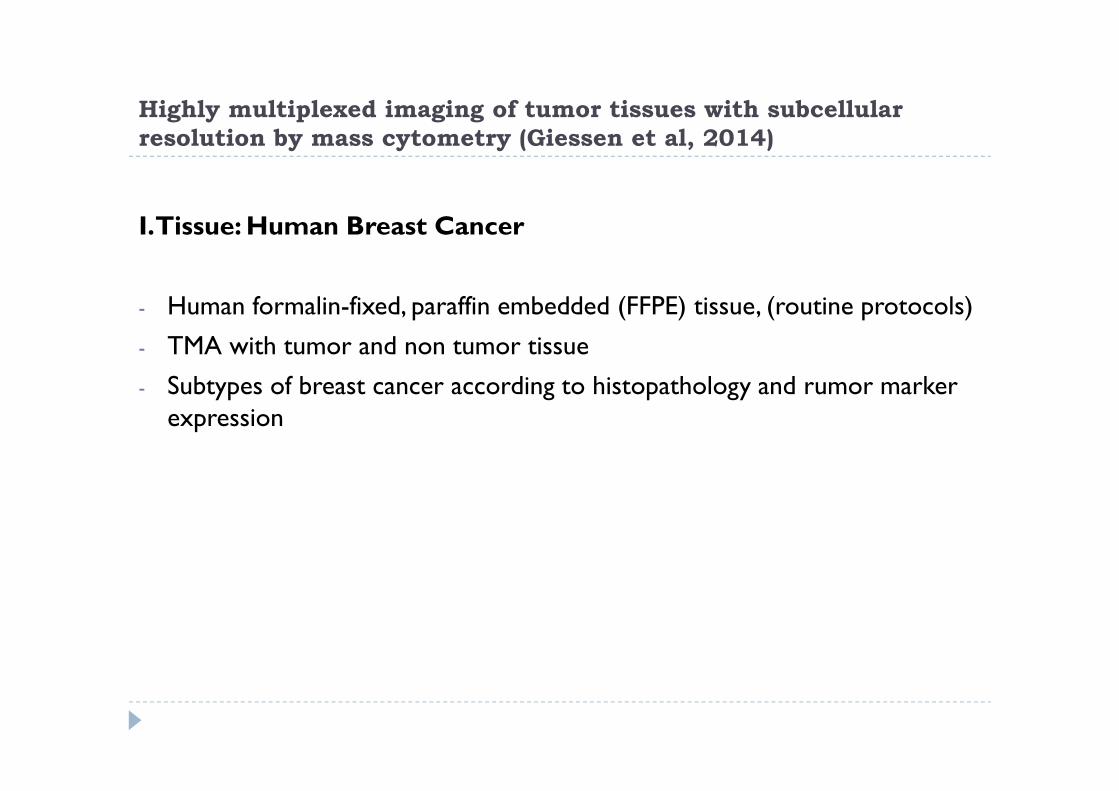
Highly multiplexed imaging of tumor tissues with subcellular resolution by mass cytometry (Giessen et al, 2014)
I. Tissue: Human Breast Cancer
- Human formalin-fixed, paraffin embedded (FFPE) tissue, (routine protocols)
- TMA with tumor and non tumor tissue
- Subtypes of breast cancer according to histopathology and rumor markerexpression

Highly multiplexed imaging of tumor tissues with subcellular resolution by mass cytometry (Giessen et al, 2014)
I. Tissue: Human Breast Cancer Subtypes
Ductal carcinomainvasive/metastatic - 55%
Ductal carcinomain situ/ non-invasive - 13%
Invasive lobular carcinoma(metastatic) - 5%
ER = estrogen receptorPR = progesterone receptorHER2 = human epidermal growth factor receptor 2

Highly multiplexed imaging of tumor tissues with subcellular resolution by mass cytometry (Giessen et al, 2014)
1I. Antibody validation on serial sections by IF and intensity quantification
metal labeling of ab`s does not interfere with target specificity metal labled ab`s show th same intensity (2-7% difference)
CK8

Highly multiplexed imaging of tumor tissues with subcellular resolution by mass cytometry (Giessen et al, 2014)
III. Validation of mass cytomtery imaging vs IF for single stainings
Positive tumor cells:
100% - 100%
75% - 79%
63% - 68%

Highly multiplexed imaging of tumor tissues with subcellular resolution by mass cytometry (Giessen et al, 2014)
III. Validation of mass cytomtery imaging vs IF for multiplex stainings One section stained for 32 different antibodies
Mass Cytometry imaging:Overlay of cytokeratin 8/18 (red), H3 (cyan) and vimentin (yellow).
Overlay of cytokeratin 7 (red), H3 (cyan) and CD44 (yellow).
Overlay of pan-actin (red), progesterone receptor (blue), CD68 (yellow).

Highly multiplexed imaging of tumor tissues with subcellular resolution by mass cytometry (Giessen et al, 2014)
III. Validation of mass cytomtery imaging vs IF for multiplex stainings (FFPE) One section stained for 32 different antibodies
Mass Cytometry imaging:
bcatenin (red)H3 (cyan)pS6 (yellow)
HER2 (red)H3 (cyan)CAH IX (yellow)
E-cadherin (red)H3 (cyan)vimentin (yellow).
Highly multiplexed imaging of tumor tissues with subcellular resolution by mass cytometry (Giessen et al, 2014)
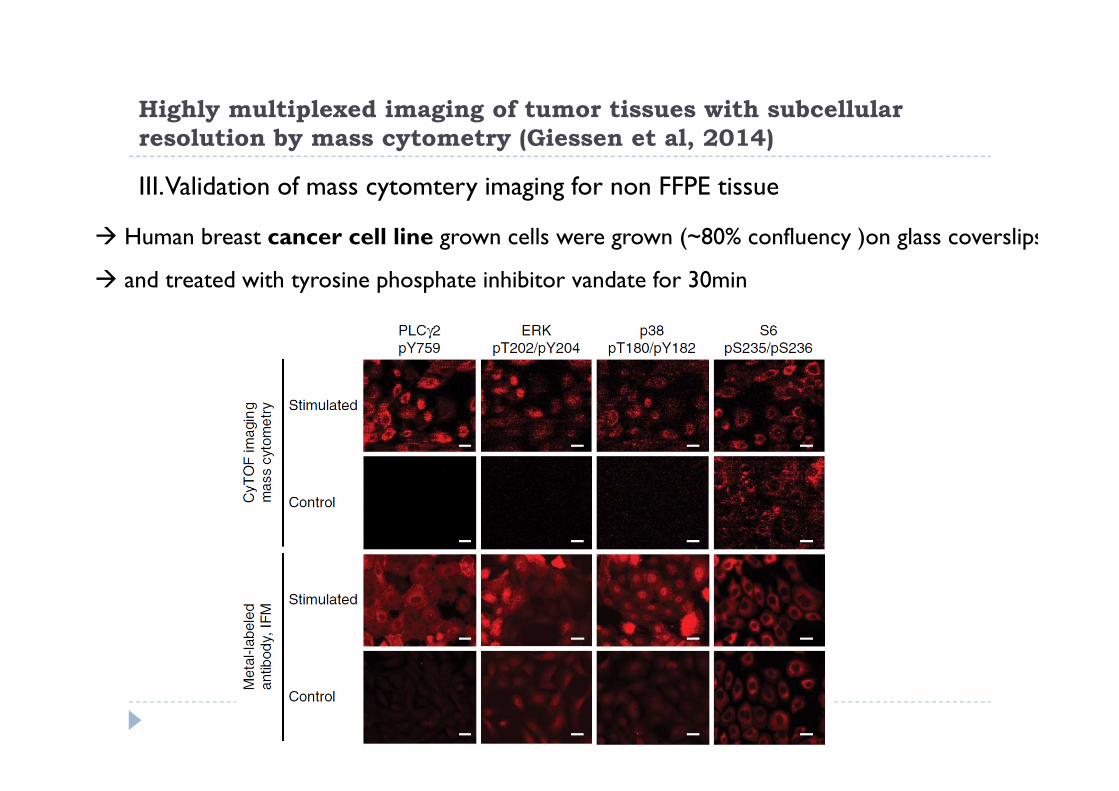
III. Validation of mass cytomtery imaging for non FFPE tissue
Human breast cancer cell line grown cells were grown (~80% confluency )on glass coverslips
and treated with tyrosine phosphate inhibitor vandate for 30min

Highly multiplexed imaging of tumor tissues with subcellular resolution by mass cytometry (Giessen et al, 2014)
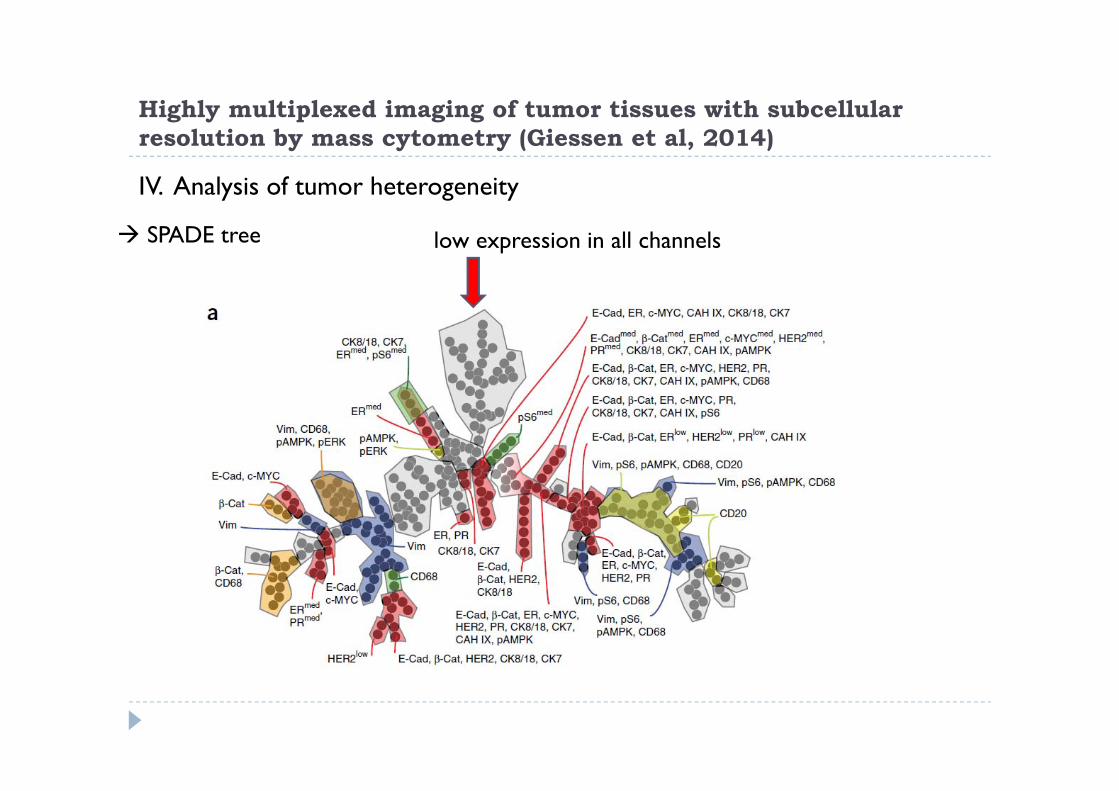
IV. Analysis of tumor heterogeneity
Her2, PR & ER expression define breast cancer subtypes
Ductal carcinomainvasive/metastatic - 55%
Ductal carcinomain situ/ non-invasive - 13%
Invasive lobular carcinoma(metastatic) - 5%
Analysis of 21 FFPE samples (TMA) by 32-plex imaging

Highly multiplexed imaging of tumor tissues with subcellular resolution by mass cytometry (Giessen et al, 2014)
IV. Analysis of tumor heterogeneity
Analysis of 21 FFPE samples (TMA) by 32-plex imaging (previously defined by pathologists)
Highly multiplexed imaging of tumor tissues with subcellular resolution by mass cytometry (Giessen et al, 2014)
IV. Analysis of tumor heterogeneity
SPADE tree low expression in all channels

Highly multiplexed imaging of tumor tissues with subcellular resolution by mass cytometry (Giessen et al, 2014)
IV. Analysis of tumor heterogeneity
SPADE tree) low expression in all channels

Highly multiplexed imaging of tumor tissues with subcellular resolution by mass cytometry (Giessen et al, 2014)
Summary & Conclusion:
Validation of imaging mass cytometry
Metal labeling of ab`s did not influence antigen binding
Multiplex imaging mass cytometry reproduced IF staining pattern
No background autofluorescence
High resolution 1um
Samples preparation is identical to conventional IHC
No amplification step needed
SPADE analysis confirmed intra- and interpatient heterogeneity

Highly multiplexed imaging of tumor tissues with subcellular resolution by mass cytometry (Giessen et al, 2014)
Disadvantages:
Technique depends on antigen-antibody interaction
antibodies against protein of interest are needed
Samples preparation is not normalized
Time consuming protocol (outlook: 100marker in 1h)
Complex analysis for daily practice in diagnostics
Accumulation of data, need/usage?
Imaging represents only a snapshot of tumor development

Highly multiplexed imaging of tumor tissues with subcellular resolution by mass cytometry (Giessen et al, 2014)
Outlook:
Analysis of 100 markers in 1h
Combination of multiple monoclonal ab`s against the same protein(different epitopes)
Housekeeping-protein for normalization and tissue quality index
In situ detection of RNA oder DNA ?