news/media/files/e/estee-lauder/quarterly... · estée lauder, origins and glamglow, and clinique...
TRANSCRIPT

Page 1 of 15
767 Fifth Avenue
New York, NY 10153
News Contact:
Investor Relations:
Dennis D’Andrea (212) 572-4384
Media Relations:
Alexandra Trower (212) 572-4430
THE ESTÉE LAUDER COMPANIES FISCAL 2018 THIRD QUARTER SALES
GROWTH OF 18% DRIVES 24% EPS INCREASE
– CONSTANT CURRENCY NET SALES INCREASED 13% –
– DILUTED EPS $.99, ADJUSTED DILUTED EPS $1.17 –
– COMPANY RAISES FULL-YEAR SALES AND ADJUSTED EARNINGS GUIDANCE –
New York, NY, May 2, 2018 - The Estée Lauder Companies Inc. (NYSE: EL) today reported
strong financial results for its third quarter ended March 31, 2018. The Company achieved net
sales of $3.37 billion, an increase of 18%, compared with $2.86 billion in the prior-year quarter.
Net earnings rose 25% to $372 million, compared with $298 million last year. Diluted net
earnings per common share increased 24% to $.99, compared with $.80 reported in the prior year,
including restructuring and other charges and adjustments.
Excluding the impact of foreign currency translation, net sales increased 13%. For the quarter, the
positive impact of foreign currency translation on diluted net earnings per common share was
$.11. Adjusting for the restructuring and other charges and adjustments, diluted net earnings per
common share for the three months ended March 31, 2018 increased 30% to $1.17, and in
constant currency rose 17%.
Fabrizio Freda, President and Chief Executive Officer, said, “Our Company delivered another
excellent quarter in what we expect to be an outstanding fiscal year. Many areas of our business
that contributed to our strong first-half results continued to thrive in our third quarter, as we
generated 13% sales growth and 17% adjusted earnings per share growth, each in constant
currency. Among our multiple engines of growth, travel retail, online and Asia again were
standouts, and we experienced strong momentum in other high growth channels and markets. Our
performance this quarter reflected robust global demand across our portfolio, with virtually all our
brands posting sales growth. Each of our three biggest brands grew globally, with exceptional
growth in Estée Lauder. These results reflect our strong array of hero products, as well as product
and service innovations that resonated well with today’s diverse global consumers.”
Mr. Freda added, “We continue to position our Company for sustainable, profitable growth and
long-term shareholder value creation, with strategic actions and targeted investments to build our
brands and strengthen our assets. Our ability to anticipate prestige beauty trends enables us to
quickly deploy our resources to capture potential growth opportunities. Amplifying our digital

Page 2 of 15
initiative to drive brand engagement, trial and loyalty is a priority. We are raising our full-year
constant currency sales growth forecast to between 11% and 12% and increasing our constant
currency earnings per share growth estimate to 20% to 21%, before restructuring charges and the
impact of the provisional tax act charges.”
During the fiscal 2018 third quarter, the Company recorded restructuring and other charges of
$100 million ($75 million after tax), equal to $.20 per diluted share, in connection with its
previously announced Leading Beauty Forward initiative. During the fiscal 2017 third quarter, the
Company recorded restructuring and other charges of $62 million ($42 million after tax), equal to
$.11 per diluted share.
In the fiscal 2018 third quarter, the Company made adjustments to the provisional one-time U.S.
Tax Cuts and Jobs Act (TCJA) charges it recorded in the fiscal 2018 second quarter. The
adjustments included an additional $7 million charge related to tax liabilities on historical foreign
earnings that have not been repatriated to the U.S. (Transition Tax) and a $9 million credit related
to the remeasurement of U.S. net deferred tax assets.
Additionally, in the fiscal 2018 and 2017 third quarters, the Company recorded adjustments to
reflect changes in the fair value of its contingent consideration related to its fiscal 2015 and 2016
acquisitions. Information about GAAP and non-GAAP financial measures, including
reconciliation information, is included in this release.
_______________________________________________________________________________________________
Reconciliation between GAAP and
non-GAAP
Three Months Ended March 31, 2018
Three Months
Ended March 31
Net Sales Growth
Diluted EPS Growth
Diluted Earnings
Per Share
(Unaudited) Reported
Basis
Constant
Currency
Reported
Basis
Constant
Currency
2018 2017
Results including restructuring and other
charges and adjustments……..………..….
18 %(1)
13 % 24 %(1)
12 %
$.99 (1)
$.80 (1)
Non-GAAP
Restructuring and other charges……………....
.20 .11
Contingent consideration…………..…..... (.02 ) (.01 )
Transition Tax resulting from the TCJA……… .02
Remeasurement of U.S. net deferred tax
assets resulting from the TCJA…………………
(.02 )
Adjusted results……………….…..……...
18 % 13 %
30 % 17 % 1.17 $.90
Impact of foreign currency on earnings
per share.....................................................
(.11 )
Constant currency earnings per share….... $1.06
(1) Represents GAAP.
Page 3 of 15
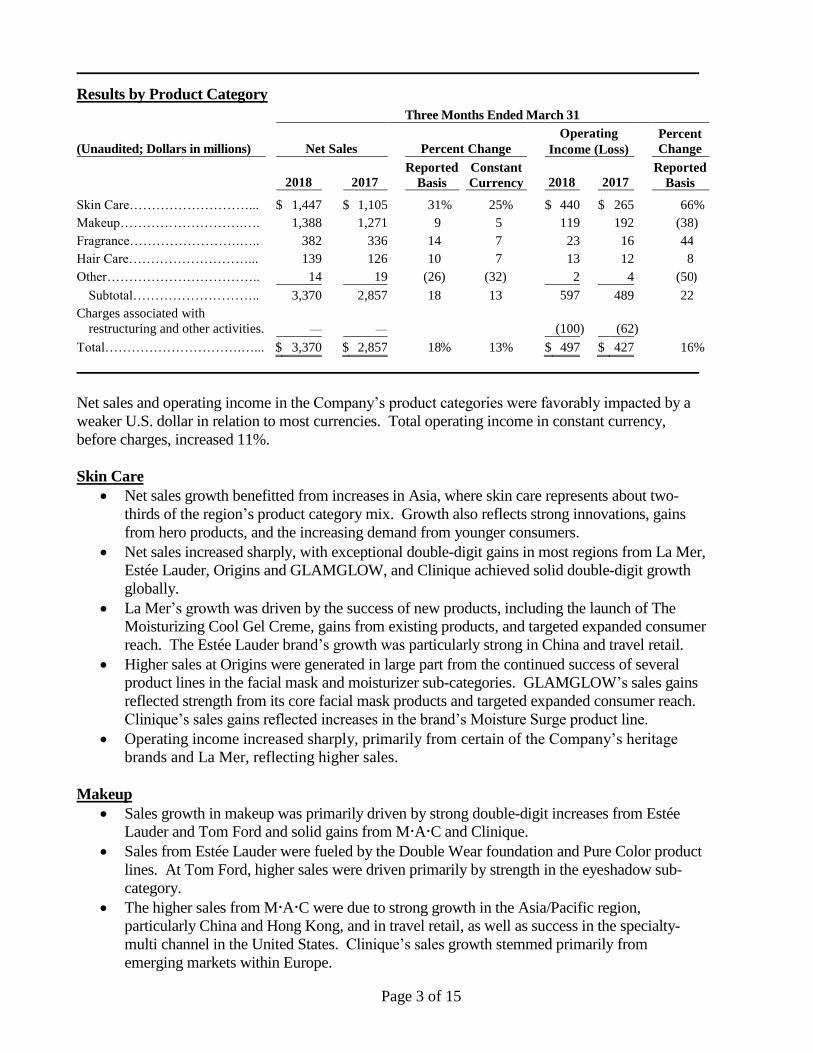
Results by Product Category
Three Months Ended March 31
(Unaudited; Dollars in millions) Net Sales Percent Change
Operating
Income (Loss)
Percent
Change
2018 2017
Reported
Basis
Constant
Currency 2018 2017
Reported
Basis
Skin Care………………………... $ 1,447 $ 1,105 31 % 25 % $ 440 $ 265 66 %
Makeup……………………….…. 1,388 1,271 9 5 119 192 (38 )
Fragrance…………………….….. 382 336 14 7 23 16 44
Hair Care………………………... 139 126 10 7 13 12 8
Other…………………………….. 14 19 (26 ) (32 ) 2 4 (50 )
Subtotal……………………….. 3,370 2,857 18 13 597 489 22
Charges associated with
restructuring and other activities.
— —
(100 ) (62 )
Total………………………….…... $ 3,370 $ 2,857 18 % 13 % $ 497 $ 427 16 %
Net sales and operating income in the Company’s product categories were favorably impacted by a
weaker U.S. dollar in relation to most currencies. Total operating income in constant currency,
before charges, increased 11%.
Skin Care
Net sales growth benefitted from increases in Asia, where skin care represents about two-
thirds of the region’s product category mix. Growth also reflects strong innovations, gains
from hero products, and the increasing demand from younger consumers.
Net sales increased sharply, with exceptional double-digit gains in most regions from La Mer,
Estée Lauder, Origins and GLAMGLOW, and Clinique achieved solid double-digit growth
globally.
La Mer’s growth was driven by the success of new products, including the launch of The
Moisturizing Cool Gel Creme, gains from existing products, and targeted expanded consumer
reach. The Estée Lauder brand’s growth was particularly strong in China and travel retail.
Higher sales at Origins were generated in large part from the continued success of several
product lines in the facial mask and moisturizer sub-categories. GLAMGLOW’s sales gains
reflected strength from its core facial mask products and targeted expanded consumer reach.
Clinique’s sales gains reflected increases in the brand’s Moisture Surge product line.
Operating income increased sharply, primarily from certain of the Company’s heritage
brands and La Mer, reflecting higher sales.
Makeup
Sales growth in makeup was primarily driven by strong double-digit increases from Estée
Lauder and Tom Ford and solid gains from MAC and Clinique.
Sales from Estée Lauder were fueled by the Double Wear foundation and Pure Color product
lines. At Tom Ford, higher sales were driven primarily by strength in the eyeshadow sub-
category.
The higher sales from MAC were due to strong growth in the Asia/Pacific region,
particularly China and Hong Kong, and in travel retail, as well as success in the specialty-
multi channel in the United States. Clinique’s sales growth stemmed primarily from
emerging markets within Europe.
Page 4 of 15
These increases were partially offset by lower makeup sales in the United States, reflecting
slow foot traffic in some U.S. brick-and-mortar stores.
Makeup operating income declined. Growth from heritage brands was more than offset by
lower operating results from makeup artist brands, reflecting increased digital and social
media spending to engage new consumers. Too Faced had lower results reflecting
additional investments behind targeted expanded consumer reach internationally, as well as
new and existing products.
Fragrance
Net sales increased, primarily due to strong double-digit gains from luxury brands.
Jo Malone London delivered outstanding double-digit growth in every region and in travel
retail. The launch of the English Fields fragrance collection contributed to the higher sales.
Increased sales from Tom Ford reflect, in part, the continued success of the Private Blend line
of fragrances.
Le Labo, By Kilian and Editions de Parfums Frédéric Malle each benefitted from growth in
existing products and targeted expanded consumer reach.
Partially offsetting these increases were lower sales of certain Estée Lauder fragrances.
Fragrance operating income increased sharply, reflecting higher sales as well as disciplined
expense management.
Hair Care
In hair care, Aveda grew, driven by solid performances in the online and travel retail
channels, along with contributions from the launches of Invati Advanced and Full Spectrum
Demi+. Growth from Bumble and bumble was driven by the success of the brand in Ulta
Beauty.
Partially offsetting the sales growth was softness in the salon channel in North America,
which impacted both brands.
Hair care operating income increased, reflecting higher sales.
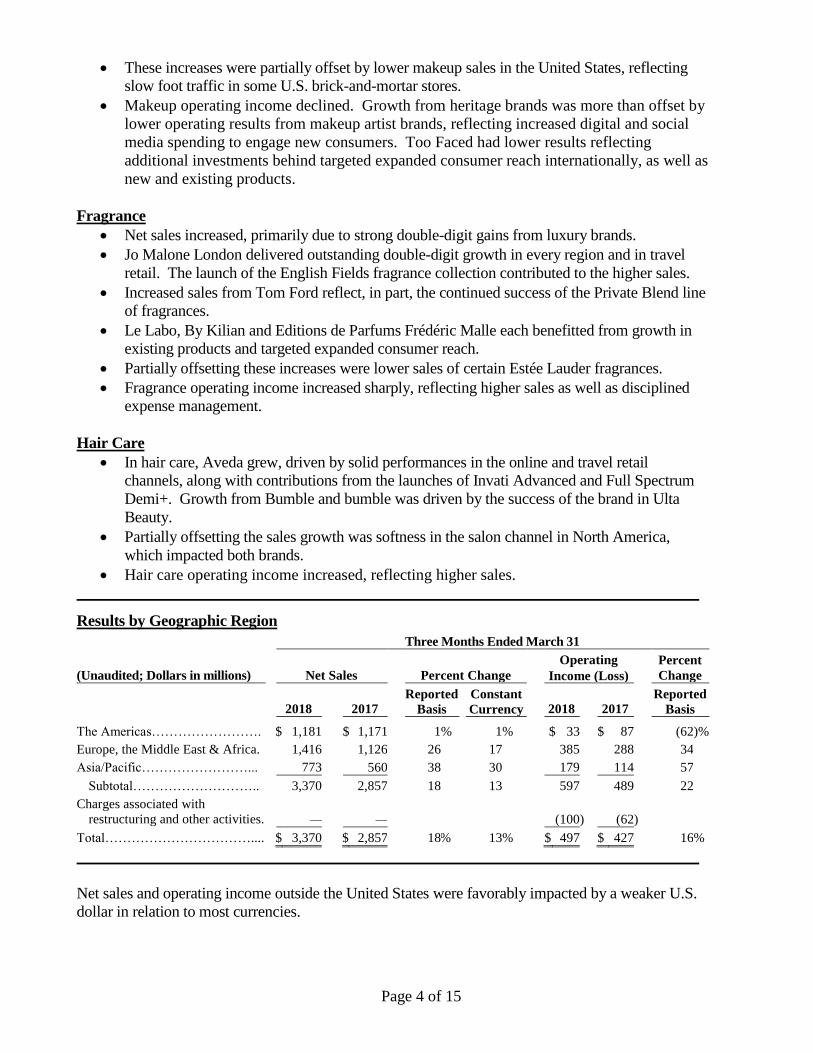
Results by Geographic Region
Three Months Ended March 31
(Unaudited; Dollars in millions) Net Sales Percent Change
Operating
Income (Loss)
Percent
Change
2018 2017
Reported
Basis
Constant
Currency 2018 2017
Reported
Basis
The Americas……………………. $ 1,181 $ 1,171 1 % 1 % $ 33 $ 87 (62 )%
Europe, the Middle East & Africa. 1,416 1,126 26 17 385 288 34
Asia/Pacific……………………... 773 560 38 30 179 114 57
Subtotal……………………….. 3,370 2,857 18 13 597 489 22
Charges associated with
restructuring and other activities.
— —
(100 ) (62 )
Total…………………………….... $ 3,370 $ 2,857 18 % 13 % $ 497 $ 427 16 %
Net sales and operating income outside the United States were favorably impacted by a weaker U.S.
dollar in relation to most currencies.

Page 5 of 15
The Americas
Sales in North America were relatively flat, with growth in La Mer, Estée Lauder and certain
luxury brands offset by lower sales from makeup artist brands.
La Mer generated strong double-digit sales gains in skin care, and Estée Lauder posted strong
double-digit sales growth in skin care and makeup. Most of the Company’s luxury and
artisanal fragrance brands also experienced double-digit growth.
Sales decreases were recorded in several brands, primarily attributable to the decline in retail
traffic in some U.S. brick-and-mortar stores.
Sales in the Company’s online and specialty-multi channels grew strong double-digits.
On a reported basis, sales in Canada and Latin America increased double-digits. In constant
currency, sales in Canada rose high-single digits and Latin America increased double-digits.
Operating income in the Americas decreased, as higher operating results from certain
heritage brands were more than offset by lower results, primarily from makeup artist
brands and Too Faced. The decrease reflects higher digital and social media investments
and additional support spending behind new and existing products. Higher stock-based
compensation expense also contributed to the operating income decline.
Europe, the Middle East & Africa
The Company generated strong sales growth in most markets in the region both on a reported
basis and in constant currency. In constant currency, double-digit sales gains came in travel
retail and Italy, as well as several emerging markets, including India, Russia, Central Europe
and Turkey.
Travel retail continued its momentum, generating double-digit sales growth in virtually every
brand, led by Estée Lauder, La Mer, MAC, Clinique and Tom Ford. Brands benefitted from
growth in global airline passenger traffic, solid new launch initiatives, and targeted expanded
consumer reach.
Lower sales were posted in the Middle East, driven by distributor inventory rebalancing,
reflecting the impact of the macro-environment on consumer purchases.
Operating income increased, primarily due to strong double-digit operating results in travel
retail. Certain developed and emerging markets such as Italy and South Africa also
contributed to the higher profits. The gains were partially offset by lower results in the
United Kingdom and the Middle East.
Asia/Pacific
On a reported basis and in constant currency, sales increased sharply, led by strong double-
digit growth in China, Hong Kong, the Philippines and Taiwan. In constant currency, Japan,
Australia and Thailand each had solid sales increases.
The higher sales in China reflected strong double-digit gains in every brand except Clinique,
which increased high-single digits. Estée Lauder, MAC, La Mer, Tom Ford and Jo Malone
London led the sales growth. The Company generated double-digit sales growth in every
major channel, particularly in department stores, online and specialty-multi.
The sales increase in Hong Kong reflected higher domestic consumption and a rise in tourism.
Sales in the region benefitted, in part, from continued demand for makeup products,
acceleration in skin care and targeted expanded consumer reach.
In Asia/Pacific, operating income increased significantly, primarily due to improved results in
China and Hong Kong driven by higher sales.
Page 6 of 15
Nine-Month Results
For the nine months ended March 31, 2018, the Company reported net sales of $10.39
billion, a 16% increase compared with $8.93 billion in the comparable prior-year period.
Net earnings were $922 million, and include provisional one-time charges of $392 million
related to the TCJA. On a diluted earnings per share basis, including the one-time charges
and restructuring and other charges and adjustments, the Company earned $2.45. In the
prior-year nine months, the Company reported net earnings of $1.02 billion and diluted
earnings per share of $2.74.
Adjusting for the restructuring and other charges and adjustments, and the impact of the
TCJA provisional charges, diluted net earnings per common share for the nine months
ended March 31, 2018 was $3.90, and in constant currency rose 26%.
The fiscal 2018 nine months also includes the impact of the adoption of a new accounting
pronouncement for share-based compensation, which added $.11 to diluted earnings per
share.
Excluding the impact of foreign currency translation, adjusted net sales increased 13%.
For the nine months ended March 31, 2018, the positive impact of foreign currency
translation on diluted net earnings per common share was $.16.
During the nine months ended March 31, 2018, the Company recorded restructuring and
other charges of $207 million ($156 million after tax), equal to $.42 per diluted share, in
connection with its previously announced Leading Beauty Forward initiative. The prior-
period nine-month results include charges of $134 million ($88 million after tax), equal to
$.24 per share.
Cash Flows from Operating Activities
For the nine months ended March 31, 2018, net cash flows provided by operating activities
were $1.93 billion, compared with $1.25 billion in the prior year.
The increase primarily reflected higher earnings before income taxes, as well as a net
increase in cash from certain working capital components. The provisional charges
resulting from the TCJA that lowered net earnings did not impact cash flow from
operations.
Outlook for Fiscal 2018 Full Year
Global prestige beauty is performing exceptionally well and is estimated to grow 6% to 7% during
the fiscal year. The Company expects to grow about double the industry for fiscal 2018,
benefitting from loyalty to its high-quality products, strong innovation, outreach to new target
consumers and growth from recent acquisitions. The continued emphasis on a digital-first
approach and on fast-growing markets and channels are also expected to contribute to growth.
The Company recently learned that some of its testing related to certain product advertising claims
did not meet the Company’s standards and needs to be further validated. This was determined
pursuant to a Company review initiated in its fiscal 2018 third quarter in accordance with its
internal procedures. This review is ongoing, and certain advertising claims will be modified.
This is not a product safety issue. The Company’s products are completely safe. This does not
relate to the quality of the ingredients or the manufacturing of the Company’s products. The
quality of our products remains the highest priority for the Company. The Company is diligently
addressing this matter and will make any necessary changes to product advertising claims as soon
as possible. At this time, the Company does not know whether the results of this ongoing review
will be material to the Company.

Page 7 of 15
The Company is also mindful of risks related to social and political issues, geopolitical tensions,
regulatory matters, including the imposition of tariffs, terrorism, currency volatility and economic
challenges affecting consumer spending in certain countries and travel corridors. The Company is
also cautious of the decline in retail traffic, primarily related to some brick-and-mortar stores in the
United States.
Full Year Fiscal 2018
Reported net sales are forecasted to increase between 15% and 16% versus the prior-year
period.
Foreign currency translation is expected to positively impact sales by approximately 4%
versus the prior-year period.
Net sales are forecasted to grow between 11% and 12% in constant currency. The
Company’s fiscal 2017 acquisitions of Too Faced and BECCA are forecasted to contribute
approximately 2 percentage points of incremental sales growth.
Reported diluted net earnings per share are projected to be between $2.78 and $2.86.
The provision for income taxes includes $392 million, equal to $1.04 per diluted common
share of one-time charges under the TCJA. For the full fiscal year, the Company expects
the global effective tax rate to be approximately 23%, before charges associated with
restructuring and other activities, and the impact of the TCJA provisional charges.
The Company expects to take charges associated with previously approved restructuring
and other activities relating to Leading Beauty Forward in fiscal 2018 of approximately
$260 million to $280 million, equal to $.52 to $.56 per diluted common share.
Diluted net earnings per share before charges associated with restructuring and other
activities, and the impact of the TCJA provisional charges are projected to be between
$4.38 and $4.42.
The positive currency impact on the sales growth equates to about $.22 of earnings per
share. On a constant currency basis, before charges associated with restructuring and other
activities, and the impact of the TCJA provisional charges, diluted earnings per share are
expected to increase between 20% and 21%.

Page 8 of 15
________________________________________________________________________________________________
Reconciliation between GAAP and
non-GAAP
Year Ending June 30, 2018 (F) Twelve Months June 30
Net Sales Growth
Diluted EPS Growth Diluted Earnings Per Share
(Unaudited) Reported
Basis
Constant
Currency
Reported
Basis
Constant
Currency
2018 (F) 2017
Forecast / actual results including
restructuring and other charges, the TCJA
charges, and adjustments…………….…..… 15-16 %(1) 11-12 % (17)-(15) %(1) (24)-(21) % $2.78-$2.86 (1) $3.35 (1)
Non-GAAP
Restructuring and other charges…………….
.52-.56 .38
Contingent consideration……..………..…... (.12 )
Transition Tax resulting from the TCJA……… .88
Remeasurement of U.S. net deferred tax
assets resulting from the TCJA………………… .11
Net deferred tax liability related to certain
foreign withholding taxes on planned
repatriation resulting from the TCJA…….… .05
Intangible asset impairments…………...….. .06
China deferred tax asset valuation allowance
reversal…………………………………..…. (.20 )
Forecast / actual results adjusted……….......
15-16 % 11-12 % 26-27 % 20-21 % 4.38-4.42 $3.47
Impact of foreign currency on earnings
per share..........................................................
(.22 )
Forecasted constant currency earnings
per share……………………..………………
$4.16-$4.20
(1) Represents GAAP.
(F) Represents forecast.
Conference Call
The Estée Lauder Companies will host a conference call at 9:30 a.m. (ET) today, May 2, 2018 to
discuss its results. The dial-in number for the call is 888-294-4716 in the U.S. or 706-902-0101
internationally (conference ID number: 9948347). The call will also be webcast live at
http://www.elcompanies.com/investors/events-and-presentations.
Cautionary Note Regarding Forward-Looking Statements The forward-looking statements in this press release, including those containing words like “expect,” “plans,” “may,”
“could,” “anticipate,” “estimate,” “projected,” “forecasted,” those in Mr. Freda’s remarks and those in the “Outlook
for Fiscal 2018 Full Year” section involve risks and uncertainties. Factors that could cause actual results to differ
materially from those forward-looking statements include the following:
(1) increased competitive activity from companies in the skin care, makeup, fragrance and hair care businesses;
(2) the Company’s ability to develop, produce and market new products on which future operating results may
depend and to successfully address challenges in the Company’s business;
(3) consolidations, restructurings, bankruptcies and reorganizations in the retail industry, and other factors
causing a decrease in the number of stores that sell the Company’s products, an increase in the ownership
concentration within the retail industry, ownership of retailers by the Company’s competitors or ownership
of competitors by the Company’s customers that are retailers and our inability to collect receivables;
(4) destocking and tighter working capital management by retailers;
(5) the success, or changes in timing or scope, of new product launches and the success, or changes in the
timing or the scope, of advertising, sampling and merchandising programs;
(6) shifts in the preferences of consumers as to where and how they shop;
(7) social, political and economic risks to the Company’s foreign or domestic manufacturing, distribution and
retail operations, including changes in foreign investment and trade policies and regulations of the host
countries and of the United States;
(8) changes in the laws, regulations and policies (including the interpretations and enforcement thereof) that
affect, or will affect, the Company’s business, including those relating to its products or distribution
networks, changes in accounting standards, tax laws and regulations, environmental or climate change laws,

Page 9 of 15
regulations or accords, trade rules and customs regulations, and the outcome and expense of legal or
regulatory proceedings, and any action the Company may take as a result;
(9) foreign currency fluctuations affecting the Company’s results of operations and the value of its foreign
assets, the relative prices at which the Company and its foreign competitors sell products in the same
markets and the Company’s operating and manufacturing costs outside of the United States;
(10) changes in global or local conditions, including those due to the volatility in the global credit and equity
markets, natural or man-made disasters, real or perceived epidemics, or energy costs, that could affect
consumer purchasing, the willingness or ability of consumers to travel and/or purchase the Company’s
products while traveling, the financial strength of the Company’s customers, suppliers or other contract
counterparties, the Company’s operations, the cost and availability of capital which the Company may need
for new equipment, facilities or acquisitions, the returns that the Company is able to generate on its pension
assets and the resulting impact on its funding obligations, the cost and availability of raw materials and the
assumptions underlying the Company’s critical accounting estimates;
(11) shipment delays, commodity pricing, depletion of inventory and increased production costs resulting from
disruptions of operations at any of the facilities that manufacture the Company’s products or at the
Company’s distribution or inventory centers, including disruptions that may be caused by the
implementation of information technology initiatives or by restructurings;
(12) real estate rates and availability, which may affect the Company’s ability to increase or maintain the number
of retail locations at which the Company sells its products and the costs associated with the Company’s
other facilities;
(13) changes in product mix to products which are less profitable;
(14) the Company’s ability to acquire, develop or implement new information and distribution technologies and
initiatives on a timely basis and within the Company’s cost estimates and the Company’s ability to maintain
continuous operations of such systems and the security of data and other information that may be stored in
such systems or other systems or media;
(15) the Company’s ability to capitalize on opportunities for improved efficiency, such as publicly-announced
strategies and restructuring and cost-savings initiatives, and to integrate acquired businesses and realize
value therefrom;
(16) consequences attributable to local or international conflicts around the world, as well as from any terrorist
attack, retaliation or similar threats;
(17) the timing and impact of acquisitions, investments and divestitures; and
(18) additional factors as described in the Company’s filings with the Securities and Exchange Commission,
including its Annual Report on Form 10-K for the fiscal year ended June 30, 2017.
The Company assumes no responsibility to update forward-looking statements made herein or otherwise.
The Estée Lauder Companies Inc. is one of the world’s leading manufacturers and marketers of
quality skin care, makeup, fragrance and hair care products. The Company’s products are sold in
over 150 countries and territories under brand names including: Estée Lauder, Aramis, Clinique,
Prescriptives, Lab Series, Origins, Tommy Hilfiger, M•A•C, Kiton, La Mer, Bobbi Brown, Donna
Karan New York, DKNY, Aveda, Jo Malone London, Bumble and bumble, Michael Kors,
Darphin, Tom Ford, Smashbox, Ermenegildo Zegna, AERIN, Tory Burch, RODIN olio lusso, Le
Labo, Editions de Parfums Frédéric Malle, GLAMGLOW, By Kilian, BECCA and Too Faced.
ELC-F ELC-E

Page 10 of 15
THE ESTÉE LAUDER COMPANIES INC.
CONSOLIDATED STATEMENTS OF EARNINGS (Unaudited; In millions, except per share data and percentages)
Three Months Ended
March 31
Percent
Change
Nine Months Ended
March 31
Percent
Change 2018 2017 2018 2017
Net Sales (A)....................................................................... $ 3,370 $ 2,857 18 % $ 10,388 $ 8,930 16 %
Cost of sales (A)..……..……………………………...…... 683 591 2,147 1,824
Gross Profit…………………………………………….... 2,687 2,266 19 % 8,241 7,106 16 %
Gross Margin…………………………….………..……. 79.7 % 79.3 % 79.3 % 79.6 %
Operating expenses:
Selling, general and administrative (B).……………….. 2,093 1,780 6,268 5,522
Restructuring and other charges (A)……..……...…..… 97 59 198 122
2,190 1,839 19 % 6,466 5,644 15 %
Operating Expense Margin…………………..….…….. 65.0 % 64.4 % 62.2 % 63.2 %
Operating Income………………..……………………… 497 427 16 % 1,775 1,462 21 %
Operating Income Margin………………………......... 14.7 % 14.9 % 17.1 % 16.4 %
Interest expense…..……………………………………….. 33 28 96 71
Interest income and investment income, net…………....… 16 8 40 19
Earnings before Income Taxes………..………………... 480 407 18 % 1,719 1,410 22 %
Provision for income taxes (C) (D)……………..………… 106 107 790 384
Net Earnings………………………...…………………… 374 300 25 % 929 1,026 (9 )%
Net earnings attributable to noncontrolling interests….….. (2 ) (2 ) (7 ) (6 )
Net Earnings Attributable to The Estée Lauder
Companies Inc.………………..…………………….….
$ 372
$ 298
25 %
$ 922
$ 1,020
(10 )%
Net earnings attributable to The Estée Lauder Companies
Inc. per common share:
Basic…………………………...………………………. $ 1.01 $ .81 25 % $ 2.50 $ 2.78 (10 )%
Diluted………………………………...……………….. .99 .80 24 % 2.45 2.74 (10 )%
Weighted average common shares outstanding:
Basic……………………………...……………………. 367.9 367.0 368.3 366.8
Diluted……………………………..………………….. 375.7 372.3 375.7 372.7
(A) In May 2016, the Company announced a multi-year initiative (Leading Beauty Forward) to build on its strengths and better
leverage its cost structure to free resources for investment to continue its growth momentum. Leading Beauty Forward is designed
to enhance the Company’s go-to-market capabilities, reinforce its leadership in global prestige beauty and continue creating
sustainable value. During the fiscal 2018 third quarter, the Company continued to approve specific initiatives under Leading
Beauty Forward. The Company plans to approve additional initiatives through fiscal 2019 and expects to complete those
initiatives through fiscal 2021. The Company expects Leading Beauty Forward will result in related restructuring and other
charges totaling between $600 million and $700 million, before taxes. Once fully implemented, Leading Beauty Forward is
expected to yield annual net benefits of between $200 million and $300 million, before taxes, of which a portion is expected to be
reinvested in future growth initiatives.
Page 11 of 15
THE ESTÉE LAUDER COMPANIES INC.
(B) The Company recorded $9 million and $6 million of income within selling, general and administrative expenses for the
three and nine months ended March 31, 2018, respectively, to reflect changes in the fair value of its contingent
consideration related to certain of its fiscal 2015 and 2016 acquisitions. During the three and nine months ended March 31,
2017, the Company recorded $3 million of income and $1 million of expense, respectively.
(C) During the first quarter of fiscal 2018, the Company adopted a new accounting standard for share-based compensation
that requires excess tax benefits and tax deficiencies related to stock-based compensation awards be recorded as income
tax benefit or expense in the income statement. As a result of the adoption of this new standard, the Company recognized
$19 million and $43 million of excess tax benefits as a reduction to the provision for income taxes for the three and nine
months ended March 31, 2018, respectively. This reduced the effective rate for income taxes by 400 basis points and 250
basis points, which added approximately $.05 and $.11 to diluted net earnings per share for the three and nine months
ended March 31, 2018, respectively.
(D) The three and nine months ended March 31, 2018 reflects the reduction of the U.S. statutory tax rate, as well as
provisional amounts for the impact of the TCJA. During the second quarter, the Company recorded a charge of $325
million, equal to $.86 per common share attributable to the Transition Tax, a $51 million charge, equal to $.14 per common
share related to the remeasurement of U.S. net deferred tax assets, and an $18 million charge, equal to $.05 per common
share to record a net deferred tax liability for foreign withholding taxes related to the repatriation of certain foreign
earnings.
During the fiscal 2018 third quarter, the Company made adjustments to the provisional one-time TCJA charges it recorded
in the fiscal 2018 second quarter. The adjustments included an additional $7 million charge to the Transition Tax and a $9
million credit related to the remeasurement of U.S. net deferred tax assets.
These amounts, which are provisional, may require adjustments as anticipated guidance is issued and as additional analysis
of the provisions of the TCJA is completed. Any such adjustments will be finalized within the allowable one year
measurement period.

Page 12 of 15
THE ESTÉE LAUDER COMPANIES INC.
Total returns and charges associated with restructuring and other activities, changes in the fair value of contingent
consideration and adjustments to certain previously recorded TCJA charges included in net earnings for the three and
nine months ended March 31, 2018 and 2017 were as follows.
Sales
Returns
Cost of
Sales
Operating Expenses
Total
After
Tax
Diluted
Earnings
Per
Share
Restructuring
Charges
Other
Charges/
Adjust-
ments
(Unaudited)
(In millions, except per share data)
Three Months Ended March 31, 2018
Leading Beauty Forward……………..…..... $— $3 $72 $25 $100 $75 $ .20
Contingent consideration…..……………..... — — — (9 ) (9 ) (6 ) (.02 )
Transition Tax resulting from the TCJA….. — — — — — 7 .02
Remeasurement of U.S. net deferred tax
assets resulting from the TCJA………….… — — — — — (9 ) (.02 )
Total………………………………..….... $— $3 $72 $16 $91 $67 $ .18
Nine Months Ended March 31, 2018
Leading Beauty Forward…………….….... $— $9 $125 $73 $207 $156 $ .42
Contingent consideration…..……………... — — — (6 ) (6 ) (4 ) (.01 )
Transition Tax resulting from the TCJA… — — — — — 332 .88
Remeasurement of U.S. net deferred tax
assets resulting from the TCJA…………… — — — — — 42 .11
Net deferred tax liability related to certain
foreign withholding taxes on planned
repatriation resulting from the TCJA…….. — — — — — 18 .05
Total……………………………...…….. $— $9 $125 $67 $201 $544 $1.45
_______________________________________________________________________________________________________________
Sales
Returns
Cost of
Sales
Operating Expenses
Total
After
Tax
Diluted
Earnings
Per
Share
Restructuring
Charges
Other
Charges/
Adjust-
ments
(Unaudited)
(In millions, except per share data)
Three Months Ended March 31, 2017
Leading Beauty Forward………..…........... $— $3 $41 $18 $ 62 $42 $.11
Contingent consideration………………..... — — — (3 ) (3 ) (5 ) (.01 )
Total………………………………….... $— $3 $41 $15 $ 59 $37 $.10
Nine Months Ended March 31, 2017
Leading Beauty Forward………..…........... $ 2 $10 $70 $52 $134 $88 $.24
Contingent consideration……………...….. — — — 1 1 (2 ) (.01 )
Total……………………………...…….. $ 2 $10 $70 $53 $135 $86 $.23

Page 13 of 15
THE ESTÉE LAUDER COMPANIES INC.
SUMMARY OF CONSOLIDATED RESULTS (Unaudited; Dollars in millions)
Nine Months Ended March 31
Net Sales Percent Change
Operating
Income (Loss)
Percent
Change
2018 2017
Reported
Basis
Constant
Currency 2018 2017
Reported
Basis
Results by Geographic Region
The Americas………..….…………. $ 3,818 $ 3,646 5 % 4 % $ 231 $ 236 (2 )%
Europe, the Middle East & Africa…. 4,236 3,477 22 17 1,194 956 25
Asia/Pacific………………………... 2,334 1,809 29 26 557 404 38
Subtotal………………………….. 10,388 8,932 16 13 1,982 1,596 24
Returns and charges associated with
restructuring and other activities…..
— (2 )
(207 ) (134 )
Total…………………………..…... $ 10,388 $ 8,930 16 % 13 % $ 1,775 $ 1,462 21 %
Results by Product Category
Skin Care…………………………... $ 4,216 $ 3,455 22 % 19 % $ 1,219 $ 828 47 %
Makeup………………………….…. 4,275 3,743 14 11 514 562 (9 )
Fragrance……………………….….. 1,423 1,275 12 8 195 157 24
Hair Care…………………………... 419 399 5 4 45 38 18
Other……………………………….. 55 60 (8 ) (10 ) 9 11 (18 )
Subtotal………………………….. 10,388 8,932 16 13 1,982 1,596 24
Returns and charges associated with
restructuring and other activities…..
— (2 )
(207 ) (134 )
Total…………………..…………... $ 10,388 $ 8,930 16 % 13 % $ 1,775 $ 1,462 21 %
______________
This earnings release includes some non-GAAP financial measures relating to charges associated with restructuring and other
activities, the changes in the fair value of contingent consideration and the impact of the TCJA provisional charges. The
following is a reconciliation between the non-GAAP financial measures and the most directly comparable GAAP measures for
certain consolidated statements of earnings accounts before and after these items. The Company uses certain non-GAAP
financial measures, among other financial measures, to evaluate its operating performance, which represent the manner in
which the Company conducts and views its business. Management believes that excluding certain items that are not
comparable from period to period, or do not reflect the Company’s underlying ongoing business, provides transparency for
such items and helps investors and others compare and analyze operating performance from period to period. In the future,
the Company expects to incur charges or adjustments similar in nature to certain of those presented below; however, the
impact to the Company’s results in a given period may be highly variable and difficult to predict. The Company’s non-
GAAP financial measures may not be comparable to similarly titled measures used by, or determined in a manner
consistent with, other companies. While the Company considers the non-GAAP measures useful in analyzing its results,
they are not intended to replace, or act as a substitute for, any presentation included in the consolidated financial statements
prepared in conformity with GAAP.
The Company operates on a global basis, with the majority of its net sales generated outside the United States.
Accordingly, fluctuations in foreign currency exchange rates can affect the Company’s results of operations. Therefore,
the Company presents certain net sales, operating results and diluted earnings per share information excluding the effect of
foreign currency rate fluctuations to provide a framework for assessing the performance of its underlying business outside
the United States. Constant currency information compares results between periods as if exchange rates had remained
constant period-over-period. The Company calculates constant currency information by translating current-period results
using prior-year period weighted average foreign currency exchange rates.

Page 14 of 15
THE ESTÉE LAUDER COMPANIES INC.
Reconciliation of Certain Consolidated Statements of Earnings Accounts
Before and After Returns, Charges and Other Adjustments (Unaudited; In millions, except per share data and percentages)
Three Months Ended
March 31, 2018
Three Months Ended
March 31, 2017
As
Reported
Returns/
Charges/
Adjust-
ments Adjusted
Impact of
foreign
currency
translation
Constant
Currency
As
Reported
Returns/
Charges/
Adjust-
ments
Adjusted
% Change
versus Prior
Year Before
Charges
% Change
Constant
Currency
Net Sales…................................. $3,370 $— $3,370 $(147) $3,223 $2,857 $— $2,857 18% 13%
Cost of sales………………........ 683 (3 ) 680 591 (3 ) 588
Gross Profit……………….….... 2,687 3 2,690 2,266 3 2,269 19%
Gross Margin………………... 79.7% 79.8% 79.3% 79.4%
Operating expenses……………. 2,190 (88 ) 2,102 1,839 (56 ) 1,783 18%
Operating Expense Margin….. 65.0% 62.4% 64.4% 62.4%
Operating Income……………... 497 91 588 427 59 486 21%
Operating Income Margin.….. 14.7% 17.4% 14.9% 17.0%
Provision for income taxes......... 106 24 130 107 22 129
Net Earnings Attributable to The
Estée Lauder Companies Inc.... 372 67 439 298 37 335
31%
Diluted net earnings attributable
to The Estée Lauder Companies
Inc. per common share…….….. .99 .18 1.17
(.11) 1.06 .80 .10 .90
30% 17%
Nine Months Ended
March 31, 2018
Nine Months Ended
March 31, 2017
As
Reported
Returns/
Charges/
Adjust-
ments Adjusted
Impact of
foreign
currency
translation
Constant
Currency
As
Reported
Returns/
Charges/
Adjust-
ments
Adjusted
% Change
versus Prior
Year Before
Charges
% Change
Constant
Currency
Net Sales…................................. $10,388 $— $10,388 $(259) $10,129 $8,930 $2 $8,932 16% 13%
Cost of sales………………........ 2,147 (9 ) 2,138 1,824 (10 ) 1,814
Gross Profit……………….….... 8,241 9 8,250 7,106 12 7,118 16%
Gross Margin………………... 79.3% 79.4% 79.6% 79.7%
Operating expenses……………. 6,466 (192 ) 6,274 5,644 (123 ) 5,521 14%
Operating Expense Margin….. 62.2% 60.4% 63.2% 61.8%
Operating Income……………... 1,775 201 1,976 1,462 135 1,597 24%
Operating Income Margin.….. 17.1% 19.0% 16.4% 17.9%
Provision for income taxes......... 790 (343 ) 447 384 49 433
Net Earnings Attributable to The
Estée Lauder Companies Inc.... 922 544 1,466 1,020 86 1,106
33%
Diluted net earnings attributable
to The Estée Lauder Companies
Inc. per common share…….….. 2.45 1.45 3.90
(.16) 3.75 2.74 .23 2.97
31% 26%
Amounts may not sum due to rounding.

Page 15 of 15
THE ESTÉE LAUDER COMPANIES INC.
CONDENSED CONSOLIDATED BALANCE SHEETS (Unaudited; In millions)
March 31
2018
June 30 2017
March 31 2017
ASSETS
Current Assets
Cash and cash equivalents…………………………………….. $ 2,140 $ 1,136 $ 1,139
Short-term investments…………………………………………
ntsinvestments………………………………………..................
....................
384 605 701
Accounts receivable, net………………………………………. 1,761 1,395 1,528
Inventory and promotional merchandise, net…………………. 1,533 1,479
1,310
Prepaid expenses and other current assets…………………….. 351 349 294
Total Current Assets…………………………………… 6,169 4,964 4,972
Property, Plant and Equipment, net………………………... 1,726 1,671 1,576
Other Assets………………………………………………….. 4,877 4,933 4,897
Total Assets…………………………………………….. $ 12,772 $ 11,568 $ 11,445
LIABILITIES AND EQUITY
Current Liabilities
Current debt…………………………….……………………... $ 296 $ 189 $ 519
Accounts payable ……………………………………………... 884 835 597
Other accrued liabilities……………………………………….. 2,208 1,799 1,744
Total Current Liabilities……………………………….. 3,388 2,823 2,860
Noncurrent Liabilities
Long-term debt………………………………………………... 3,363 3,383 3,377
Other noncurrent liabilities……………………………………. 1,284 960 1,073
Total Noncurrent Liabilities…………………………… 4,647 4,343 4,450
Total Equity………………………………………………….. 4,737 4,402 4,135
Total Liabilities and Equity……………………………. $ 12,772 $ 11,568 $ 11,445
SELECT CASH FLOW DATA (Unaudited; In millions)
Nine Months Ended
March 31
2018 2017
Cash Flows from Operating Activities
Net earnings…………………………………………………………………. $ 929 $ 1,026
Depreciation and amortization………………………………………….…… 389 337
Deferred income taxes………………………………………………………..
taxes…………………………………………………………
remeasurement………………………………………….
taxes………………………………………………….……
84 (84 )
Other items…………………………………………………………….……..
179 161
Changes in operating assets and liabilities:
Increase in accounts receivable, net……………………….…………….…
(325 ) (242 )
Decrease in inventory and promotional merchandise, net………..……….. — 59
Decrease (increase) in other assets, net……………………………………
net……………...…………………………………
1 (30 )
Increase in accounts payable and other liabilities………………..………...
674 25
Net cash flows provided by operating activities…................................ $ 1,931 $ 1,252
Capital expenditures……………………………………………………..….. $ 368 $ 316
Acquisition of businesses………………………………………….………...
11 1,690
Proceeds (purchase) of investments, net…………………………………….. 224 (112 )
Payments to acquire treasury stock………………………………….….……
676 363
Dividends paid............................................................……………...……..…
407 361
Increase in long-term debt, net………………………………………………
net............................................................……………...……..…
— 1,488 # # #