news media sentiment and investor behavior
TRANSCRIPT

News Media Sentiment and Investor Behavior
Roman Kraussl
Elizaveta Mirgorodskaya∗
November 2013
Abstract
This paper investigates the impact of news media sentiment on financial market
returns and volatilities in the long run. We hypothesize that the way media for-
mulate and present news to the public produces different perceptions and, thus,
incurs different investor behavior. To analyze such framing effects we distinguish
between optimistic and pessimistic news frames. We construct a monthly media sen-
timent indicator by taking the ratio of the number of newspaper articles that contain
predetermined negative words to the number of newspaper articles that contain pre-
determined positive words in the leading paragraph. We investigate four different
financial market segments to study sentiment and pricing bubbles in isolation. Our
results indicate that pessimistic news media sentiment is positively related to global
market volatility and negatively related to global market returns 12 to 24 months
in advance. We show that our media sentiment indicator reflects very well financial
market crises and pricing bubbles over the past twenty years.
JEL Classification: G01, G10, E32
Keywords: Investor behavior; News media sentiment; Financial market crises;
Pricing bubbles; Framing effects
∗Roman Kraussl ([email protected]) is affiliated with the Luxembourg School of Finance, theEmory Center for Alternative Investments at Goizueta Business School, and the Center for FinancialStudies in Frankfurt/Main. Elizaveta Mirgorodskaya ([email protected]) is from VU UniversityAmsterdam. We thank Michael Damm, Emanuele Bajo, and seminar participants at VU UniversityAmsterdam and at the 6th International Accounting & Finance Doctoral Symposium in June 2013 inBologna, Italy for useful comments and helpful suggestions.

1 Introduction
News media are a very competitive industry and its main goal is to capture attention.
They produce anything that goes along with the numbers from the markets. Shiller
(2005) notes that news plays a crucial role in buying or selling decisions among traders
as they constantly react on newly incoming information. He argues that news media are
an important player in creating market sentiment and similar thinking as it spreads ideas
and, thus, can significantly contribute to herding behavior and influence price movement
on financial markets.
Framing effects within the news media has been an important research topic
among journalism, political science and mass communication scholars. Price, Tewks-
bury, and Powers (1997) argue that the news framing effect has to do with the way
how events and issues are packaged and presented by journalists to the public. They
believe that news frames can fundamentally affect the way readers understand these
events and issues. Authors suggest that news frames can activate certain ideas, feelings,
and values, encourage particular “trains of thoughts” and lead audience members to
arrive to predictable conclusions. Price and Tewksbury (1997) explain the news media
framing effect by the applicability effect in their knowledge activation process model.
A framing effect of a news story renders particular thoughts applicable through salient
attributes of a message such as its organization, selection of content or thematic struc-
ture. The knowledge activation model assumes that at any particular point in time, a
mix of particular items of knowledge that are subject to processing (activating) depends
on characteristics of a person’s established knowledge store. When making evaluations
of situations, people tend to use (to activate) ideas and feelings that are most accessible
and applicable.
Iyengar (1991) examines the impact of news framing on the ways people ascribe
responsibility for social, political, and economic conditions. He finds that news takes
more often an episodic rather than thematic perspective towards events they cover.
Schuck and Vreese (2006) investigate the effect of two identified news frames, risk and
opportunity, on the public support for the European Union enlargement. They find that
participants in the opportunity frame condition show significantly higher support com-
pared to participants in the risk condition. These studies show that framing influences
the perception of new information and might be a powerful tool in influencing public
opinion and possibly public’s future actions.
Our paper uses the concept of framing effects in order to explain the way news
media influence investors’ decisions. We hypothesize that the way in which a newspaper
article describes a current financial market state or presents new financial information
influences investor’s perception about future prospects and investor sentiment. As a
1

result, investors might form certain expectations and update their investment decisions
that can have a direct influence on the performance of the financial markets.
Previous research investigates the immediate impact news media might have on
the performance of financial markets. For instance, Antweiler and Frank (2004) in-
vestigate the effect of Internet stock message boards posted on the websites of Yahoo!
Finance and Raging Bull on the short-term market performance of 45 U.S. listed com-
panies. They find weak evidence that the number of content messages posted helps to
predict stock’s intraday volatility but do not find evidence of news media content in-
fluencing market returns and trading volume. Tetlock (2007) analyzes the interaction
between the content of the Wall Street Journal column Abreast of the Market and the
stock market on a daily basis. He finds that unusually high or low values of media
pessimism predict high trading volume, while low market returns lead to high media
pessimism, and concludes that news media content can serve as a proxy for investor
sentiment. In a more recent study, Garcıa (2013) constructs a daily proxy for investor
sentiment by taking a fraction of positive and negative words in two columns of financial
news, Financial Markets and Topics in Wall Street from the New York Times. He finds
evidence of an asymmetric predictive activity of news content on stock returns, espe-
cially during recessions. The effect is particularly strong on Mondays and on trading
days after holidays, which persists into the afternoon of the trading day.
Another strand of the financial market sentiment literature analyzes how investor
sentiment affects the cross-section of stock returns. For instance, Baker and Wurgler
(2006) construct an investor sentiment indicator by considering a number of proxies sug-
gested in previous research and by forming a composite sentiment index based on their
first principle component. The proxies for investor sentiment are the closed-end-fund
discount, the New York Stock Exchange (NYSE) share turnover, the number and aver-
age first-day returns on initial public offerings (IPOs), the equity share in new issues, and
the dividend premium. They show that their resulted monthly investor sentiment index
reflects reasonably well previous U.S. financial bubbles and crises from 1961 onwards till
the Internet bubble of 2000-01.
Our paper combines these two strands of the literature. However, in sharp con-
trast to Antweiler and Frank (2004), Tetlock (2007), and Garcıa (2013), we investigate
the effect of media sentiment on the performance of financial markets in the long-run.
Garcıa (2013) argues that the effect of news media sentiment partially reverses over the
following four trading days. On the other hand, McCombs (2004) asserts that the real
news media effect can be achieved only in the long-run, on the contrary to the view
that media effects are immediate. Based on this intuition, we investigate here whether
news media sentiment can significantly influence investor decisions over a longer hori-
zon. Thus, we hypothesize that pessimistic news media sentiment exerts a downward
2

(upward) pressure on financial market returns (volatility) in the long-run. As far as we
know, this paper is the first that investigates the impact news media have over a longer
horizon on financial markets.
We collect our news data by searching a predetermined set of keywords on the Lex-
isNexis database. As news sources, we select the New York Times, the Wall Street Jour-
nal Abstracts, and the Financial Times. We distinguish between two news frames: op-
timism and pessimism. The former expresses optimistic news media sentiment, whereas
the latter expresses pessimistic news media sentiment. We argue that news that uses
at least one of our predetermined positive words raise positive, optimistic thoughts in
readers’ minds. Similarly, we assume that news that uses at least one of our negative
words raise negative, pessimistic thoughts in readers’ minds. We borrow negative words
from the list of the thirty most frequent words occurring in 10-Ks from the Fin-Neg
Word lists presented in Loughran and McDonald (2011). We determine positive words
by searching for antonyms of those negative words.
We construct our monthly media sentiment indicator by taking the ratio of the
number of newspaper articles that contain predetermined negative words to the number
of newspaper articles that contain predetermined positive words in the leading para-
graph. We limit our search for keywords to the leading paragraph only since we believe
that this paragraph summarizes the main message of the article and has the greatest
impact on the reader. LexisNexis classifies news into categories based on the information
discussed in the article. We select four such categories: (1) Banking and Finance; (2)
Computing and Information Technology; (3) Property; (4) Asia. These specific cate-
gories allow us to investigate particular crises in isolation, such, as but not limited to,
the Asian crisis in 1997/98, the dot-com crash in 2000-01, and the most recent financial
downturn caused by declining prices on the U.S. housing market and by the bankruptcy
of the global U.S. investment bank Lehman Brothers in September 2008. We analyze
the potential media sentiment impact on financial market returns and volatility by esti-
mating a vector autoregressive (VAR) model and by performing Granger causality tests.
We specify in our monthly model the market index, the media sentiment indicator, and
the market volatility as endogenous variables up to two years (lag 24) to capture any
long-term effects.
We find a significant long-term causal relation of our monthly media sentiment
indicator on the global financial markets performance. Our results show a significant
negative (positive) long-term relation between our media sentiment indicator and mar-
ket returns (volatility). We find strong evidence of the predictive activity of the media
sentiment indicator for global market returns and volatilities 12 to 24 months in advance.
Additionally, we find evidence of the predictive activity of the media sentiment indicator
for Asian market returns and volatilities 1 to 6 months in advance. The interpretation of
3

our findings is that news media create pessimistic market sentiment as more newspaper
articles express pessimism. This effect takes place gradually rather than immediately.
We also show that our constructed monthly media sentiment indicator reflects reason-
ably well historical crises that have occurred between 1990 and 2013. As such, we argue
that it can be used as a leading investor sentiment indicator similar to the ones proposed
by Baker and Wurgler (2006).
The remainder of this paper is organized as follows: Section 2 presents our sample
and discusses the methodology. Section 3 presents our findings. Section 4 performs the
robustness check and Section 5 concludes.
2 Data and Methodology
2.1 Sample
Following Antweiler and Frank (2004), Tetlock (2007), and Garcıa (2013), we focus
our analysis on the three most relevant daily financial newspapers: Wall Street Jour-
nal Abstracts (WSJ), the Financial Times (FT), and the New York Times (NYT). Both
Tetlock (2007) and Garcıa (2013) employ a computer algorithm with built-in dictionaries
in order to construct their news indices. Tetlock (2007) uses a well-known quantitative
content analysis program called General Inquirer to analyze daily variations in the Wall
Street Journal’s Abreast of the Market column. He gathers newspaper data by counting
the number of words on a daily basis that fall into one of the 77 predetermined General
Inquirer categories from Harvard’s psychosocial IV-4 dictionary. These 77 categories
are strongly related to pessimistic words in the newspaper column so that a single media
factor constructed from the gathered data is referred to as a pessimism factor. Similarly,
Garcıa (2013) constructs his news media indicator by analyzing the content of the two
NYT columns Financial Markets and Topics of Wall Street by employing a dictionary
approach. He counts the number of positive and negative words in each newspaper
article by using the word dictionaries provided by McDonald1 and constructs his daily
sentiment indicator by taking the difference between the fractions of the number of neg-
ative and positive words with respect to the total number of words.
We obtain our news data from the LexisNexis database, which provides news-
paper articles, market research, and company information. The news section contains
online articles from the world’s most accredited newspapers, newswires, magazines, and
key information providers. We gather our data by searching LexisNexis for WSJ, FT,
and NYT articles that include one of our predetermined positive (negative) words in the
leading paragraph. A list of words is presented in Table I. We assume that a newspaper
1The list of words is available online at http : //www3.nd.edu/ ∼ mcdonald/Word Lists.html.
4

article that contains one of the positive words in the leading paragraph is more likely
to raise positive thoughts on readers’ minds and to express optimistic media sentiment.
Similarly, articles that contain one of the negative words in the leading paragraph are
more likely to raise negative thoughts on readers’ minds and to express pessimism. Thus,
we classify former newspaper articles as an optimistic news frame and latter as a pes-
simistic news frame. We limit our search only to the leading paragraph of a newspaper
article since this paragraph summarizes the main message of the article and has the
greatest impact on the reader.
[Please insert Table I about here]
We borrow some negative words from the list of the thirty most frequent words
occurring in 10-Ks from the so-called Fin-Neg word list, which are reported in Loughran
and McDonald (2011). We extend the list with some additional negative words, which
are classified as negative in the McDonald dictionary and which we believe are relevant
for financial press reports. Our list of positive words contains antonyms of negative words
and some additional words, which are classified as positive in the McDonald dictionary
and which we believe are often used in the financial press. Table I lists our defined 27
positive and 27 negative words.
For robustness checks we prepare a different set of news data by limiting our
search query to only those newspaper articles that contain positive (negative) words
and do not contain certain negative (positive) words. Such a search specification allows
preventing to some extent the inclusion of news with negative (positive) content in the
optimistic (pessimistic) news frame data set, and thus, making data more void of noise.
LexisNexis allows excluding only up to 15 words. Therefore, we create a subset of ex-
cluded words from the original list of negative and positive words. Table I presents the
excluded negative and positive words marked in bold.
We distinguish four LexisNexis categories: (1) Banking and Finance, (2) Comput-
ing and Information Technology, (3) Property, and (4) Asia. LexisNexis describes each
category as following: the category Banking and Finance contains news about financial
institutions and services, credit and lending, financial markets and trading, investments,
and banking law and policy. The category Computing and Information Technology cov-
ers news about the computing industry, including the design, production and sale of
electronic components, computer hardware and software. The category Property tar-
gets news about the commercial and residential property markets, including property
development, management and sales. Asia is the fourth and final category and contains
news about countries and regions located in the Asian region.
By specifying our news search to these particular categories we are able to extract
5
news with the relevant content and to study the effect of these newspaper articles on the
financial markets. In particular, we are interested to see the effect of news around the
time of major economic downturns such as the Japanese real estate bubble in 1990/91,
the Asian crisis of 1997-98, the dot-com crash in 2000-01, the U.S. housing market that
reached its peak in 2006, started to decline in 2007 and reached a new low in 2012, and
the bankruptcy of Lehman Brothers in September 2008 that was followed by a wave
of bankruptcies of other financial institutions across the world (Adams, C., et al, 1998;
Matieson, D., et al., 2001).
We collect the data for the time span between January 1, 1990 and December
31, 2012. We count the number of newspaper articles found during a particular month
in each category that includes any of the searched words. Table II presents descriptive
statistics of the average number of newspaper articles that are found on LexisNexis for all
four categories and for each category separately on a monthly frequency: (i) the average
number of all newspaper articles; (ii) the average number of newspaper articles, that con-
tain one of our predetermined positive (negative) words in the leading paragraph; and
(iii) the average number of newspaper articles that exclude positive (negative) words
from negative (positive) word search on a monthly frequency. There are 7,355 newspa-
per articles found on average per month that are published in one of the selected sources
and are classified at least to one of the selected category. Most of these newspaper
articles are classified into the categories Banking and Finance (3,135 articles) and Asia
(2,061 articles). On average per month, 705 articles are classified to Computing and
Information Technology, and 587 articles are classified to Property. Newspaper articles
are mostly published in the Financial Times (3,563 articles) and the New York Times
(2,644 articles).
[Please insert Table II about here]
When we limit our search to predefined words, Table II shows that we find slightly
more news with positive words than with negative words: 1,862 (1,538) articles or 25%
(21%) of the total number of articles is found when searched for positive (negative) words
in the leading paragraph. When we further limit our search query by excluding negative
(positive) words from positive (negative) word search, we find 555 (1,266) newspaper
articles in total or 8% (17%) of the total number of newspaper articles. When negative
words are excluded from the search of positive words, the number of newspaper articles
drops by 70% (from 1,862 to 555). On the contrary, when positive words are excluded
from the negative word search, the number of newspaper articles drops by 17% (from
1,538 to 1,266). It seems that there are more articles that use positive words in a negative
context than the other way around.
6

We construct our monthly media sentiment indicator by taking the ratio of the
number of newspaper articles that contain negative words to the number of newspaper
articles that contain positive words. In order to perform regression analysis, each of
the five categories is assigned with a market index: the MSCI World for the category
Banking and Finance, the NASDAQ for Computing and Information Technology, the
MSCI Real Estate (RE) for the category Property. For the category Asia we build our
own index by taking a weighted average of the MSCI EM Asia excluding Japan and the
MSCI Japan based on the average monthly market capitalization of each index. Average
monthly market capitalization data is available from May 2004 for both indices. We set
the weights for the MSCI EM Asia and the MSCI Japan constant between January 1990
and May 2004 and equal to the weights calculated for May 2004 using the available
average market capitalization data. From May 2004 on, weights are calculated by using
the existing data for each month. On average, market capitalization is 78% for the
MSCI Japan index and 23% for the MSCI EM Asia excl. Japan. The time series have
been downloaded from Datastream for the period between January 1990 and December
2012 for all indices except for the MSCI RE, which is available only from January 1995
onwards.
We extend the analysis to the effect of news frames on market volatility. We
calculate a proxy for monthly volatility of each market index by following Tetlock’s
(2007) approach. We demean market return variables to obtain residual values and
square these residuals. As control variables, we use the standard Fama-French small-
minus-big (SMB), high-minus-low (HML), and momentum (MOM ) factors, and the
Pastor-Stambaugh aggregate liquidity factor (LIQ), downloaded at a monthly frequency
from Wharton Research Data Services.
2.2 Methodology
In order to investigate a potential long-term media sentiment effect on the performance
of financial markets, we propose to estimate a VAR model for each category, where
endogenous variables are the market index, our proxy for market volatility, and our
constructed monthly media sentiment indicator. Exogenous variables are SMB, HML,
MOM, and LIQ factors. We include 24 lags for each endogenous variable. Similar to
Antweiler and Frank (2004), Tetlock (2007), and Garcıa (2013), we analyze the potential
news media sentiment effect on market’s return and on its volatility. We analyze the
effect of news media sentiment by performing the following regressions:
Mrkt =α1 + β1L24(Mrkt) + β2L24(Sentt) + β3L24(V olat) + β4Exogt + ε1t (1)
7

and
V olat =α2 + β1L24(Mrkt) + β2L24(Sentt) + β3L24(V olat) + β4Exogt + ε2t, (2)
where Mrkt is the log rate of return of the market index for each category; L24(xt) is
a lag operator that transforms the variable xt into a row vector consisting of 24 lags
of xt; Sentt is the log change of our media sentiment indicator; V olat is the estimated
volatility of its corresponding market index; Exogt are exogenous variables such as size
(SMB), value (HML), momentum (MOM ), and liquidity (LIQ), which are included in
the model to control for other potential anomalies that are not driven by the news media.
Antweiler and Frank (2004), Tetlock (2007), and Garcıa (2013) draw their con-
clusions about news media effects by testing for the significance of news media VAR
coefficients. Given complicated interlinked relationship between news media and finan-
cial markets, where news influence markets and markets influence news (Tetlock, 2007),
we believe that simply testing for the significance of lagged coefficients is not sufficient
to make conclusions about the causality. In order to disentangle these two forces, we
propose to run additional Granger causality tests on the subsets of lagged coefficients of
our media sentiment indicator. We assume that if media sentiment effect takes place,
it affects investor sentiment gradually over a long period of time. We perform Granger
causality tests for all 24 lags, and for subgroups of lags 1 to 6, 1 to 12, 6 to 12, 12 to
24, 12 to 18, and 18 to 24. Statistical significance of coefficients for all 24 lags would
imply that media sentiment impacts market returns and volatilities every month for two
years before the effect becomes visible. Testing for subgroups of lags allows us to identify
a more narrow time span when the effect of news media takes place. We hypothesize
that markets react to pessimistic (optimistic) news media sentiment with decreasing
(increasing) returns and increasing (decreasing) volatilities. However, Granger causality
tests do not show the signs of the coefficients. In order to draw conclusions about the
market reaction, we suggest looking at the signs of the media sentiment indicator VAR
coefficients for the lags that are statistically significant.
Additionally, exogenous variables for the size (SMB), value (HML), momentum
(MOM), and liquidity (LIQ) are included in the model in order to control for other
potential anomalies on the stock market returns and volatilities that are not driven by
the news media. Pastor and Stambaugh (2003) documents the presence of a time-series
relation between market liquidity and expected market returns and consider marketwide
liquidity as a state variable that affects expected stock returns because its innovations
have effects that are pervasive across common stocks. Following the same logic, we con-
sider monthly Fama-French factors for size, value, momentum and Pastor-Stambaugh
aggregate liquidity factor as state variables and include them as control variables in our
model.
8

3 Discussion of Results
In this section we present and discuss the results of our VAR models (1) and (2) and
Granger causality test results for the category Banking and Finance that represents
global markets and for the subcategories Computing and Information Technology, Prop-
erty, and Asia.
3.1 Banking and Finance
Banking and Finance is a LexisNexis category that targets news about financial in-
stitutions and services, credit and lending, financial markets and trading, investments
and banking law and policy. Figure I plots our media sentiment indicator against the
MSCI World index (left-side) and its corresponding volatility (right-side). We see that
our monthly media sentiment indicator seems to follow closely historical economic de-
velopments and economic crises on the global financial market. Our media sentiment
indicator tends to go down when the economy is growing and to go up when the econ-
omy becomes less stable. This indicates that during global economic expansions there
seem to be more optimistic than pessimistic news published. On the other hand, when
the global economy enters a recessionary state, media pessimism starts to prevail: our
media sentiment indicator reaches its peak at the times of crises. The figure on the left
plots the media sentiment indicator against the MSCI World index. Overall, the MSCI
World index tends to move upwards between 1991 and 2000 with temporal downward
movements at the times of the Japanese real estate turmoil at the beginning of the 1990s,
the Mexican peso crisis in late 1994, and during a wave of economic and financial crises
in emerging markets in 1997-98 (Adams, C., et al., 1998). MSCI World was growing at
the annual rate of 9.3% between 1990 and 2000. Our media sentiment indicator exhibits
large swings around crisis periods. It ranged between 62 and 148 levels during 1990-2000
reaching 135 in August 1990 as it reflected Japanese real estate pricing bubble, 115 in
March 1995 as a result of Mexican peso crisis, and 148 in September 1998 after the
Asian Crisis. However, the general time trend of the media sentiment indicator seems to
move downwards between 1990 and 2000 implying that media sentiment became more
optimistic in the 90s as the world economy grew.
[Please insert Figure I about here]
The MSCI World index reached its turning point at the beginning of the Millen-
nium. The dot-com crash in 2000-01 seems to reverse the trend of the global economy.
The MSCI World lost 66% of its value between its peak in March 2000 and the trough
9

in September 2002. Our media sentiment indicator exhibits steady growth during this
period implying that media pessimism prevailed over optimism. In September 2001 the
media sentiment indicator reached its new high of 150. A period of recession was followed
by a state of economic growth and expansion when the MSCI World recovered from its
heavy losses and started growing again. Between January 2003 and October 2007 the
MSCI World index grew at an annual rate of 13.89% and reached its historical high of
1,191.1 in October 2007. Figure I indicates that our media sentiment indicator falls as
the economy grows. During 2003-October 2007 the media sentiment indicator ranged
between 52 and 117 levels reaching its lowest in March 2006. A significant increase in me-
dia pessimism is visible already at the beginning of 2007, while the MSCI World was still
growing. Our media sentiment indicator seems to predict a financial downturn ex-ante.
A peak in our media sentiment indicator coincides with the trough of the MSCI World in
September 2008, precisely when the global U.S. investment bank Lehman Brothers filed
for bankruptcy. MSCI World fell to 717.2 from its peak in October 2008 and lost 51% of
its value. At the same time, the media sentiment indicator spiked to 215 level. Declining
U.S. and global housing markets and a wave of bankruptcies of financial institutions set
the world economy in a prolonged recession. Our media sentiment indicator fell from its
peak in September 2008, but remained on a relatively high level until the end of 2012.
The average media sentiment indicator level after Lehman is 134, which is higher than
the overall average of 101 for the entire time span.
The chart on the right of Figure I plots our media sentiment indicator against
the monthly MSCI World volatility measure. Our MSCI World volatility measure is
squared demeaned residuals of the MSCI World return and is uses as a risk measure
indicating a level of uncertainty on the global financial markets at a particular point
in time. We see that the MSCI World volatility tends to increase at times of financial
crises and tends to fall during the times of economic growth. An average level of volatil-
ity for the MSCI World is 0.2% for our sample time span. The spikes in volatility such
as 1.6% in September 1990, 2.3% in August 1998, 1.4% in September 2002, and the
highest 3.3% in October 2008, coincide with the spikes in our media sentiment indicator.
The corresponding media sentiment indicator levels for these spikes in volatility are 134,
146, 118, and 215 respectively. Media pessimism seems to grow with the global market
uncertainty. When the market volatility falls indicating that the market becomes more
stable, media sentiment becomes more optimistic. Average monthly volatility of the
MSCI World between 1993-1997 and between 2003 and October 2007 is only 0.1%. The
media sentiment indicator reaches its lowest value of 52 in March 2006.
Table III presents the estimated VAR coefficients of our media sentiment indica-
tor. For the sake of convenience we report only selected lags. The actual VAR model
(1) includes 24 lags of each endogenous variable. Column 2 presents the coefficients for
10

the category Banking and Finance.
[Please insert Table III about here]
We find negative statistically significant coefficients for lags 13, 14, 16, 17, 18,
and 19. The sign of coefficients confirms our expectations and is in line with the find-
ings by Tetlock (2007) and Garcıa (2013), but not with Antweiler and Frank (2004),
who do not find significant media effect on market returns. Our VAR regression results
imply that our media sentiment indicator tends to grow when the return on the MSCI
World tends to fall. The significance of lags 13, 14, and 16 to 19 shows that our media
sentiment indicator tends to predict MSCI World returns up to 19 months in advance.
This confirms our expectations of the long-term relation between media sentiment and
market returns and suggests that our proposed media sentiment indicator can be useful
as an ex-ante predictor of the global market performance.
Table IV reports the estimated coefficients of our VAR model (2). Column 2
reports only those VAR coefficients of our media sentiment indicator variables that are
statistically significant. The original VAR model (2) includes 24 lags of each endogenous
variable. We obtain positive statistically significant coefficients for our media sentiment
indicator for lags 10, 12, 13, and 14. However, we find a negative statistically signifi-
cant coefficient for lag 22. These results support our expectations. Antweiler and Frank
(2004) and Tetlock (2007) investigate the impact of news content on market volatility
and find similar results. A positive statistically significant coefficient implies that there
is a positive relation between our media sentiment indicator and the monthly volatility of
the MSCI World index. Additionally to Antweiler and Frank (2004) and Tetlock (2007),
who show the effect of the news media on a short-term, our results prove that there
is a long-term relation between market volatility and news sentiment. We find that an
increasing level of media pessimism tends to predict the MSCI World volatility 10 to 14
months in advance. A negative coefficient for lag 22 is a conflicting result, since it goes
against our expectations and the results from the previous literature. The coefficients
for lags 20, 21, 23, and 24 are positive and statistically insignificant implying that there
seem to be no significant effect of media sentiment on global market volatility more than
14 months in advance.
[Please insert Table IV about here]
As we already indicated in the methodology section, drawing conclusions based
on only VAR coefficients might not be sufficient. Tetlock (2007) shows that not only
news media influence markets, but also markets influence what is published in newspa-
11
pers. This means that we cannot claim the causality of news media on market returns
and volatility after observing VAR coefficients. Furthermore, statistically significant co-
efficients for certain lags do not necessarily mean that news media sentiment has an
effect on market returns and volatility exactly on that month in advance. Following the
works by Price and Tewksbury (1997) and McCombs (2004), we hypothesize whether
news media can influence financial markets gradually over a long time. We are rather
interested in an approximate time span during which a significant effect of media sen-
timent takes place rather than an exact month. In order to test the hypotheses of the
long-term news media effect on global financial market performance, we propose to run
Granger causality tests on our VAR models (1) and (2) for all 24 lags, and for the subset
of lags 1 to 6, 1 to 12, 6 to 12, 12 to 24, 12 to 18, and 18 to 24 of the media sentiment
indicator coefficients.
Table V reports Granger causality test results of our media sentiment indicator
on the global market returns (Panel A) and global market volatilities (Panel B) for all
24 lags and for the subsets of lags. Column 2 shows results for the category Banking and
Finance where the market index is the MSCI World. From both Panel A and Panel B we
see that our media sentiment indicator exerts a significant causal relation on the MSCI
World return and its volatility for the subset of lags 12 to 24 and 12 to 18. This means
that the coefficients estimated for our VAR models (1) and (2) for the lags 12 to 24 and
for the lags 12 to 18 are jointly statistically significant. From Table III we can infer
that these coefficients are negative for market returns and positive for market volatility.
Consistent with Antweiler and Frank (2004), Tetlock (2007) and Garcıa (2013), this im-
plies that media sentiment tends to have a significant negative (positive) causal effect on
global market returns (volatility) roughly one-year to one-and-a-half-year in advance.
[Please insert Table V about here]
Our results in Table V contribute to the previous research by showing that news
media sentiment has a causal effect not only in the short, but also in the long-run. Fol-
lowing the intuition of Price and Tewksbury (1997), as news media starts to use negative
words more frequently than positive words, negative thoughts and pessimistic feelings
about the economy are more likely to be activated on investors’ minds through the appli-
cability effect. As pessimistic news media sentiment becomes prevalent, more and more
investors start to agree with this point of view, forming pessimistic investor sentiment.
Pessimistic investor sentiment puts a downward pressure on the returns and increases
volatility on the global financial markets as investors adjust their investment decisions.
The effect of media sentiment becomes apparent after one to two years consistent with
the hypothesis that news media can truly have an effect only over a long-term (McCombs,
12

2004). It seems that our media sentiment indicator can send signals of a turning point
of a business cycle ex-ante and can be used as a proxy for investor sentiment similar to
the proxies constructed by Baker and Wurgler (2006).
3.2 Computing and Information Technology
The category Computing and Information Technology (IT) is a LexisNexis category that
targets news about the computing industry, including the design production and sale
of electronic components, computer hardware and software. We assign the NASDAQ
index to this category as a market index, since it tracks the performance of stocks of IT
companies. This category allows us to investigate a particular market segment, namely
the IT sector, in isolation. Figure II plots our media sentiment indicator against the
NASDAQ index (left-side) and its volatility (right-side) over January 1990 to December
2012.
Figure II shows that our media sentiment indicator moves in a wave-like fashion
exhibiting an increase during crises and a decline during economic growth. For the first
ten years of our sample, the NASDAQ index exhibits an upward sloping trend. At the
same time, our media sentiment indicator tends to slope downward, showing that news
media sentiment becomes more optimistic over time. Our media sentiment indicator
reflects the financial crises that occurred between 1990 and 2000 with an increasing level
of pessimism before and during each crisis such as the Japanese real estate turmoil in
1990-91, the Mexican peso crisis in December 1994, the Asian crisis in 1997-98, the Rus-
sian debt crisis in August 1998, the LTCM bailout in September 1998, and the Brazilian
crisis in January 1999. We observe that our media sentiment indicator spikes at the
outbreak of each crisis as media pessimism reaches its highest level at that time.
The major downturn on the IT market during the past 20 years has been the dot-
com crash of 2000-01. Figure II indicates that a pricing bubble in the IT sectors evolved
during 1998-2000. Our media sentiment indicator gradually declines as the NASDAQ
index reached new highs. Dot-com companies’ rising stock prices were accompanied
by an increasing level of media optimism. In March 2000, the NASDAQ reached its
historical high at 4,696.6 followed by a price decline, during which the index lost over
72% of its value by August 2002. Our media sentiment indicator sloped upwards as
the NASDAQ fell pushing the prices further down; it spiked in the second half of 2001
and started to decline as media sentiment became more optimistic again. The media
sentiment indicator rose from its lowest of 43 in November 1999 to 127 in August 2001
when the NASDAQ plummeted to 1,805.4 from its earlier peak of 4,696.6 in March
2000. We see that our media sentiment indicator started to increase again in January
2006 and spiked in September 2008 when Lehman Brothers filed for bankruptcy. The
13
media sentiment indicator grew from 44 in December 2005 to 150 in November 2008.
The NASDAQ reacted to this financial market shock with a sharp decline. It fell from
2,859.1 in November 2007 to 1,377.8 in March 2009 losing 73% of its value.
[Please insert Figure II about here]
The graph on the right of Figure II plots our monthly media sentiment indicator
against the NASDAQ volatility. We see that the IT market became more volatile in
the second half of the 1990s as a wave of crises on emerging markets and the dot-com
crash occurred. Between 1997 and 2003 the NASDAQ volatility level averaged to 1.1%
comparing to the average of 0.5% for the entire time span with some periods reaching up
to 7.1% as in November 2000. We also observe higher volatility in the aftermath of the
Lehman Brothers bankruptcy in 2008-09. Average NASDAQ volatility for the period
between September 2008 and January 2011 was 0.6%, slightly above the overall average
volatility, with peaks in volatility reaching 4.1% as in October 2008. Figure II shows that
spikes in volatility were accompanied by high levels of news media pessimism. Media
sentiment seems to be more pessimistic during increasing uncertainty on the IT market.
The media sentiment indicator ranged between 43 and 127 during 1997-2003 reaching
its maximum in August 2001 and between 54 and 150 in September 2008-2011. The
volatility of the NASDAQ index was relatively low between 1993 and 1996 and between
2004 and 2007. During these periods the volatility of the NASDAQ did not surpass a 1%
level. These periods are also characterized by relatively low levels of our media sentiment
indicator and prevailing media optimism. The media sentiment indicator levels ranged
between 51 and 111 in 1993-1996 and between 45 and 73 in 2004-2007.
Column 4 of Table III reports the estimated coefficients of the media sentiment
indicator for the VAR model (1). Negative statistically significant coefficients are ob-
served for the subsets of lags 1 to 5 and a positive statistically significant coefficient is
observed for the lag 23. The results show that our media sentiment indicator predicts
NASDAQ returns half a year in advance. We see that the increasing pessimism within
news media tends to put a downward pressure on NASDAQ returns as investors become
more pessimistic. These results confirm our hypothesis of a negative relation between
media sentiment and market returns and are in line with the results reported in the
previous literature. The results show that there is a long-term relation between media
sentiment and NASDAQ returns consistent with McCombs (2004). For the Computing
and IT category, it takes only up to 6 months before the NASDAQ index reacts to news
media sentiment. Comparing these findings to the ones for the category Banking and
Finance, we conclude that the effect of the news media on the IT market is quicker.
Column 4 of Table IV reports the estimated coefficients of our media sentiment
14

indicator for the VAR model (2). In contrast to the results obtained in Table IV for
the category Banking and Finance, no statistically significant coefficients are desplayed
for the IT market. The majority of coefficients is positive, which is in line with our ex-
pectations of a positive relation between media pessimism and market volatility, though
insignificant. It appears that media sentiment predicts NASDAQ returns, but does not
have any significant effect on the NASDAQ volatility for the selected time span.
Panel A and Panel B in Table V report the Granger causality test results that test
for the joint statistical significance of the media sentiment coefficients in VAR models (1)
and (2). Column 3 in Panel A reports statistically significant results for all 24 lags and
for lags 1 to 12 and 1 to 6. The results for lags 1 to 6 are strongly statistically significant
at 1%. On the contrary, column 3 in Panel B does not report any statistically significant
causal relation of media sentiment on NASDAQ volatility. The results from Panel A in
both Table III and Table V present evidence of the causal negative long-term relation
of media sentiment on NASDAQ returns six to twelve months in advance. These re-
sults confirm our expectation and are consistent with the results by Tetlock (2007), and
Garcıa (2013) that show a short-term negative relation between media sentiment and
market returns. However, our results are not in line with Antweiler and Frank (2004),
who do not find a significant media effect on market returns but on market volatility.
Our findings contribute to the existing literature by showing that the effect of
news media on market returns also takes place in the long run, which is consistent with
assertions made by McCombs (2004). The results for the category Computing and IT
are also in line with the results for the category Banking and Finance implying that our
media sentiment indicator can be used not only for predictions of the global financial
performance, but also for particular markets such as IT market. In contrast to our find-
ings for the category Banking and Finance, the news media effect seems to take place
sooner for the IT market.
3.3 Property
The category Property is a LexisNexis category that contains news about the commer-
cial and residential property markets, including property development, management and
sales. This category allows us studying the effect of media sentiment on the development
of housing prices in isolation. The market index for this category is chosen to be the
MSCI Real Esate (RE) index since it tracks an aggregate level of housing prices world-
wide. Figure III plots our monthly media sentiment indicator against the MSCI RE
index (left-side) and against the demeaned squared residuals of the MSCI RE, which we
use as a proxy for volatility, (right-side) over the period January 1995 to December 2012.
15
[Please insert Figure III about here]
Figure III indicates that the MSCI RE index exhibits two major crashes: during
the Asian crisis 1997-98, and in 2007 when U.S. housing prices started to decline, which
became one of the major causes of the outbreak of the financial crisis in September 2008
when Lehman Brothers filed for bankruptcy. MSCI RE index lost 65.9% of its value be-
tween July 1997 and September 1998 and 97.8% between May 2007 and January 2009.
Our media sentiment indicator tends to decline when the MSCI RE index grows and
tends to increase when the MSCI RE index falls. Moreover, our media sentiment indica-
tor tends to spike and reaches its highest levels at the time when the MSCI RE reaches
troughs. The average level of media sentiment indicator for the sample time span is 84.
In October 1998 the media sentiment indicator reached a 87 level from 44 when MSCI
RE fell to 97 from its peak of 158 in July 1997. Similarly, the media sentiment indicator
increased to 171 in February 2009 from 66 level in May 2007 when the MSCI RE fell to
71.3 level from its historical high of 224.3 in May 2007. We observe that the media sen-
timent indicator started to increase in 2006 while the MSCI RE index continued to grow
as fears about the U.S. housing market started to circulate on the news media. At the
time of an increasing uncertainty of the housing market, which corresponds to periods
1997-1999 when average monthly volatility of the MSCI RE was 0.6%, slightly higher
than the overall average of 0.3%, and to periods 2007-2010 when the average volatility
was 0.7%, our media sentiment tends to be more pessimistic. During 1997-1999 media
sentiment indicator started to increase from 47 in December 1995 to 79 in April 1999.
Similarly, during 2007-2010 media sentiment indicator grew from 58 in January 2007 to
188 in September 2008. On the other hand, we can infer from Figure III that optimistic
media sentiment prevails when the housing market is calm and market volatility is rela-
tively low. Thus, for the period between 2002 and 2006 average monthly volatility of the
MSCI RE was 0.1%, significantly lower than the overall average of 0.3%. At the same
time, our media sentiment indicator stayed within a range of 40 and 92, mostly below
the overall average of 84.
Column 6 of Table III reports the estimated coefficients of the media sentiment
indicator for our VAR model (1). We observe negative statistically significant coefficients
for lags 10, 12, and 15. This result suggests a negative long-term relation between our
media sentiment indicator and the MSCI RE index. It confirms our expectation about
the existence of a negative long-term relation between media sentiment and market re-
turns. Our findings are in line with the results by Tetlock (2007) and Garcıa (2013) and
consistent with the intuition in Price and Tewksbury (1997) and McCombs (2004).
Column 6 of Table IV displays the estimated coefficients of the media sentiment
indicator for our VAR model (2). The results for the volatility of the MSCI RE index are
16

mixed. We observe a positive statistically significant coefficient for the media sentiment
indicator at lag 12 and a negative statistically significant coefficient at lag 4. A positive
statistically significant coefficient is in line with our expectations of the long-term media
sentiment relation with market volatility on the housing market and with previous works
by Antweiler and Frank (2004) and Tetlock (2007). However, the negative statistically
significant coefficient at lag 4 conflicts our predictions. We cannot make definite conclu-
sions about the existence of a media sentiment effect on MSCI RE volatility based on
the results in Table IV.
Column 4 in both Panel A and Panel B of Table V presents the Granger causal-
ity test results for the joint significance of the media sentiment coefficients in our VAR
models (1) and (2). In contrast to our findings for the categories Banking and Finance
and Computing and IT and despite the results in Table III for the category Property, we
do not find any statistically significant causal relation of our media sentiment indicator
on neither the MSCI RE returns nor on the MSCI RE volatility. These results do not
support our expectations of the negative (positive) causal long-term relation of media
sentiment on market returns (volatility). It seems that our media sentiment indicator
does not predict the performance of the housing market and puts limits on the usage of
our indicator for specific markets.
3.4 Asia
Asia is a LexisNexis category that targets news about countries and regions located on
the Asian continent. As the market index, we build a MSCI EM Asia incl. Japan index
by taking a weighted average of MSCI EM Asia index and MSCI Japan index based
on the average market capitalization. Figure IV plots our media sentiment indicator
against the MSCI EM Asia incl. Japan index on the left and against the volatility of
the MSCI EM Asia incl. Japan index on the right.
[Please insert Figure V about here]
Figure IV shows that Asian markets have suffered several major downturns over
our selected time span. Firstly, the MSCI EM Asia incl. Japan index was strongly hit
by the Japanese real estate turmoil in the early 1990s. From January 1990 until July
1992, the MSCI EM Asia incl. Japan index lost 65% of its value and fell from 3,242.6
to 1,692.4. This period is also characterized by an increase in the media sentiment in-
dicator from 100 to 121 between January 1990 and July 1992. The media sentiment
indicator jumped to 232 in August 1990 when the MSCI EM Asia incl. Japan index fell
to a 2,306.3 level from 3,242.6, a 34% drop. The monthly volatility of the MSCI EM
17

Asia incl. Japan index on average between 1990 and 1992 was 0.8%, higher than the
overall average monthly volatility of 0.4% for the entire time span. The volatility hit its
maximum in October 1990 when it reached 4.7%. A volatile period between 1990 and
1992 was followed by the growth in the MSCI EM Asia incl. Japan index and by relative
stability on the market. From July 1992 until April 1996 the index gained almost 57%.
The monthly volatility stayed at a 0.4% level on average for the same period. The me-
dia sentiment indicator fell from its peak of 121 in July 1992 and reached a 85 level on
April 1996. Thus, it seems that economic growth and relative stability on Asian markets
between 1993 and 1997 due to strong capital inflows to Tiger countries from developed
economies was accompanied by prevailing media optimism. From April 1996 the MSCI
EM Asia incl. Japan index experienced another shock, which subsequently was followed
by the Asian crisis in July 1997. The MSCI EM Asia inc. Japan index dropped by 27%
from 2,981.1 to 2,271.7 at the outbreak of the Asian crisis in July 1997. The monthly
volatility of the MSCI EM Asia incl. Japan index reached 1.4% and our monthly media
sentiment indicator increased to 201 level in August 1998. Figure IV clearly indicates
that our media sentiment indicator experienced a sharp rise in July 1997 when it jumped
from 81 to 101 level. The MSCI EM Asia incl. Japan index returned to the growth in
October 1998 after hitting its trough of 1,464.4 in September 1998. From the end of
1998 until March 2000 the MSCI EM Asia incl. Japan index was growing at the annual
rate of 45.4% and reached its new high of 3,004.1 in March 2000. The media sentiment
indicator fell from its peak of 201 in September 1998 to 100 in March 2000 while the
MSCI EM Asia incl. Japan rallied. The crash of dot-com companies reversed this trend
and set the MSCI EM Asia incl. Japan index at a downward trend. The MSCI EM
Asia incl. Japan index continued to fall until April 2003 and reached another trough of
1,214.9 in March 2000, a 91% decline from its previous high of 3,004.1. During 2000-
2003 the media sentiment indicator was growing and staying at a relatively high level
indicating that news media expressed more pessimism than optimism. However, in April
2003 media sentiment seems to become more optimistic. It declined from 142 in April
2003 to 76 in October 2005. At the same time, the MSCI EM Asia incl. Japan index
exhibited a visible growth of a slightly more than 19% annually and monthly volatility
of the index was 0.2% on average between April 2003 and 2007. The next downturn
followed after the U.S. and worldwide housing prices fell and Lehman Brothers filed for
bankruptcy in September 2008. The MSCI EM Asia incl. Japan index fell from 2,655.1
in January 2007 to 1,280.6 in February 2009 while monthly volatility of the MSCI EM
Asia incl. Japan index grew from 0.03% to 2.0% for the same time. The media sen-
timent indicator jumped from 77 in January 2007 to 160 in February 2009. For the
following four years between 2009 and 2012 the media sentiment indicator remained at
a relatively high level while the MSCI EM Asia incl. Japan stayed on a constant close
18

to its earlier trough level. The monthly volatility of the MSCI EM Asia incl. Japan
was also relatively high between 2009 and 2012. From Figure IV it seems that media
sentiment becomes more pessimistic before and at the time of economic downturns and
increasing market uncertainty. During economic growth media pessimism remains on a
low level while media optimism prevails.
Column 10 of Table III reports estimated coefficients for the media sentiment
indicator for VAR model (1). The table reports a negative statistically significant co-
efficient for the media sentiment indicator at lag 3. This result goes in line with our
expectations about a negative relation between media sentiment and market returns and
the results reported by Tetlock (2007) and Garcıa (2013). On the other hand, this result
conflicts with the results by Antweiler and Frank (2004), who do not find evidence of
the negative effect of media sentiment on the market returns.
Column 10 of Table IV reports the coefficients for the media sentiment indicator
for VAR model (2). The coefficients for most of the lags are positive, but statistically
insignificant. On the other hand, coefficients for lags 22 and 23 are negative and sta-
tistically significant. These are conflicting results that go against our expectations of a
positive relation between media sentiment and market volatility over the long-run and
the results reported in previous literature.
Panel A and Panel B of Table V column 5 report Granger causality test results
for the joint statistical significance of the media sentiment indicator coefficients on the
MSCI EM Asia incl. Japan returns and the MSCI EM Asia incl. Japan volatilities for all
24 lags and for the subsets of lags. On the contrary to the results in Table III, Panel A
reports no statistically significant results for the causal relation of the media sentiment
indicator on the MSCI EM Asia incl. Japan returns. On the other hand, Panel B shows
statistically significant coefficients for lags 1 to 6 and 1 to 24. These results imply that
the market sentiment indicator coefficients for lags 1 to 6 and for all 24 lags are jointly
statistically significant. Similar to our results for categories Banking and Finance and
Computing and IT, the results in Tables IV Panel B and Table V suggest that there is a
positive causal long-term relation of media sentiment on the MSCI EM Asia incl. Japan
volatility and that our media sentiment indicator seems to predict increasing volatility
on Asian markets half a year in advance.
4 Robustness Check
In order to check for the robustness of our results, we download a new set of news data
and perform the same statistical analysis again. We collect our new dataset by perform-
ing the same search query on LexisNexis by using the same positive and negative words in
the leading paragraph. However, now we exclude a number of negative (positive) words
19

while searching for positive (negative) words. Excluded positive and negative words are
marked in bold in Table I. By specifying our search query in such a way we remove to
some extent those newspaper articles that use words, which are classified as positive or
negative, in the negative or positive context. For example, words like “risk” are classified
as negative words and worlds like “increase” are classified as positive words; however, a
phrase like “increasing risk” has a negative meaning. With the current data collection
method, the article that uses a phrase like “increasing risk” will be counted twice and
classified under optimistic and pessimistic news frame. By excluding the word “risk”
from a positive word search, but not excluding the word “increase” from the negative
word search, we remove newspaper articles that use such phrases from our optimistic
news, but not from pessimistic news dataset. Similarly, a phrase like “positive stock
performance despite crisis” will be removed from the pessimistic news dataset, but not
from optimistic one. Newspapers with phrases like “prevailing optimism despite declin-
ing stock prices” will be removed from both optimistic and pessimistic news datasets.
Table II reports an average number of newspaper articles per month with and without
excluded words for each category. In total, when negative (positive) words are excluded
from the positive (negative) words search, the number of newspaper articles drops by
70% (18%). This sharp difference between the number of newspaper articles in our opti-
mistic and pessimistic news frames before and after word exclusion might indicate that
journalists tend to use more positive words in the negative context than otherwise.
Table VI reports the estimated coefficients for the market sentiment indicator in
the VAR model (1) on the new set of news data. The results for categories Banking and
Finance, Computing and IT, and Property are similar to the results obtained for the old
news data set (Table III). We find negative statistically significant coefficients for the
category Banking and Finance for lags 10, 13, 14, 17, 18, and 19. For this category, the
coefficient for lag 10 becomes significant, the coefficient for lag 16 becomes insignificant,
and overall the statistical significance of coefficients becomes stronger for the new set
of data. We find negative statistically significant coefficients for lags 1, 3, and 4 for the
category Computing and IT. The coefficients for lags 2 and 5 become insignificant for
the new set of data. Furthermore, the conflicting result for the lag 23 in the category
Computing and IT disappears after performing the analysis on the new data set. For
the category Property we find one negative statistically significant coefficient for lag 18.
On the other hand, coefficients for lags 10, 12, and 15 become insignificant. For the cat-
egory Asia, we find a negative statistically significant coefficient for lag 3 and a positive
statistically significant coefficient for lag 13.
[Please insert Table VI about here]
20

Table VII reports the estimated coefficients for the market sentiment indicator in
VAR model (2) on the new set of news data. We observe positive statistically significant
coefficients for the category Banking and Finance at lags 13, 14, 15, 17, and 20 and a
negative statistically significant coefficient for the lag 22. Comparing to the results in
Table IV, lags 10 and 12 become insignificant and lags 15, 17, and 20 become significant
for the new dataset. The conflicting negative coefficient for lag 22 remains. Similar to
the results in Table IV, there are no statistically significant coefficients for the category
Computing and IT. For Property we find one negative statistically significant coefficient
for lag 4, which we also observe for the old dataset. This result conflicts with our ex-
pectations of the positive relation between media sentiment and market volatility. The
coefficient for lag 12 becomes insignificant after the robustness check. For category Asia
we do not find any statistically significant coefficients.
[Please insert Table VII about here]
Lastly, Table VIII reports Granger causality test results of the media sentiment
indicator on market returns (Panel A) and market volatilities (Panel B) for our new
dataset. The results for the category Banking and Finance are consistent with the re-
sults in Table V. We find statistically significant coefficients for lags 12 to 24 and lags
12 to 18. This result shows the robustness of our previous results reported in Tables III
and V for the category Banking and Finance. On the other hand, we find statistically
significant Granger causality test result for the category Asia at lags 1 to 6. This result
conflicts with the results from Table V for Asia category of no significant causal rela-
tion of media sentiment on market returns. There seem to be no statistically significant
causal relation of the media sentiment indicator on market returns for other categories.
The causal relation reported for the category Computing and IT disappears. For the
market volatility we find statistically significant causal relation of the media sentiment
indicator for the categories Banking and Finance at lags 12 to 24 and 18 to 24 and for
Asia at lags 1 to 6. These results show the robustness of our previous results obtained
in Tables IV and V for these categories. For other categories, we do not find evidence
of the causal relation between the market sentiment indicator and market volatilities.
[Please insert Table VIII about here]
Overall, it seems that our monthly media sentiment indicator is able to predict
the returns and volatilities on the global financial markets one to two years in advance
and on Asian markets 1 to 6 month in advance. On the other hand, the ability of our
21

monthly media sentiment indicator to predict returns and volatilities for specific markets
such as IT and Real Estate is limited. One explanation for the lack of significant results
for these categories might be the fact that there are relatively few newspaper articles that
are written in these categories comparing to categories such as Banking and Finance and
Asia. There are only 705 newspaper articles on average per month for Computing and
IT and 587 for Property category. On the other hand, Banking and Finance category
has 3,135 newspaper articles per month and Asia has 2,061 (Table II). A low number
of newspaper articles makes our monthly media sentiment indicator index very volatile.
An average rate of change (standard deviation) of the media sentiment indicator for
categories Banking and Finance and Asia are 0.02% (11.60%) and -0.01% (13.99%)
respectively, whereas an average rate of change (standard deviation) for the categories
Computing and IT and Property are -0.10% (20.57%) and -0.08% (17.52%) respectively.
Thus, high volatility of the market sentiment indicator for the categories Computing
and IT and Property due to relatively few newspaper articles found might explain a
lack of significant results for these categories. Furthermore, the number of newspaper
articles significantly drops when we search for specific words. Adding additional sources
or expanding the list of keywords might result in a better predictive ability of the media
sentiment indicator for specific markets. Another explanation of a lack of statistically
significant results for Computing and IT and Property categories might lie in the fact that
NASDAQ and MSCI RE prices respond to the performance of other financial markets,
different from IT and real estate. For example, we see that NASDAQ declined during
the Asian crisis, as the performance of Asian emerging markets indirectly influenced
technology prices. However, our media sentiment indicator for categories Computing
and IT and Property does not contain news about other markets that might indirectly
influence NASDAQ and MSCI RE indices.
5 Conclusion
This paper investigates a potential media sentiment effect on the performance of finan-
cial markets in the long-run. Previous literature suggests that negative media sentiment
creates pessimistic investor sentiment and puts a downward pressure on market prices
and an upward pressure on market volatilities in the short-run (Antweiler and Frank,
2004; Tetlock, 2007; Garcıa, 2013). In our study, we propose to investigate the long-term
effect of media sentiment on financial market performance. We follow Price and Tewks-
bury (1997) and McCombs (2004), who argue that news media can influence people’s
opinions over time. We investigate news media effects for up to 24 months on the global
economy and on specific markets such as IT, Property, and Asian markets.
We find robust evidence of the causal relation of media sentiment on the global
22

market return and global market volatility for 12 to 24 months in advance and on Asian
returns and Asian volatility for 1 to 6 months in advance. We show that pessimistic
media sentiment tends to exert a downward pressure on global market returns and an
upward pressure on global market volatilities 12 to 24 months in advance. We suggest
using our media sentiment indicator as leading investment sentiment indicator similar to
proxies proposed by Baker and Wurgler (2006). Our media sentiment indicator can also
be used to analyze the outlook of particular market segments, such as Asian markets.
Our main contribution to the literature is that we show that news media can
have a prolonged effect on the market sentiment and on long-term financial perfor-
mance. Increasing media pessimism expressed by salient attributes of the newspaper,
such as language used, selection of content, and organization, raise negative thoughts in
investors’ minds through the applicability effect defined by Price and Tewksbury (1997).
As media pessimism becomes dominant over time, investors are more likely to adhere to
the point of view that generally circulates on news media and to use negative thoughts
that news media arise in their evaluation of the economic outlook. Pessimistic investors
start to anticipate deterioration of the financial performance and start to adjust their
investment decisions that subsequently increase the uncertainty on the markets and put
a downward pressure on financial returns.
23

References
Adams, C., et. al., 1998. International Capital Markets. Development, Prospects, and
Key Policy Issues. World Economic and Financial Surveys. International Monetary
Fund. Washington, DC.
Antweiler, W., Frank, M., 2004. Is all that talk just noise? The information content of
Internet stock message boards. Journal of Finance 59(3), 1259-1294.
Baker, M., Wurgler, J., 2006. Investor sentiment and the cross-section of stock returns.
Journal of Finance 61(4), 1645-1680.
Barber, B., Odean, T., 2007. All that glitters: The effect of attention and news on the
buying behavior of individual and institutional investors. Review of Financial Studies
21(2), 786-818.
Barberis, N., Thaler, R., 2003. A survey of behavioral finance. Handbook of the Eco-
nomics of Finance 1(B), 1053-1128.
Bikhchandani, S., Sharma, S., 2001. Herd behavior in financial markets. IMF Staff
Papers 47(3), 279-310.
DeBondt, W., Thaler, R., 1985. Does the stock market overreact? Journal of Finance
40(3), 793-805.
Fama, E., French, K., 1988. Permanent and temporary components of stock prices.
Journal of Political Economy 96(2), 246-273.
Garcıa, D., 2013. Sentiment during recessions. Journal of Finance 68(3), 1267-1299.
Gerow, A., Keane, M., 2011. Mining the web for the “voice of the herd” to track
stock market bubbles. Proceedings of the Twenty-Second international joint conference
on Artificial Intelligence 3, 2244-2249.
Goldfarb, B., Kirsch, D., Miller, D., 2007. Was there too little entry during the dot
com era? Journal of Financial Economics 86(1), 100-144.
Groß-Klußmann, A., Hautsch, N., 2011. When machines read the news: Using auto-
mated test analytics to quantify high frequency news-implied market reactions. Journal
of Empirical Finance 18(2), 321-340.
Gunther, J. W., Moore, R., Short, G., 1996. Mexican banks and the 1994 peso crisis:
The importance of initial conditions. North American Journal of Economics and Fi-
nance 7(2), 125-133.
Iyengar, S., 1991. Is Anyone Responsible? How Television Frames Political Issues.
University of Chicago Press, Chicago.
Kindleberger, C., Aliber, R., 2005. Manias, Panics, and Crashes. A History of Finan-
cial Crises. Fifth Edition, John Wiley and Sons, New Jersey.
Loughran, T., McDonald, B., 2011. When is a liability not a liability? Textual analysis,
dictionaries, and 10-K. Journal of Finance 66(1), 35-65.
24

Mathieson, D. J., Schinasi, G. J., 2001. International Capital Markets. Development,
Prospects, and Key Policy Issues. World Economic and Financial Surveys. International
Monetary Fund. Washington, DC.
McCombs, M., 2004. Setting the Agenda. The Mass Media and Public Opinion. Polity
Press, Cambridge.
McLeod, J. M., Kosiski, G. M., and McLeod, D. M., 1994. The expanding boundaries
of political communication effects. In J. Bryant and D. Zillman (Eds.) Media Effects:
Advances in Theory and Research, pp. 123-162. Lawrence Erlbaum, Hillsdale, NJ.
Miyakoshi, T., 2000. The causes of the Asian currency crisis: Empirical observations.
Japan and the World Economy 12(3), 243-253.
Pastor, L., Stambaugh, R., 2003. Liquidity Risk and Expected Stock Returns. Journal
of Political Economy 111(3), 642-685.
Price, V., and Tewksbury, D., 1997. News values and public opinion: A theoretical
account of media priming and framing. In G. Barnett and F. J. Boster (Eds.) Progress
in the Communication Sciences, pp. 173-212. Ablex, Greenwich, CT.
Price, V., Tewksbury, D., Powers, E., 1997. Switching trains of thought: The impact of
news frames on readers’ cognitive responses. Communication Research 24(5), 481-506.
Reinhart, C., Rogoff, K., 2009. This Time Is Different. Eight Centuries of Financial
Folly. Princeton University Press, Princeton, New Jersey.
Scheufele, D., Tewksbury, D., 2007. Framing, agenda setting, and priming: The evolu-
tion of three media effects model. Journal of Communication 57(1), 9-20.
Shiller, R., 2005. Irrational Exuberance. Second Edition. Princeton University Press,
Princeton, New Jersey.
Tetlock, P., 2007. Giving content to investor sentiment: The role of media in the stock
market. Journal of Finance 62(3), 1139-1168.
Wade, R., 1998. The Asian debt-and-development crisis of 1997? Causes and conse-
quences. World Development 26(8), 1535-1533.
Wheaton, W., Necheyev, G., 2008. The 1998-2005 housing “bubble” and the current
“correction”: What’s different this time? Journal of Real Estate Reseach 30(1), 1-26.
25

Appendix
This appendix presents examples of newspaper articles found on LexisNexis for one ofthree selected sources: Financial Times, New York Times, and Wall Street Journal Ab-stracts. We present one positive news story for the category Asia and one negative newsstory for the category Banking and Finance. We obtain positive newspaper articles bysearching for our predefined positive words in the leading paragraph of each newspaperarticle. Negative newspaper articles are found by searching for our predefined negativewords in the leading paragraph of each newspaper article. We also present an exampleof a newspaper article from the category Banking and Finance that is excluded fromour database for robustness checks. Positive and negative keywords are marked in bold,whereas excluded words are marked in italics.
Category: Banking and Finance
News: Negative
Source: Financial Times (London, England)
Date of publication: 15 December 2012
Triple A Berating
The British sometimes drop their HHHs, and even their RRRs. Now their AAAs are in peril.
Standard & Poor’s has become the third of the three big rating agencies to put the UK’s credit rating on
its danger list. The UK’s creditworthiness outlook is “negative”, and a downgrade of its credit rating
cannot be far away.
With a non-existent economic recovery and wayward public finances, it is not a surprise. Still, it
will be a blow. A triple A credit rating is not to be discarded lightly, if only because, once lost, it is very
hard to get it back. Having one not only offers lower borrowing costs. It enables a country to say: “I have
a triple A rating, and you don’t! ” In fact, the bragging rights attached to it are probably as valuable to
the owner as the cheaper borrowing, and, let’s face it, a lot more fun.
26

Category: Asia
News: Positive
Source: Financial Times (London, England)
Date of publication: 28 January 2005
Philippines set for further growth
The Philippine economy has been growing at its fastest in more than a decade and is expecting
further growth. Romulo Neri, economic planning secretary, said gross domestic product was forecast to
grow by as much as 6.3 per cent this year, largely due to expected foreign investment in mining projects
and plans to spend more on large civil works projects.
27

Category: Banking and Finance
News: Robustness check - excluded news
Source: Financial Times (London, England)
Date of publication:
Euro hits highest since May on signs of easing recession
The euro surged to its highest point since early May against the US dollar yesterday as unexpectedly pos-
itive economic data suggested the eurozone recession was easing amid continuing fears of easy monetary
policy in the US.
The “flash” estimate of Markit’s composite eurozone Purchasing Managers’ Index rose to 47.3, its highest
level in nine months, but still below the 50 mark denoting expansion.
BNP Paribas’ FX team said the single currency was also benefiting from a positioning perspective as
year-end window dressing dragged in positive flows.
The euro gained 0.7 per cent against the dollar to a high of $1.3173 to finish the week up 1.8 per cent.
The dollar index fell 0.5 per cent to 79.5 points as a US report on inflation showed prices fell in November
for the first time in six months .
Sterling retrenched following Standard & Poor’s decision on Thursday to downgrade the outlook on
Britain’s triple A rating to negative, implying a one-third chance of a downgrade in the next two years.
All three large credit rating agencies now have Britain’s triple A status on negative outlook. A downgrade
might hit sterling if it deters haven flows, which have supported the pound during the financial crisis.
The pound gained 0.2 per cent against the dollar to $1.6141 to finish the week up 0.6 per cent.
The Japanese yen steadied ahead of elections on Sunday when the opposition Liberal Democratic party
and its overtly dovish leader Shinzo Abe are expected to return to power. The yen fell as far as Y83.96 to
near a nine-month low earlier in the session after the Bank of Japan’s quar-terly Tankan report , released
yesterday, showed the key measure of business confidence among big manu-facturers fell sharply. Credit
Suisse said the data probably reinforced expectations the BOJ might increase easing measures.
Despite the yen fighting back, to trade up 0.2 per cent against the dollar on Friday to Y83.49, analysts
be-lieve it will resume its fall throughout 2013.
The yen has lost 8 per cent against the dollar since the middle of September when it sat at Y77.11 and
ana-lysts are targeting levels of between Y85 and Y90 in 2013.
Derek Halpenny of Bank of Tokyo-Mitsubishi argued that since markets have priced in a sizeable majority
being formed by an LDP-led government, any failure to reach this might encourage yen buying in the short
term to square short positions, which sit at multiyear highs.
28

Table I: Keywords
This table reports the positive and negative keywords that we searched for on the
LexisNexis database in Financial Times (FT), New York Times (NYT), and Wall
Street Journal Abstracts (WSJ) in order to extract newspaper articles that express
optimistic and pessimistic media sentiment. The search query is limited to the leading
paragraph of the newspaper article. For our robustness check, the bold positive
(negative) words got excluded when searched for negative (positive) words in the
leading paragraph of a newspaper article.
Positive Words Negative Words
rise
improve
increase
climb
ascend
expansion
benefit
gain
success
improvement
favorable
advantageous
positive
safe
secure
easy
profitable
strong
high
attractive
calm
boom
certainty
growth
optimistic
lucrative
prosperity
fall
decline
decrease
plummet
drop
recession
reduction
loss
failure
impairment
adverse
disadvantage
negative
critical
uncertain
difficult
default
weak
low
risk
hazard
danger
crisis
crash
downturn
impasse
pessimism
29

Table II: Descriptive Statistics
This table presents descriptive statistics of the newspaper articles collected for each category.
BF, CI, RE, and Asia refer to the LexisNexis categories Banking and Finance, Computing
and IT, Property, and Asia respectively. FT, NYT, and WSJ refer to the Financial Times,
New York Times, and Wall Street Journal Abstracts sources. Panel A presents the average
number of newspaper articles on a monthly frequency for all news published in one of our
selected categories. Panel B (C) reports descriptive statistics for news that only contains
predetermined positive (negative) words in the leading paragraph of a newspaper article.
Panel D (E) reports descriptive statistics of newspaper articles that contain predetermined
positive (negative) words excluding predetermined negative (positive) words in the leading
paragraph of an article.
Total BF CI RE Asia FT NYT WSJ
Panel A: All Data
Average 7,355 3,135 705 587 2,061 3,563 2,644 1,146
Panel B: Positive Words
Average 1,862 945 163 160 461 1,101 547 235
% all data 25% 30% 23% 27% 22% 31% 15% 7%
Min 1,102 526 29 89 247 572 394 92
Max 2,488 1,392 500 411 960 1,578 5,524 416
Panel C: Negative Words
Average 1,538 844 98 138 385 898 434 205
% of all data 21% 27% 14% 24% 19% 25% 12% 6%
Min 961 460 26 50 167 484 263 89
Max 3,636 2,544 284 625 988 2,287 826 664
Panel D: Positive excl. Negative Words
Average 555 257 51 47 141 347 155 54
% of all data 8% 8% 7% 8% 7% 10% 4% 2%
% Drop 70% 73% 69% 71% 69% 69% 72% 77%
Min 287 124 7 17 66 156 97 18
Max 805 408 159 110 319 538 260 102
Panel E: Negative excl. Positive Words
Average 1,266 702 79 114 326 718 363 185
% of all data 17% 22% 11% 19% 16% 20% 10% 5%
% Drop 18% 17% 20% 18% 15% 20% 16% 10%
Min 818 368 21 40 141 381 240 81
Max 3,215 2,272 229 547 910 2,033 677 522
30

Table III: VAR Model - Market Proxy
This table presents the estimated coefficients for the VAR model (1):
Mrkt = α1 + β1L24(Mrkt) + β2L24(Sentt) + β3L24(V olat) + β4Exogt + ε1t
where Mrkt is the log rate of return of the market index for each of the 4 categories; L24(xt) is a lag
operator that transforms the variable xt into a row vector consisting of 24 lags of xt; Sentt is the log
change of our media sentiment indicator; V olat is the estimated volatility of the corresponding market
index; Exogt are exogenous variables such as SMB, HML, MOM, and LIQ. We report only those lags of
our media sentiment indicator, which are statistically significant for at least one category. The original
VAR model includes 24 lags for each endogenous variable. Statistical significance is reported by asterisks
*, **, and *** at the 10, 5, and 1% level, respectively.
MSCI
World
t-stat. NASDAQ t-stat. MSCI
RE
t-stat. MSCI
EM Asia
incl.
Japan
t-stat.
Sentt−1 -0.023 -0.763 -0.074*** -3.222 -0.026 -0.786 0.014 -0.040
Sentt−2 -0.016 -0.509 -0.065** -2.117 0.001 0.040 -0.051 -0.048
Sentt−3 0.008 0.259 -0.122*** -3.533 -0.014 -0.376 -0.086* -0.049
Sentt−4 0.018 0.557 -0.093*** -2.556 0.002 0.060 -0.064 -0.049
Sentt−5 -0.001 -0.057 -0.072** -1.988 0.026 0.708 -0.069 -0.050
Sentt−10 -0.036 -1.121 -0.023 -0.639 -0.062* -1.709 -0.021 -0.049
Sentt−12 -0.028 -0.861 0.002 0.058 -0.062* -1.711 0.041 -0.051
Sentt−13 -0.057* -1.767 0.024 0.707 -0.031 -0.816 0.038 -0.049
Sentt−14 -0.071** -2.146 0.037 1.089 -0.011 -0.286 0.004 -0.049
Sentt−15 -0.030 -0.907 0.042 1.270 -0.069* -1.785 0.031 -0.049
Sentt−16 -0.056* -1.658 0.039 1.252 0.012 0.327 0.034 -0.049
Sentt−17 -0.104*** -3.056 0.048 1.544 -0.020 -0.547 0.018 -0.048
Sentt−18 -0.060* -1.721 0.024 0.793 -0.013 -0.345 0.001 -0.044
Sentt−19 -0.061* -1.829 -0.001 -0.059 -0.040 -1.031 -0.047 -0.043
Sentt−23 0.006 0.209 0.051** 1.975 0.004 0.125 0.049 -0.041
SMBt 0.056 0.566 0.584*** 4.803 0.281 1.802 0.178 -0.137
HMLt -0.323*** -3.203 -0.934*** -7.412 0.080 0.494 -0.100 -0.146
MOMt -0.202*** -3.023 -0.373*** -4.439 -0.421*** -4.669 -0.143* -0.080
LIQt 0.1511*** 3.468 0.118** 2.181 0.169*** 2.591 0.127** -0.057
Adj.R.sq. 0.142 0.502 0.193 0.058
F − Stat. 1.546 4.326 1.602 1.204
Number of
obs.
251 251 192 251
31

Table IV: VAR Model - Market Volatility
This table presents the estimated coefficients for our VAR model (2):
V olat = α1 + β1L24(Mrkt) + β2L24(Sentt) + β3L24(V olat) + β4Exogt + ε1t
where Mrkt is the log rate of return of the market index for each of the 4 categories; L24(xt) is a lag
operator that transforms the variable xt into a row vector consisting of 24 lags of xt; Sentt is the log
change of our media sentiment indicator; V olat is the estimated volatility of the corresponding market
index; Exogt are exogenous variables such as SMB, HML, MOM, and LIQ. We report only those lags of
our media sentiment indicator, which are statistically significant for at least one category. The original
VAR model includes 24 lags for each endogenous variable. Statistical significance is reported by asterisks
*, **, and *** at the 10, 5, and 1% level, respectively.
Vola
MSCI
World
t-stat. Vola
NAS-
DAQ
t-stat. Vola
MSCI
RE
t-stat. Vola
MSCI
EM Asia
incl.
Japan
t-stat.
Sentt−2 0.002 1.006 0.004 1.049 0.002 0.444 0.004 -0.003
Sentt−4 -0.001 -0.456 0.002 0.505 -0.012** -2.308 0.003 -0.004
Sentt−8 0.000 0.273 -0.000 -0.077 -0.006 -1.121 -0.001 -0.004
Sentt−9 -0.000 -0.308 0.000 0.073 0.001 0.186 0.003 -0.004
Sentt−10 0.005** 2.051 0.004 0.815 0.007 1.342 0.003 -0.004
Sentt−12 0.005* 1.959 0.003 0.591 0.013*** 2.437 -0.003 -0.004
Sentt−13 0.007*** 2.767 0.000 0.006 0.003 0.562 0.004 -0.004
Sentt−14 0.008*** 3.207 -0.002 -0.434 0.001 0.303 0.005 -0.004
Sentt−20 0.003 1.396 0.004 0.876 0.003 0.579 -0.003 -0.003
Sentt−22 -0.005** -2.054 -0.001 -0.234 0.002 0.424 -0.009*** -0.003
Sentt−23 -0.001 -0.002 -0.001 -0.003 -0.002 -0.005 -0.005* -0.003
SMBt -0.003 -0.428 0.004 0.242 0.012 0.552 -0.020* -0.011
HMLt 0.004 0.532 0.019 1.025 -0.012 -0.542 -0.006 -0.011
MOMt 0.007 1.418 0.016 1.291 0.012 0.965 0.000 -0.006
LIQt -0.011*** -3.342 -0.030*** -3.707 -0.017* -1.794 0.000 -0.004
Adj.R.sq. 0.160 0.354 0.093 0.146
F − Stat. 1.630 2.803 1.260 1.566
Number of
obs.
251 251 192 251
32
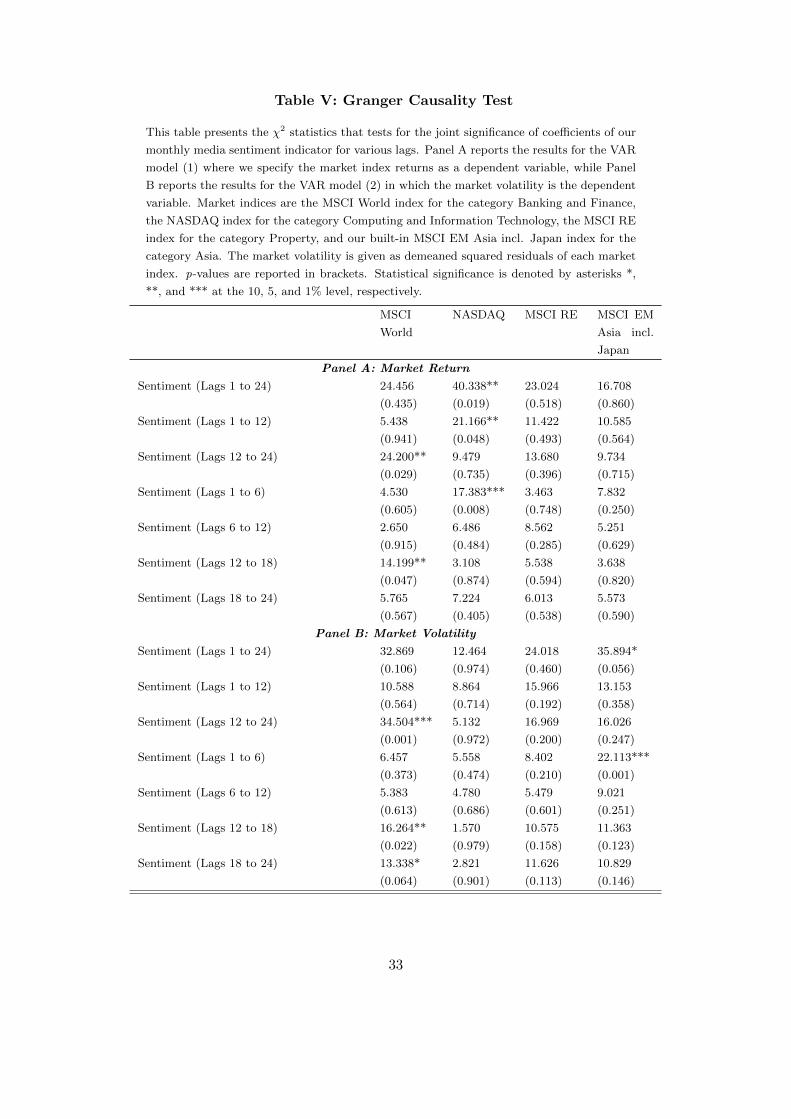
Table V: Granger Causality Test
This table presents the χ2 statistics that tests for the joint significance of coefficients of our
monthly media sentiment indicator for various lags. Panel A reports the results for the VAR
model (1) where we specify the market index returns as a dependent variable, while Panel
B reports the results for the VAR model (2) in which the market volatility is the dependent
variable. Market indices are the MSCI World index for the category Banking and Finance,
the NASDAQ index for the category Computing and Information Technology, the MSCI RE
index for the category Property, and our built-in MSCI EM Asia incl. Japan index for the
category Asia. The market volatility is given as demeaned squared residuals of each market
index. p-values are reported in brackets. Statistical significance is denoted by asterisks *,
**, and *** at the 10, 5, and 1% level, respectively.
MSCI
World
NASDAQ MSCI RE MSCI EM
Asia incl.
Japan
Panel A: Market Return
Sentiment (Lags 1 to 24) 24.456 40.338** 23.024 16.708
(0.435) (0.019) (0.518) (0.860)
Sentiment (Lags 1 to 12) 5.438 21.166** 11.422 10.585
(0.941) (0.048) (0.493) (0.564)
Sentiment (Lags 12 to 24) 24.200** 9.479 13.680 9.734
(0.029) (0.735) (0.396) (0.715)
Sentiment (Lags 1 to 6) 4.530 17.383*** 3.463 7.832
(0.605) (0.008) (0.748) (0.250)
Sentiment (Lags 6 to 12) 2.650 6.486 8.562 5.251
(0.915) (0.484) (0.285) (0.629)
Sentiment (Lags 12 to 18) 14.199** 3.108 5.538 3.638
(0.047) (0.874) (0.594) (0.820)
Sentiment (Lags 18 to 24) 5.765 7.224 6.013 5.573
(0.567) (0.405) (0.538) (0.590)
Panel B: Market Volatility
Sentiment (Lags 1 to 24) 32.869 12.464 24.018 35.894*
(0.106) (0.974) (0.460) (0.056)
Sentiment (Lags 1 to 12) 10.588 8.864 15.966 13.153
(0.564) (0.714) (0.192) (0.358)
Sentiment (Lags 12 to 24) 34.504*** 5.132 16.969 16.026
(0.001) (0.972) (0.200) (0.247)
Sentiment (Lags 1 to 6) 6.457 5.558 8.402 22.113***
(0.373) (0.474) (0.210) (0.001)
Sentiment (Lags 6 to 12) 5.383 4.780 5.479 9.021
(0.613) (0.686) (0.601) (0.251)
Sentiment (Lags 12 to 18) 16.264** 1.570 10.575 11.363
(0.022) (0.979) (0.158) (0.123)
Sentiment (Lags 18 to 24) 13.338* 2.821 11.626 10.829
(0.064) (0.901) (0.113) (0.146)
33

Table VI: Robustness Check: VAR Model - Market Proxy
This table presents the estimated coefficients for the VAR model (1):
Mrkt = α1 + β1L24(Mrkt) + β2L24(Sentt) + β3L24(V olat) + β4Exogt + ε1t
where Mrkt is the log rate of return of the market index for each of the 4 categories; L24(xt) is a lag
operator that transforms the variable xt into a row vector consisting of 24 lags of xt; Sentt is the log
change of our media sentiment indicator; V olat is the estimated volatility of the corresponding market
index; Exogt are exogenous variables such as SMB, HML, MOM, and LIQ. For the robustness check we
construct our monthly media sentiment indicator with a new set of news data, for which we exclude positive
(negative) words from our predetermined list of negative (positive) words. We report only those lags of
our media sentiment indicator, which are statistically significant for at least one category. The original
VAR model includes 24 lags for each endogenous variable. Statistical significance is reported by asterisks
*, **, and *** at the 10, 5, and 1% level, respectively.
MSCI
World
t-stat. NASDAQ t-stat. MSCI
RE
t-stat. MSCI
EM Asia
incl.
Japan
t-stat.
Sentt−1 -0.018 -0.890 -0.027* -1.870 -0.023 -1.105 0.005 -0.027
Sentt−3 0.010 0.434 -0.049** -2.134 -0.021 -0.730 -0.074** -0.034
Sentt−4 0.033 1.403 -0.042* -1.716 -0.002 -0.083 -0.044 -0.034
Sentt−10 -0.046** -2.064 0.020 0.770 -0.019 -0.698 -0.006 -0.036
Sentt−12 -0.016 -0.710 0.016 0.629 -0.008 -0.309 0.042 -0.036
Sentt−13 -0.044** -1.954 0.017 0.683 0.003 0.128 0.061* -0.035
Sentt−14 -0.040* -1.740 0.021 0.867 0.018 0.641 0.021 -0.036
Sentt−17 -0.078*** -3.190 0.024 1.028 -0.026 -0.989 0.026 -0.036
Sentt−18 -0.061*** -2.564 0.000 0.016 -0.048* -1.774 0.006 -0.033
Sentt−19 -0.051** -2.178 -0.010 -0.475 -0.040 -1.490 -0.030 -0.032
Sentt−22 0.020 0.956 0.014 0.752 -0.028 -1.132 0.013 -0.030
SMBt 0.081 0.841 0.587*** 4.698 0.372*** 2.408 0.152 -0.133
HMLt -0.342*** -3.401 -0.950*** -7.180 0.156 0.961 -0.104 -0.139
MOMt -0.233*** -3.654 -0.360*** -4.121 -0.449*** -4.800 -0.173** -0.080
LIQt 0.149*** 3.440 0.115** 1.998 0.155*** 2.326 0.115** -0.056
Adj.R.sq. 0.170 0.461 0.499 0.082
F − Stat. 1.674 3.823 1.511 1.297
Number of
obs.
251 251 192 251
34

Table VII: Robustness Check: VAR - Market Volatility
This table presents the estimated coefficients for our VAR model (2) :
V olat = α1 + β1L24(Mrkt) + β2L24(Sentt) + β3L24(V olat) + β4Exogt + ε1t
where Mrkt is the log rate of return of the market index for each of the 4 categories; L24(xt) is a lag
operator that transforms the variable xt into a row vector consisting of 24 lags of xt; Sentt is the log
change of our media sentiment indicator; V olat is the estimated volatility of the corresponding market
index; Exogt are exogenous variables such as SMB, HML, MOM, and LIQ. For the robustness check we
construct our monthly media sentiment indicator with a new set of news data, for which we exclude positive
(negative) words from our predetermined list of negative (positive) words. We report only those lags of
our media sentiment indicator, which are statistically significant for at least one category. The original
VAR model includes 24 lags for each endogenous variable. Statistical significance is reported by asterisks
*, **, and *** at the 10, 5, and 1% level, respectively.
Vola
MSCI
World
t-stat. Vola
NAS-
DAQ
t-stat. Vola
MSCI
RE
t-stat. Vola
MSCI
EM Asia
incl.
Japan
t-stat.
Sentt−4 -0.002 -1.150 0.002 0.731 -0.008* -1.954 0.000 -0.002
Sentt−13 0.005*** 2.863 0.001 0.406 0.001 0.241 0.004 -0.002
Sentt−14 0.006*** 3.375 0.001 0.398 -0.001 -0.295 0.004 -0.003
Sentt−15 0.004** 2.124 0.000 0.170 -0.001 -0.258 0.003 -0.003
Sentt−17 0.003* 1.876 -0.001 -0.323 -0.000 -0.139 0.000 -0.003
Sentt−20 0.003*** 2.071 0.001 0.567 0.003 0.825 -0.001 -0.002
Sentt−21 0.000 0.123 0.000 0.048 0.002 0.608 0.001 -0.002
Sentt−22 -0.003* -1.914 -0.000 -0.225 0.001 0.416 -0.003 -0.002
SMBt -0.006 -0.795 0.015 0.835 0.006 0.267 -0.020 -0.011
HMLt 0.004 0.547 0.023 1.209 -0.016 -0.696 -0.009 -0.011
MOMt 0.008 1.598 0.017 1.336 0.016 1.213 0.000 -0.006
LIQt -0.012*** -3.466 -0.030*** -3.539 -0.017* -1.779 0.000 -0.004
Adj.R.sq. 0.157 0.341 0.050 0.120
F − Stat. 1.614 2.704 1.132 1.452
Number of
obs.
251 251 192 251
35
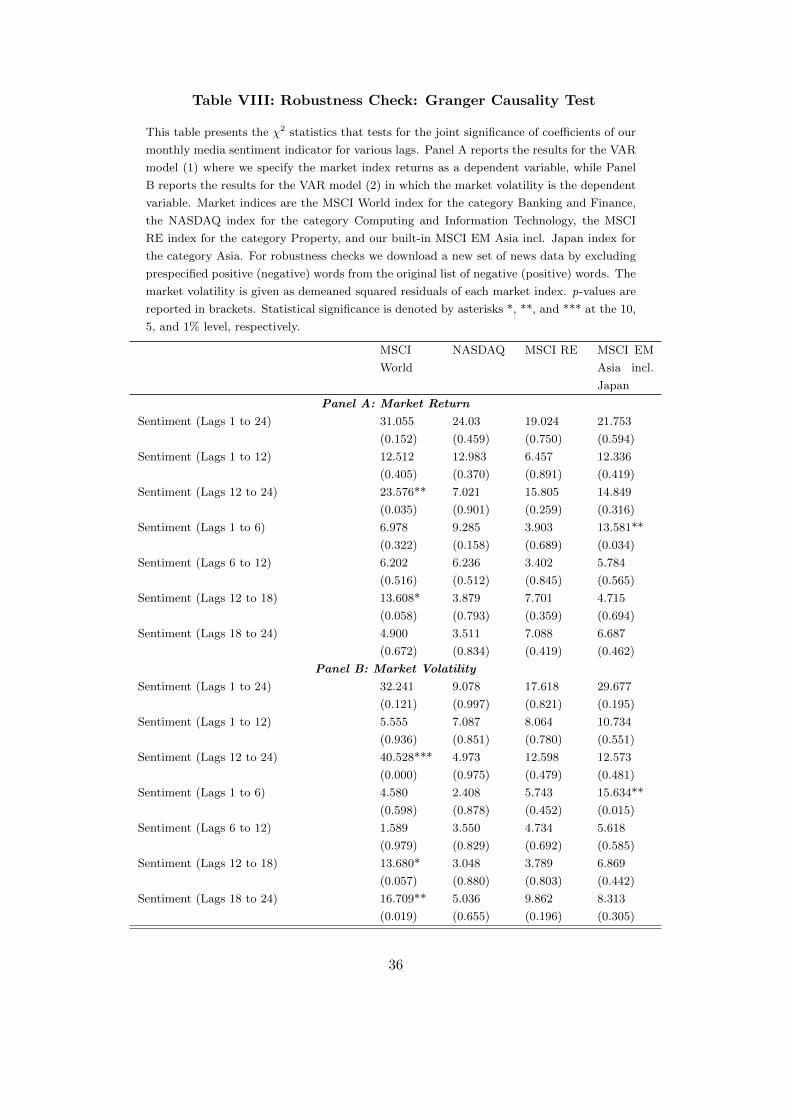
Table VIII: Robustness Check: Granger Causality Test
This table presents the χ2 statistics that tests for the joint significance of coefficients of our
monthly media sentiment indicator for various lags. Panel A reports the results for the VAR
model (1) where we specify the market index returns as a dependent variable, while Panel
B reports the results for the VAR model (2) in which the market volatility is the dependent
variable. Market indices are the MSCI World index for the category Banking and Finance,
the NASDAQ index for the category Computing and Information Technology, the MSCI
RE index for the category Property, and our built-in MSCI EM Asia incl. Japan index for
the category Asia. For robustness checks we download a new set of news data by excluding
prespecified positive (negative) words from the original list of negative (positive) words. The
market volatility is given as demeaned squared residuals of each market index. p-values are
reported in brackets. Statistical significance is denoted by asterisks *, **, and *** at the 10,
5, and 1% level, respectively.
MSCI
World
NASDAQ MSCI RE MSCI EM
Asia incl.
Japan
Panel A: Market Return
Sentiment (Lags 1 to 24) 31.055 24.03 19.024 21.753
(0.152) (0.459) (0.750) (0.594)
Sentiment (Lags 1 to 12) 12.512 12.983 6.457 12.336
(0.405) (0.370) (0.891) (0.419)
Sentiment (Lags 12 to 24) 23.576** 7.021 15.805 14.849
(0.035) (0.901) (0.259) (0.316)
Sentiment (Lags 1 to 6) 6.978 9.285 3.903 13.581**
(0.322) (0.158) (0.689) (0.034)
Sentiment (Lags 6 to 12) 6.202 6.236 3.402 5.784
(0.516) (0.512) (0.845) (0.565)
Sentiment (Lags 12 to 18) 13.608* 3.879 7.701 4.715
(0.058) (0.793) (0.359) (0.694)
Sentiment (Lags 18 to 24) 4.900 3.511 7.088 6.687
(0.672) (0.834) (0.419) (0.462)
Panel B: Market Volatility
Sentiment (Lags 1 to 24) 32.241 9.078 17.618 29.677
(0.121) (0.997) (0.821) (0.195)
Sentiment (Lags 1 to 12) 5.555 7.087 8.064 10.734
(0.936) (0.851) (0.780) (0.551)
Sentiment (Lags 12 to 24) 40.528*** 4.973 12.598 12.573
(0.000) (0.975) (0.479) (0.481)
Sentiment (Lags 1 to 6) 4.580 2.408 5.743 15.634**
(0.598) (0.878) (0.452) (0.015)
Sentiment (Lags 6 to 12) 1.589 3.550 4.734 5.618
(0.979) (0.829) (0.692) (0.585)
Sentiment (Lags 12 to 18) 13.680* 3.048 3.789 6.869
(0.057) (0.880) (0.803) (0.442)
Sentiment (Lags 18 to 24) 16.709** 5.036 9.862 8.313
(0.019) (0.655) (0.196) (0.305)
36

Figure I: Banking and Finance
The graph on the left plots at a monthly frequency media sentiment indicator for the category Banking and Finance and its corresponding market index,MSCI World, over our sample period between January 1990 and December 2012. The graph on the right shows our media sentiment indicator against thedemeaned squared residuals of the MSCI World index as a proxy for market volatility. Our media sentiment indicator is constructed by taking the ratio ofpessimistic news frame to optimistic news frame. Sentiment 2 is media sentiment indicator constructed for the robustness check. Both media sentimentindicators are standardized to 100 in January 1990.
37

Figure II: Computing and IT
The graph on the left plots our monthly media sentiment indicator for the category Computing and IT and its corresponding market index, NASDAQ, overthe sample period between January 1990 and December 2012. The graph on the right shows the media sentiment indicator against the demeaned squaredresiduals of the NASDAQ as a proxy for market volatility. The media sentiment indicator is constructed by taking the ratio of pessimistic news frame tooptimistic news frame. Sentiment 2 is the media sentiment indicator constructed for robustness checks. Both media sentiment indicators are standardizedto 100 in January 1990.
38

Figure III: Property
The graph on the left shows our media sentiment indicator at a monthly frequency for the category Property and its corresponding market index, MSCIRE, over the sample period between January 1990 and December 2012. The graph on the right shows our media sentiment indicator against the demeanedsquared residuals of the MSCI RE as a proxy for market volatility. The media sentiment indicator is constructed by taking the ratio of pessimistic newsframe to optimistic news frame. Sentiment 2 is the media sentiment indicator constructed for robustness checks. Both media sentiment indicators arestandardized to 100 in January 1990.
39

Figure IV: Asia
The graph on the left plots our monthly media sentiment indicator for the category Asia and its corresponding market index, MSCI EM Asia incl. Japan,over the sample period between January 1990 and December 2012. The MSCI EM Asia incl. Japan index is a built-in index that we construct by taking aweighted average of the MSCI EM Asia and the MSCI Japan indices by market capitalization. The graph on the right shows the media sentiment indicatoragainst the demeaned squared residuals of the MSCI EM Asia incl. Japan as a proxy for market volatility. The media sentiment indicator is constructed bytaking the ratio of pessimistic news frame to optimistic news frame. Sentiment 2 is the media sentiment indicator constructed for robustness checks. Bothmedia sentiment indicators are standardized to 100 in January 1990.
40