news gis - picgisrs.org · plotting. wolf also stated that msd-forestry was using vector data based...
TRANSCRIPT

1
sG I S&
REMOTE SENSING NEWSFIJI USER GROUP, Number 12 (9503), November 1995
N E W SDuring regular monthly meet-ings prior to September therewas insufficient time to coverthe usual news updates in Fiji.However, the meeting held on19 September at USP addressedthis situation and updates wereplaced as point number one ofthe agenda.
SEPTEMBER MEETING
MRD has installed a network tolink the computer of their dif-ferent buildings. The LandslideHazard Mapping Project is com-pleted and provides a provi-sional landslide hazard zonemap and a landslide inventorymap for the east zone of VitiLevu. Rapid landslide hazardmapping using GIS/RS is prac-tically possible in Fiji.Geochemical data have beendigitised and will be mergedwith the digital geological mapof Vanua Levu. The GIS-Docu-mentation of all spatial dataavailable at MRD has been com-pleted.
MSD-Forestry. All plantationmaps plotted by Lands Depart-
to relational data bank can beestablished. GPS survey of plan-tation boundaries is ongoing inVanua Levu. MSD-Forestry willestablish an e-mail link viaSOPAC to speed up the GPS
ment at a scale 1:10,000 havebeen digitised. Stocking infor-mation derived from aerialphoto interpretation has to bedigitised and overlaid overplantation boundary before link
data transfer from the field toColo-i-Suva. Stereo plotting iscontinuing on logging areas inViti Levu and Vanua Levu.Aerial Triangulation is continu-ing for logging areas and plan-tation photography. For the es-tablishment of ground controlpoints GPS is applied.
PWD. The urban utility forumis producing a film about GISapplications in Fiji.
SOPAC. Bathymetric data willsoon be available on CD-ROMwith the CD-ROM writer fullyoperational. Investigations arebeing conducted into the feasi-bility of setting up remote Lo-cal Area Networks connected byconventional telephone landlines with routers. ThePEACESAT terminal equipmenthas arrived.
Agriculture Department(MAFF). Digitising of Fiji�s soilmap is completed for Viti Levu.
Private Sector. The GIS for Fi-ji�s sugar Corporation will beMapInfo.
Discussion
Bruce Davis from (USP) pre-sented the Regional GIS Status.On this one page overview USPwas categorised a national or-ganisation instead of a regionalone. SOPAC was not mentionedas an organisation which ap-plies GIS or remote sensing.
Many participants of the meet-ing could not understand whythe report by Dr Changchui He(ESCAP) required six months toget to Fiji. Further, it was not un-derstood why the workshop inFebruary was mentioned as anational and not a regionalworkshop. SOPAC which pro-vided time and effort to supportthis workshop was not men-tioned. SOPAC did not receivea report. Concerns were ex-pressed about the usefulnessand relevance of this UN organi-sation.
SOPAC announced the inte-grated Coastal ManagementPlan for Nadi Bay.
MSD-Forestry showed a print-out of the new cloud-free SPOTscene which was recently re-ceived at their office.
Presentations
Wolf Forstreuter (MSD-
This is the third newsletter for 1995 and apologies are again in order for the small number of issues thisyear.
It is becoming increasingly important to monitor forest change through remote sensing tech-niques and this can be used to measure the “health” of this natural and essential resource as well as
the interaction between forestry and the water supply and water catchment. Not only does excessive forestutilisation affect the quality of our water supply but it also affects the coastal zone which includes the criticalreef system. Several articles address this issue. Forest Change Detection from MSD and Coastal Forests andShorelines from SOPAC, while the interaction of water and forestry is highlighted in a proposal by MSD to usethe water catchment as a management unit rather than the traditional district boundaries.
There has always been a shortage of satellite data for the South Pacific region which is mainly due to thelimited data storage capacity of the satellites and the need for relay satellites or more ground stations. Thiscan be overcome by a portable ground stations which can be moved to most locations in the region forcapturing satellite data which is outlined in an article by MSD.
MSD also provides a basic introduction to GPS and highlights the limits of this technology which hastransformed the survey field while another article compares raster and vector data where there is an ongoingneed to clarify the role of each system in applied GIS and remote sensing.
SOPAC has installed a PEACESAT terminal which allows for voice and data transfer with all participatingcountries which is described in this newsletter with an emphasis on distance education. SOPAC has alsodistributed offshore data using CD-ROM which is rapidly becoming the standard for distribution of large datasetsand software and this is also detailed. The rapid expansion of Internet services throughout the world and theacceptance of Internet e-mail as the foundation has led users in the South Pacific to expect service providersto offer e-mail as a basic service. While e-mail is traditionally used for messaging, it can readily be utilised fortransferring data as attached files. In the first of a series of regular Internet articles, the basics of file transferis explained.
Again we welcome contributions from national, regional and international users. Yes, you can reach us byInternet - see back page for the addresses!c

22
with NLTB continues with theLautoka office providing files inDXF format; two trainees willreceive one-week training atFLIS provided by the consultantcompany selling AREV soft-ware.
� MSD Forestry announcedthat: data capture of logging ar-eas and hardwood plantationsizes is ongoing; forest changedetection using new satellitedata has started.
Presentations
� Don Forbes (SOPAC) gave apresentation on the correlationbetween land use, in particulardeforestation, and coastal ero-sion. Examples were shown ofthe erosion in Kiribati, Feder-ated States of Micronesia andFiji. The use of aerial photogra-phy was outlined and the im-portance of this tool for contourmapping at 1:5000 scale is em-phasised. Satellite images arealso essential for mangrove typemapping, forestry change detec-tion and shallow water map-ping. The main software toolused for aerial photo analysis
n by Wolf Forstreuter, MSD, Forestry
Portable Satellite Ground Station (PGS)for the South Pacific
Need for Satellite Data
Fiji’s natural rainforest inventory required the purchase ofLandsat TM data to cover the main islands of the country.This data has been recorded by Landsat IV during 1991/1992.Aerial photographs were too expensive to cover forest areadue to the high stand-by-cost of aircraft waiting for infrequentcloud free conditions. Continuous or regular cost effectiveforest monitoring is also needed as the Fiji Government can-not meet the high costs associated with aerial photographicsurveys every three to five years. In addition to forestry appli-cations, the Government agriculture sector has a requirementto monitor land-use outside forested areas.
The monitoring of the environment has become increas-ingly important for the responsible management of resourcesand providing information critical for disaster mitigation pro-grams. This requires up-to-date data of the land surface, whichcannot be provided by aerial photographs which are normally10 times more costly.
Conventional Data Receiving and PortableGround Station (PGS)
Landsat
During the natural forest inventory, the Landsat data was re-corded by the satellite and downloaded to the receiving sta-
was GRASS. A full report willbe provided in the next news-letter.
Subsequent discussion rein-forced the critical need to pre-serve and catalogue a library ofaerial photos and satellite im-ages for detection of land usechange. The need for detailedground control data was alsoemphasised.
Wolf Forstreuter presented onbehalf of Joe Wakolo (MSD,Forestry), the importance ofwater catchment as a forestrymanagement unit which is morerelevant to growth conditionsdue to similar soil and climaticenvironment. Water catchmentunits may be considered as thearea in which there is a focalpoint, such as a river, for rain-fall drainage. The river whichcollects the drainage reflects byits sediments the land use andthe sylvicultural treatment ofthe forest cover within the catch-ment. Monitoring and planningcould be rationalised using thecatchment as the managementunit as opposed to the currentpractice of district boundaries as
Forstry) explained the benefitsof a raster data based GIS forforest mapping at 1:50,000 scale.He detailed that ARC-INFO haslimits which prevent this vec-tor data based software frombeing able to perform manycommon forestry analysis tasks.Forestry must deal with scat-tered areas which create a highnumber of polygons. This can-not be handled by ARC-INFO.Overlay analysis is very timeconsuming if a vector databased system is applied. Hedemonstrated this limitation aswell. Further, he mentioned thesoftware problems during mapplotting. Wolf also stated thatMSD-Forestry was using vectordata based systems (ARC-INFOand MicroStation) for mappingat 1:10,000 scale.
Bruce Davis (USP) demon-strated ArcView 1.0 softwarewhich allows the visualisationof tabular data with spatialdata. It was noted that ArcView1.0 is now public domain soft-ware.
Fabrice Williot (SOPAC) dem-onstrated IDRISI for Windowswhich is an image analysis andraster data GIS software.SOPAC is considering IDRISI asa low cost software applicationwherever raster data GIS or sat-ellite data analysis is required.The software can handle dBASEfiles but limitations include anon-standard Windows inter-face and unsatisfactory per-formance which should be ad-dressed in future releases.
Les Allinson (SOPAC) pre-sented Data Maps which is in-cluded with Microsoft Excel 7.0(Excel for Windows 95). Thisadd-in is the result of Microsoftpurchasing the license to useportions of the core technologyfrom MapInfo Corporation.Data Maps is entirely adequatefor simple thematic mappingbut the version included underExcel clearly requires some nec-essary updates. It may be seena sampler of GIS and may be anadvertising tool to attract usersrequring a GIS with more fea-tures to select MapInfo.
Group Discussion
The GIS-Users decided thatthey will not give a softwarerecommendation for a GISpackage. The needs of the us-ers are too diverse to propose a
specific software. Also WolfForstreuter �s presentationshowed that well-recom-mended software can be inap-propriate for many tasks. Thegroup agreed that endorsementof a particular software or set ofsoftware should be postponedto after a comprehensive surveyof all users was carried out.
OCTOBER MEETING
SOPAC gave a summary of im-portant points from the annualsession which was held at theForum Secretariat ConferenceCentre from 26 September to 6October.� It was announced atSouth Pacific Forum Meeting inPapua New Guinea that the Fo-rum Secretariat would not betaking on further technical pro-grams and it is possible that theUnited Nations Department ofHumanitarian Affairs could befully or partially located atSOPAC.
� Offshore data in MapInfo for-mat distributed to all membercountries on CD-ROM. Coast-lines available at 1:250,000,bathymetry at 50 metre con-tours. EEZ and Territorial wa-ters zones provided. Countriesin whose waters theSOPACMAPS survey was car-ried out received additionaldata. This project was funded byEuropean Union. Full descrip-tion in next newsletter.
� PEACESAT is operational. Itwill allow voice and data trans-fer with other PEACESAT siteswhich are in all member coun-tries of SOPAC. Full details innext newsletter.
� MRD was heavily involvedin the SOPAC annual session.The computer network is nowoperational. The spatial datacatalogue is now published.
� Lukemine Enterprise an-nounced that two hand-heldGPS units have been suppliedto the private sector in Fiji andas the MapInfo agent in Fiji theywill be receiving information onthe next release of this productwhich is version 4.
� FLIS advised that: the datacapture for Viti Levu title officeis ongoing; the photo flight car-ried out from Brisbane will con-tinue as soon as weather condi-tions improve; co-operation

3
the management unit. A full re-port will be provided in the nextnewsletter.
In the following discussion itwas noted that not only waterlevel and quality measurementswere available for rivers in Fijibut also groundwater level ob-servations are being recorded.Further it was suggested thatthe management unit shouldfurther be divided into geo-bio-climatic [sic] water catchment subareas.
Kemueli Masikerei, FLIS, re-ported on a the Fourth RegionalRemote Sensing Seminar onTropical Ecosystem Manage-ment held in the Philippinesfrom 4 - 9 September. The semi-nar was funded by NASDA(partly ESCAP). Three UN-de-veloped software packages for
remote sensing and GIS wereprovided to participants. Therewere 61 participants andKemueli was the only repre-sentative from the South Pacific.However, the next meeting willbe held in Fiji. A committee willbe formed including representa-tives from FLIS, MRD, MSD For-estry and SOPAC to discuss tim-ing, venue and other details.Satellite data has to be availablefor use by participants for learn-ing the application of this tech-nology including disaster man-agement, forestry monitoring,coastal management, agricul-ture and fisheries.
Ramen Shasan, Bureau of Statis-ticsThe district boundaries of Fijiare being digitised under aUNFPA-funded project whichwill update the outdated district
pears that the DOS maps containthe latest revision of the districtboundaries.
FLIS advised that there will beanother release of Lands Depart-ment district boundaries in No-vember 1995 which will reflectthe latest revision. Theseboundaries will be available inDXF format with FMG grid.
Mataqali boundaries will not beavailable. The priority haschanged to district boundaries.
Discussion
FLIS advised that a suggestionhad been made for a committeeto review and catalogue re-
boundaries. The final outputwill enable the user to find the1976, 1986 and 1996 censusboundary. A census boundaryindicates the area of the district.The spatial information islinked to a relational data basewhich containing details ofhouseholds and people living inthe area.
Questions were raised about theversion of district boundaries.The district boundaries shownin the latest Lands Departmenttopographic maps do not corre-spond with the district bounda-ries from the earlier British De-partment of Overseas Survey(DOS) maps. However, it ap-
tions in the USA via the relay satellite TDRS. However, theTM sensor onboard Landsat IV stopped working and the samesensor onboard Landsat V cannot be utilised for data record-ing over Fiji because this satellite can only download directlyto ground stations.
SPOT
The SPOT satellite can store data on a tape recorder anddownload it while flying over the ground station in France butthe storage capacity is limited and data receiving has to beprogrammed in advance. Another problem is the difficulty offorecasting Fiji’s weather situation.
In addition:
• SPOT data has less information content because it doesnot cover the infrared bands which are important for for-est type mapping;
• SPOT data is more costly than Landsat TM. TM data costs$ FJ 0.21 / km2 SPOT data costs $ FJ 0.79/km2, approxi-mately four times more.
There are other satellites such as IRS (Indian RemoteSensing Satellites) ERS (European Remote Sensing Satel-lites), JERS (Japanese Earth Resource Satellite) orRADARSAT which can or could replace SPOT data. Withthe exception of RADARSAT and JERS, these satellites haveno onboard tape facility and they require direct link to a groundstation.
Fiji as well as the other South Pacific Island Countries arefar away from major world population centres and are there-fore not covered by a satellite data ground receiving station.The need for data by one country only would not cover thecost of such a station but there are PGS on the market whichcould fulfil the requirements of these countries.
A PGS as described below has a range of 4000 Km. Ifsuch a PGS is placed in Fiji it could receive data for Fiji,Vanuatu, Tonga, Niue, Tuvalu and Samoa. If the same sta-tion would be moved later to Nauru it would receive data for
SOPAC DATA ON CD-ROMOffshore survey data was prepared on CD-ROM for distri-bution to the island member countries at the 24th Annual Ses-sion in Suva in October 1995. The data included bathymetry,coastlines, Exclusive Economic Zone and 12nm boundaries,and survey vessel tracks. In addition, Fiji, Solomon Islands,Tuvalu and Vanuatu were provided with data fromSOPACMAPS which included bathymetry, seafloor imagesand survey vessel tracks from surveys carried out in theirinternational waters. The data was predominantly in MapInfoformat and a help file was supplied to assist in viewing andinterpreting the data.
The size of data associated with Geographic Informa-tion Systems and in particular offshore surveys is far in ex-cess of that which can be distributed practically on floppydisks and often too large to be able to store on the averageuser�s hard drive. SOPAC identified the emerging standardin 1993 of using the audio CD for storing digital data wherecurrent capacities are approx. 650 Mb. Since that time, Infor-
Figure 1. Receiving range of PGS in the South Pacific,assumed that the station moves from Fiji to Nauru and fromthere to Polynesia.

44
motely sensed satellite data forFiji. The meeting highlightedthe existing spatial data cata-logues available from MSD For-estry and SOPAC which detailall available data for the coun-try in an easily understandableformat.
SOPAC reminded participantsthat there is an Internet e-mailnews group named GIS-PACnetspecialising in GIS and RemoteSensing matters of interest forthe South Pacific. Users withInternet e-mail access shouldcontact Franck Martin at SOPAC([email protected]) for inclu-sion in this news group. MSD
mation Systems in member countries have been upgradedwith CD-ROM readers and these have been recommendedin all new computer systems. It is anticipated that all islandmember countries already have or will very soon acquire CD-ROM readers to provide access to this current standard fordata as well as software distribution.
SOPAC acknowledges the valuable support of the Euro-pean Union (EU) in providing funding for acquiring theSOPACMAPS data as well as funding for computer basedinformation systems to interpret this data. The Japanese In-ternational Co-operation Agency (JICA) is also acknowledgedfor funding support for hardware and software necessary forpreparing CD-ROM�s.
Background
In 1993, Information Systems were supplied to the eight ACPmember countries to assist in the implementation of their
SOPAC work programs under the EU funded South PacificMarine Resources Program.
These Information Systems included computer hardware(desktop computer, laser printer and UPS), software, acces-sories and consumables where the software was MicrosoftOffice Professional as the core suite with MapInfo and Surferfor desktop mapping & GIS and gridding & contouring re-spectively.
In the following year, the 8 ACP member country Informa-tion Systems were upgraded with CD-ROM readers, addi-tional memory for desktop computers and laser printers whilesoftware included upgrades to Windows for Workgroups,Microsoft Office Professional 4.3 and MapInfo 3.x.
This upgrade was in preparation for SOPAC to distrib-ute data on CD-ROM, in particular the offshore survey datafrom SOPACMAPS in the waters of Fiji, Solomon Islands,Tuvalu and Vanuatu.
Summary of Data
The data can be classified into Common and SOPACMAPS:
Common - approx. size 100 MbBathymetry - (GEODAS)Coastlines - (DMA/NGDC)EEZ and 12 nm boundaries - (FFA/SOPAC)Vessel Surveys (Cruises) - (NGDC: 1,133; SOPAC: 394)
SOPACMAPS - approx. size 200 MbBathymetryDXF of BathymetrySeafloor ImagesVessel Survey tracks (MGD77)
The table across shows data on CD-ROM for each island mem-ber country.
the Solomon Islands, Federal States of Micronesia, MarshallIslands etc.
The IOSAT Transportable Satellite Imaging Terminal
The first known PGS was used in Kenya, in September 1994.This PGS was operated by TELEOS a partnership betweenTelespazio of Rome and EOSAT (USA). While this stationcan receive Landsat and IRS data, the raw data must be sentto EOSAT for conversion into a computer compatible prod-uct. IOSAT a Canadian Company has produced a PGS whichis called Transportable Satellite Imaging Terminal (T-SIT). ThisT-SIT can already provide satellite data in computer compat-ible format or even images in the form of hard copy.
The T-SIT consist of several subsystems. A minimally 4.3m auto-tracking antenna system (3800 km range) or option-ally a 6.2 m dish (4000 km range) can be provided. A sepa-rate shelter encloses the antenna control system, the dataacquisition system, a high speed SAR processor and an ad-vanced workstation for further processing and display of theresulting imagery. Also included within the shelter are hard-copy production units, as well as power, environmental, and
communications subsystems. Such a T-SIT would cost $US5 million. Additional money has to be available for the licens-ing fees.
Once on-site, a two-person field crew can assemble the an-tenna, and raise it to its operational position within two to five
Figure 2. The T-SIT system ready for transport.Inset:IOSAT antenna.
Forestry recently provided a 3Dview from the ocean to Rakirakiwhich was created in theERDAS software by applying aLandsat TM image over the FijiDTM. The image was providedon the news group as an 18Kbitmap which could be viewedin MS Word.
Next Meeting
To be held Tuesday 14 Novem-ber at MSD Forestry. MikePoidevin, who will be leavingFiji end of November, will bepresenting a summary of hiswork.c

5
D A T ACOUNTRY CODE COMMON SOPACMAPS
Australia AU YesCook Islands CK YesF.S.M. FM YesFiji FJ Yes Yes1
Guam GU YesKiribati KI YesMarshall Islands MH YesNew Caledonia NC YesNiue NU YesNew Zealand NZ YesFrench Polynesia PF YesP.N.G. PG YesSolomon Islands SB Yes YesTonga TO YesTuvalu TV Yes YesVanuatu VU Yes YesWestern Samoa WS Yes
17 4
Note 1 Includes additional bathymetry and imaging from waters South of Viti Levu
hours. The complete system can be transported by ship orC130 Hercules aircraft. The system is available in either traileror skid mount, able to move independently from a harbour tothe location designed for data receiving.
Recommendations
Should the South Pacific Island Countries acquire and oper-ate a PGS without any financial support from aid donors, theywill still have to pay for the received data. In order that this isundertaken effectively there is a need of an agreement formanagement of the PGS as well as data promotion and shar-ing. Data sharing does not mean data sharing between coun-tries but between different departments of the same Govern-ment and a permit is required from the satellite data market-ing companies such as EOSAT1, SPOT image andRADARSAT.
Funding for the purchase of satellite data must be availablebefore a PGS is acquired.
Activities which require and can benefit from satellite data,such as land use mapping, must be promoted to ensure thatsuch data is available to the widest possible audience.
An agreement is necessary between the South Pacific IslandCountries and an appropriate implementing agency with re-mote sensing expertise, such as SOPAC, to ensure the effi-cient operation of the PGS and subsequent data processingand distribution.
For further information about IOSAT Transportable SatelliteImage Terminal ask MSD-Forestry Fax: +679 320311, [email protected]. There is a detailed article available pro-vided by IOSAT marketing director M.J. Washer.c1 EOSAT already agreed by fax to MSD-Forestry
IntroductionThe Management Services Division of the Forestry Depart-ment needs mataqali boundaries because:• many requests about remaining forest cover are related
to the area of mataqalis;• the establishment of plantations mostly follows the lease
area and this is related to mataqali.The mataqali boundary is a political boundary which has a
legal status. This status is documented on map sheets, whichdo not fit into the topographic map sheets. Any manual draw-ing into the topographic maps is difficult and creates inaccu-racy. The Native Lands Trust Board (NLTB) is responsible forthese boundaries and keeps them in a spatial data base. TheFiji Land Information Support Centre (FLIS) managed to writea program which converts this data to files which can be han-dled by MicroStation. MicroStation allows the export in DXFfile format, which is the file format agreed to be the commonformat for Fiji. The first DXF files are now imported by theMSD.
Export of DXF Files at FLISFrom NLTB the files containing mataqali boundaries are ex-ported to SIF file format. This files can be imported byMicroStation at FLIS. FLIS checks the accuracy of the storedinformation and exports the files to DXF format. InMicroStation, the File, Export, DXF or DWG menu has tobe used to created a DXF ASCII file. It is not sufficient onlysaving the file as DXF!
Import of DXF Files to ARC-INFOARC-INFO has a module called DATA CONVERSION whichtranslates about 10 different file formats to ARC-INFOcoverages. This software package also helps to display in-formation stored in different formats. Before converting a DXFfile the program displays the file content. See Table 1 (over-leaf).
Knowing the content of the DXF file it can be converted bythe program DXFARC. The program allows to convert everylayer separately. The name of the layer is displayed byDXFINFO as “Pattern Name”.
If the file is converted to an ARC-INFO coverage it has tobe cleaned. All information beside the arc showing themataqali boundary must be eliminated. Later it will be possi-ble to import the boundary arcs only.
Import ARC-INFO Coverage to ERDASThe ERDAS software package is also equipped with a dataconversion module. ERDARC which is one of the programsconverts ERDAS format files to and from ARC-INFO formatfiles. The ARC-INFO coverage must be firstly converted toan ERDAS *.DIG file, which is still a vector data file. This fileis an ASCII file an can be easily edited, GIS values can bechanged, the file can be shifted within the FMG co-ordinatesystem etc.
To convert the *.DIG file into a raster layer the ERDASprogram GIDPOLY is used. This gives all pixels with a poly-
IMPORT OF MATAQALI BOUNDARIESSTORED AS DXF FILES
n by Asesela Wata, MSD-Forestry

66
Table 1 . Content of a DXF file provided by NLTB via FLIS displayed with DXFINFO.
LAYER NAME ARCS POINTS TEXT ATTRIB INSERT LEN COLOR LINETYPE------------------------------------------------------------------------------------------------------------------------------------------------------------------0 0 0 0 0 0 0 7 CONTINUOUSCONSTRUCTION_CLA 0 0 0 0 0 0 7 CONTINUOUSPATTERN_CLASS 0 0 0 0 0 0 CONTINUOUS31 4 0 0 0 0 0 7 CONTINUOUS30 4 0 0 0 0 0 7 CONTINUOUS4 90 0 0 0 1 0 7 CONTINUOUS10 5 0 0 0 0 0 7 CONTINUOUS3 32 0 0 0 0 0 7 CONTINUOUS1 15 0 0 0 0 0 7 CONTINUOUS2 0 0 18 0 0 8 7 CONTINUOUS50 0 0 51 0 0 6 7 CONTINUOUS62 0 0 19 0 0 25 7 CONTINUOUS11 0 0 1 0 0 9 7 CONTINUOUS51 92 0 43 0 43 15 7 CONTINUOUS-------------------------------------------------------------------------------------------------------------------------------------------------------------------ALL LAYERS 242 0 132 0 44 25-------------------------------------------------------------------------------------------------------------------------------------------------------------------
gon (here mataqali) the GISvalue stored as POLY_ID inthe ARC-INFO coverage.
The ERDAS layer show-ing the mataqali areas (notboundaries!). This layer thencan be overlayed by the for-est type layer showing theforest types derived from sat-ellite data interpretation (heredigital analysis). The overlayprocess masks all areas outnot belonging to the investi-gated mataqali. With theERDAS program BSTATSthe number of pixel belong-ing to each forest type can becounted. See Table 2.
Results, Recommendations
With the mataqali boundaryprovided by NLTB via FLIS itis possible to calculate thearea covered by different for-est types. Knowing the areaper forest type it is also pos-sible to calculate the stand-ing timber volume. However:
• the area calculation isbased on satellite dataanalysis which was doneon the scale 1:50,000.The scale is also standingfor the accuracy, whichwill always be 1:50,000even if the map is blownup to 1:25,000 or1:10,000!
• if a standing timber vol-ume will be calculated, thearea is multiplied by theaverage standing volume
The upper left corner has coordinate: 1875975, 3939050 The cell size is (X, Y):25, 25 The number of hectares per cell is: 0.0625.
Table 2 . The table shows the ERDAS printout of area calcu-lation done for the forest types covering one mataqali.
VALUE POINTS Hectares DESCRIPTION------------------------------------------------------------------------------------------------------------
1 0. 0.000 Waterbodies2 0. 0.000 Mangrove3 1087. 67.937 Non Forest4 0. 0.000 Hardwood Plantation5 9272. 579.500 Softwood Plantation6 0. 0.000 Coconut Plantation7 0. 0.000 Obscured by Clouds8 229. 14.312 Town Area9 27. 1.687 Forest (low density)10 0. 0.000 Forest (medium density)11 0. 0.000 Forest (high density)
------------------------------------------------------------------------------------------------------------663.436 Area of Mataqali
-----------------------------------------------------------------------------
per province (or district). The average may be differentwith the situation which can be found in this small sub-area.c
S a t e l l i t eN E W SEOSAT� EOSAT is the exclusive
distributor of Indian sat-ellite data during the next10 years. Launch IRS-1Cin August, with IRS-1D tofollow in 1996.
� EOSAT has collected datafrom IRS-1B since June
1994 and IRS-P2 sinceearly this year.
� EOSAT is planning fu-ture ground stationsworldwide. (GIS-World,April 1995)
EOSAT agreed with the Eu-ropean Space Agency andRadarsat International todistribute ERS-1 remotesensing radar data to U.S.customers. (GIS-World, June1995).
Indian Remote SensingSatelliteIRS-P3 will be launched inSeptember 1995. This satel-lite will include an ocean col-our instrument for oceanog-raphy. (GIS-World, April1995). IRS-1C is scheduled tobe launched in 1995 from theBaikonur Cosmodrom inRussia, a few weeks apartfrom launching IRS-P3.(EOSAT Notes Summer 1995)
SPOTSPOT Asia announced theavailability of a worldwideSPOT data catalogue on CD-ROM. Three disks cover alldata from 1986 to June 1995.The data is supplied free ofcharge (excluding freight)fax 65-277-6231. (GIS ASIAPacific October 1995)
High-Resolution RemoteSensing Companies FormsThe Newsletter reported ear-lier about the Eyeglass con-sortium in USA. Now a newventure called OrbView hasbeen created with parts ofEyeglass and a Saudi Ara-bian investment company.This company will launch asatellite carrying a 1 meterpanchromatic sensor and a 8metre multispectral scannerby 1997. The satellite will flyin 460 km circular orbit with14-day repeat cycle. (GISUser August-September1995) (GIS-World, March1995)
Another company calledEarthWatch will launch itsfirst satellite in the first quar-ter of 1996 with a 3 meterpanchromatic and a 15 me-ter multicolour sensor. Thesecond satellite in 1997 willhave a 1 metre panchromaticand a 4 metre multicoloursensor (GIS-World, March1995) The first three groundstations in Alaska, northernScandinavia and Colorado.(GIS-World, August 1995)
The Geophysical & Environ-mental Research Corp.(GER), Latham, New Yorkannounced the GER Earth
7
Resource Observation System (GEROS) project, a system ofup to six remote sensing satellites. Each satellite will beequipped with a multispectral sensor with 10 metre resolu-tion and a panchromatic sensor with sharper resolution. Thesatellites will provide on-line images for agricultural produc-tion, environmental protection, forestry and land manage-ment. The first phase satellites and receiving station systemis scheduled to become fully operational in 1998. (GIS-World,September 1995)
GPS Satellites to be upgradedIn the USA, four Government agencies, the U.S. NationalOceanic and Atmospheric Administration (NOAA), the U.S.Environmental Protection Agency (EPA), the U.S. GeologicalSurvey (USGS) and the National Biological Survey (NBS)partnered to jointly acquire and share Landsat TM satellitedata. Through the joint acquisition and sharing of data, thegovernment will save $US 4 million in direct costs. Another$US 26 million will be saved in indirect costs for joint analy-sis, archiving, management and distribution. (GIS-World, May1995). Such a joint venture could be the model for SouthPacific Island Countries to share costs of EOSAT distributeddata (Landsat, IRS and JEERS). This may convince SPOT toallow data sharing between government agencies.
Geostationary Operational Environmental SatelliteFirst images of GOES-9 (Geostationary Operational Environ-mental Satellite) are available. The satellite was launched May23 and provides eight images per hour. These images areavailable free. (GIS-World, July 1995)
Radarsat Antarctica Mapping ProjectBecause of its environmental significance the Radarsat Ant-arctica Mapping Project (RAMP) will create 3D maps of theAntarctica. RADARSAT�s SAR data will allow to overcomedifficulties such as harsh climate and clouds. It will be possi-ble to map the continent in 18 days. The first mapping willbe carried out in October 1996. A second mapping is sched-uled three years later, which will enable to detect changes inthe ice formation. (GIS-World, August 1995)
OceansatIndia has initiated a major program known as the MarineRemote Sensing Information System. The system is designedto provide data to Fishery. The main objective is the forecast-
ing of potential fishing grounds. The next important user ofthe data provided by the system is the Meteorology sector.Cyclones mostly start from offshore, but they influence theinland crop production. The system will build and operate asatellite called Oceansat carrying sensors such as:� an Ocean Colour Monitor to detect Chlorophyll concen-
tration, suspended sediments, shallow water bathymetry,coastal currents, oil slicks and other pollution and inter-nal waves;
� a scatterometer to detect wind speed and direction, heatbudget, storm surge and sea level;
� an altimeter to measure wave height, ocean currents, seasurface topography, tides etc;
� a passive microwave radiometer to provide ionosphericcorrections for the scatterometer;
� a thermal infrared radiometer to provide data about thesea surface temperature, cloud cover, coastal currents etc.
The satellite will be launched in 1998. The power system isdesigned to permit a global coverage. However, in order toreceive data from all sensors, ground stations are necessary(GIS User May-July 1995).
RESURSDigital image data is available from the third satellite of theRussian RESURS series. The sensors covers a wide swath(600 km). The repeat interval at the equator is 4 days whichshortens with the latitude. The satellite has a onboard tapeand the Swedish Space Corporation together with Russianorganisations will look into opportunities to expand the net-work of direct receiving stations. The frequent repeat cover-age make this satellite data interesting for monitoring agri-culture, forests, coastal zones or snow cover (GIS ASIA PA-CIFIC August 1995).c
Activities are undertaken to include water catchments intothe Geographic Information System (GIS) to be able to pro-vide information on this level.
Relation of Water Catchments and Forest Cover
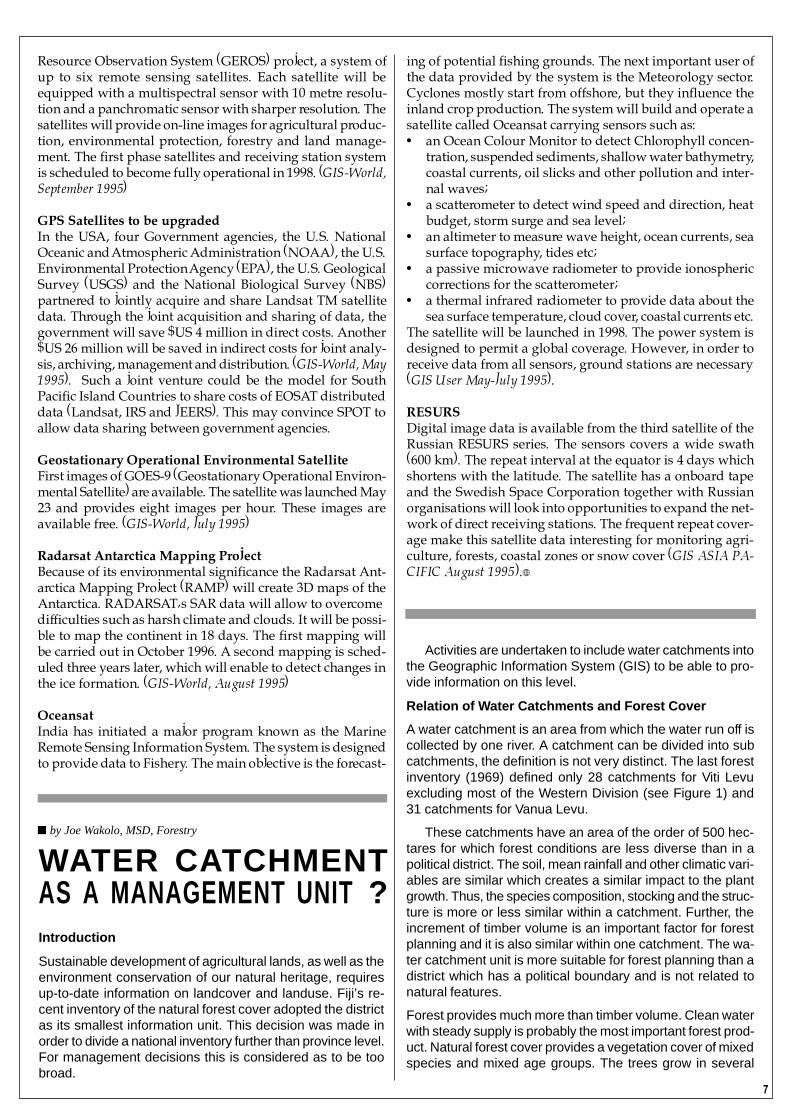
A water catchment is an area from which the water run off iscollected by one river. A catchment can be divided into subcatchments, the definition is not very distinct. The last forestinventory (1969) defined only 28 catchments for Viti Levuexcluding most of the Western Division (see Figure 1) and31 catchments for Vanua Levu.
These catchments have an area of the order of 500 hec-tares for which forest conditions are less diverse than in apolitical district. The soil, mean rainfall and other climatic vari-ables are similar which creates a similar impact to the plantgrowth. Thus, the species composition, stocking and the struc-ture is more or less similar within a catchment. Further, theincrement of timber volume is an important factor for forestplanning and it is also similar within one catchment. The wa-ter catchment unit is more suitable for forest planning than adistrict which has a political boundary and is not related tonatural features.
Forest provides much more than timber volume. Clean waterwith steady supply is probably the most important forest prod-uct. Natural forest cover provides a vegetation cover of mixedspecies and mixed age groups. The trees grow in several
Introduction
Sustainable development of agricultural lands, as well as theenvironment conservation of our natural heritage, requiresup-to-date information on landcover and landuse. Fiji’s re-cent inventory of the natural forest cover adopted the districtas its smallest information unit. This decision was made inorder to divide a national inventory further than province level.For management decisions this is considered as to be toobroad.
WATER CATCHMENTAS A MANAGEMENT UNIT ?
n by Joe Wakolo, MSD, Forestry

88
Figure 1. Water catchment defined in Viti Levu by the forest inventory 1969. The westernpart of Viti Levu was not covered by the inventory. The catchments do not correspond withthe catchment units of the Hydrology section of the Public Works Department.
canopy stories and even thebottom underneath the treesis covered by bushes andsmaller plants. Raindrops willfirst hit leaves of trees fromthe upper canopy story.Whenever a drop strikes aleave it is divided into smallerdrops (interception) and onlyfine drizzle reaches the plantson the rainforest floor. A highpercentage of the rain watergoes as fog back into the airand the soil is moistened bythe rest. There is compara-tively little water runoff and inthis way the soil can store ahigh amount of water.
Different sylviculturaltreatments or different log-ging practices open thecanopy in various intensitieswhich influences the waterrun off. Even selective log-ging creates a change of wa-ter colour. Thus the sedimentcontent of creeks and riverscan indicate forest activitieswithin the catchment. In orderto monitor forest activities thecatchment area would be theappropriate unit and not thepolitical district.
The correlation betweendifferent forest cover, slope,soil, rainfall on one side andwater peaks and steady wa-ter flow on the other side isnot known in Fiji, yet. How-ever, it is currently being re-searched by the MSD man-agement officer at the Uni-versity of Freiburg and itseems already to be clearthat there is a correlation. Ifso, the planning of land useand forest treatment will leadinto a planning of water re-sources. The planning unithas to be the catchment andnot the political district.
Possibilities of Changefrom Political District toCatchment as Forest Unit
At MSD-Forestry all spatialdata is available per mapsheet for the new Lands De-partment map sheet cover-age. If there is a request ofe.g. forest area per district anoverlay analysis combinesthe layer “district” with thelayer “forest cover”. The au-thor also digitised the watercatchments used for the
1969 inventory. The combi-nation of water catchmentwith any other spatial infor-mation stored at MSD is nowpossible.
The recent inventory ofFiji’s natural forests createda data base of all forest fieldmeasurements and observa-tions. More than 500 sampleplots are stored in a dBASEIV data bank and can be usedto calculate the mean timbervolume, species composi-tion, regeneration potential orpotential of minor forest prod-ucts available per province ordistrict.
This data bank is easilyaccessible and a combina-tion with the spatial informa-tion on catchments is possi-ble. However, in order to op-erate the data base inde-pendently from the GIS addi-tional software must be writ-ten.
Important: The nationwide inventory gives a de-tailed picture about Fiji’s natu-ral forest. It may be the casethat in a small area such asa water catchment only a verylimited number of plots havebeen measured. If watercatchments are treated asforest management units ad-ditional forest measurementshave to be carried out toreach a sufficient accuracy.
n by Franck Martin, SOPAC,[email protected]
Transferring files via e-mailFiji is starting to ride the information super highway, with asmall car indeed, but a running car. The first tool we find onthe highway is e-mail (electronic mail) and is the basic serv-ice used over Internet which allows for the transfer of textmessages and attached files.
It doesn�t need a full time connection. Depending on youre-mail software, your computer can allow you to type a mes-sage to be uploaded to the closest Internet node in one shotwith all the messages previously typed. For instance sittingconformably at home, I�m using Microsoft Exchange to com-pose this message, in few minutes I will connect to my serverin SOPAC, and this message will go on the Information High-way to reach you.
This configuration is indeed very easy to handle.Mostbasic users will use either a terminal session to connectto a host server where they will compose their mail, or useuupc software to compose it on their PC and send all themail of the organisation to the closest Internet node.
9
Recommendations
There is sufficient grounds to justify the water catchment as aforest and land use management unit. However, nobody knowsthe correlation between Fiji’s land use, forest treatment andthe water flow and sediment content of the rivers. This has tobe investigated and monitored as a joint action between For-estry and Public Works Department.
Further, the idea of catchment as being a forest managementunit may require administrative restructure within the ForestryDepartment. This would need discussion on higher level thanthe Fiji GIS/RS User Group Meeting.
But let�s get back to file transfer. You have noticed that youcan send long messages with your mail system, and you canappend at the end of the message any text file, providing youspecify where the file starts and finishes, something like this:
--------CUT HERE------
<My text File>
--------CUT HERE------
You have also noticed that it is rather difficult to send accentedcharacters with e-mail. With English you don�t really noticethis, but it is sometime surprising what will come out of a sen-tence like this one:
Le courrier éléctronique n�est pas défini pour les caractèresaccentués.
Imagine a Japanese trying to send an E-mail in his own lan-guage.
INTERNET WORLD IS IN 7 BITSWhy all these problems, because in the old times, modemsand communication software was not reliable. You may knowthat computers store information in bytes which are composedof 8 bits (BInary digITS). To code all the Latin alphabet youneed only 7 bits, and as the communications were not verygood between computers, the 8th bit was used to check theaccuracy of the seven others bits (parity bit). We are now witha problem, e-mail send only characters composed with 7 bits,the ASCII table. An ASCII table composed with characterscoded with 8 bits is actually called Extended ASCII.
LET�S CODEPeople overcame this problem by creating software that wouldtransform a binary file (characters of 8 bytes) into an ASCIIfile (characters of 7 bits). The first one to have been created isUUencode/UUdecode (UU for Unix to Unix. Well, allINTERNET has been created on Unix computers!). This pro-duces files that you will paste into your message like this:
This message has been UUencoded:
------CUT HERE------
AdGhjyyuyurYHntnyHYujymBGNbg65uTHtgh*I7ujrGWgt6y7uyj
RTY$&u5yujrgnrht7uyhGEYj5y7uiTGErtutuijEGWrfhtyjTJRT
------CUT HERE------
This system is still working today, and you can findUUencode and UUdecode on all platforms: Unix, Vax, PC,Mac. The disadvantage is the coded message doesn�t con-tain information about the name of the file and which kindof file it is (sound, wordprocessor, image or whatever).
A second system was created on Macintoshes, calledBINHEX, this system doesn�t contain the disadvantages ofUUencode as it stores file information with the coded file.Unfortunately this system has been mostly developed forMacintosh, even if you do find some BINHEX convertersfor PC and Unix.
The third system is becoming the standard. It is called MIME(Multipurpose Internet Mail Extensions). Any softwareMIME compliant is able, with the use of a table of corre-spondence, to decode any coded file and to play it with theright software. This is very useful as, everything is auto-matic, and platform independent. Unfortunately the speci-fication of MIME implies that it is the mail software ratherthan an external utility which should decode and executethe file (for instance a sound file where I say �Hello!�).
WHAT TO USE AND WHEN? UUencode/ BinHex/ MimeUUdecode is the de-facto standard as anybody on any plat-form is able to retrieve a binary file. MIME is becoming thestandard as it is much more user-friendly. If you have tosend a binary file, and you don�t know the mail capabilitiesof the recipient, always send the file as UUencoded. Whenyou press the attach button or send file in your mail soft-ware be aware in which format the e-mail software will sendit: UUencode, BINHEX, MIME.
GREAT OPPORTUNITIESExchanging files inside an e-mail opens you the possibilityof doing some FTP (File Transfer Protocol) without FTP,doing some WWW (World Wide Web) without WWW. Howcome? Well, you have to go through a mail server. A mailserver is a software, when it receives a message in a definedmailbox, will interpret the message as a list of commands.For instance send a message with no subject containing onlyHELP to [email protected]. The message you willbe returned will explain how to receive files stored in thismail server. I�m sure you will find some other addresses toplay with.
In fact [email protected] contains a comprehensivedirectory of available mailing lists, and other mail servers,several are related to GIS and RS.
Oh! I�ve forgotten! Most of the users who have only e-maildo not like to receive big files without their request. Theyoften pay by the kbyte received!
Now you can ask those who offer such a service to sendyou the latest satellite image of your home........c
1 010
n by Wolf Forstreuter, MSD-Forestry
Benefits of Raster Data BasedGIS Systems for Forest Mapping
at 1:50 000 ScaleMost GIS systems in the South Pacific Island Countries arevector data based such as MapInfo, Micro Station and ARC-INFO. The discussion about advantages or disadvantages ofGIS software often neglects the fact that forest or land useplanning deals with areas and not with linear features. Addi-tionally, planning requires the comparison of different spatialdata sources which makes overlay analysis technique nec-essary. Therefore, a raster data based GIS system such asERDAS is an appropriate tool.
The Accuracy of Raster and Vector Data Based GISIn order to compare the area accuracy at 1:50 000 scale rasterlayer (pixel size 25 x 25 m) with a 1:10 000 vector layer, acoverage of Naboutini plantation in Viti Levu, digitised withARC-INFO, was imported into ERDAS.
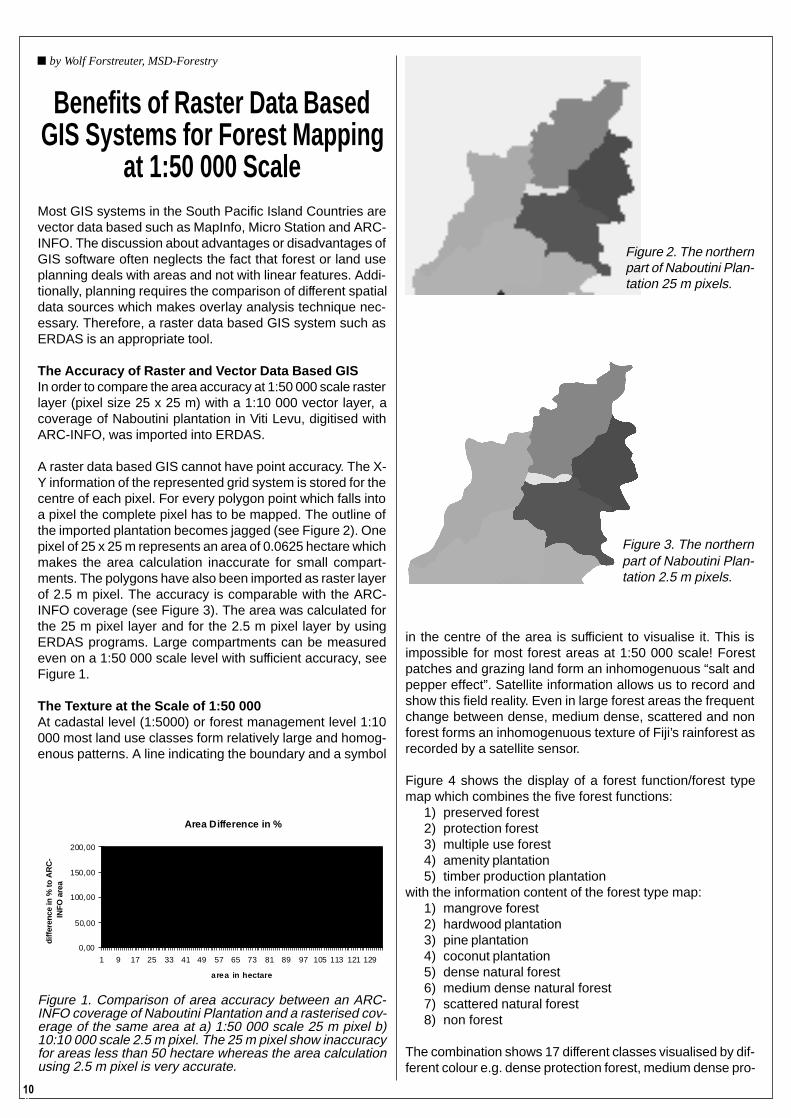
A raster data based GIS cannot have point accuracy. The X-Y information of the represented grid system is stored for thecentre of each pixel. For every polygon point which falls intoa pixel the complete pixel has to be mapped. The outline ofthe imported plantation becomes jagged (see Figure 2). Onepixel of 25 x 25 m represents an area of 0.0625 hectare whichmakes the area calculation inaccurate for small compart-ments. The polygons have also been imported as raster layerof 2.5 m pixel. The accuracy is comparable with the ARC-INFO coverage (see Figure 3). The area was calculated forthe 25 m pixel layer and for the 2.5 m pixel layer by usingERDAS programs. Large compartments can be measuredeven on a 1:50 000 scale level with sufficient accuracy, seeFigure 1.
The Texture at the Scale of 1:50 000At cadastal level (1:5000) or forest management level 1:10000 most land use classes form relatively large and homog-enous patterns. A line indicating the boundary and a symbol
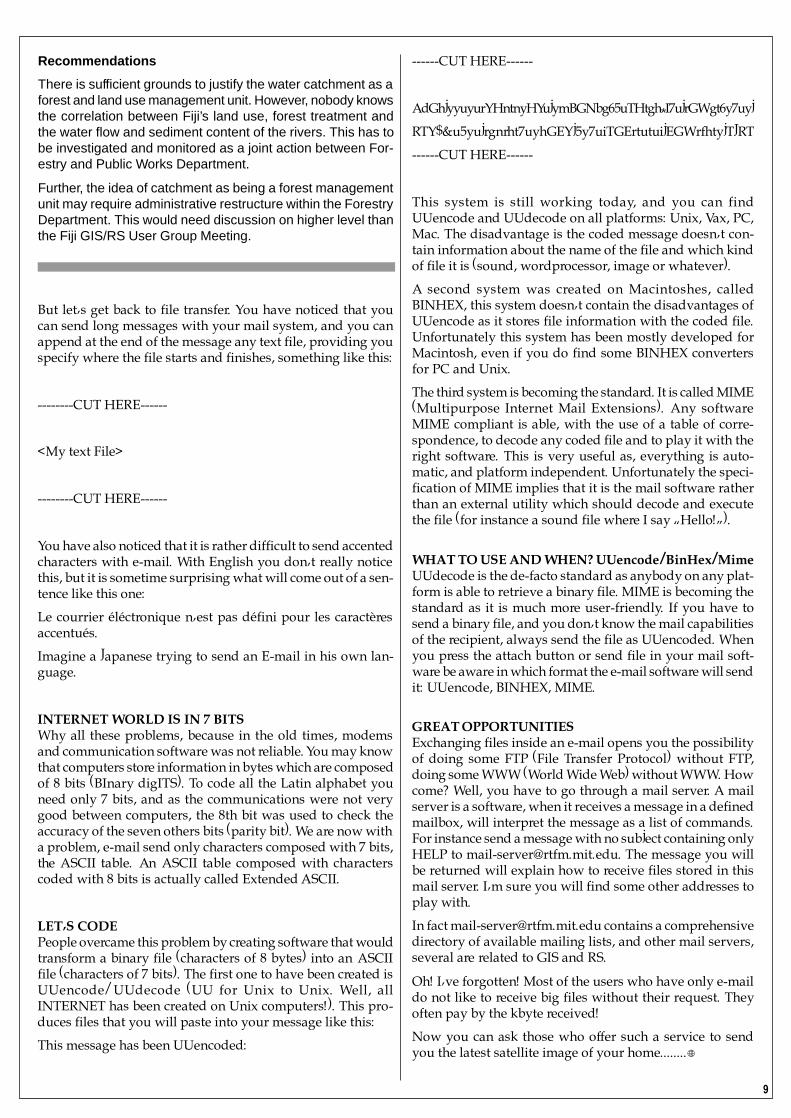
Figure 1. Comparison of area accuracy between an ARC-INFO coverage of Naboutini Plantation and a rasterised cov-erage of the same area at a) 1:50 000 scale 25 m pixel b)10:10 000 scale 2.5 m pixel. The 25 m pixel show inaccuracyfor areas less than 50 hectare whereas the area calculationusing 2.5 m pixel is very accurate.
Area Difference in %
0,00
50,00
100,00
150,00
200,00
1 9 17 25 33 41 49 57 65 73 81 89 97 105 113 121 129
area in hectare
diffe
renc
e in
% to
AR
C-
INFO
are
a
25m pixel
2.5m pixel
Figure 2. The northernpart of Naboutini Plan-tation 25 m pixels.
Figure 3. The northernpart of Naboutini Plan-tation 2.5 m pixels.
in the centre of the area is sufficient to visualise it. This isimpossible for most forest areas at 1:50 000 scale! Forestpatches and grazing land form an inhomogenuous “salt andpepper effect”. Satellite information allows us to record andshow this field reality. Even in large forest areas the frequentchange between dense, medium dense, scattered and nonforest forms an inhomogenuous texture of Fiji’s rainforest asrecorded by a satellite sensor.
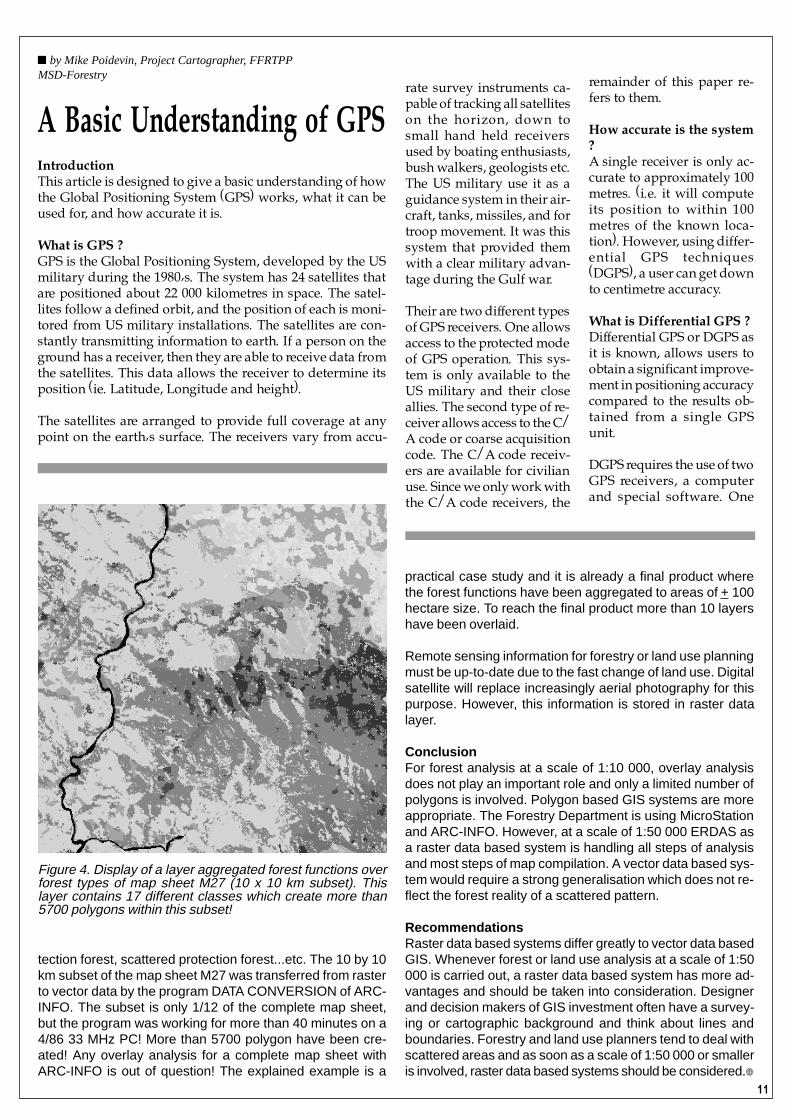
Figure 4 shows the display of a forest function/forest typemap which combines the five forest functions:
1) preserved forest2) protection forest3) multiple use forest4) amenity plantation5) timber production plantation
with the information content of the forest type map:1) mangrove forest2) hardwood plantation3) pine plantation4) coconut plantation5) dense natural forest6) medium dense natural forest7) scattered natural forest8) non forest
The combination shows 17 different classes visualised by dif-ferent colour e.g. dense protection forest, medium dense pro-
11
rate survey instruments ca-pable of tracking all satelliteson the horizon, down tosmall hand held receiversused by boating enthusiasts,bush walkers, geologists etc.The US military use it as aguidance system in their air-craft, tanks, missiles, and fortroop movement. It was thissystem that provided themwith a clear military advan-tage during the Gulf war.
Their are two different typesof GPS receivers. One allowsaccess to the protected modeof GPS operation. This sys-tem is only available to theUS military and their closeallies. The second type of re-ceiver allows access to the C/A code or coarse acquisitioncode. The C/A code receiv-ers are available for civilianuse. Since we only work withthe C/A code receivers, the
remainder of this paper re-fers to them.
How accurate is the system?A single receiver is only ac-curate to approximately 100metres. (i.e. it will computeits position to within 100metres of the known loca-tion). However, using differ-ential GPS techniques(DGPS), a user can get downto centimetre accuracy.
What is Differential GPS ?Differential GPS or DGPS asit is known, allows users toobtain a significant improve-ment in positioning accuracycompared to the results ob-tained from a single GPSunit.
DGPS requires the use of twoGPS receivers, a computerand special software. One
n by Mike Poidevin, Project Cartographer, FFRTPPMSD-Forestry
IntroductionThis article is designed to give a basic understanding of howthe Global Positioning System (GPS) works, what it can beused for, and how accurate it is.
What is GPS ?GPS is the Global Positioning System, developed by the USmilitary during the 1980�s. The system has 24 satellites thatare positioned about 22 000 kilometres in space. The satel-lites follow a defined orbit, and the position of each is moni-tored from US military installations. The satellites are con-stantly transmitting information to earth. If a person on theground has a receiver, then they are able to receive data fromthe satellites. This data allows the receiver to determine itsposition (ie. Latitude, Longitude and height).
The satellites are arranged to provide full coverage at anypoint on the earth�s surface. The receivers vary from accu-
A Basic Understanding of GPS
Figure 4. Display of a layer aggregated forest functions overforest types of map sheet M27 (10 x 10 km subset). Thislayer contains 17 different classes which create more than5700 polygons within this subset!
tection forest, scattered protection forest...etc. The 10 by 10km subset of the map sheet M27 was transferred from rasterto vector data by the program DATA CONVERSION of ARC-INFO. The subset is only 1/12 of the complete map sheet,but the program was working for more than 40 minutes on a4/86 33 MHz PC! More than 5700 polygon have been cre-ated! Any overlay analysis for a complete map sheet withARC-INFO is out of question! The explained example is a
practical case study and it is already a final product wherethe forest functions have been aggregated to areas of + 100hectare size. To reach the final product more than 10 layershave been overlaid.
Remote sensing information for forestry or land use planningmust be up-to-date due to the fast change of land use. Digitalsatellite will replace increasingly aerial photography for thispurpose. However, this information is stored in raster datalayer.
ConclusionFor forest analysis at a scale of 1:10 000, overlay analysisdoes not play an important role and only a limited number ofpolygons is involved. Polygon based GIS systems are moreappropriate. The Forestry Department is using MicroStationand ARC-INFO. However, at a scale of 1:50 000 ERDAS asa raster data based system is handling all steps of analysisand most steps of map compilation. A vector data based sys-tem would require a strong generalisation which does not re-flect the forest reality of a scattered pattern.
RecommendationsRaster data based systems differ greatly to vector data basedGIS. Whenever forest or land use analysis at a scale of 1:50000 is carried out, a raster data based system has more ad-vantages and should be taken into consideration. Designerand decision makers of GIS investment often have a survey-ing or cartographic background and think about lines andboundaries. Forestry and land use planners tend to deal withscattered areas and as soon as a scale of 1:50 000 or smalleris involved, raster data based systems should be considered.c

1 212
receiver is set over an accurately surveyed control point, andis often referred to as the master or base station. The otherunit is then free to roam in the field. This unit is often re-ferred to as the rover unit.
The following is a very crude description of how the princi-ple of DGPS works. The base station is continually comput-ing its position at approximately 1 second intervals. At time(t1) it computes the following position C_lat, C_lon, C_hgt .Since the base station co-ordinates are known, a differencewill apply.
Time t1 C_lat C_lon C_hgtKnown Co-ords K_lat K_lon K_hgtDifference D_lat D_lon D_hgt
In the field, the rover unit computes its position at the sametime t1. If we add the differences computed at the base sta-tion, then we significantly improve the accuracy of the roverposition.
Of course, we need a computer to do DGPS. The software isalso much more sophisticated than the block shift principledescribed above.
What Co-ordinate System is used by the GPS system ?The GPS system uses the World Geodetic System 1984, com-monly referred to as WGS-84. This is a Geocentric Datum,adopted for use by the US military. In order to work in other
co-ordinate systems, trans-formations have to be doneby the user. For example,here in Fiji we use the FijiMap Grid (FMG), which isbased on the WGS-72 sphe-roid definition. At Forestry, aset of seven transformationparameters have been com-puted from data supplied bythe Fiji Dept. of Lands. Theseparameters are used withinForestry to directly computetransformations from WGS-84 co-ordinates directly toFMG. Again, all of this istransparent to the user, as thecomputer automatically pro-duces the desired co-ordi-nates.
It is most important that the
user takes great care in select-ing the transformation pa-rameters to be used, and thatthey are checked for the suit-ability of the work to be per-formed. For example, in For-estry, the parameters usedare suited to the accuracy ofthe work we perform. TheDept. of Lands would useentirely different parametersfor their geodetic control net-work. Likewise, if you areusing GPS to do control sur-veys for boundary surveys,or other accurate positionalwork, you will need to deriveyour own parameters. Un-fortunately, for accurate GPSwork, a uniform set of trans-formation parameters cannotbe used in Fiji.c
n by Donald L Forbes, SOPAC
COASTAL FORESTS ANDSHORELINES
IN THE SOUTH PACIFICIntroductionTropical island shores havea number of distinctive attrib-utes that call for special at-tention in drawing up coastalmanagement and protectionstrategies for the south andcentral Pacific. These includecarbonate reefs that functionboth as primary coastal pro-tection structures and as prin-cipal sources of beach sandin many situations. Extensivecoastal mangrove stands arealso important in some areas.Coastal stability may be ad-versely affected by manage-ment practices such as clear-cut logging, which may leadto increased sedimentationon fringing reefs, or removal
of mangroves, which mayresult in shoreline erosion.Nearshore circulation andcoastal sedimentation proc-esses may also be relevantto mangrove rehabilitation orplanting programs.
The South Pacific AppliedGeoscience Commission[SOPAC]SOPAC has an active workprogram on coastal erosionandsedimentation processesin many of the island mem-ber states. Work is carriedout in response to specificrequests for advice, usuallywhere problems have arisenin relation to storm damage,infrastructure loss, adverse
management practices, orproposed developments withanticipated impact on thecoastal system. Other issuesinclude beach mining, reefblasting, mangrove destruc-tion, marine aggregate ex-traction, shore protection,and harbour development,as well as more generalquestions of shore stability inrelation to wave exposure,sediment budgets, sea-levelrise, and other environmen-tal factors. The remote sens-ing and GIS activities ofSOPAC focus on applica-tions in the areas of geologi-cal hazards (such as vol-canic eruptions, earth-quakes, tsunamis, cyclonesand shore damage) andmapping requirements for allaspects of the work pro-gram.
Forestry and the coastExcept in the matter of man-grove habitat, the link be-tween forestry and coastalenvironments has receivedlimited attention in the SouthPacific. In other jurisdictions(e.g. western Canada), thereis a history of co-ordinationto address issues such asdegradation of salmon habi-tat due to sedimentation
from clear-cut logging onsteep slopes, while else-where (particularly in Europe)the conservation ofbackshore vegetation (in-cluding woodland) is recog-nised as a fundamental issuein coastal dune stabilisation.
In the South Pacific, we canidentify several areas of com-mon interest between coastalgeoscience and forestry.These fall into two catego-ries:
n natural systems issues• reef conservation (in-
cluding sedimentationimpacts)
• backshore vegetationfor dune and shorelinestabilisation
• mangrove habitat andconservation
n methodological and ca-pacity-building issues
• geodesy, positioning,and mapping
• remote sensing (aerialphotography and satel-lite imagery)
• image processing andGIS for shoreline andforest-cover changedetection
Several examples of natural

13
system interactions can becited from various parts of theSouth Pacific region. Reefsrepresent the primary coastalprotection structures on tropi-cal island coasts and anythreat to their integrity (includ-ing sedimentation resultingfrom logging-induced ero-sion) is a concern. Vegetationremoval has been identifiedas a contributing factor inaccelerated shoreline ero-sion at some sites and man-grove is recognised as an ef-fective sediment stabiliserand shoreline buffer, removalof which can lead to erosionproblems where none existedbefore.
Collaboration betweenSOPAC and ManagementServices Division of Fiji For-estry has highlighted anumber of areas of commonground in the fields of posi-tioning, remote sensing, andimage processing. Satelliteimage processing for man-grove detection requires datain the infrared part of thespectrum, available fromLandsat but not from SPOT.Coastal erosion and sedi-mentation can be monitored
using high-resolution SPOTimagery in areas of rapidchange, where sub-pixelresolution can be achieved byaveraging techniques. How-ever, most applications in theSouth Pacific require large-scale aerial photography (e.g.Gillie, 1993; Forbes & Hosoi,1995).
ReferencesForbes, D.L. & Hosoi, Y. 1995.
Coastal erosion in SouthTarawa, Kiribati: report of mis-sion to determine shorelinerecession rates at TungaruCentral Hospital & KingGeorge V/ Elaine BernacchiSchool, erosion & sedimenta-tion along the Nippon Cause-way & coastal protection strat-egies in Kiribati, June-July1995. SOPAC Technical Re-port 225, 77 p. & 5 appendi-ces.
Gillie, R.D. 1993. Historicalchanges of shoreline accre-tion and erosion, Betio Islet,South Tarawa, Kiribati.SOPAC Technical Report 179,22 p. & map.
SOPAC (South Pacific AppliedGeoscience Commission).1995. Medium term plan:1995 1999. SOPAC Miscella-neous Report 188, 24 p. & 2appendices.c
n by Joe Wakolo, MSD-Forestry
Visual Forest Change Detectionwith ERDAS Imagine
IntroductionThe significance of tropical forest vegetation in South PacificIsland countries is increasingly recognised due to their func-tions as stabilisers and regulators of micro and macro cli-mates, soil fertility and water conservation, and as produc-ers of various raw materials. The situation has to be moni-tored even with limited forest personnel.
Forest Change Detection is a process of reviewing forest ar-eas over a period of time to check for changes whether in-crease or decrease in the extent of forest cover. Satellite re-mote sensing and GIS techniques can contribute to a greatextent to an appropriate management of the tropical envi-ronment. Satellite data is much cheaper per unit area and isreadily available when compared with aerial photography.
GTZ (German Aid) contributed favourably by providing
funding for the purchase of SPOT data to continue forestmonitoring.
Method of ComparisonThe Management Services Division started to compare theforest cover mapped with Landsat TM data recorded in 1991,with recent SPOT recorded in June 1995. The scenes weregeometrically corrected to the 1:50 000 map sheets O28, O29and O23 and cut to map sheet size. The areas are consideredideal for a tropical environment because various types ofvegetation occur within these areas. The approximate area ofeach sheet is 120 000 hectares.
Prior to visual interpretation SPOT data was enhanced toimprove interpretability and two enhancement techniqueswere applied which consisted of:� simple contrast
n by Leslie Allinson, SOPAC
PEACESAT AT SOPACPACIFIC ISLANDS RESOURCE AND
ENVIRONMENT INFORMATION (PIREIS)
On Friday 22 September 1995 at 10:30 am, voice communications wasfirst established between SOPAC and PEACESAT Headquarters, Hono-lulu, using the newly acquired 3 metre dish ground station. This initialvoice exchange was the beginning of a new communications link betweenSecretariat and the member countries and the commencement of an in-novative service (PIREIS) which will provide a gateway to wider and emerg-ing communications options.
The equipment to realise this goal was provided under the generous sup-port of the United States Department of State through assistance from theBureau of Oceans and International and Scientific Affairs.
What is PEACESAT ?The Pan-Pacific Education and Communications Experiments by Satel-lite (PEACESAT) program was initiated in 1971 to experiment with dis-tance learning, emergency information, and teleconferencing applicationsthrough the use of a single push-to-talk voice communication using theATS-1 satellite by sites in the Pacific. In 1985, the PEACESAT programbecame temporarily limited when the ATS-1 satellite station keeping fuelbecame exhausted and could no longer support the needs of its users.
The PEACESAT program was re-established in 1989 through the use ofthe National Oceanic and Atmospheric Administration�s (NOAA) GOES-3satellite and sponsored by the U.S. Congress and the Department of Com-merce�s National Telecommunications and Information Administration(NTIA),. Since the formal opening in 1992, the PEACESAT regional tel-ecommunications alliance has grown to more than 40 sites in 25 coun-tries.
PEACESAT is a successful non-commercial communications service anddue to increasing demand for additional sites has formulated a Site Im-provement Plan which was first presented in 1994 and which will replacethe existing mesh network analogue network with digital to provide moreeffective use of the satellite bandwidth.

1 414
Figure 1. Monitor display of forest cover file (left) mapped with Landsat TM data recorded 1991 anddisplay of SPOT image (right) recorded 1995, both for a part of map sheet O23 Rukuruku Bay (VanuaLevu). The cursor is moving simultaneously in both parts of the display. ERDAS Imagine allows sucha link of two geo-referenced files.
� histogram contrastThe degree of contrast wasdone on a trial and error ba-sis until the desired contrastwas achieved.
ERDAS imagine provides thedisplay of two geocoded filesin two windows on onescreen and the program dis-plays the cursor simultane-ously on the same location oneither window. This enablesthe visual comparison of the
two areas using the cursor.Even small areas can be visu-ally compared. (see Figure 1).
ResultsOn map sheet 023(Rukuruku Bay) in VanuaLevu an area of approxi-mately 4 hectares was foundto have been clear felledsince the 1991 map. On mapsheet O28 (Nausori) an areaof approximately 8 hectaresof additional forest was de-
tected. The spectral signa-tures seem to indicate thatthis area is invaded by Afri-can Tulips an introduced andvery fast growing species(see article by OseaTuinivanua, Newsletter 8September 1994 and News-letter 10 February 1995).Field checks have to confirmthe situation. In general therewas not much change de-tected in the three mapsheets.
The method using SPOT dataand visual comparison con-centrated on the change fromforest to non forest and viceversa. The area estimationcould be improved by apply-ing ratio images, which canbe overlayed directly on theforest cover map producedwith Landsat TM data. How-ever, most logging does notremove the forest canopycompletely. To notice achange from dense to scat-tered or even to mediumdense forest other techniqueshave to be adopted. Further,it is not sure if SPOT data issufficient for such a job be-cause of its limited infraredinformation.
RecommendationsSatellite data is an appropri-ate tool for forest coverchange detection. However,this data is still too expensiveto be used by the ForestryDepartment alone. Other de-partments such as Agricul-ture or Environment shoulduse the same data, whichneeds further image analysisfacilities as well as an agree-ment of data sharing with thesatellite data selling compa-nies. Further, transportableground receiving stationbased regularly in Fiji wouldprovide additional data.c
The new services will include theupgrade of existing 3 metre termi-nals and the deployment of eight 6metre Hub sites throughout the Pa-cific which will have sufficient band-width to serve as concentrators for3 metre terminals and provide mul-tiple voice and data channels plusvideo conferencing facilities.
Why did SOPAC identifyPEACESAT ?SOPAC has been fully aware of thebenefits for the region through theuse of PEACESAT by the ForumFisheries Agency which is the re-gional organisation most closelyaligned with SOPAC�s work pro-gram.
ment A which lists terminals bycountry where the most likely ac-cess sites are identified.
FFA has been using PEACESAT asa communications backbone to pro-gressively provide Internet e-mail toits member countries throughMicrosoft Mail and has encouragedthe use of the in-country post-of-fices by a wider user base provi-sional to endorsement by the na-tional site. There will however becountries who will use SOPAC asthe prime access point to Internete-mail and there will naturally be areciprocal arrangement for e-mailrouting.
It should be noted that FFA batchesits Internet e-mail traffic via
FFA identified PEACESAT as anappropriate regional communica-tions network in the mid 1980s andthrough a European Union funded5 year project implemented theSouth Pacific Regional Tuna Fish-eries Management InformationService. This pioneer service wasachieved through the installation of14 PEACESAT terminals in FFA�smember countries and the projectwas completed in 1993. The serv-ice which is now called FFANet hasprovided communications accessfor the majority of the Pacific IslandCountries who have greatly ben-efited from this initiative.
FFANet has provided PEACESATterminals in all of the Pacific Islandmember countries of SOPAC andin several countries the terminal islocated at the government sectorwhich SOPAC serves. See Attach-

15
LIST OF PEACESAT STATIONS BY COUNTRY1
Site 2 Terminals Institution Country
Pago Pago 1 American Samoa Community College American Samoa
Radio Australia 1 Radio Australia, Melbourne Australia
Cook Islands Fisheries 1 Ministry of Marine Resources Cook Islands
Rarotonga 1 Department of Education Cook Islands
Chuuk 1 Department of Education Federated States of Micronesia
Kosrae 1 Department of Education Federated States of Micronesia
Pohnpei CCM 1 Community College of Micronesia Federated States of Micronesia
Pohnpei MMA 1 Micronesian Maritime Authority Federated States of Micronesia
Yap 1 Department of Education Federated States of Micronesia
Fiji Fisheries 1 Fisheries Division Fiji
SOPAC Suva 1 South Pacific Applied Geoscience Commission Fiji
SPC Suva 1 South Pacific Commission Fiji
Guam 2 University of Guam Guam
Kiribati Fisheries 1 Fisheries Department Kiribati
Majuro 1 College of the Marshall Islands Marshall Islands
Majuro Fisheries 1 Fisheries Department Marshall Islands
Nauru Fisheries 1 Fisheries Department Nauru
SPC Noumea 1 South Pacific Commission New Caledonia
MAS Wellington 1 Marine Air Systems New Zealand
Wellington Poly 1 Wellington Polytechnic New Zealand
Niue 1 Department of Agriculture Forests and Fisheries Niue
Rota NMC 1 Northern Marianas College Northern Mariana Islands
Saipan NMC 1 Northern Marianas College Northern Mariana Islands
Saipan PSS 1 Public School System Northern Mariana Islands
Palau Education 1 Department of Education Palau
Palau Fisheries 1 Fisheries Department Palau
PNG Fisheries 1 Department of Fisheries Papua New Guinea
Unitech 1 University of Technology (Lae) Papua New Guinea
Honiara 2 Forum Fisheries Agency Solomon Islands
Tonga Education 1 Department of Education Tonga
Tonga Fisheries 1 Department of Fisheries Tonga
Tuvalu 1 Fisheries Department Tuvalu
Kokee Park 1 GOES-3 Telemetry Station, Hawaii United States of America
Anderson Valley 1 AV Agriculture Institute, CA United States of America
Honolulu 2 University of Hawaii at Manoa (Oahu) United States of America
UH Hilo 1 University of Hawaii at Hilo (Hawaii) United States of America
Port Vila Fisheries 1 Fisheries Department Vanuatu
Alafua 1 University of the South Pacific Western Samoa
Apia Fisheries 1 Department of Fisheries Western Samoa
Malifa 1 National University of Samoa Western Samoa
43 3
1 The list is based on data provided by PEACSAT Headquarters in 1994 and the addition of the SOPAC site. There may have beenother sites added during the past twelve months.
2 Site and Station are used interchangeably.3 Total number of terminals where some stations have multiple terminals but same identifier.

1 616
FIJI User Group, GIS & Remote Sensing NewsNumber 12 (9503), November 1995
SEND TO:
PEACESAT HQ, Honolulu, every night whileSOPAC uses the USP gateway.
The forthcoming digital services are the logicalsuccessor to the existing analogue system andSOPAC specified a digital upgrade to the nor-mal 3 metre terminal when identifying the equip-ment.
The above led SOPAC to develop the PacificIslands Resource and Environment InformationService which uses PEACESAT as the commu-nications vehicle.
Will there be a PEACESAT Hub Site in Fiji ?In February 1995, SOPAC submitted a joint ap-plication with the SPC Suva to reserve one ofthe eight hub sites for Fiji. The application wasapproved by the PEACESAT committee and itshould be noted that only two countries outsideof the ex-US Trust Territories received approvalwhere the other was Solomon Islands with anapplication submitted by FFA. SPC Suva hasrequested to be the host site for the FijiPEACESAT Hub and has committed funding forthe position of manager. This Hub will serve theneeds of the wider community of international,regional and NGOs located in Fiji and will pro-vide a valuable service for this country. For fur-ther information see Proposal to Become aPEACESAT Hub Site, SOPAC MiscellaneousReport 189.
What will SOPAC use PIREIS for ?PIREIS will provide formal distance educationin the Earth Sciences, Water & Sanitation, Dis-aster Mitigation programs and assistance withthe fellowship programs and other training ar-eas such as Offshore, Coastal, Mapping, Miner-als and Hydrocarbons as well as core units suchas Cartography and Information Technology.
While training will be a major component ofPIERIS, access to the Regional Data Centre, dis-
tribution of data, support for GIS and RemoteSensing users as well as IT development andmanagement will be a focus for the service.
Another goal is the provision of Internet e-mailto the island countries which must be realisedwithin the next twelve months and will beachieved though close co-operation with otherregional organisations.
PEACESAT sites are committed to provide voiceand data services to community groups andSOPAC has already received enquiries from eli-gible organisations for regional communications.
Finally, as has occurred in the past, PEACESATmay be one of the few if not the only interna-tional communications link for an island countryfollowing a natural disaster and every site is com-mitted to this public service.
SummaryThe PEACESAT service provides voice and datacommunications for non-commercial use and is
an ideal communications tool for the governmentsectors of the Pacific Island countries where rela-tively small international traffic has led to hightariff costs depriving those countries from ac-cess to information services essential for re-source management.
PIREIS will address this need and will providean Internet gateway, conferencing and generalvoice communications facility, distance educa-tion service, possible alternative communicationsroute in case of natural disaster as well as rou-tine data transfer.
SOPAC acknowledges the valuable assistanceby the Bureau of Oceans and International andScientific Affairs in securing the necessary fund-ing from the United States Department of Stateto realise this communications service.c
Requests for inclusion in the mailing list forthis newsletter as well as the submission ofarticles for publication should be sent to:
GIS AND REMOTE SENSING NEWSSOPAC, PRIVATE MAIL BAG, GPOSUVA, FIJIAttention: Les Allinson
Tel: 381377Fax:370040E-mail: [email protected]
or
MANAGEMENT SERVICES DIVISIONFORESTRY DEPARTMENTPO BOX 3890, SAMABULASUVA, FIJIAttention: Wolf Forstreuter
Tel: 322635Fax: 320311E-mail: [email protected]
It would be appreciated if contributions couldbe sent on floppy disk in Word for Windows(preferred), Wordperfect for Windows orWordperfect for DOS format.c