newmark merrill · 2000 average household size 3.80 3.56 3.38 2010 households 9,730 61,668 186,029...
TRANSCRIPT
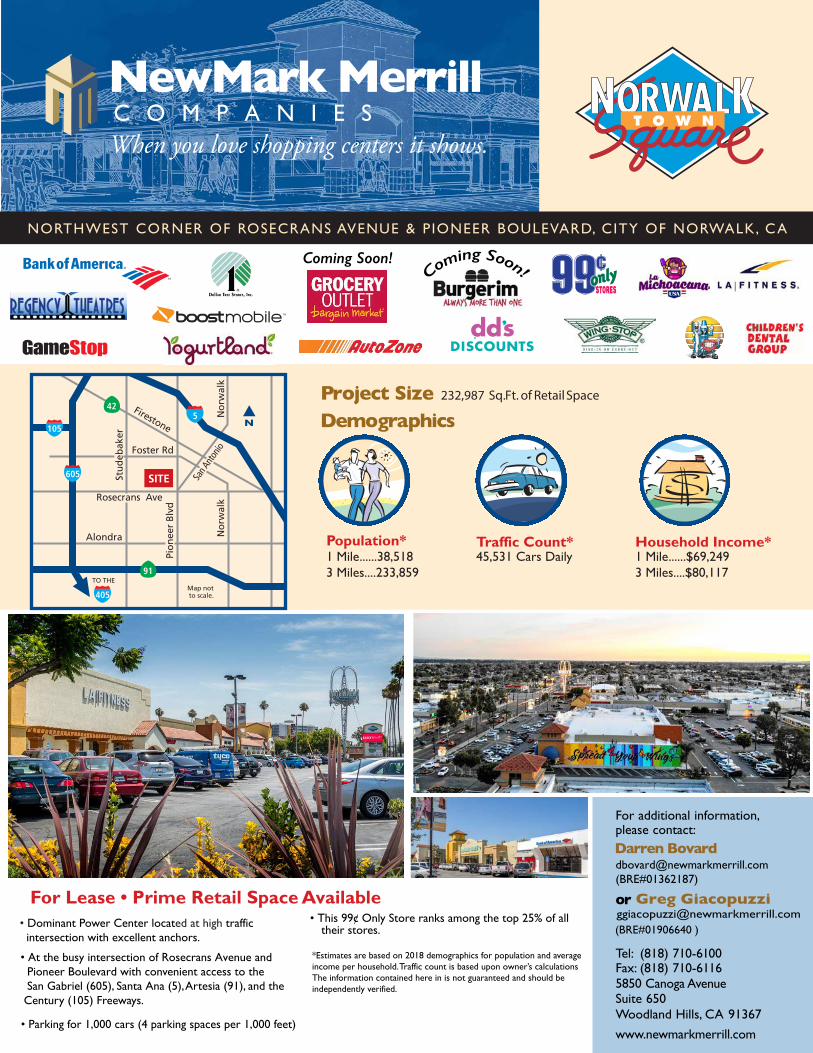
DemographicsProject Size 232,987 Sq. Ft. of Retail Space
• At the busy intersection of Rosecrans Avenue and Pioneer Boulevard with convenient access to the San Gabriel (605), Santa Ana (5), Artesia (91), and the Century (105) Freeways.
• Parking for 1,000 cars (4 parking spaces per 1,000 feet)
• This 99¢ Only Store ranks among the top 25% of all their stores.
NORTHWEST CORNER OF ROSECRANS AVENUE & P IONEER BOULEVARD, CITY OF NORWALK , CA
For Lease • Prime Retail Space Available
1 Mile......38,5183 Miles....233,859
1 Mile......$69,2493 Miles....$80,117
Household Income*Traffic Count*Population*45,531 Cars Daily
*Estimates are based on 2018 demographics for population and averageincome per household. Traffic count is based upon owner’s calculationsThe information contained here in is not guaranteed and should be independently verified.
For additional information,please contact:Darren [email protected](BRE#01362187)
or
Tel: (818) 710-6100Fax: (818) 710-61165850 Canoga AvenueSuite 650Woodland Hills, CA 91367
www.newmarkmerrill.com
Greg Giacopuzzi
(BRE#01906640 )[email protected]
• Dominant Power Center located at high traffic intersection with excellent anchors.
NewMark MerrillC O M P A N I E SWhen you love shopping centers it shows.
Coming Soon!
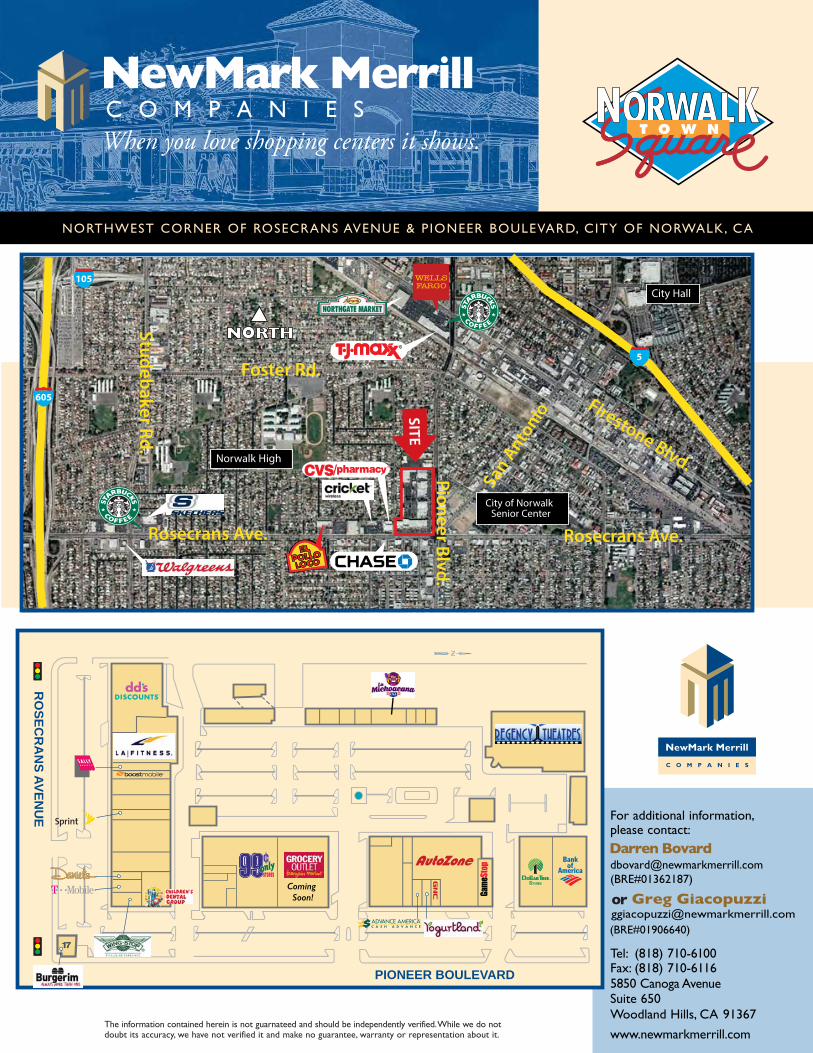
NORTHWEST CORNER OF ROSECRANS AVENUE & PIONEER BOULEVARD, CITY OF NORWALK, CA
The information contained herein is not guarnateed and should be independently verified.While we do notdoubt its accuracy, we have not verified it and make no guarantee, warranty or representation about it.
Fashion Ave.
For additional information,please contact:Darren [email protected](BRE#01362187)
or
Tel: (818) 710-6100Fax: (818) 710-61165850 Canoga AvenueSuite 650Woodland Hills, CA 91367
www.newmarkmerrill.com
Greg Giacopuzzi
(BRE#01906640)[email protected]
NewMark MerrillC O M P A N I E SWhen you love shopping centers it shows.
PIONEER BOULEVARD
RO
SECR
AN
S AVENU
E
Pio
ne
er
City Hall
Norwalk High
City of NorwalkSenior Center
9 1 FW Y
San A
ntonio
605
105
5
Studebaker Rd.
Rosecrans Ave. Rosecrans Ave.
Pioneer Blvd.
Firestone Blvd.
Foster Rd.
Coming Soon!
Landlord makes no representation that any of the above tenants or building configurations will exist now or in the future.Tenants depicted may be proposed and may not actually occupy the proposed buildings. The dimensions and square footages shownare estimates only and not guaranteed.
RO
SECR
AN
S AVENU
E
PIONEER BOULEVARD
For Information, Please ContactDarren Bovard (BRE#01362187)
Greg Giacopuzzi (BRE#01906640)NewMark Merrill Companies
Tel: 818.710.6100 Fax: 818.710.6116
K
44
Patio
42
32
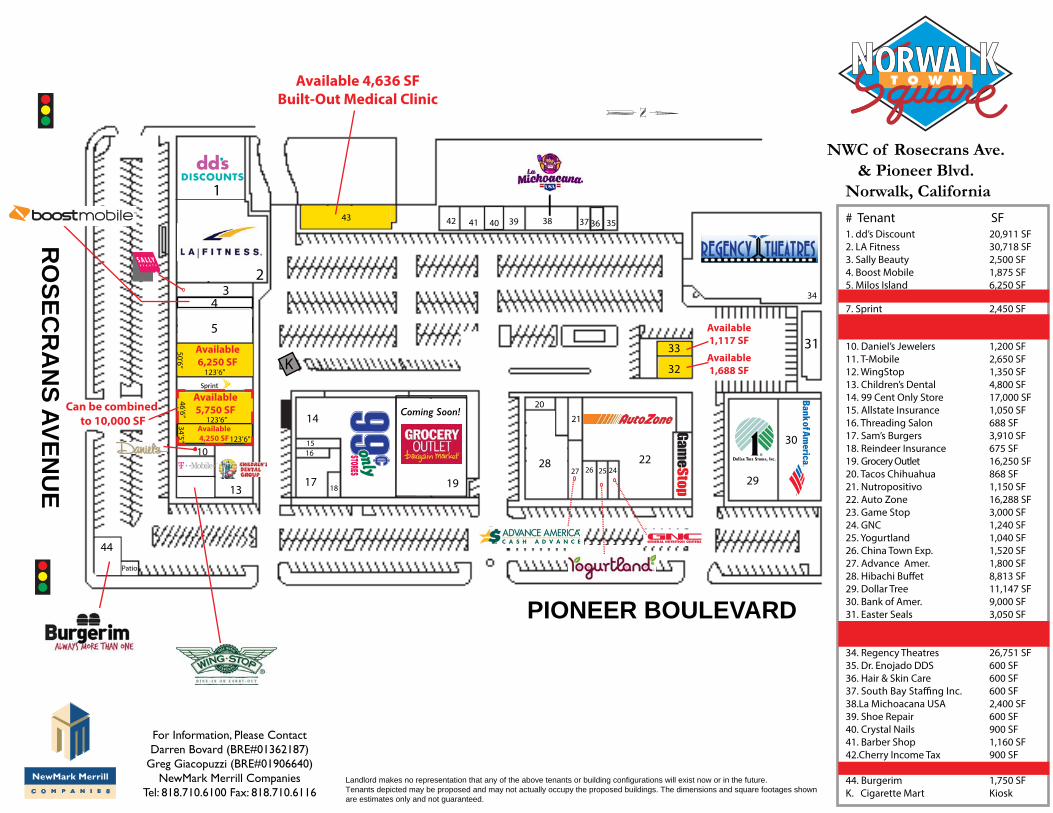
NWC of Rosecrans Ave. & Pioneer Blvd.
Norwalk, California
# Tenant SF1. dd’s Discount 20,911 SF2. LA Fitness 30,718 SF 3. Sally Beauty 2,500 SF4. Boost Mobile 1,875 SF5. Milos Island 6,250 SF6. Available 6,250 SF 7. Sprint 2,450 SF8. Available 5,750 SF9. Available 4,250 SF10. Daniel’s Jewelers 1,200 SF11. T-Mobile 2,650 SF12. WingStop 1,350 SF13. Children’s Dental 4,800 SF14. 99 Cent Only Store 17,000 SF15. Allstate Insurance 1,050 SF 16. Threading Salon 688 SF17. Sam’s Burgers 3,910 SF18. Reindeer Insurance 675 SF19. Grocery Outlet 16,250 SF20. Tacos Chihuahua 868 SF21. Nutropositivo 1,150 SF22. Auto Zone 16,288 SF23. Game Stop 3,000 SF24. GNC 1,240 SF25. Yogurtland 1,040 SF26. China Town Exp. 1,520 SF27. Advance Amer. 1,800 SF
29. Dollar Tree 11,147 SF30. Bank of Amer. 9,000 SF 31. Easter Seals 3,050 SF32. Available 1,688 SF 33. Available 1,117 SF34. Regency Theatres 26,751 SF35. Dr. Enojado DDS 600 SF36. Hair & Skin Care 600 SF37. South Bay Sta�ng Inc. 600 SF 38.La Michoacana USA 2,400 SF 39. Shoe Repair 600 SF40. Crystal Nails 900 SF41. Barber Shop 1,160 SF42.Cherry Income Tax 900 SF 43. Built-Out Medical Clinic 4,636 SF44. Burgerim 1,750 SFK. Cigarette Mart Kiosk
33
Available1,117 SF
Available1,688 SF
Available 4,636 SFBuilt-Out Medical Clinic
Available6,250 SF
Available5,750 SF
Available4,250 SF
Can be combined to 10,000 SF
Coming Soon!
50’6”
123’6”
123’6”
123’6”
46’6”34’5”
1
23
10
13
14
1516
1718 19
20
28
21
2224252627
29
30
31
3536373839404143
4
5
34
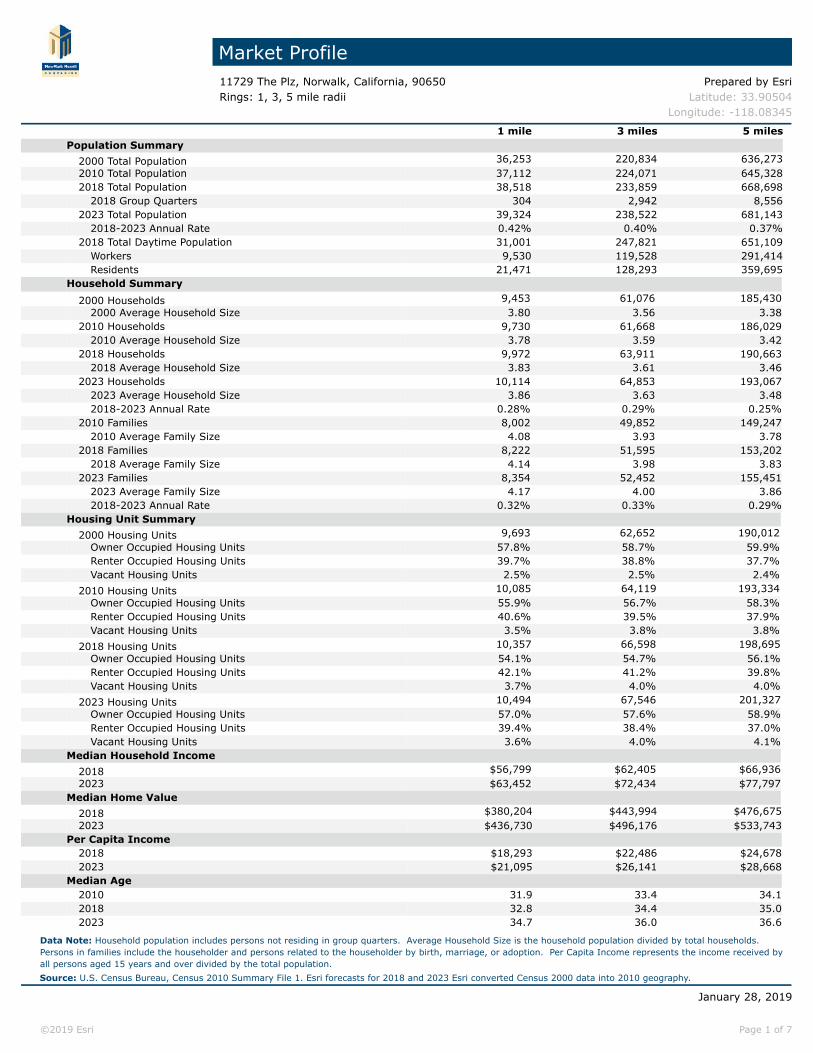
Market Profile11729 The Plz, Norwalk, California, 90650 Prepared by EsriRings: 1, 3, 5 mile radii Latitude: 33.90504
Longitude: -118.08345
1 mile 3 miles 5 milesPopulation Summary
2000 Total Population 36,253 220,834 636,2732010 Total Population 37,112 224,071 645,3282018 Total Population 38,518 233,859 668,698
2018 Group Quarters 304 2,942 8,5562023 Total Population 39,324 238,522 681,143
2018-2023 Annual Rate 0.42% 0.40% 0.37%2018 Total Daytime Population 31,001 247,821 651,109
Workers 9,530 119,528 291,414Residents 21,471 128,293 359,695
Household Summary2000 Households 9,453 61,076 185,430
2000 Average Household Size 3.80 3.56 3.382010 Households 9,730 61,668 186,029
2010 Average Household Size 3.78 3.59 3.422018 Households 9,972 63,911 190,663
2018 Average Household Size 3.83 3.61 3.462023 Households 10,114 64,853 193,067
2023 Average Household Size 3.86 3.63 3.482018-2023 Annual Rate 0.28% 0.29% 0.25%
2010 Families 8,002 49,852 149,2472010 Average Family Size 4.08 3.93 3.78
2018 Families 8,222 51,595 153,2022018 Average Family Size 4.14 3.98 3.83
2023 Families 8,354 52,452 155,4512023 Average Family Size 4.17 4.00 3.862018-2023 Annual Rate 0.32% 0.33% 0.29%
Housing Unit Summary2000 Housing Units 9,693 62,652 190,012
Owner Occupied Housing Units 57.8% 58.7% 59.9%Renter Occupied Housing Units 39.7% 38.8% 37.7%Vacant Housing Units 2.5% 2.5% 2.4%
2010 Housing Units 10,085 64,119 193,334Owner Occupied Housing Units 55.9% 56.7% 58.3%Renter Occupied Housing Units 40.6% 39.5% 37.9%Vacant Housing Units 3.5% 3.8% 3.8%
2018 Housing Units 10,357 66,598 198,695Owner Occupied Housing Units 54.1% 54.7% 56.1%Renter Occupied Housing Units 42.1% 41.2% 39.8%Vacant Housing Units 3.7% 4.0% 4.0%
2023 Housing Units 10,494 67,546 201,327Owner Occupied Housing Units 57.0% 57.6% 58.9%Renter Occupied Housing Units 39.4% 38.4% 37.0%Vacant Housing Units 3.6% 4.0% 4.1%
Median Household Income2018 $56,799 $62,405 $66,9362023 $63,452 $72,434 $77,797
Median Home Value2018 $380,204 $443,994 $476,6752023 $436,730 $496,176 $533,743
Per Capita Income2018 $18,293 $22,486 $24,6782023 $21,095 $26,141 $28,668
Median Age2010 31.9 33.4 34.12018 32.8 34.4 35.02023 34.7 36.0 36.6
Data Note: Household population includes persons not residing in group quarters. Average Household Size is the household population divided by total households. Persons in families include the householder and persons related to the householder by birth, marriage, or adoption. Per Capita Income represents the income received by all persons aged 15 years and over divided by the total population.Source: U.S. Census Bureau, Census 2010 Summary File 1. Esri forecasts for 2018 and 2023 Esri converted Census 2000 data into 2010 geography.
January 28, 2019
©2019 Esri Page 1 of 7
Market Profile11729 The Plz, Norwalk, California, 90650 Prepared by EsriRings: 1, 3, 5 mile radii Latitude: 33.90504
Longitude: -118.08345
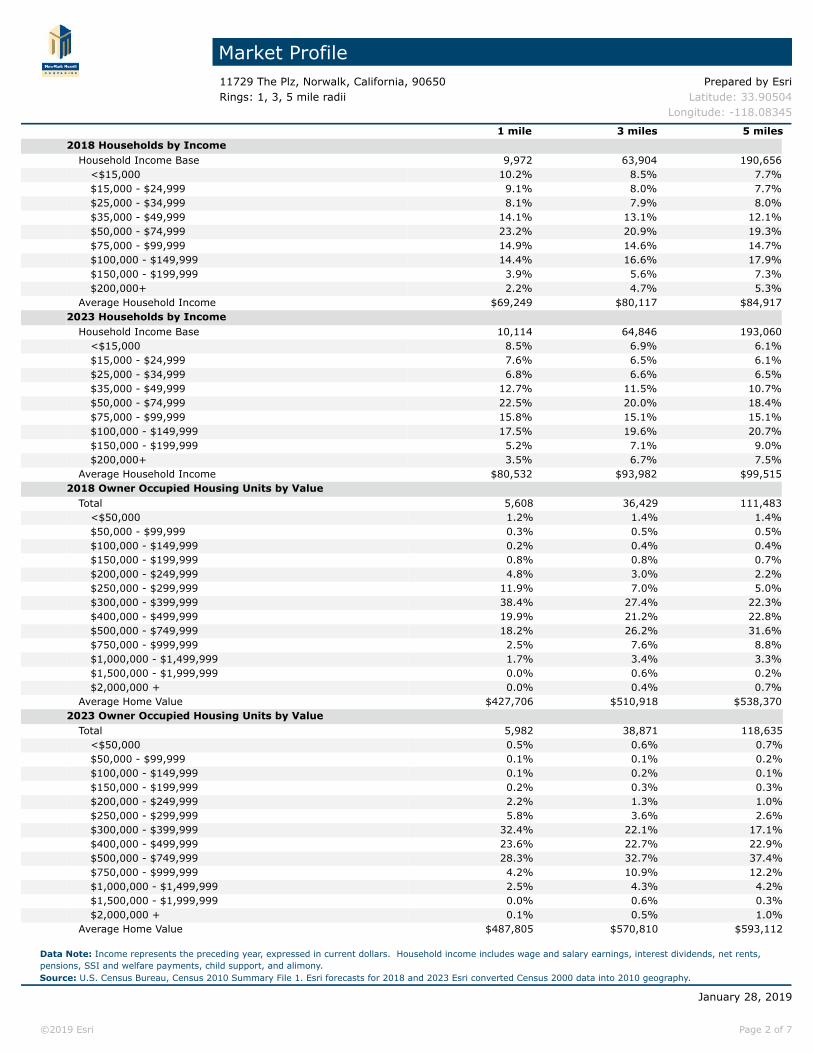
1 mile 3 miles 5 miles2018 Households by Income
Household Income Base 9,972 63,904 190,656<$15,000 10.2% 8.5% 7.7%$15,000 - $24,999 9.1% 8.0% 7.7%$25,000 - $34,999 8.1% 7.9% 8.0%$35,000 - $49,999 14.1% 13.1% 12.1%$50,000 - $74,999 23.2% 20.9% 19.3%$75,000 - $99,999 14.9% 14.6% 14.7%$100,000 - $149,999 14.4% 16.6% 17.9%$150,000 - $199,999 3.9% 5.6% 7.3%$200,000+ 2.2% 4.7% 5.3%
Average Household Income $69,249 $80,117 $84,9172023 Households by Income
Household Income Base 10,114 64,846 193,060<$15,000 8.5% 6.9% 6.1%$15,000 - $24,999 7.6% 6.5% 6.1%$25,000 - $34,999 6.8% 6.6% 6.5%$35,000 - $49,999 12.7% 11.5% 10.7%$50,000 - $74,999 22.5% 20.0% 18.4%$75,000 - $99,999 15.8% 15.1% 15.1%$100,000 - $149,999 17.5% 19.6% 20.7%$150,000 - $199,999 5.2% 7.1% 9.0%$200,000+ 3.5% 6.7% 7.5%
Average Household Income $80,532 $93,982 $99,5152018 Owner Occupied Housing Units by Value
Total 5,608 36,429 111,483<$50,000 1.2% 1.4% 1.4%$50,000 - $99,999 0.3% 0.5% 0.5%$100,000 - $149,999 0.2% 0.4% 0.4%$150,000 - $199,999 0.8% 0.8% 0.7%$200,000 - $249,999 4.8% 3.0% 2.2%$250,000 - $299,999 11.9% 7.0% 5.0%$300,000 - $399,999 38.4% 27.4% 22.3%$400,000 - $499,999 19.9% 21.2% 22.8%$500,000 - $749,999 18.2% 26.2% 31.6%$750,000 - $999,999 2.5% 7.6% 8.8%$1,000,000 - $1,499,999 1.7% 3.4% 3.3%$1,500,000 - $1,999,999 0.0% 0.6% 0.2%$2,000,000 + 0.0% 0.4% 0.7%
Average Home Value $427,706 $510,918 $538,3702023 Owner Occupied Housing Units by Value
Total 5,982 38,871 118,635<$50,000 0.5% 0.6% 0.7%$50,000 - $99,999 0.1% 0.1% 0.2%$100,000 - $149,999 0.1% 0.2% 0.1%$150,000 - $199,999 0.2% 0.3% 0.3%$200,000 - $249,999 2.2% 1.3% 1.0%$250,000 - $299,999 5.8% 3.6% 2.6%$300,000 - $399,999 32.4% 22.1% 17.1%$400,000 - $499,999 23.6% 22.7% 22.9%$500,000 - $749,999 28.3% 32.7% 37.4%$750,000 - $999,999 4.2% 10.9% 12.2%$1,000,000 - $1,499,999 2.5% 4.3% 4.2%$1,500,000 - $1,999,999 0.0% 0.6% 0.3%$2,000,000 + 0.1% 0.5% 1.0%
Average Home Value $487,805 $570,810 $593,112
Data Note: Income represents the preceding year, expressed in current dollars. Household income includes wage and salary earnings, interest dividends, net rents, pensions, SSI and welfare payments, child support, and alimony. Source: U.S. Census Bureau, Census 2010 Summary File 1. Esri forecasts for 2018 and 2023 Esri converted Census 2000 data into 2010 geography.
January 28, 2019
©2019 Esri Page 2 of 7
Market Profile11729 The Plz, Norwalk, California, 90650 Prepared by EsriRings: 1, 3, 5 mile radii Latitude: 33.90504
Longitude: -118.08345
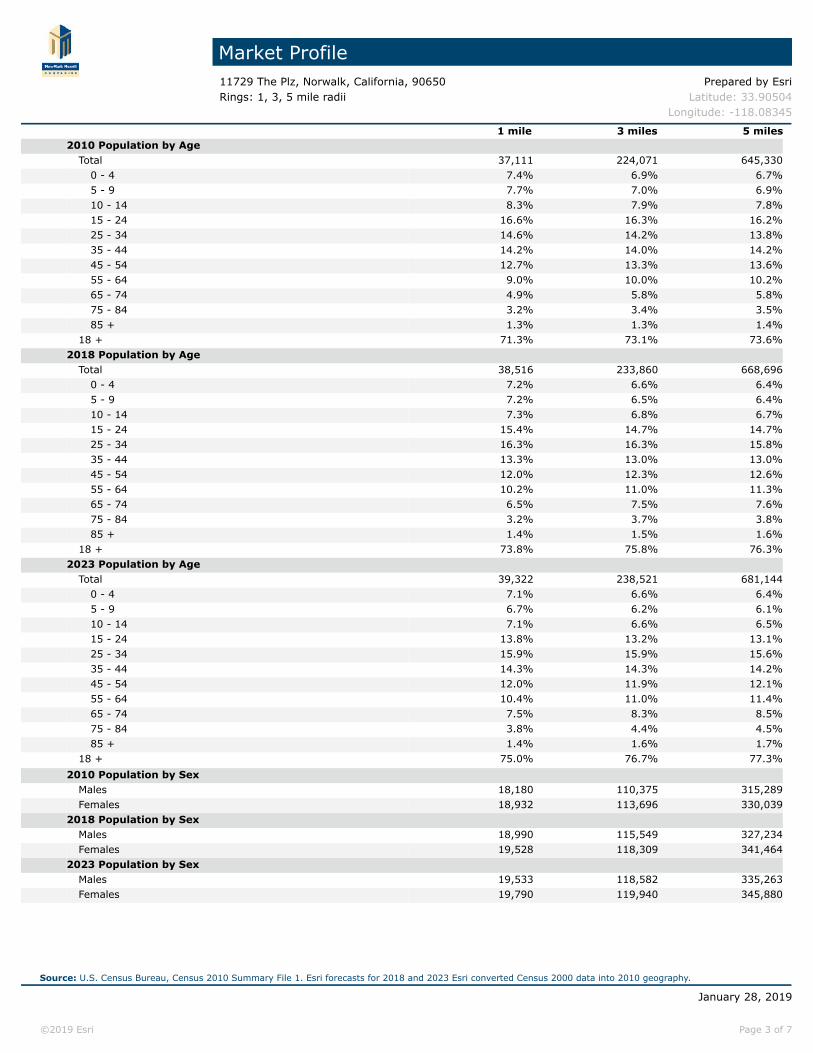
1 mile 3 miles 5 miles2010 Population by Age
Total 37,111 224,071 645,3300 - 4 7.4% 6.9% 6.7%5 - 9 7.7% 7.0% 6.9%10 - 14 8.3% 7.9% 7.8%15 - 24 16.6% 16.3% 16.2%25 - 34 14.6% 14.2% 13.8%35 - 44 14.2% 14.0% 14.2%45 - 54 12.7% 13.3% 13.6%55 - 64 9.0% 10.0% 10.2%65 - 74 4.9% 5.8% 5.8%75 - 84 3.2% 3.4% 3.5%85 + 1.3% 1.3% 1.4%
18 + 71.3% 73.1% 73.6%2018 Population by Age
Total 38,516 233,860 668,6960 - 4 7.2% 6.6% 6.4%5 - 9 7.2% 6.5% 6.4%10 - 14 7.3% 6.8% 6.7%15 - 24 15.4% 14.7% 14.7%25 - 34 16.3% 16.3% 15.8%35 - 44 13.3% 13.0% 13.0%45 - 54 12.0% 12.3% 12.6%55 - 64 10.2% 11.0% 11.3%65 - 74 6.5% 7.5% 7.6%75 - 84 3.2% 3.7% 3.8%85 + 1.4% 1.5% 1.6%
18 + 73.8% 75.8% 76.3%2023 Population by Age
Total 39,322 238,521 681,1440 - 4 7.1% 6.6% 6.4%5 - 9 6.7% 6.2% 6.1%10 - 14 7.1% 6.6% 6.5%15 - 24 13.8% 13.2% 13.1%25 - 34 15.9% 15.9% 15.6%35 - 44 14.3% 14.3% 14.2%45 - 54 12.0% 11.9% 12.1%55 - 64 10.4% 11.0% 11.4%65 - 74 7.5% 8.3% 8.5%75 - 84 3.8% 4.4% 4.5%85 + 1.4% 1.6% 1.7%
18 + 75.0% 76.7% 77.3%2010 Population by Sex
Males 18,180 110,375 315,289Females 18,932 113,696 330,039
2018 Population by SexMales 18,990 115,549 327,234Females 19,528 118,309 341,464
2023 Population by SexMales 19,533 118,582 335,263Females 19,790 119,940 345,880
Source: U.S. Census Bureau, Census 2010 Summary File 1. Esri forecasts for 2018 and 2023 Esri converted Census 2000 data into 2010 geography.
January 28, 2019
©2019 Esri Page 3 of 7
Market Profile11729 The Plz, Norwalk, California, 90650 Prepared by EsriRings: 1, 3, 5 mile radii Latitude: 33.90504
Longitude: -118.08345
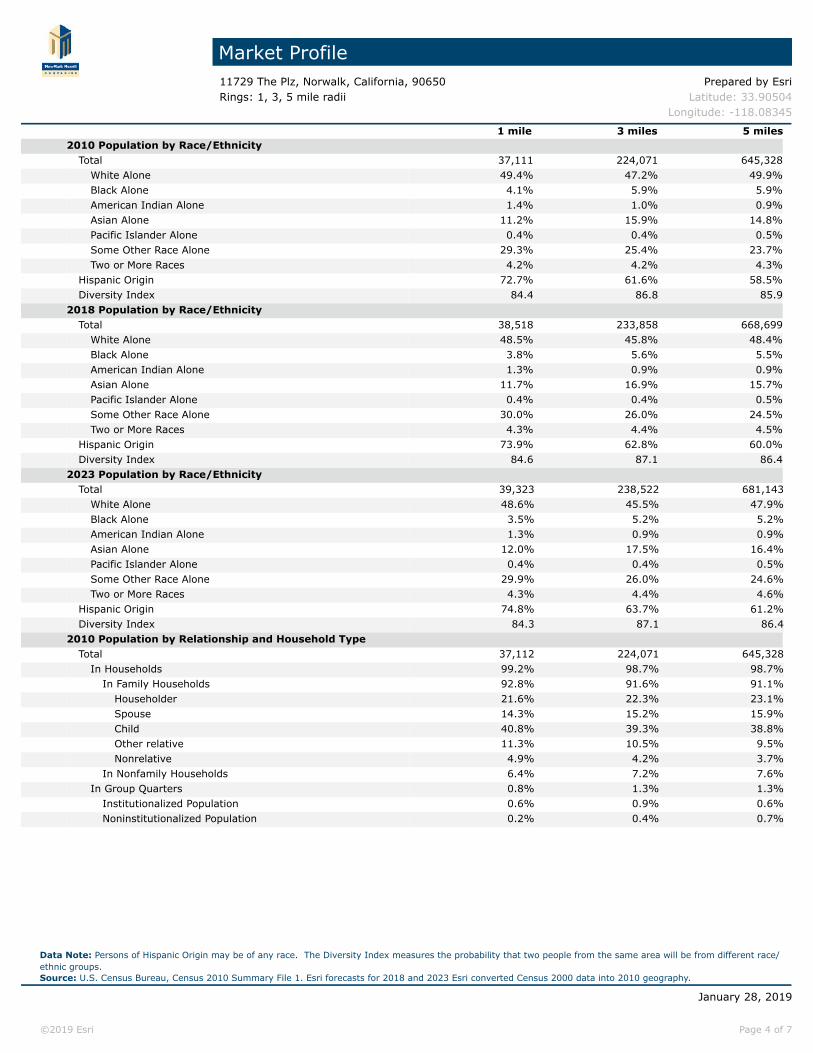
1 mile 3 miles 5 miles2010 Population by Race/Ethnicity
Total 37,111 224,071 645,328White Alone 49.4% 47.2% 49.9%Black Alone 4.1% 5.9% 5.9%American Indian Alone 1.4% 1.0% 0.9%Asian Alone 11.2% 15.9% 14.8%Pacific Islander Alone 0.4% 0.4% 0.5%Some Other Race Alone 29.3% 25.4% 23.7%Two or More Races 4.2% 4.2% 4.3%
Hispanic Origin 72.7% 61.6% 58.5%Diversity Index 84.4 86.8 85.9
2018 Population by Race/EthnicityTotal 38,518 233,858 668,699
White Alone 48.5% 45.8% 48.4%Black Alone 3.8% 5.6% 5.5%American Indian Alone 1.3% 0.9% 0.9%Asian Alone 11.7% 16.9% 15.7%Pacific Islander Alone 0.4% 0.4% 0.5%Some Other Race Alone 30.0% 26.0% 24.5%Two or More Races 4.3% 4.4% 4.5%
Hispanic Origin 73.9% 62.8% 60.0%Diversity Index 84.6 87.1 86.4
2023 Population by Race/EthnicityTotal 39,323 238,522 681,143
White Alone 48.6% 45.5% 47.9%Black Alone 3.5% 5.2% 5.2%American Indian Alone 1.3% 0.9% 0.9%Asian Alone 12.0% 17.5% 16.4%Pacific Islander Alone 0.4% 0.4% 0.5%Some Other Race Alone 29.9% 26.0% 24.6%Two or More Races 4.3% 4.4% 4.6%
Hispanic Origin 74.8% 63.7% 61.2%Diversity Index 84.3 87.1 86.4
2010 Population by Relationship and Household TypeTotal 37,112 224,071 645,328
In Households 99.2% 98.7% 98.7%In Family Households 92.8% 91.6% 91.1%
Householder 21.6% 22.3% 23.1%Spouse 14.3% 15.2% 15.9%Child 40.8% 39.3% 38.8%Other relative 11.3% 10.5% 9.5%Nonrelative 4.9% 4.2% 3.7%
In Nonfamily Households 6.4% 7.2% 7.6%In Group Quarters 0.8% 1.3% 1.3%
Institutionalized Population 0.6% 0.9% 0.6%Noninstitutionalized Population 0.2% 0.4% 0.7%
Data Note: Persons of Hispanic Origin may be of any race. The Diversity Index measures the probability that two people from the same area will be from different race/ethnic groups.Source: U.S. Census Bureau, Census 2010 Summary File 1. Esri forecasts for 2018 and 2023 Esri converted Census 2000 data into 2010 geography.
January 28, 2019
©2019 Esri Page 4 of 7
Market Profile11729 The Plz, Norwalk, California, 90650 Prepared by EsriRings: 1, 3, 5 mile radii Latitude: 33.90504
Longitude: -118.08345
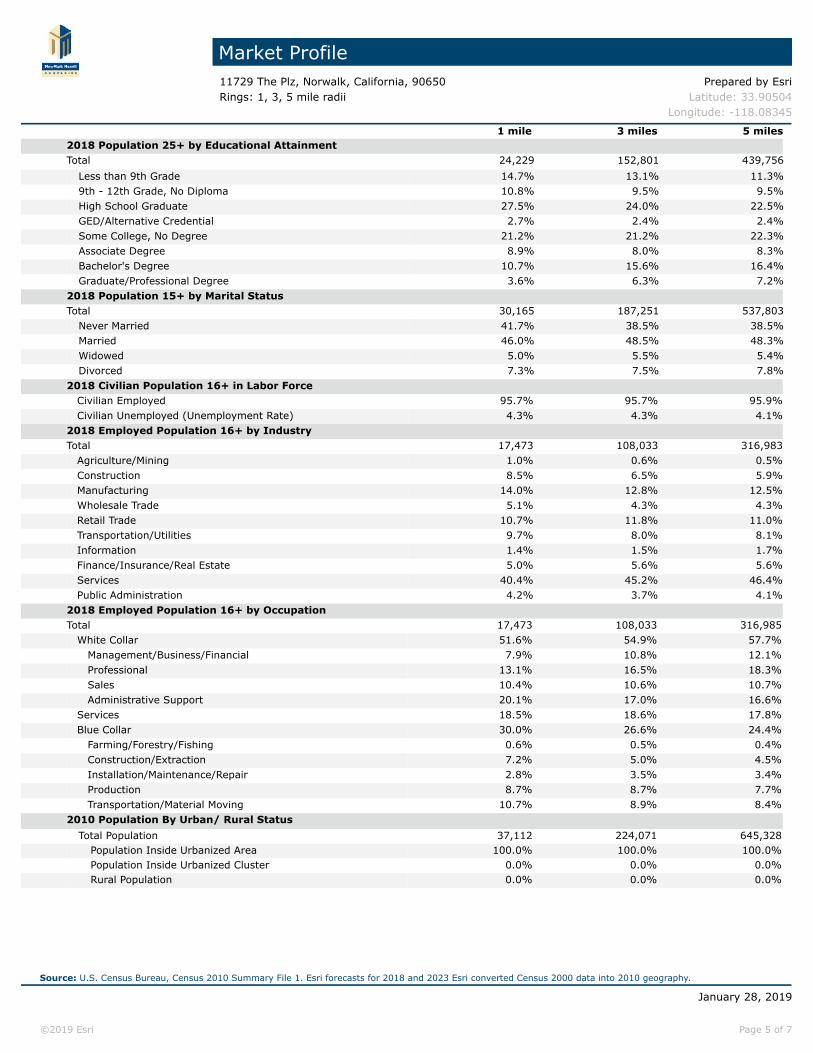
1 mile 3 miles 5 miles2018 Population 25+ by Educational AttainmentTotal 24,229 152,801 439,756
Less than 9th Grade 14.7% 13.1% 11.3%9th - 12th Grade, No Diploma 10.8% 9.5% 9.5%High School Graduate 27.5% 24.0% 22.5%GED/Alternative Credential 2.7% 2.4% 2.4%Some College, No Degree 21.2% 21.2% 22.3%Associate Degree 8.9% 8.0% 8.3%Bachelor's Degree 10.7% 15.6% 16.4%Graduate/Professional Degree 3.6% 6.3% 7.2%
2018 Population 15+ by Marital StatusTotal 30,165 187,251 537,803
Never Married 41.7% 38.5% 38.5%Married 46.0% 48.5% 48.3%Widowed 5.0% 5.5% 5.4%Divorced 7.3% 7.5% 7.8%
2018 Civilian Population 16+ in Labor Force Civilian Employed 95.7% 95.7% 95.9% Civilian Unemployed (Unemployment Rate) 4.3% 4.3% 4.1%2018 Employed Population 16+ by IndustryTotal 17,473 108,033 316,983 Agriculture/Mining 1.0% 0.6% 0.5% Construction 8.5% 6.5% 5.9% Manufacturing 14.0% 12.8% 12.5% Wholesale Trade 5.1% 4.3% 4.3% Retail Trade 10.7% 11.8% 11.0% Transportation/Utilities 9.7% 8.0% 8.1% Information 1.4% 1.5% 1.7% Finance/Insurance/Real Estate 5.0% 5.6% 5.6% Services 40.4% 45.2% 46.4% Public Administration 4.2% 3.7% 4.1%2018 Employed Population 16+ by OccupationTotal 17,473 108,033 316,985 White Collar 51.6% 54.9% 57.7% Management/Business/Financial 7.9% 10.8% 12.1% Professional 13.1% 16.5% 18.3% Sales 10.4% 10.6% 10.7% Administrative Support 20.1% 17.0% 16.6% Services 18.5% 18.6% 17.8% Blue Collar 30.0% 26.6% 24.4% Farming/Forestry/Fishing 0.6% 0.5% 0.4% Construction/Extraction 7.2% 5.0% 4.5% Installation/Maintenance/Repair 2.8% 3.5% 3.4% Production 8.7% 8.7% 7.7% Transportation/Material Moving 10.7% 8.9% 8.4%2010 Population By Urban/ Rural Status
Total Population 37,112 224,071 645,328Population Inside Urbanized Area 100.0% 100.0% 100.0%Population Inside Urbanized Cluster 0.0% 0.0% 0.0%Rural Population 0.0% 0.0% 0.0%
Source: U.S. Census Bureau, Census 2010 Summary File 1. Esri forecasts for 2018 and 2023 Esri converted Census 2000 data into 2010 geography.
January 28, 2019
©2019 Esri Page 5 of 7
Market Profile11729 The Plz, Norwalk, California, 90650 Prepared by EsriRings: 1, 3, 5 mile radii Latitude: 33.90504
Longitude: -118.08345
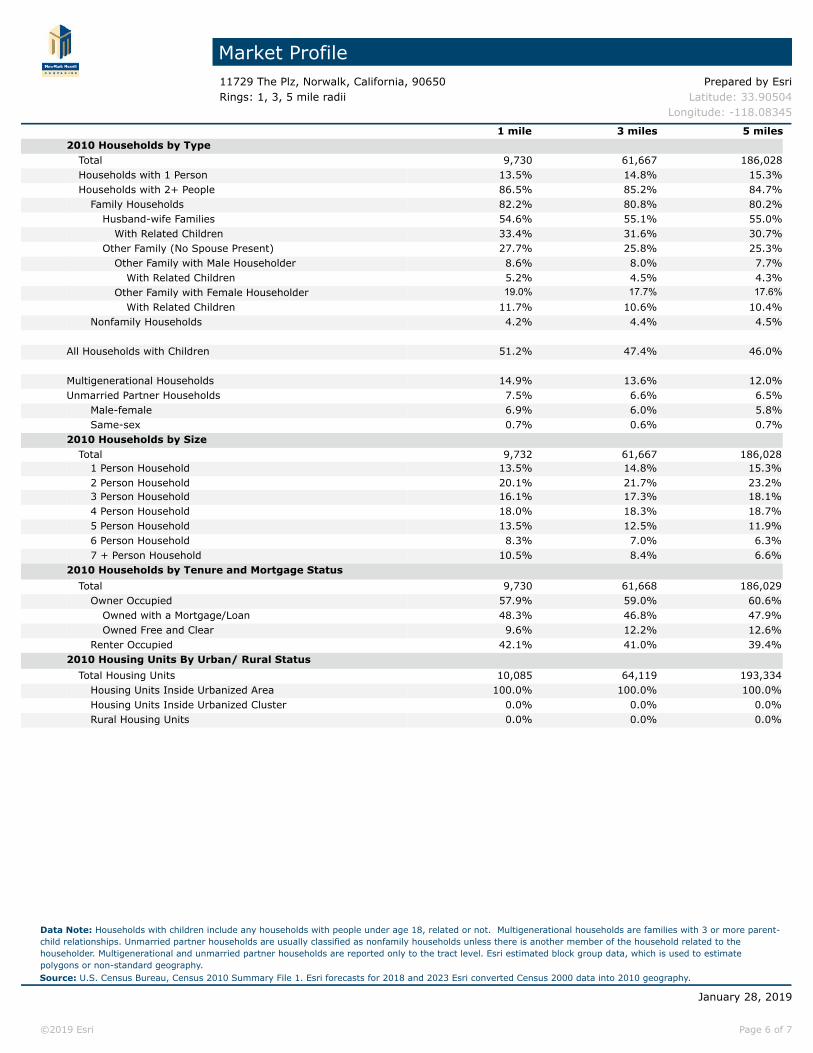
1 mile 3 miles 5 miles2010 Households by Type
Total 9,730 61,667 186,028Households with 1 Person 13.5% 14.8% 15.3%Households with 2+ People 86.5% 85.2% 84.7%
Family Households 82.2% 80.8% 80.2%Husband-wife Families 54.6% 55.1% 55.0%
With Related Children 33.4% 31.6% 30.7%Other Family (No Spouse Present) 27.7% 25.8% 25.3%
Other Family with Male Householder 8.6% 8.0% 7.7%With Related Children 5.2% 4.5% 4.3%
Other Family with Female Householder 19.0% 17.7% 17.6%With Related Children 11.7% 10.6% 10.4%
Nonfamily Households 4.2% 4.4% 4.5%
All Households with Children 51.2% 47.4% 46.0%
Multigenerational Households 14.9% 13.6% 12.0%Unmarried Partner Households 7.5% 6.6% 6.5%
Male-female 6.9% 6.0% 5.8%Same-sex 0.7% 0.6% 0.7%
2010 Households by SizeTotal 9,732 61,667 186,028
1 Person Household 13.5% 14.8% 15.3%2 Person Household 20.1% 21.7% 23.2%3 Person Household 16.1% 17.3% 18.1%4 Person Household 18.0% 18.3% 18.7%5 Person Household 13.5% 12.5% 11.9%6 Person Household 8.3% 7.0% 6.3%7 + Person Household 10.5% 8.4% 6.6%
2010 Households by Tenure and Mortgage StatusTotal 9,730 61,668 186,029
Owner Occupied 57.9% 59.0% 60.6%Owned with a Mortgage/Loan 48.3% 46.8% 47.9%Owned Free and Clear 9.6% 12.2% 12.6%
Renter Occupied 42.1% 41.0% 39.4%2010 Housing Units By Urban/ Rural Status
Total Housing Units 10,085 64,119 193,334Housing Units Inside Urbanized Area 100.0% 100.0% 100.0%Housing Units Inside Urbanized Cluster 0.0% 0.0% 0.0%Rural Housing Units 0.0% 0.0% 0.0%
Data Note: Households with children include any households with people under age 18, related or not. Multigenerational households are families with 3 or more parent-child relationships. Unmarried partner households are usually classified as nonfamily households unless there is another member of the household related to the householder. Multigenerational and unmarried partner households are reported only to the tract level. Esri estimated block group data, which is used to estimate polygons or non-standard geography.Source: U.S. Census Bureau, Census 2010 Summary File 1. Esri forecasts for 2018 and 2023 Esri converted Census 2000 data into 2010 geography.
January 28, 2019
©2019 Esri Page 6 of 7
Market Profile11729 The Plz, Norwalk, California, 90650 Prepared by EsriRings: 1, 3, 5 mile radii Latitude: 33.90504
Longitude: -118.08345
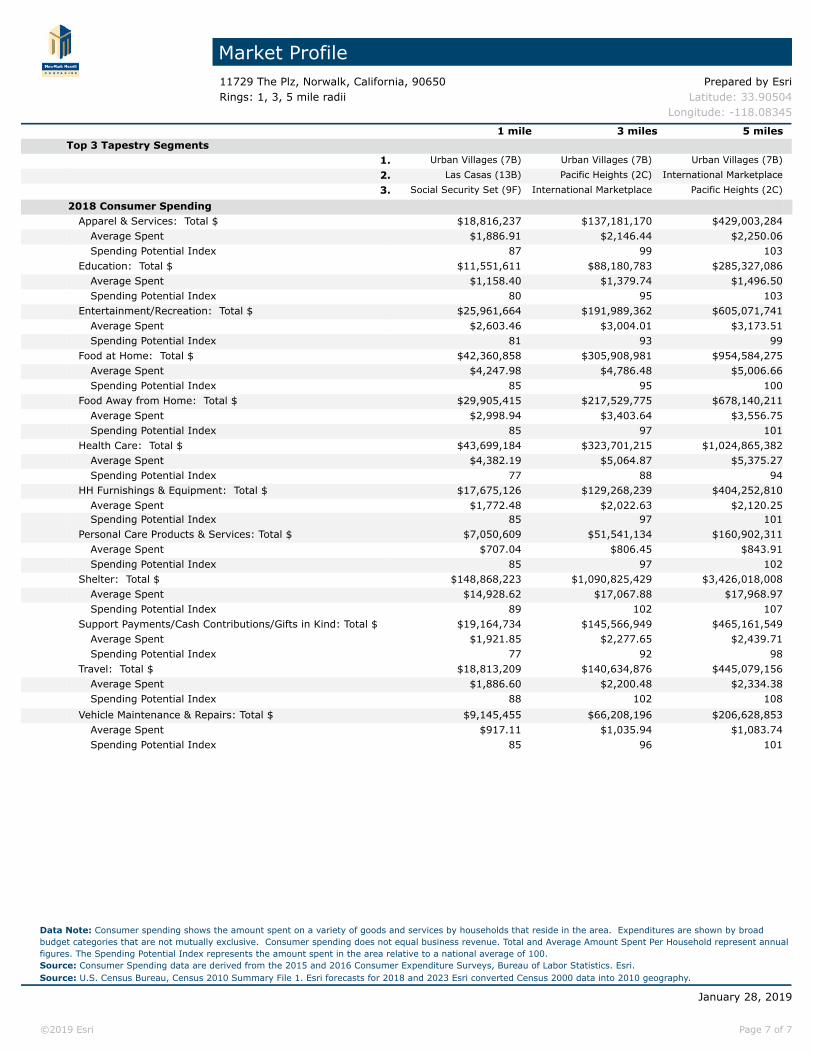
1 mile 3 miles 5 milesTop 3 Tapestry Segments
1. Urban Villages (7B) Urban Villages (7B) Urban Villages (7B)2. Las Casas (13B) Pacific Heights (2C) International Marketplace
(13A)3. Social Security Set (9F) International Marketplace (13A)
Pacific Heights (2C)
2018 Consumer Spending Apparel & Services: Total $ $18,816,237 $137,181,170 $429,003,284
Average Spent $1,886.91 $2,146.44 $2,250.06Spending Potential Index 87 99 103
Education: Total $ $11,551,611 $88,180,783 $285,327,086Average Spent $1,158.40 $1,379.74 $1,496.50Spending Potential Index 80 95 103
Entertainment/Recreation: Total $ $25,961,664 $191,989,362 $605,071,741Average Spent $2,603.46 $3,004.01 $3,173.51Spending Potential Index 81 93 99
Food at Home: Total $ $42,360,858 $305,908,981 $954,584,275Average Spent $4,247.98 $4,786.48 $5,006.66Spending Potential Index 85 95 100
Food Away from Home: Total $ $29,905,415 $217,529,775 $678,140,211Average Spent $2,998.94 $3,403.64 $3,556.75Spending Potential Index 85 97 101
Health Care: Total $ $43,699,184 $323,701,215 $1,024,865,382Average Spent $4,382.19 $5,064.87 $5,375.27Spending Potential Index 77 88 94
HH Furnishings & Equipment: Total $ $17,675,126 $129,268,239 $404,252,810Average Spent $1,772.48 $2,022.63 $2,120.25Spending Potential Index 85 97 101
Personal Care Products & Services: Total $ $7,050,609 $51,541,134 $160,902,311Average Spent $707.04 $806.45 $843.91Spending Potential Index 85 97 102
Shelter: Total $ $148,868,223 $1,090,825,429 $3,426,018,008Average Spent $14,928.62 $17,067.88 $17,968.97Spending Potential Index 89 102 107
Support Payments/Cash Contributions/Gifts in Kind: Total $ $19,164,734 $145,566,949 $465,161,549Average Spent $1,921.85 $2,277.65 $2,439.71Spending Potential Index 77 92 98
Travel: Total $ $18,813,209 $140,634,876 $445,079,156Average Spent $1,886.60 $2,200.48 $2,334.38Spending Potential Index 88 102 108
Vehicle Maintenance & Repairs: Total $ $9,145,455 $66,208,196 $206,628,853Average Spent $917.11 $1,035.94 $1,083.74Spending Potential Index 85 96 101
Data Note: Consumer spending shows the amount spent on a variety of goods and services by households that reside in the area. Expenditures are shown by broad budget categories that are not mutually exclusive. Consumer spending does not equal business revenue. Total and Average Amount Spent Per Household represent annual figures. The Spending Potential Index represents the amount spent in the area relative to a national average of 100.Source: Consumer Spending data are derived from the 2015 and 2016 Consumer Expenditure Surveys, Bureau of Labor Statistics. Esri.Source: U.S. Census Bureau, Census 2010 Summary File 1. Esri forecasts for 2018 and 2023 Esri converted Census 2000 data into 2010 geography.
January 28, 2019
©2019 Esri Page 7 of 7