newday earnings call details: date: thursday 15 june time ... · 2015 2016 2017 q1 ltm open...
TRANSCRIPT

NewDayQuarter-end 31 March 2017
Results presentation
Earnings call details:
Date: Thursday 15 June
Time: 14:00 BST
Participants dial in: (+44) [0] 1452 554 265
0800 694 1630 (UK Free)
ID: 40552993
Important disclaimerThis presentation has been prepared by NewDay Cards Limited on behalf of NewDay Group (Jersey) Limited (the “Company”) on a confidential basis solely for information purposes. For
purposes of this notice, the presentation that follows shall mean and include the slides that follow, the oral presentation of the slides by the Company or any person on behalf of the
Company, any question-and-answer sessions that follows the oral presentation, printed copies of this document and any materials distributed at, or in connection with the presentation
(collectively, this “Presentation”). By attending the meeting at which this Presentation is made, or by reading this Presentation, you will be deemed to have (i) agreed to the following
restrictions and made the following undertakings and (ii) acknowledged that you understand the legal and regulatory sanctions attached to the misuse, disclosure or improper circulation of
this Presentation.
All financial information contained in this Presentation relates to the unaudited consolidated financial results of the Company (and not, except where expressly stated to the
case, NewDay BondCo plc). The financial information contained in this Document has not been audited, reviewed or verified by any independent accounting firm. All non-financial
information contained in this Presentation relates to the business, assets and operations of the Company together with its subsidiaries and subsidiary undertakings (the “Group”). Certain
financial data included in this presentation consists of “non-IFRS financial measures”. These non-IFRS financial measures, as defined by the Company, may not be comparable to similarly-
titled measures as presented by other companies, nor should they be considered as an alternative to the historical financial results or other indicators of the Company’s cash flow based on
IFRS. Even though the non-IFRS financial measures are used by management to assess the Company’s financial position, financial results and liquidity and these types of measures are
commonly used by investors, they have important limitations as analytical tools, and you should not consider them in isolation or as substitutes for analysis of the Company’s financial
position or results of operations as reported under IFRS. The inclusion of such non-IFRS financial measures in this Presentation or any related presentation should not be regarded as a
representation or warranty by the Company, any member of the Group, any of their respective affiliates, advisors or representatives or any other person as to the accuracy or completeness
of such information’s portrayal of the financial condition or results of operations of the Company and should not be relied upon when making an investment decision.
This Presentation may contain forward-looking statements. All statements other than statements of historical fact included in this Presentation are forward-looking statements. Forward-
looking statements express the Company’s current expectations and projections relating to their financial condition, results of operations, plans, objectives, future performance and
business. These statements may include, without limitation, any statements preceded by, followed by or including words such as “aim,” “anticipate,” “believe,” “can have,” “could,”
“estimate,” “expect,” “intend,” “likely,” “may,” “plan,” “project,” “should,” “target,” “will,” “would” and other words and terms of similar meaning or the negative thereof. Such forward-looking
statements involve known and unknown risks, uncertainties and other important factors beyond the Company’s control that could cause the Company’s actual results, performance or
achievements to be materially different from the expected results, performance or achievements expressed or implied by such forward-looking statements. Such forward-looking statements
are based on numerous assumptions regarding the Company’s present and future business strategies and the environment in which it will operate in the future. You acknowledge that
circumstances may change and the contents of this Presentation may become outdated as a result.
The information contained in this Presentation should be considered in the context of the circumstances prevailing at the time and will not be updated to reflect material developments that
may occur after the date of this Presentation. The information and opinions in this Presentation are provided as at the date of this Presentation and are subject to change without notice.
None of the Company, any member of the Group, any of their respective affiliates, advisors or representatives or any other person shall have any liability whatsoever (in negligence or
otherwise) for any loss howsoever arising from any use of this Presentation or its contents or otherwise arising in connection with this Presentation, or any action taken by you or any of
your officers, employees, agents or associates on the basis of the information in this Presentation.
This Presentation is not for publication, release or distribution in any jurisdiction where to do so would constitute a violation of the relevant laws of such jurisdiction nor should it be taken or
transmitted into such jurisdiction.
2

Presenters
James Corcoran
CEO
Paul Sheriff
CFO
3

Agenda / Contents
1 Key highlights
2 Business performance
3 Financial results
4 Q&A
5 Appendix
4
Key highlights
1
2
4
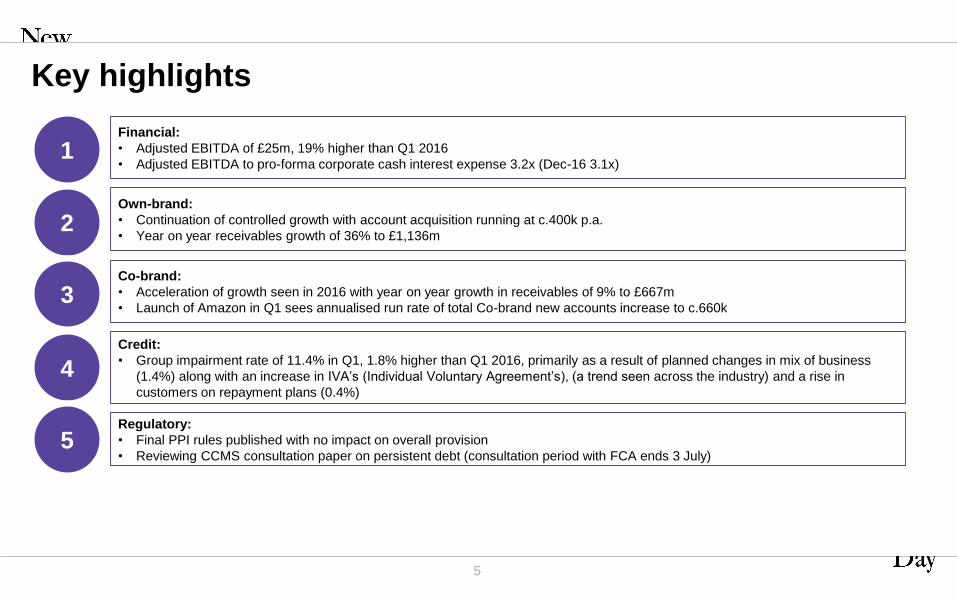
Financial:
• Adjusted EBITDA of £25m, 19% higher than Q1 2016
• Adjusted EBITDA to pro-forma corporate cash interest expense 3.2x (Dec-16 3.1x)
Own-brand:
• Continuation of controlled growth with account acquisition running at c.400k p.a.
• Year on year receivables growth of 36% to £1,136m
Credit:
• Group impairment rate of 11.4% in Q1, 1.8% higher than Q1 2016, primarily as a result of planned changes in mix of business
(1.4%) along with an increase in IVA’s (Individual Voluntary Agreement’s), (a trend seen across the industry) and a rise in
customers on repayment plans (0.4%)
3Co-brand:
• Acceleration of growth seen in 2016 with year on year growth in receivables of 9% to £667m
• Launch of Amazon in Q1 sees annualised run rate of total Co-brand new accounts increase to c.660k
5
5Regulatory:
• Final PPI rules published with no impact on overall provision
• Reviewing CCMS consultation paper on persistent debt (consultation period with FCA ends 3 July)

New accounts origination Growing average balances Receivables growth
Risk-adjusted margin Risk-adjusted income
341 389 398
682 632 629
1,023 1,021 1,027
2015 2016 Q1 2017 LTM
(‘000)
Own-brand Co-brand
1,1611,287 1,279
363 397 417
Mar-16 Dec-16 Mar-17
(£)
Own-brand Co-brand
8351,093 1,136
614
722 6671,449
1,815 1,803
Mar-16 Dec-16 Mar-17
(£m)
Own-brand Co-brand
94137 140
113
119 122
207
256 262
2015 2016 Q1 2017 LTM
(£m)
Own-brand Co-brand
14.6% 14.9% 14.1%
16.7%18.4% 18.7%
2015 2016 Q1 2017 LTM
Own-brand Co-brand
6
Stable new accounts origination and maturing average balances
providing RAI growth

Income growth underpinned by strong margins
Own-brand: Continued controlled growth and stable margins provide
growing returns
603
936
660
986
184
157
175
150
787
1,093
835
1,136
Dec-15 Dec-16 Mar-16 Mar-17
Open book Closed book
Gross receivables (£m)
277 273 276
64 116 122
341389 398
2015 2016 Q1 2017 LTM
aqua marbles
Strong organic growth
Risk-adjusted income (£m) Risk-adjusted margin
11.7% 12.6% 12.3%
20.9%25.2% 25.2%
2015 2016 Q1 2017 LTM
Open book Closed book
53
95 99
41
42 4194
137 140
2015 2016 Q1 2017 LTM
Open book Closed book
New accounts (‘000)
Own-brand key highlights
Current run rate c.400k new accounts per annum
Receivables growth of £301m in the 12 months to March 2017,
driven by the open book
Risk adjusted income of £33m in Q1 in 2017, LTM of £140m
Risk-adjusted margin on the open book has dropped 0.3% to
12.3% for the 12 months to March 2017, due to higher
impairment rates
Expansion of healthcheck campaigns, helping to educate
customers on financial wellbeing
• For the 12 months to March 2017, 63% of customers
received a credit line increase
• For the 12 months to March 2017, 58% of reprices were
downwards
7

Co-brand: Improving margins combined with growth of new retailers
Open book growth (gross receivables in £m)
630 693569 641
5429
45 26
684 722
614 667
Dec-15 Dec-16 Mar-16 Mar-17
Open book Closed book
96.1%92.7%
Successful integration delivering improved profitability
Risk-adjusted income (£m) Risk-adjusted margin
105 113 116
8 6 6113 119 122
2015 2016 2017 Q1 LTM
Open book Closed book
17.7% 18.6% 18.8%
2015 2016 2017 Q1 LTM
Open book
% Open book
96.0%92.1%
Co-brand key highlights
Open book receivables returned to growth during 2016, with
£72m growth in the 12 months to March 2017
Improving RAM reflecting continued strong underwriting and
growth of good credit risk revolving balances
Risk-adjusted income of £33m in Q1 2017, LTM £122m
Step change growth in online account bookings in Q1 (c.3x
growth in new online account bookings)
Following the launch of TUI in Q4 2016, Amazon launched in Q1
2017 with Q2 already seeing accelerated growth and additional
Amazon products due in H2
8

Servicing / average receivables
Consistent improvement in servicing efficiency
Income growth exceeds costs growth
Operating highlights
Continued focus on efficiency and further execution of cost
saving initiatives
Income is growing approximately three times faster than costs,
leveraging the scalable nature of the business
Continued investment in improved functionality and customer
service
Customer satisfaction remains very strong with transactional
NPS scores at +65
9
Improved cost income ratio leveraging stable cost base
4.9%4.7% 4.6%
2015 2016 2017 Q1 LTM
321
412 435
136 161 164
2015 2016 2017 Q1 LTMIncome Costs
1.9%
42.4%
39.0%
37.7%
2015 2016 Q1 2017 LTM
Improving cost income ratio

£m 2016 Q1 2017 Q1 2016ALTM
Mar-17
Interest income 91 113 392 416
Cost of funds (7) (9) (30) (33)
Fee income 11 14 50 52
Total income 95 118 412 435
Total impairment (35) (52) (156) (173)
Risk-adjusted income 60 66 256 262
Servicing costs and collection fees (17) (20) (67) (69)
Investment costs (11) (11) (52) (53)
Underlying contribution 32 35 137 140
Salaries, benefits & overheads (11) (11) (42) (42)
Depreciation & amortisation - 1 1 2
Adjusted EBITDA 21 25 96 100
Average gross receivables 1,455 1,814 1,567 1,649
Gross interest and fee yield (%) 28.0 28.0 28.2 28.4
Cost of funds (%) 2.4% 2.5% 2.4% 2.5%
Pro-forma net corporate senior
secured debt to adjusted EBITDA 4.2x 3.1x 3.1x 3.1xAdjusted EBITDA to pro-forma
corporate cash interest expense(a) 2.5x 3.2x 3.1x 3.2x
Underlying cost to income ratio improving
EBITDA interest cover
Growing adjusted EBITDAHistorical performance illustrates growth potential
(a) Proforma adjustment for the full year interest expense on the senior secured bond10
Group income statement
96 100
21 25
2016A LTM Mar-17
2016 Q1 2017 Q1
3.1x 3.2x
2.5x
3.2x
2016A LTM Mar-17
2016 Q1 2017 Q1
39.0% 37.7%41.1%
36.0%
2016A LTM Mar-17
2016 Q1 2017 Q1

(a) Working capital includes other assets, restricted cash, other provisions and other liabilities
(b) Exceptional costs in 2017 relate to the transaction fees associated with the acquisition by funds advised by
Cinven and CVC in January 2017. These costs have been excluded from the adjusted LTM numbers above
Working capital movements are predominantly driven by:
o Changes in restricted cash balances as the Group’s funding
structure has developed
o Changes in operational settlement accounts
Growth in receivables funded by drawdowns under financing
facilities as well as internal cash flow generation
Q1 2017 saw a number of expected costs associated with the
acquisition by funds advised by Cinven and CVC together with
costs related to raising the senior secured bond
In addition to free cash flow available for debt service, there was
undrawn capacity under the VFN of £547m at Mar-17 to provide
further liquidity, of which £33m was available but had not been
drawn down as at 31 March 2017 (£5m was available at 31
December 2016)
The reduction in net financing cash flow is mainly driven by the
slight deleveraging at the portfolio level as a result of the
increased undrawn capacity on the VFNs
CommentsSummary cash flow statement
11
Group cash flow
£m 2016 2017 Mar-LTM2017 Mar-LTM
Adjusted(b)
Adjusted EBITDA 96 100 100
Impairment provision build 20 27 27
Adjusted EBITDA excluding change in
impairment provision116 127 127
Change in working capital(a) (7) (18) (18)
PPI and CCA provision utilisation (12) (12) (12)
Capex (5) (9) (9)
Tax paid (1) (2) (2)
Exceptional costs(b) (4) (14) (5)
FCF available for growth and debt
service87 72 81
(Increase) in gross receivables (364) (377) (377)
Net financing cash flow (ABS) 392 354 354
Undrawn liquidity available from VFN 5 33 33
Fully leveraged FCF available for debt
service120 82 91

Highlights
Pro-forma LTM net corporate senior secured debt to adjusted
EBITDA 3.1x (Dec-16 3.1x). Adjusting for undrawn available
liquidity from the VFN, this ratio would be 2.8x (Dec 16 3.0x)
Continued strong cash generation as a result of operating
performance and stable funding
A number of exceptional cash flow items associated with the
acquisition and bond issuance
Deleveraging through cash and profit growth
12
Strong cash flow generation leading to continued de-leveraging
£m 20162017 Mar-
LTM
Fully leveraged FCF available for debt service 120 82
Equity raised for acquisition bonus net of payments - 5
Net cash proceeds from senior secured debt - 412
Funding received via shareholder loans - 594
Purchase of LuxCo - (990)
Distributions (60) (60)
Net increase in unrestricted cash (fully leveraged) 60 43
£m31-Dec 31-Mar
2016 2017
Proforma senior secured debt 425 425
Unrestricted cash (129) (114)
Pro-forma net corporate senior secured debt 296 311
Pro-forma net corporate senior secured debt to adjusted
EBITDA ratio3.1x 3.1x
Undrawn liquidity available from VFN 5 33
Adjusted proforma net corporate senior secured debt to
adjusted EBITDA ratio3.0x 2.8x

Cost of funds
300 300
565
250
175
550 60475
850
625
250
2017 2018 2019 2020
Issued bonds VFN
(£m)
Key funding highlights
Cost of funds remains stable at 2.5% for Q1 2017 (LTM 2.5%)
Debt profile, excluding senior secured notes, remains unchanged
Plans being executed for 2017 funding
Debt maturity profile (a) (excl. senior secured notes)
13
Unchanged debt maturity and stable cost of funding
(a) Debt maturity profile above relates to total capacity under VFNs and total face value of issued bonds
including amounts retained by NewDay
83% 81%
2.7% 2.7%
Dec-2016 Mar-2017
Own-brand
Advance Rate Cost of funds
91% 90%
1.9% 1.8%
Dec-2016 Mar-2017
Co-brand
Advance Rate Cost of funds

Breakdown in group impairment movementKey credit drivers
Group impairment increases driven by mix of the portfolio and in
line with plan
The proportion of the Group comprising of Own-brand
receivables, which attracts a higher impairment rate than
Co-brand, has increased to 63% (Mar-16: 58%)
As the Own-brand closed portfolio runs off the open
books comprises a larger part of the total and attracts a
higher impairment rate. Open book made up 87% of the
total Own-brand book (Mar-16: 79%)
Increase in IVA’s, as seen across the industry, have increased
charge off rates together with an increase in customers on
repayment plans
Industry data shows a YoY increase of 35% in IVA’s in Q1 2017
from Q1 2016
Continued focus on underwriting and collections
14
Group impairment rate has increased by 1.8 ppts, driven by portfolio mix
9.6%11.4%
0.7%0.7%
0.4%
Q1'16 Own-brand /Co-brand mix
Own-brand -Open /
Closed mix
Underlyingperformance
Q1'17

15
Excess spread (rolling 3-month average)(a) Commentary
Significant excess spread provides cushion against an increase in
charge off rates, a decrease in yield and / or an increase in LIBOR
We monitor the excess spread and all other triggers and can
deploy multiple operational levers (for example, adjusting portfolio
growth or repricing)
Tick up in Own-brand charge offs consistent with our impairment
performance
Slight reduction in Co-brand charge off rate
Gross annualised charge-off rate
(a) Excludes the VFNs from the Master Trusts and the secondary funding facilities as they are not directly comparable. The VFNs are revolving in nature and the inter-month drawings on those notes would impact calculations of
excess spread, which are based on month-end balances. The excess spread for the following series, as calculated in April 2017 for the rolling 3-month period, are: NewDay Funding Secondary Funding Facility Senior VFN –
16.66%; NewDay Funding Partnership Master Trust, Series 2014-VFN – 18.74%; and NewDay Funding Master Trust, Series 2015-VFN – 14.03%.
Source: ABS Investor Reports available on NewDay website as of April-2017
Report Date
Report Date
Significant and consistent excess spread and stable loss performance
0%
5%
10%
15%
20%
25%
Mar-15 Jun-15 Sep-15 Dec-15 Mar-16 Jun-16 Sep-16 Dec-16 Mar-17
ND Funding | Series 2015 - 1 ND Partnership | Series 2014 - 1ND Funding | Series 2015 - 2 ND Partnership | Series 2015 - 1ND Funding | Series 2016 - 1
0%
5%
10%
15%
20%
25%
Mar-15 Jun-15 Sep-15 Dec-15 Mar-16 Jun-16 Sep-16 Dec-16 Mar-17
ND Funding ND Partnership

Q&A

Appendix

Underlying earnings adjustments
Other costs: primarily consist of a £19m increase in PPI provision taken
in 2016, reflecting expected increased claim rates across the industry
following the proposals for the new rules and guidelines relating to PPI
complaints handling set out in the FCA’s consultation paper “CP16/20:
Rules and guidance on payment protection insurance complaints:
feedback on CP15/39 and further consultation” issued in August 2016
All colleague acquisition bonus: reflecting a bonus paid to colleagues
relating to the recent acquisition
Exceptional costs: relating to the transaction fees associated with the
acquisition by Cinven and CVC in January 2017.
Amortisation: reflects the amortisation of the intangible assets
recognised on the acquisition by Cinven and CVC in January 2017
Interest on shareholder loans: reflects the interest cost of 12% on the
shareholder loan of £594m, issued as part of the acquisition by Cinven
and CVC on 26 January 2017
Fair value unwind: reflects the amortisation of a fair value adjustment
on the Group’s acquired portfolios
Key descriptions
18
Underlying earnings
(a) Note that the statutory loss before tax of £(18m) in 2017 Q1 is on a segmental basis as disclosed in the quarterly
consolidated financial information. Statutory loss before tax on the face of the income statement is £(28m) (£(32)m after tax)
reflecting the period from 27th January to 31st March 2017 only. All numbers in this presentation reflect results from 1st
January to 31st March on a proforma basis
£m 2016Mar 2017-
LTM2017 Q1 (a)
Adjusted EBITDA 96 100 25
Other costs (18) (19) (1)
All colleague acquisition bonus (9) (10) (1)
Exceptional costs - (11) (11)
Total non-recurring costs (27) (40) (13)
Depreciation and amortisation including
amortisation of acquisition intangibles(1) (11) (10)
Senior secured debt interest and
related costs- (7) (7)
Interest on shareholder loans - (13) (13)
Fair value unwind 5 4 -
Statutory PBT 73 33 (18)
Taxation (1) (5) (3)
Statutory PAT 72 28 (21)

£m 2016 Q1 2017 Q1 2016ALTM
Mar-17
Interest income(a) 57 77 262 281
Cost of funds (4) (6) (19) (21)
Fee income 7 10 31 34
Total income 60 81 274 294
Total impairment (29) (48) (137) (154)
Risk-adjusted income 31 33 137 140
Servicing costs and collection
fees(6) (8) (22) (24)
Investment costs (3) (4) (16) (17)
Underlying contribution 22 21 99 99
Average gross receivables 811 1,114 920 994
Gross interest and fee yield (%) 31.6 31.2 31.9 31.7
Impairment rate (%) 14.3 17.2 14.9 15.5
RAM (%) 15.3 11.8 14.9 14.1
£m 2016 Q1 2017 Q1 2016ALTM
Mar-17
Interest income(a) 34 36 132 135
Cost of funds (3) (3) (11) (11)
Fee income 4 4 18 18
Total income 35 37 139 142
Total impairment (6) (4) (20) (20)
Risk-adjusted income 29 33 119 122
Servicing costs and collection
fees(10) (12) (42) (42)
Investment costs (8) (7) (36) (36)
Underlying contribution 11 14 41 44
Average gross receivables 645 690 647 658
Gross interest and fee yield (%) 23.6 23.2 23.2 23.3
Impairment rate (%) 3.7 2.3 3.1 3.0
RAM (%) 18.0 19.1 18.4 18.5
Co-brand income statementOwn-brand income statement
(a) Excludes fair value unwind19
Underlying earnings by segment

Increase in receivables driven primarily by growth of the Own-
brand open book
Conservative provisioning with impairment coverage increasing
from 5.4% of gross receivables in March 2016 to 6.5% in March
2017
Fair value of total assets following the acquisition introduced
£396m of intangibles, primarily relating to the customer and
retailer relationships, the brand, trade names and intellectual
property
Evolution of gross receivables (£m)Summary balance sheet
Key highlights
20
Group balance sheet
£m Mar-16 Dec-16 Mar-17
Gross receivables 1,449 1,815 1,804
Bad debt provisions (90) (105) (117)
Other 30 50 57
Net receivables 1,389 1,760 1,744
Restricted cash 33 40 40
Unrestricted cash 105 129 114
Intangibles - 4 392
Goodwill - - 275
Other assets 37 74 54
Total assets 1,564 2,007 2,619
Asset-backed bonds 976 1,279 1,265
Wholesale funding 187 290 235
Senior bonds - - 431
PPI provision 47 56 54
Other provisions 6 12 5
Other liabilities(a) 52 71 53
Shareholder loans - - 607
Total liabilities 1,268 1,708 2,650
Shareholders' equity 296 299 (32)
Total liabilities and equity 1,564 2,007 2,619
42%60% 63%
58%
40% 37%
1,449
1,815 1,804
Mar-16 Dec-16 Mar-17
Own-brand Co-brand
(a) Other liabilities includes capitalised debt funding fees

Regulation – Credit Card Market Study (CCMS)
Persistent Debt Unsolicited Credit Line Increases (UCLIs)
• FCA Consultation Paper (4th April) includes a new Persistent Debt definition and a new outlined “escalating intervention” strategy targeted at these customers; industry consultation period ends 3 July.
• Definition:– Payments of interest, fees & charges exceed repayment of
principal over 18 months, & the outstanding balance is continually > £200
• Outlined Strategy (assumed to be effective from March 2018 (Day 1))
– Month 18: Stand-alone prompt communication required
– Month 27: Follow-up stand-alone communication required(including harder prompts and CRA flag note)
– Month 36: Paydown plan engagement needed with customers with 3 possible outcomes dependent upon customer affordability and engagement, ranging from collections activity to full card suspension
• The definition seems straight-forward but already is subject to multiple questions/challenges within UKCA – e.g. what fees should be included (default, service, annual), is the £200 threshold a continuous assessment or on-off, how should closed/paying down accounts be treated?
Next Steps/Impacts
• We will continue to actively engage in UKCA (United Kingdom Cards Association) dialogue within the consultation period, lobbying as appropriate to support outcomes in line with our NewDay Manifesto. We will monitor the situation and develop our analysis but we believe we have a range of options to drive improved customer outcomes and reduce the proportion of customers triggering Persistent Debt definitions.
• FCA Consultation Paper (4th April) has firmed up expected views.
• Within the outlined strategy an “Opt in” customer is one who needs to call within the CLI notice period in order for it to be actioned, an “Opt out” customer is one where the CLI is automatically actioned unless the customer calls in (as today).
• Outlined Strategy:– New customers: Provided with “Opt in” choice– Existing customers: “Opt in” opportunity made visible within comms– Rule 1: <110% payment ratio 7/8 months – move to “Opt in”– Rule 2: <110% payment ratio 13/14 months – exclude from CLIs– Rule 3: TBC: potential for high utilisation overlays to be applied
Next Steps/Impacts
• We will monitor the situation and develop our analysis but we believe there will be limited impacted from the potential changes. Once requirements are confirmed we can integrate delivery into our digital & front-end transformation roadmaps.
Information Remedies (agreed pre-Consultation Paper)
• New mandatory remedies industry has agreed to implement. Implementation progress being tracked by Lending Standards Board.– Promo expiry alert (final deadline – Mar-18)– Payment day choice (final deadline – Mar-18)– Credit limit proximity alert (final deadline – Jun-18)
Next Steps/Impacts
• We remain on track to deliver these within agreed FCA deadlines, and do not consider that they will have a commercial impact. They are in line with initiatives we have already delivered ourselves to support better customer outcomes and are directly in line with our NewDay Manifesto values.
21

NewDay Group Holdings
S.à r.l. (Lux)
NewDay Ltd
(UK)
NewDay Reserve
Funding Ltd (UK)
NewDay Partnership
Funding 2014-1 Plc (UK)NewDay Partnership
Funding 2015-1 Plc (UK)NewDay Funding 2015-1
Plc (UK)
NewDay Funding 2015-2
Plc (UK)
NewDay Cards Ltd
(UK)
Invicta Card Services
Limited (UK) (dormant)
NewDay Loyalty Ltd
(UK)
Progressive Credit
Limited (UK) (dormant)
SAV Credit Limited (UK)
(dormant)
NewDay Group Ltd
(UK)
NewDay Holdings
Ltd (UK)NewDay Partnership Transferor Plc (UK)
Structured Finance
Management Offshore
Limited (Jersey)
NewDay Funding Loan Note Issuer Ltd (UK)
NewDay Partnership
Securitisation Holdings Ltd (UK)
NewDay Partnership Loan Note Issuer Ltd (UK)
SFM Corporate Services
Limited (UK)
NewDay Funding
Transferor Ltd (UK)
TMF Trustee Limited
(UK)
NewDay Partnership
Secondary Funding Ltd
(UK)
NewDay Partnership
Receivables Trustee Ltd
(Jersey)
NewDay Funding
Receivables Trustee Ltd
(Jersey)
NewDay Group Structure Chart
NewDay Funding Securitisation
Holdings Ltd (UK)
Crestbridge Corporate
Trustees Limited
(Jersey)
Key
Group company
Orphan special purpose vehicles (not a group company)
Corporate services provider (not a group company)
NewDay Group (Jersey)
Limited
(Jersey)
NewDay BondCo Plc
(UK)
NewDay Group UK
Limited (UK)
NewDay UK Limited
(UK)
100%
100%
100%
100%
NewDay Funding 2016-1
Plc (UK)
CO-BRAND FUNDING STRUCTURE
100% 100%
100% (on
trust)
100% (on
trust)
100% (on trust) 100% (on trust)
100% (on trust)
100% 100%100%100%100%
100% (on trust)
OWN-BRAND FUNDING STRUCTURE
100%
TMF Trustee Limited
(UK)
NewDay Secondary
Funding Limited (UK)
NewDay UPL
Transferor Ltd
(UK)
100%
100%
100%
22