newcastle university eprintseprint.ncl.ac.uk/file_store/production/199080/0c1cee6c...md simulations...
TRANSCRIPT

Newcastle University ePrints
Watson SMD, Galindo MA, Horrocks BR, Houlton A. Mechanism of Formation
of Supramolecular DNA-Templated Polymer Nanowires. Journal of the
American Chemical Society 2014, 136(18), 6649-6655
Copyright:
This document is the Accepted Manuscript version of a Published Work that appeared in
final form in The Journal of the American Chemical Society copyright © American Chemical
Society after peer review and technical editing by the publisher.
To access the final edited and published work see http://dx.doi.org/10.1021/ja500439v
Always use the definitive version when citing.
Date deposited: 23/05/2014
Version of file: Author version
This work is licensed under a Creative Commons Attribution-NonCommercial 3.0 Unported License
ePrints – Newcastle University ePrints
http://eprint.ncl.ac.uk

Mechanism of formation of supramolecular DNA-templated polymer nanowires.
Scott M. D. Watson, Miguel A. Galindo, Benjamin R. Horrocks and Andrew Houlton*
Chemical Nanoscience Laboratories, School of Chemistry, Bedson Building, Newcastle University, Newcastle
upon Tyne, NE1 7RU (UK)
KEYWORDS DNA, templating, nanowire, supramolecular, polymer, conducting, growth mechanism
ABSTRACT: Details of the mechanism of formation of supramolecular polymer nanowires by templating on DNA
are revealed for the first time using AFM. Overall these data reveal that the smooth, regular, structures
produced are rendered by highly dynamic supramolecular transformations occurring over the micrometre scale.
In the initial stages of the process a low density of conducting polymer (CP) binds to the DNA as, essentially,
spherical particles. Further reaction time produces DNA strands which are more densely packed with particles
giving a beads-on-a-string appearance. The particles subsequently undergo dynamic reconfiguration so as to
elongate along the template axis and merge to yield the highly regular, smooth morphology of the final
nanowire. MD simulations illustrate the early stages of the process showing the binding of globular CP to duplex
DNA while the latter stages can be modelled effectively by a linear thermodynamic description based on the
balance between the line energy, which accounts for adhesion of the material to the template, and its surface
tension. This model accounts for the phenomena observed in the AFM studies: the relative success of DNA
templating of polymers compared to metals; the slow approach to equilibrium; and the observed thinning and
'necking' phenomena as the structures transform from beads-on-a-string to smooth nanowire.
INTRODUCTION
For a variety of reasons, ranging from economics to possibilities for new types of computing architectures, there
is great interest in the development of bottom-up routes to the assembly of functional electronics.1 Such an
approach requires the availability of suitable building blocks, e.g. nanowires as interconnects, and means by
which to organize these into particular circuit arrangements.2-4 Wet chemical methods, based on self-assembly,
offer simple, economical and scaleable routes to such systems and, amongst the various approaches being
explored, one based on DNA is emerging as addressing many of the necessary features for the concept.5-9 The
structure-building rules of base pairing provide a powerful means by which to design and assemble
nanostructured architectures over micron length scales. The types of structures produced include 2D lattices,10
tubes and braids,11 and 3D polyhedra.12 With the more recent development of “DNA-origami” an almost
limitless ability to design and construct geometrically complex structures has been achieved.13-16
While the ability to introduce pre-synthesised components, such as carbon nanotubes17 and Au
nanoparticles,18-21 into DNA-based nanostructures has been demonstrated, an alternative method by which to
introduce appropriate materials and functionality is offered by templating.7,22,23 Templating exploits the
ability of DNA to bind precursors of conducting materials and direct their growth along the duplex. This method
has been shown to be compatible with important material types such as metals22-26 and compound
semiconductors27 and with larger, circuit-like, DNA assemblies.28-31 32-34
More recently DNA-templating, as a method for forming nanowires, has been extended to molecular-based
conductors, such as polyaniline,35-37 polypyrrole38,39 and similar compounds.40-42 The resulting materials
are a type of supramolecular polymer43-46 as they comprise anionic duplex DNA and cationic, synthetic,
conducting polymer (CP) strands assembled by non-covalent interactions.47-50 This method has been shown to
be particularly capable of providing structures at the lower end of the nanometre scale range. These polymer
nanowires can be remarkably regular and smooth over micron lengths, in marked contrast to many cases of
similarly prepared metal-containing systems.5,51 Critically, they are conductive and can even exhibit enhanced
conductivities compared to bulk material.38,41
While the number of examples of polymer nanowires formed by DNA-templating has increased significantly
there have been, to our knowledge, no reports that explore the growth mechanism of this type of
supramolecular structure. Nanowire formation by this method relies on the complementarity of the CP chains
and the DNA duplex. A simplistic view of this process is that the CP, initially formed as short cationic oligomers,
binds to the DNA through supramolecular interactions, e.g. electrostatics plus additional non-covalent bonding,
possibly in a manner analogous to small groove-binding drug molecules.52 This, then influences the growth of
further polymer along the double-helix axis. Here, we provide, for the first time, details of the mechanism of
supramolecular nanowire formation by DNA-templating for the representative cases of poly-2,5-bis(2-
thienyl)pyrrole (poly(TPT)) and polypyrrole (poly(Py)). Atomic force microscopy, supported by multiscale
modelling, provides insight into the process and reveals a quite different mechanism compared to the simple
view. Though clearly continuous, the mechanism may be considered to pass through several, rather structurally
distinct, forms and to involve a dramatic reorganization of the CP polymer strands over an exceptionally large,
micron, length scale once bound to the DNA duplex.
RESULTS AND DISCUSSION
A typical preparation of DNA/CP nanowires involves oxidation of the appropriate monomer in DNA-containing
aqueous, or mixed solvent, solution using FeCl3.38-42 The DNA used was bacteriophage lambda as this provides
a long (48,502 bp) and monodisperse template. For reactions with 2,5-bis(2-thienyl)pyrrole (TPT) the low
aqueous solubility of the monomer requires the use of a co-solvent (MeCN), whereas for pyrrole (Py) no co-
solvent was needed. Samples were isolated from the reaction mixture at various times and deposited using
molecular combing29 onto trimethylsilane-modified Si/SiO2 surfaces for subsequent analysis by AFM. [Note:
AFM data for control experiments of reactions in the absence of DNA, showing exclusive formation of
particulate material, are provided in the SI, Figs. S1-2].
Formation of poly(TPT) nanowires. Figure 1 presents a series of typical AFM TappingModeTM images for DNA-
templating of poly(TPT) at various stages in the reaction; metrical and statistical data are displayed as well as
the results from modelling. In the AFM experiments the heights of the structures were analysed; in Stages 1 and
2 the histograms show the particle diameters and in Stages 3 and 4, where the individual particles are not so
well-defined, the local maxima in the structure were measured. The evolution of individual nanostructures is
not observable, therefore we collected a large number of images and analysed the distributions of the
heights/maxima as histograms. Samples at the early stage of reaction (Stage 1) show evidence of polymer
formation and DNA-binding. Polymer particles, considered to be globular, are found to be deposited on the
substrate as isolated structures, as well as bound along individual DNA strands (Fig 1a, column 1 and SI Figure
S3). The DNA molecule here has approximately spherical particles bound at low density with bare DNA clearly
evident between adjacent particles. The line section along the single DNA molecule in Fig. 1b, column 1,
illustrates this showing a density of ~3 particles/µm as well as the range of particle sizes along this individual
strand. Typically, a density of 2 - 5 poly(TPT) particles per micron length of the DNA template, was found at this
earliest stage. A statistical analysis of 300 DNA-bound particles, shown in the histogram (Fig. 1c, column 1)
reveals the range of particle sizes to be ~3 – 28 nm with a mean of 12.7 nm and a standard deviation of 4.8 nm.
By Stage 2 the density of the particles on the DNA strands has increased, typically 4 - 7 poly(TPT) particles per
micron length of the DNA template, however bare regions remain. This can again be appreciated in the AFM
height image (Fig. 1a, column 2) but also from inspection of the line section drawn along the individual DNA
molecule in Fig. 1b, column 2, where average density ~6 particles/µm is now found. The resulting structure can
be described as having a dense beads-on-a-string appearance. The size of the DNA-bound particles is also
increased, range 10-40 nm (Mean = 21.1 nm and standard deviation = 7.2 nm.) (Fig. 1c, column 2 and SI Fig. S4).
These are still evident as discrete bodies. Close inspection of the image (Fig. 1a, column 2) reveals however, that
whilst the majority of DNA-bound particles retain the, essentially, spherical shape of the earliest stage, some
become more prolate, extending in the direction of the template axis.
With further time (Stage 3, Fig.1, column 3) a new morphology appears where the, previously discrete, particles
have merged into one another forming an essentially continuous coverage along the template.53 The line-
section traced down the DNA molecule indicated (Fig 1b, column 3) illustrates this, as at no point is the
measured height <2 nm; the height corresponding to bare DNA. Even more striking, however, is the pronounced
change in morphology and height of the DNA-bound material. Now all the particles have changed shape,
becoming extended along the template axis with thinning/necking being evident, as particles merge. It is
important to realize that this change in morphology is not significantly as a consequence of additional CP
binding to the template. The metrical parameters (Fig 1c column 2 c.f. 3) indicate that this morphological

change actually results in a reduction in the size of the DNA-bound material as a result of the dynamic
reconfiguration of CP strands on the DNA duplex.
By the final Stage, 4, the morphology of individual strands has transformed into the highly smooth, continuous,
uniform structure of the final nanowire (Fig 1a, column 4). Here there is no longer evidence of particle-like
features. The absence of significant breaks in the structure is supported by the electrical conductivity along the
nanowires.38,41 Furthermore, the measured height of these nanowires is markedly reduced compared to the
heights of the largest particles on the template at earlier stages of the formation process (Figure 1c). A typical
diameter for the final poly(TPT) nanowire is 5-8 nm, compared with heights as large as 40 nm at earlier stages.
As stated, this clearly indicates that the new morphology is not a consequence of additional material binding to
sections of the template which was deficient of CP, but instead must arise from a dynamic reconfiguration of
the DNA-bound CP strands.
Formation of poly(Py) nanowires. In order to establish the generality of this behavior we also studied the
formation of nanowires of polypyrrole, poly(Py). Representative AFM images are shown in the Supporting
Information (Figs. S6). In this case too, essentially the same stages are noted as the reaction proceeds indicating
the similarity in the growth mechanism for these structurally-related polymers. There are, however, some
differences in the details. First, nanowire formation occurs
Figure 1. Formation of poly(TPT) nanowires at -DNA. (a) Tapping mode™ AFM images of samples isolated
deposited on TMS-modified Si/SiO2 substrates identifying four distinct stages in the formation and growth (left

to right, stages 1—4 correspond to ~10 mins. 1, 4, 24 hrs.) (b) The corresponding line section along the template
DNA shown in the images in (a) for each stage. (c) Histograms showing the distribution of nanoparticle or
nanowire heights determined from AFM images of 300 particles. (d) Multiscale modelling results. Left-right: MD
simulation at 80 ps of nucleation (Stage 1) and histograms from our coarse-grained linear thermodynamics
model for the transitions between stages 2-3-4.
more rapidly for poly(Py) compared to poly(TPT). Also, even structures with a low density of particles bound to
DNA show evidence of the elongation of the poly(Py) particles along the template axis. These differences are
perhaps explained by the increased hydrophilicity of the former material; hydrophobic effects will make
poly(TPT) nuclei slower to uncoil and rearrange along the template. The overall process is depicted in Scheme 1
which shows the evolution of the final nanowire structure. This comprises a DNA core with CP strands aligned,
to some extent, along the helix axis. It is useful to consider an approximate composition of nanowires of average
size. A simple representation of a 6 nm diameter nanowire as comprising two cylinders, a 2 nm core of duplex
DNA, and the remaining outer shell CP gives, based on molecular volumes, a nanowire with ~120 polymer
strands per DNA duplex. This high CP:DNA strand ratio suggests a relatively small number of DNA…CP
interactions compared to CP…CP or CP…solvent interactions. Also, for a typical level of oxidation (one charge
per 4 rings)54 the overall nanowire would bear a high cationic charge as the DNA phosphodiester groups are not
sufficient to provide the necessary charge balance. As a result, the association of anions, e.g chloride, would be
expected and are evident in XPS analysis.41,42 In fact, we find that additional DNA strands can become
incorporated into the DNA/CP structure as the nanowire growth process proceeds. This can be judged by
structure lengths that are longer than individual λ-DNA molecules and by branching, even for Stages 1/2 (see SI
Figures S7-9). This process is in addition to the previously discussed “nanorope” formation39 which also
provides the means by which extended length structures form.
Multiscale modelling of polymer nanowire formation. As depicted in Scheme 1 we propose the following
general mechanism for the formation of smooth, highly regular DNA-templated nanowires. In the first stage of
the reaction (Stage 1), oxidation of the monomer forms cationic CP chains, some of which bind to DNA template
molecules through supramolecular interactions (electrostatics, hydrogen bonding, van der Waals forces). The
formation of such interactions is supported by FTIR spectroscopy, as discussed previously.42 Initially, the CP
chains adopt highly folded, globular, structures which are observed as essentially-spherical particles along
individual DNA duplex. These
Scheme 1. Stages in the growth mechanism of supramolecular DNA-templated polymer nanowires. (1) Initial
polymerisation yields a number of small polymer particles which bind to, or nucleate on, the template DNA. (2)
The density and size of particles on the template increases producing a “beads-on-a-string” appearance. (3)
Transformation of the shape of the DNA-bound polymer particles from spherical to prolate ellipsoids driven by
the maximisation of the favourable free energy of adhesion to the template (4) The final smooth wire-like
structure is formed, with diameter markedly smaller than the individual particle sizes at earlier stages.

globular structures gradually spread along the helical axis and eventually merge to produce smooth nanowires
(Stages 3 → 4). We have investigated the formation of the initial nuclei (Stage 1) using molecular dynamics
simulations. However, the time-scale, hours, for the transformations from Stages 2 → 3 → 4 (Scheme 1) is far
too long for atomistic simulation. The latter
stages are modelled using a coarse-grained approach55 described below.
Molecular Dynamics. Figure 2 shows snapshots from a 1000ps simulation containing a 50-mer DNA duplex and a
(polyPy)250 strand. This illustrates the formation of a globular particle of the latter bound to the template DNA.
Similar results were observed for starting geometries involving either essentially parallel or orthogonal
alignment of the two types of polymers. In the early part of the trajectory, after initial interaction between the
two polymer strands, the formation of the globular CP particle is promoted by rotation of the DNA about its axis.
The structures in Stages 1 and 2 clearly contain CP that has neither maximised the available supramolecular
interactions with the template and/or other CP strands nor attained a preferred conformation. The resulting
structures are kinetic products of the initial, random, binding.
As the reaction proceeds, and evident from the AFM data, more CP strands bind, increasing the density of
particles along the template molecule (Stage 2). Also, there is an increase in particle size, from deposition of
more polymer chains, and/or further polymerization. The transition Stage 1→ 2 cannot be captured by our
coarse-grained model because the linear thermodynamics only applies close to equilibrium and the process
depends on details of the nucleation steps and atomic-scale interactions.
Coarse-grained model. The maximum reaction times which can be simulated by MD are of the order of ns and
therefore can provide information on the early nucleation events (Stage 1), but the growth of the nanowires
and the changes in their morphology (2→3→4) which are observed over periods of hours are not accessible to
atomistic simulations. Instead, we have developed a coarse-grained thermodynamic model which treats the
growth process in a manner similar to a morphological wetting transition.56 The changes in morphology are
assumed to be governed by similar forces to the wetting of fibers, i.e., the surface tension of the templated
material and the free energy of adhesion of CP to the DNA template.55,57,58 Under the assumption of linear
thermodynamics and radial symmetry this leads to an evolution equation for the thickness (h) of the templated
material of the form:
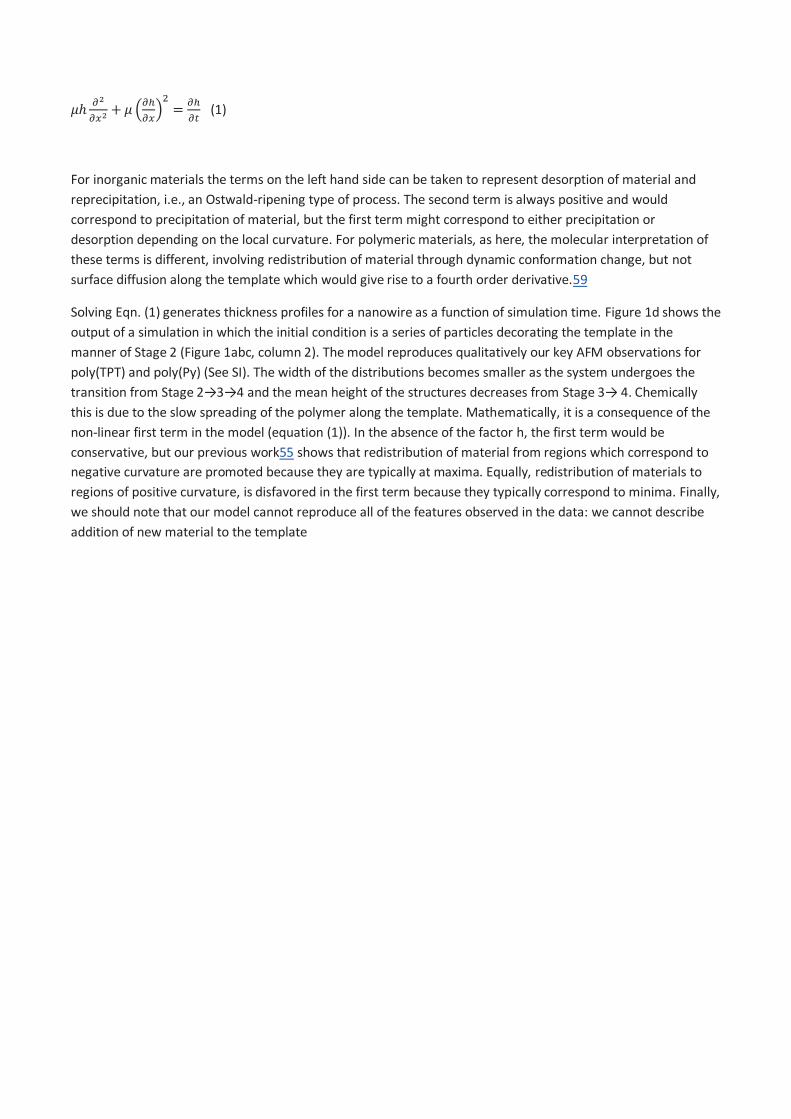
(1)
For inorganic materials the terms on the left hand side can be taken to represent desorption of material and
reprecipitation, i.e., an Ostwald-ripening type of process. The second term is always positive and would
correspond to precipitation of material, but the first term might correspond to either precipitation or
desorption depending on the local curvature. For polymeric materials, as here, the molecular interpretation of
these terms is different, involving redistribution of material through dynamic conformation change, but not
surface diffusion along the template which would give rise to a fourth order derivative.59
Solving Eqn. (1) generates thickness profiles for a nanowire as a function of simulation time. Figure 1d shows the
output of a simulation in which the initial condition is a series of particles decorating the template in the
manner of Stage 2 (Figure 1abc, column 2). The model reproduces qualitatively our key AFM observations for
poly(TPT) and poly(Py) (See SI). The width of the distributions becomes smaller as the system undergoes the
transition from Stage 2→3→4 and the mean height of the structures decreases from Stage 3→ 4. Chemically
this is due to the slow spreading of the polymer along the template. Mathematically, it is a consequence of the
non-linear first term in the model (equation (1)). In the absence of the factor h, the first term would be
conservative, but our previous work55 shows that redistribution of material from regions which correspond to
negative curvature are promoted because they are typically at maxima. Equally, redistribution of materials to
regions of positive curvature, is disfavored in the first term because they typically correspond to minima. Finally,
we should note that our model cannot reproduce all of the features observed in the data: we cannot describe
addition of new material to the template

Figure 2. Representative structures selected from a MD simulation of poly(Py)250 with a 50-mer DNA duplex
after, from top left to bottom right, 28, 36, 54, 66, 80 and 100 pico secs. No notable change in structure was
evident between 100 ps (bottom right image) and the end of the simulation (1000 ps).
without considering the details of the initial nucleation events. It is also clear that in some AFM images
nanowires in different stages are seen. A theoretical description of this requires a stochastic rather than a
deterministic model and must include a distribution of nucleation times. Nevertheless, the coarse-grained
model presented has the advantage of simplicity and makes two practical predictions useful for the successful
formation of smooth nanowires: (i) the process will work best for materials of low surface energy, i.e., regular,
smooth nanowires will be easier to prepare for CP than metals ( ≈1000 mN m-1 for copper60 versus ≈ 30-50
mN m-1 for typical organic polymers61) and (ii) the transformation to smooth nanowires is slow because

equation(1) has a form similar to a diffusion equation and at long times h varies with t-1/2 rather than
exponentially as for simple chemical reactions.
CONCLUSIONS
These studies reveal details of the mechanism of formation of conductive supramolecular nanowires using DNA-
templating. The key factor that enables these conducting polymers to produce the regular nanowire structure is
the ability to re-organize on the template once bound. The thermodynamic driving forces are (i) maximization of
the available supramolecular interactions (DNA…CP and CP…CP) and (ii) reduction of the surface energy leading
to the smooth regular structure of the final nanowire. This is possible due to the reversible nature of the
supramolecular interactions. The regularity of these polymeric DNA-templated nanowires is in marked contrast
to those formed by other materials, particularly metals,62 which usually show highly granular and sometimes
dendritic morphologies. This smooth uniform covering of the template with little apparent defects was also
evident from the electrical conductivity along the nanostructures.38,41,42 Finally, the successful formation of
smooth nanowires is the result of a slow reorganization of material on the template and sufficient time must be
allowed, typically much greater than the time for the polymerization reaction.
Funding Sources
EU-FP7 LAMAND (Contract no. 245565) and EU ITN NANOEMBRACE (Contract no. 316751).
REFERENCES
(1) Lu, W.; Lieber, C. M. Nature Mater. 2007, 6, 841.
(2) Huang, Y.; Duan, X.; Wei, Q.; Lieber, C. M. Science 2001, 291, 630.
(3) Agarwal, R.; Ladavac, K.; Roichman, Y.; Yu, G.; Lieber, C. M.; Grier, D. G. Opt. Expr. 2005, 13,
8906.
(4) Yu, G.; Lieber, C. M. Pure Appl. Chem. 2010, 82, 2295.
(5) Braun, E.; Keren, K. Adv. Phys. 2004, 53, 441.
(6) Seeman, N. C. Ann. Rev. Biochem. 2010, 79, 65.
(7) Houlton, A.; Watson, S. M. D. Annu. Rep. Prog. Chem. A 2011, 107, 21.
(8) Service, R. F. Science 2011 332 1140
(9) Becerril, H. A.; Woolley, A. T. Chem. Soc. Rev. 2009 38 329.
(10) Winfree, E. Nature 1998, 394, 539.
(11) Dietz, H.; Douglas, S. M.; Shih, W. M. Science 2009, 325, 725.
(12) Seeman, N. C. Nature 2003, 421, 427.
(13) Rothemund, P. W. K. Nature 2006, 440, 297.

(14) Li, H.; Carter, J. D.; LaBean, T. H. Mater. Today 2009, 12, 24.
(15) Nangreave, J.; Han, D.; Liu, Y.; Yan, H. Curr. Opin. Chem. Biol. 2010, 14, 608.
(16) Ke, Y. G.; Ong, L. L.; Shih, W. M.; Yin, P. Science 2012, 338, 1177.
(17) Keren, K.; Berman, R. S.; Buchstab, E.; Sivan, U.; Braun, E. Science 2003, 302, 1380.
(18) Mirkin, C. A. Inorg. Chem. 2000, 39, 2258.
(19) Macfarlane, R. J.; O'Brien, M. N.; Petrosko, S. H.; Mirkin, C. A. Angew. Chem. Int. Ed. 2013, 52,
5688.
(20) Kim, Y.; Macfarlane, R. J.; Mirkin, C. A. J. Am. Chem. Soc. 2013, 135 10342.
(21) Macfarlane, R. J.; Jones, M. R.; Lee, B.; Auyeung, E.; Mirkin, C. A. Science 2013, 341.
(22) Braun, E.; Eichen, Y.; Sivan, U.; Ben-Yoseph, G. Nature 1998, 391, 775.
(23) Becerril, H. A.; Stolenberg, R. M.; Wheeler, D. R.; Davis, R. C.; Harb, J. N.; Woolley, A. T. J. Am.
Chem. Soc. 2005, 127, 2828.
(24) Al Hinai, M.; Wright, N.; Horsfall, A.; Hassanien, R.; Horrocks, B.; Houlton, A.; Ieee 2011 IEEE
Sensors 2011, 1.
(25) Al-Said, S. A. F.; Hassanien, R.; Hannant, J.; Galindo, M. A.; Pruneanu, S.; Pike, A. R.; Houlton, A.;
Horrocks, B. R. Electrochemistry Communications 2009, 11, 550.
(26) Watson, S. M. D.; Wright, N. G.; Horrocks, B. R.; Houlton, A. Langmuir 2009, 26, 2068.
(27) Houlton, A.; Pike, A. R.; Galindo, M. A.; Horrocks, B. R. Chem. Commun. 2009, 1797.
(28) Yan, H.; Park, S. H.; Finkelstein, G.; Reif, J. H.; LaBean, T. H. Science 2003, 301, 1882.
(29) Deng, Z.; Mao, C. Nano Lett. 2003, 3, 1545.
(30) Park, S. H.; Barish, R.; Li, H. Y.; Reif, J. H.; Finkelstein, G.; Yan, H.; LaBean, T. H. Nano Lett. 2005, 5,
693.
(31) Becerril, H. A.; Stoltenberg, R. M.; Wheeler, D. R.; Davis, R. C.; Harb, J. N.; Woolley, A. T. J. Am.
Chem. Soc. 2005, 127, 2828.
(32) Geng, Y. L.; Liu, J. F.; Pound, E.; Gyawali, S.; Harb, J. N.; Woolley, A. T. J. Mater. Chem. 2011 21
12126.
(33) Liu, J. F.; Geng, Y. L.; Pound, E.; Gyawali, S.; Ashton, J. R.; Hickey, J.; Woolley, A. T.; Harb, J. N.
ACS Nano 2011 5, 2240.
(34) Geng, Y. L.; Pearson, A. C.; Gates, E. P.; Uprety, B.; Davis, R. C.; Harb, J. N.; Woolley, A. T.
Langmuir 2013, 29, 3482.
(35) Nagarajan, R.; Liu, W.; Kumar, J.; Tripathy, S. K.; Bruno, F. F.; Samuelson, L. A. Macromol. 2001,
34, 3921.
(36) Ma, Y.; Zhang, J.; Zhang, G.; He, H. J. Am. Chem. Soc. 2004, 126, 7097.
(37) Nickels, P.; Dittmer, W. U.; Beyer, S.; Kotthaus, J. P.; Simmel, F. C. Nanotechnology 2004, 15,
1524.
(38) Dong, L.; Hollis, T.; Fishwick, S.; Connolly, B. A.; Wright, N. G.; Horrocks, B. R.; Houlton, A.
Chemistry Eur. J. 2007, 13, 822.
(39) Pruneanu, S.; Al-Said, S. A. F.; Dong, L.; Hollis, T. A.; Galindo, M. A.; Wright, N. G.; Houlton, A.;
Horrocks, B. R. Adv. Funct. Mater. 2008, 18, 1.
(40) Hannant, J.; Hedley, J. H.; Pate, J.; Walli, A.; Farha Al-Said, S. A.; Galindo, M. A.; Connolly, B. A.;
Horrocks, B. R.; Houlton, A.; Pike, A. R. Chem. Commun. 2010, 46, 5870.
(41) Hassanien, R.; Al-Hinai, M.; Farha Al-Said, S. A.; Little, R.; Siller, L.; Wright, N. G.; Houlton, A.;
Horrocks, B. R. ACS Nano 2010, 4, 2149.
(42) Watson, S. M. D.; Hedley, J. H.; Galindo, M. A.; Al-Said, S. A. F.; Wright, N. G.; Connolly, B. A.;
Horrocks, B. R.; Houlton, A. Chemistry-a European Journal 2012, 18, 12008.
(43) Ikeda, M.; Nobori, T.; Schmutz, M.; Lehn, J. M. Chemistry Eur. J. 2005 11, 662.
(44) Sreenivasachary, N.; Hickman, D. T.; Sarazin, D.; Lehn, J. M. Chemistry Eur. J. 2006 12 8581.
(45) Ustinov, A.; Weissman, H.; Shirman, E.; Pinkas, I.; Zuo, X.; Rybtchinski, B. J. Am. Chem. Soc. 2011,
133, 16201.
(46) Llanes-Pallas, A.; Yoosaf, K.; Traboulsi, H.; Mohanraj, J.; Seldrum, T.; Dumont, J.; Minoia, A.;
Lazzaroni, R.; Armaroli, N.; Bonifazi, D. J. Am. Chem. Soc. 2011, 133, 15412.
(47) The elegant work of Schuster et al. offers an alternative route to materials comprising DNA and
organic groups suitable for forming CP, such as TPT and aniline.[48-50] This approach is quite different however,
as it is involves strong covalent bonding between the CP and the DNA rather than supramolecular interactions,
as here.
(48) Chen, W.; Guler, G.; Kuruvilla, E.; Schuster, G. B. Macromolecules 2010, 43, 4032.
(49) Chen, W.; Josowicz, M.; Datta, B.; Schuster, G. B.; Janata, J. Electrochem. Solid State Lett. 2008,
11, E11.
(50) Chen, W.; Schuster, G. B. J. Am. Chem. Soc. 2013, 135, 4438.
(51) Richter, J.; Seidel, R.; Kirsch, R.; Mertig, M.; Pompe, W.; Plaschke, J.; Schackert, H. K. Advanced
Materials 2000, 12, 507.
(52) Blackburn, G. M.; Gait, M. J. Nucleic Acids in Chemistry and Biology; 2nd ed.; OUP: Oxford, 1997.
(53) Whilst AFM tip convolution effects may prevent sufficiently small breaks in the coatings from
being resolved support for the claim, that the CP nanowires are continuous, is provided by their demonstrated
electrically conducting nature.
(54) Bredas, J. L.; Street, G. B. Acc. Chem. Res. 1985, 18, 309.
(55) Watson, S. M. D.; Houlton, A.; Horrocks, B. R. Nanotechnology 2012, 23, 505603.
(56) Lipowsky, R. Curr. Opin. Colloid Interface Sci. 2001, 6, 40.
(57) Brochard, F. J. Chem. Phys. 1986, 84, 4664.
(58) Lukas, D.; Pan, N. Polymer Composites 2003, 24, 314.
(59) Wolf, D. E.; Villain, J. Europhys. Lett. 1990, 13, 389.
(60) Udin, H.; Shaler, A. J.; Wulff, J. Trans. AIME 1949 185 186.
(61) http://www.accudynetest.com/polytable Downloaded January 2014.
(62) Richter, J.; Mertig, M.; Pompe, W.; Monch, I.; Schackert, H. K. Appl. Phys. Lett. 2001, 78, 536.
