new york state thruway financial requirements and proposed ... · new york state thruway financial...
TRANSCRIPT

Cover image area approx. 9 1/8” x 3 3/8”
New York State Thruway Financial Requirements
and Proposed Toll Adjustments 2012-2016
May 2012
Submitted by:
Jacobs Civil Consultants, Inc. 2 Penn Plaza, Suite 603
New York, NY 10121
Submitted to: New York State Thruway Authority
Two Penn Plaza, Suite 0603 New York, New York, 10121
Page 1 of 3
May 2012 Mr. Thomas J. Madison, Jr. Executive Director New York State Thruway Authority 200 Southern Boulevard Albany, NY, 12209
Dear Mr. Madison: This reports serves to respond to the requirements contained in Section 2804 of the Public Authorities Law and also the requirements of the General Revenue Bond Resolution, Section 609(1)(b) with respect to the New York State Thruway Authority (“Authority”). Section 2804 specifies that public authorities should provide, prior to the consideration of any future increase in tolls or fees for any highway, bridge or tunnel in New York State, a detailed report of the need and the implication of such change in tolls or fees. The report specifically responds to paragraphs a) the need for such an increase, b) the Authority’s revenues and expenses during the prior three fiscal years, e) future Authority operations, debt service and capital construction together with estimated future receipts and expenditures for the next five fiscal years, and f) projections and estimates as to the effect the proposed increases on future uses of the facilities and future revenues which will accrue as a result of the proposed increase. The Authority has provided their 2011 independent audit that responds to paragraphs c) its assets and liabilities at the end of the last fiscal year and d) a schedule of bonds and notes outstanding at the end of its fiscal year. Section 609 (1)(b) of the General Revenue Bond Resolution requires that an Independent Consultant review the schedule of tolls, fees and charges to insure that they provide sufficient Net Revenues to comply with that section’s revenue covenant. Satisfaction of those requirements of the revenue covenant will allow the Authority to meet its fiduciary obligations including those under Section 608 to operate the Thruway in a sound and economical manner and to maintain, preserve and reconstruct the Thruway in a state of good repair. As the Thruway prepares to enter its seventh decade of operation, the need for reconstruction and rehabilitation of the aging infrastructure continues to require high levels of investment. At the same time, travelers on the roadway are experiencing delays resulting from congested traffic volumes. To continue to keep the infrastructure in acceptable condition and to provide the needed operational and service improvements the Authority

Page 2 of 3
developed and is implementing a Capital Program for the period 2012 to 2015 exclusive of the investment that will be made for the new Tappan Zee Bridge program. This report provides a baseline of projection of revenues and expenses for the Authority, as well as debt service and other funds through 2016, assuming a continuation of the present toll schedule and full implementation of the Capital Program for the period from 2012 through 2015. In this baseline case, operational deficits and very low Pay‐As‐You‐Go financing levels are anticipated beginning in 2013 of the Multi‐Year Financial Plan. However, of particular concern, debt service coverage ratios (the ratio of Net Revenues to Debt Service) beginning in the first year (2012) of the forecast is bellow limits established in the Authority’s Board‐adopted Fiscal Management Guidelines and the requirements of the General Revenue Bond Resolution are not met in the second year (2013) of the forecast. Accordingly, Jacobs has been retained to, in consultation with the Authority, recommend a schedule of toll rates that will complement their cost containment and operational streamlining efforts to allow the Authority to sustain healthy financial metrics through the end of 2013 and provide a foundation for the future development and implementation of a financing plan for the Tappan Zee Bridge Project. It is important to understand that the current design‐build procurement process for the replacement of the Tappan Zee Bridge is underway and a more complete picture of the cost of the new Tappan Zee Bridge, and any potential Federal aid for this important project or other capital purposes, will not be available until later this year. At that time, the Authority intends on advancing a long‐term plan to finance the construction of the new Tappan Zee Bridge and allow the Authority to meet its other future capital, operational, and maintenance needs. The proposed toll schedule would increase, on average, commercial toll rates for all classes, except 2H, by 45%. We have estimated the effects of these proposed toll adjustments on traffic, both in terms of the potential loss off traffic and shifts of traffic. In our opinion, if implemented in full, the toll adjustments will results in small changes to traffic patterns and provide adequate revenues to fund, to a reasonable level, the Pay‐As‐You‐Go portion of the capital program, to pay for the necessary maintenance and operating expenses, to maintain the necessary levels of coverage on the revenue bond debt service, to meet the covenants of the of the General Revenue Bond Resolution and the requirements of the Authority’s Fiscal Management Guidelines for the forecast period through the end of 2015. Specifically, we concur with the Authority, that the proposed toll adjustments analyzed in this report will comply with the covenant set forth in Section 609(1)(b) of the General Revenue Bond Resolution for the duration of the Multi‐Year Capital Program through 2015. It will also allow the Authority to comply with the operating and maintenance covenants of the Thruway set forth in Section 608 of the general Revenue Bond Resolution. With the recommended toll adjustments and planned operational efficiencies and streamlining, the Authority’s Capital Program exclusive of the new Tappan Zee Bridge Project can be fully implemented providing for the needed reconstruction and assuring the

Page 3 of 3
maintenance of the current condition of the highways and bridges. As a result we believe the Authority will continue to be able to provide good service to its customers and will continue to fulfill its critical role in supporting the State’s economy through the forecast period. It is anticipated that further actions may be taken to address the financing of the new Tappan Zee Bridge and may also be required during the final year of the 2012‐2015 Multi‐Year Capital program when the debt service coverage ratios fall below the Authority Board’s adopted Fiscal Management Guidelines. We would like to thank the authority staff for all of their assistance in the preparation of this report.
Sincerely,
Richard J. Gobeille, P.E. National Toll / Finance Unit Manager Jacobs Civil Consultants, Inc.

i
Table of Contents
I. Introduction ........................................................................................................................................ I‐1
II. The New York State Thruway & Canal System ................................................................................... II‐1
A. The Thruway System ...................................................................................................................... II‐1
1. Roadways ................................................................................................................................... II‐2
2. Bridges........................................................................................................................................ II‐3
3. Service Areas .............................................................................................................................. II‐4
4. Safety, Incident Response and Traveler Information Systems .................................................. II‐4
5. Annual Routine Maintenance Activities ..................................................................................... II‐5
B. Mandated Additions to the Authority ........................................................................................... II‐5
C. The New York State Canal System ................................................................................................. II‐6
III. Historical Review of the Authority’s Finances .............................................................................. III‐1
A. Operating and Maintenance Expenses ......................................................................................... III‐1
B. Capital Expenditures ..................................................................................................................... III‐2
C. Debt Service Expenses .................................................................................................................. III‐5
D. Revenues ....................................................................................................................................... III‐5
1. Traffic and Toll Revenues .......................................................................................................... III‐5
2. Other Revenues ........................................................................................................................ III‐7
E. Historical Flow of Funds Analysis .................................................................................................. III‐8
IV. Special Reports and Analysis ........................................................................................................ IV‐1
A. The Impact of Infrequent Toll Adjustments on Authority Finances ............................................ IV‐1
B. The Economic Impact of the Authority’s Capital, Operating and Maintenance Activities on the
New York State Economy ..................................................................................................................... IV‐2
C. Thruway Trips and Customers ..................................................................................................... IV‐3
V. 2012‐2015 Multi‐Year Capital Program ............................................................................................ V‐1
A. Program Details ............................................................................................................................. V‐1
B. The New Tappan Zee Bridge Project ............................................................................................. V‐2
C. Planned Capital Program Expenditures ........................................................................................ V‐3
D. The Impact of the 2012‐2015 Capital Program on Conditions ..................................................... V‐4
VI. Expenses and Revenues with the Current Toll Schedule ............................................................. VI‐1
A. Projected Operating and Maintenance Expenses ........................................................................ VI‐1

ii
B. Projected (Non‐Tappan Zee) Debt Service Expenses ................................................................... VI‐1
C. Projected Toll and Other Revenues ............................................................................................. VI‐2
D. Total Sources and Uses ................................................................................................................ VI‐3
E. Flow of Funds Analysis with Current Toll Schedule ..................................................................... VI‐5
VII. Proposed Modifications to Current Toll Rates and the Impact to the Authority’s Financials .... VII‐1
A. Current Toll Rates ....................................................................................................................... VII‐1
B. Recommended Increase to Commercial Tolls ............................................................................ VII‐1
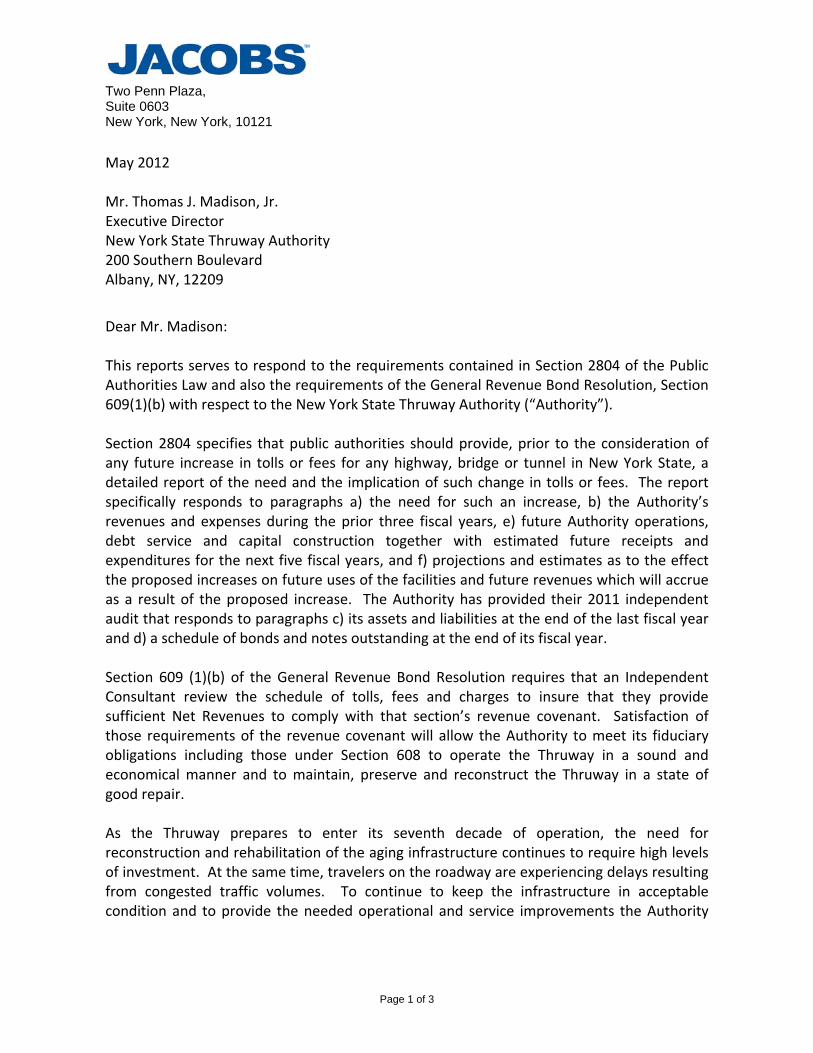
C. Toll and Other Revenues ............................................................................................................. VII‐5
D. Funding Requirement and Sources ............................................................................................. VII‐8
VIII. SUMMARY OF FINDINGS ............................................................................................................ VIII‐1
Table of Appendices
Appendix A ‐ Hypothetical Toll Analysis
Appendix B ‐ Economic Impact of the Thruway Authority Investments and Operations

Page I‐1
I. Introduction Since its opening more than 55 years ago, the New York State Thruway (“Thruway”) has served as the
central artery of the State’s transportation system, providing a vital link between its major cities from
the Atlantic Ocean to Canada and the Great Lakes. Over the years, the Thruway Authority (“Authority”)
has taken actions that have allowed for safe and efficient travel for millions of passenger and
commercial customers.
The Thruway serves travelers with a variety of needs and purposes, including commuters, business
travelers, recreational travelers, and commercial vehicle traffic. The Thruway has provided a
dependable roadway system for these travelers, sustaining and encouraging economic growth, fostering
job creation and generating tax revenues to the State and its local governments. Underscoring its
importance to the state, region and nation, in 2011 Thruway customers traveled approximately 8.1
billion vehicle‐miles on the highway, averaging almost 22.1 million vehicle‐miles per day.
Significant capital improvements and maintenance work is undertaken each year to keep its highways
and bridges in a state of good repair, ensuring safe and efficient travel for the heavy traffic demands of
today’s world. In addition to on‐going capital and maintenance tasks, the Thruway is also continually
evolving to better serve its patrons, improving customer service with advances in technology and adding
new capacity to highways and bridges in the corridors with high travel demand. Furthermore, the
Thruway has the responsibility of maintaining the reliability of the historic Canal System, ensuring that it
remains a viable waterway for boating, shipping and recreation and an important component of New
York State’s economy.
Over the last several years, the Authority has faced substantial challenges that have strained its ability to
maintain its financial strength while financing the capital needs of the aging Thruway and Canal Systems.
Principal among these challenges, the Authority had to manage budgets with historic declines in traffic
and toll revenues resulting from high and volatile fuel prices, a deep and lengthy national and state
recession and a slow and protracted recovery period. As experienced by other toll facilities across the
nation, the number of trips and the length of trips taken by Thruway patrons have markedly declined
over the past four years and traffic is not expected to reach pre‐recession levels for many years to come.
In addition, the prevalence of high fuel and construction commodity prices has placed enormous
pressure on the Authority’s operating budgets and capital programs, as have considerable declines in
Federal aid allocated to support its growing infrastructure and service needs.
During these times of financial stress, the Authority downsized and reconfigured its capital program,
implemented operational cost controls and issued short‐term notes to bridge capital funding gaps. It is
important to note that prior toll adjustments were originally designed to only provide sufficient
revenues to finance the recently completed 2005‐2011 Capital Program. As a result, in order for the
Authority to successfully meet its future growing capital needs, refinance outstanding short term debt
and provide reliable service to its patrons, additional revenues are needed at this time to complement
enhanced operational streamlining efforts.

Page I‐2
It is only with these additional revenue actions that the Authority will be able to refinance its
outstanding short‐term debt, continue to maintain its highway, bridge and canal systems in a state of
good repair, fulfill its critical role in supporting the State’s recovering economy and meet bondholder
covenants established under its General Revenue Bond Resolution (“Bond Resolution”).
Accordingly, in accordance with Section 609(1)(b) of the Bond Resolution, Jacobs has been retained to
produce this study and recommend a schedule of toll rates that will allow the Authority to sustain
healthy financial metrics through the end of 2013, providing a foundation for the future development of
a financing plan for the Tappan Zee Bridge Project. It is important to understand that the current
design‐build procurement process for the replacement of the Tappan Zee Bridge is underway and a
better understanding of the cost of the new Tappan Zee Bridge and any potential Federal aid or
financing assistance for this important project or other capital purposes, will not be available until later
this year. At that time, the Authority intends to advance a long‐term plan to finance the construction of
the new replacement Tappan Zee Bridge and allow the Authority to meet its other future capital,
operational, and maintenance needs.
Based on this strategy, Jacobs recommends that the Authority complement its planned operational
streamlining program with a 45 percent adjustment to commercial toll rates in 2012. However, in an
effort to lessen the impact on local businesses that rely on the Thruway System, this recommended toll
adjustment would exclude commercial vehicle with two‐axles and over seven feet six inches in height
(2H). The impact of the streamlining program and the recommended toll action on the Authority’s
revenues and long‐term financial plan is described in more detail herein.

Page II‐1
II. The New York State Thruway & Canal System The following sections provide an overview of the Thruway System and the Authority’s responsibilities.
A. The Thruway System At 570 miles in length, the New York State Thruway is one of the largest tolled highway systems in the
United States and is a critical component in the national interstate network. The Thruway connects the
principal cities of the State from New York City to Albany, and on to Utica, Syracuse and Rochester
through to Buffalo and the Pennsylvania State Line. The Thruway corridor serves 37 of the State’s 62
counties and the majority of the State’s population. Approximately 245.2 million toll transactions
occurred on the Thruway in 2011, generating about $634.1 million in toll revenues.
The Thruway is an important interstate connector, joining with the Massachusetts Turnpike (I‐90),
Connecticut Turnpike (I‐95), New Jersey’s Garden State Parkway, as well as several other Interstate
routes such as I‐287 from New Jersey; I‐90 in Pennsylvania; I‐290 around the north side of Buffalo; I‐390
and I‐490 serving Rochester; I‐81, I‐481 and I‐690 at Syracuse; I‐790 in Utica; I‐87 (the Northway), I‐88, I‐
90, I‐787, and I‐890 at Albany; and I‐84 at Newburgh. It also makes direct connections with numerous
major State highways.
The Thruway is comprised of two types of toll systems – a controlled (ticket) system and a barrier
system. The controlled system (approximately 481 miles) makes up the largest portion of the Thruway,
running from Woodbury (in the southeast corner of the State) north along I‐87 to Albany, then west on
I‐90 to Buffalo and south of Lake Erie to the Pennsylvania border. In addition to this main stretch of the
controlled system, there is a small branch south and east of Albany providing a connection to the
Massachusetts border and the I‐90 Massachusetts Turnpike.
On the controlled system, tolls are charged based on the actual distance traveled by the customer.
Meanwhile, barrier toll plazas have a fixed toll rate for each vehicle class and payment type (e.g., Cash,
E‐ZPass, as well as Commuter and other E‐ZPass Discounts). The barrier systems (one located in the
southeast corner of the State and the other located in the northwest corner of the State) are comprised
of the Tappan Zee Bridge, Yonkers Barrier, New Rochelle Barrier, Spring Valley Barrier, Harriman Barrier
and the Grand Island Bridges. Under the existing policy, toll rates across the system are based on the
vehicle classification, related to the number of axles per vehicle and the height of the vehicle over the
first two axles.
It is important to note that there are portions of the roadways under the Thruway jurisdiction that are
currently toll‐free. These include a nine‐mile section in the Buffalo area between the controlled
sections; I‐190 between Buffalo and Grand Island; I‐90 between Albany (Interchange 24) and I‐88
(Interchange 25A); and the Cross Westchester Expressway (I‐287). In addition, there are stretches of
roadway on the sections with fixed‐toll barriers where short trips can be made without passing through
a toll barrier.

Page II‐2
Figure II‐1: New York State Thruway Toll Systems
1. Roadways The original 2,800 lane mile Thruway roadway system was constructed between 1949 and 1960 and is
one of the oldest components of the national Interstate Highway System. In 1991, State legislation
made the Authority additionally responsible for the operation and maintenance of 11 miles of I‐287
Cross‐Westchester Expressway. The New York State Department of Transportation (NYSDOT) remains
responsible for capital improvements to this roadway. The Thruway System is now over 570 total miles
in length and includes 134 interchanges. The various sections of roadway currently maintained by the
Authority are listed in Table II‐1.
Thruway pavements are typically nine inches of reinforced Portland cement concrete placed on 12
inches of granular sub‐base. Shoulders are made up of treated granular material with asphaltic wearing
surface. A large portion of the roadway’s base dates back to its original construction, highlighting the
need for heavy maintenance, reconstruction and rehabilitation activities to retain the riding surface in a
state of good repair.

Page II‐3
Table II‐1: The Thruway System
Section Controlled Section
Barrier Section
Length (in Miles)
The Mainline (New York City ‐ Buffalo) x x 426
Erie Section (Buffalo ‐ Pennsylvania Line) x 70
Niagara Section I‐190 (Buffalo ‐ Niagara Falls) x 21
Berkshire Section (Selkirk ‐ Massachusetts Line) x 24
New England Section (I‐95) (Bronx ‐ Connecticut Line) x 15
Garden State Parkway Connection (Spring Valley ‐ New Jersey)
3
Cross Westchester Expressway (I‐287) (Mainline I‐87 in Tarrytown ‐ I‐95 in Rye)
11
Total 570
2. Bridges The Authority has maintenance responsibility for 811 bridges that carry local roads and state highways
over the Thruway System. The structural characteristics of these bridges vary: about 15 percent are
concrete structures, either pre‐stressed girder, arch, rigid frame or box culverts. The remaining 85
percent of the bridges are steel structures with asphalt overlaid, reinforced concrete decks. As with the
roadway, an overwhelming majority of the structures date back to the original opening of the Thruway
System in the 1950’s and require continual and significant repair, rehabilitation and reconstruction
investments to prevent deteriorating conditions.
By far, the largest bridge on the Thruway System is the Tappan Zee Bridge over the Hudson River,
located approximately 20 miles north of New York City. The Tappan Zee Bridge was opened to traffic in
1956 and is a three‐mile long multi‐span steel truss, deck truss and girder type structure. Due to its size
and importance, a permanent Authority maintenance team is assigned to the Tappan Zee Bridge. The
Tappan Zee Bridge routinely experiences peak hour traffic volumes that are 40 percent higher than
normal operational volumes and to increase the Bridge’s one‐way traffic capacity, a movable barrier
provides for the reversal of one of the seven traffic lanes to help accommodate directional peak traffic
volumes. As described in more detail later in this report, the Tappan Zee Bridge is scheduled to be
replaced in the near future.
Besides the Tappan Zee Bridge, the Thruway consists of seven other major bridge structures. These
include the Castleton‐on‐Hudson Bridge across the Hudson River on the Berkshire Section; the four
Grand Island Bridges spanning branches of the Niagara River north of Buffalo; the mile long Niagara
Viaduct, and the Byram River Bridge on the New England Section.

Page II‐4
3. Service Areas The Authority owns 27 travel plazas located at intervals along the Thruway System, operated by three
food service concessionaires: HMS Host Family Restaurants, Inc. (12 plazas), McDonald’s Corporation (11
plazas) and Delaware North Companies Travel Hospitality Services, Inc. (4 plazas); and two fuel service
operators: Lehigh Gas Corporation (12 plazas) and Sunoco, Inc. (R&M) (15 plazas).
To provide maximum customer service, all food and fuel centers are open 24 hours daily, 7 days a week
and offer parking, fuel, public restrooms (including family assist restrooms equipped for persons with
disabilities), ATMs, and free Wireless Internet Service. There is also a brand name food vendor at each
travel plaza open to the public 24 hours a day, 7 days a week. Further, many travel plazas have seasonal
farm markets, gift shops, fax machines, sell E‐ZPass On‐the‐Go (retail E‐ZPass transponders) and staff a
number of Tourist Information Centers.
The Authority and its concessionaires continue to make various improvements at the travel plazas,
including updating food concepts and the overall appearance of the interiors and exteriors of the
buildings, gas station renovations, adding trucker’s lounges and increased tractor trailer parking.
4. Safety, Incident Response and Traveler Information Systems The Thruway Statewide Operations Center (“TSOC”), housed at the Authority's Administrative
Headquarters in Albany, is the central location for the coordination of all traffic incident response,
emergency management, and dissemination of traveler information along the entire Thruway. The
TSOC operates 24 hours a day, 7 days a week, 365 days a year. The Authority exchanges traffic and
Intelligent Transportation Systems (“ITS”) data with NYSDOT through the Regional Traffic Operation
Centers, providing the public with a view of traffic operations across New York State so they may make
more informed travel choices.
To increase the functionality of the TSOC, the Authority recently implemented an Advanced Traffic
Management System to integrate and control all current and future ITS devices and systems. Such
devices include 73 Permanent Variable Message Signs, 154 Closed Circuit Television cameras, 13
Highway Advisory Radio stations, 119 real‐time vehicle detector sites, and 26 Portable Variable Message
Signs. The Authority also offers an email alert service (TRANSalert) to its customers to inform them of
major unscheduled incidents that may affect their travel plans and the Thruway website
(www.thruway.ny.gov) offers a centralized location to access a multitude of traveler information.
Finally, a troop of New York State Police (Troop T) is entirely dedicated to policing on the Thruway
System. The principal mission concern for Troop T is to increase safety on the roadway and reduce fatal
and personal injury auto accidents. They address the issue through enforcement and education.
Through the years, Troop T has participated in traffic enforcement initiatives directed at drivers who
engage in behavior known to cause fatalities or exacerbate the fatality rate: speed, failure to use
seatbelts and drunk and/or drugged driving. However, the greatest proven method to reduce fatalities
is the day‐to‐day visible enforcement of traffic laws by the patrol troopers on the highway.

Page II‐5
In 2011, good overall highway conditions, traveler access to online and radio information services, good
incidence and weather response and the efforts of Troop T contributed to a very low fatality rate. The
fatality rate on the Thruway is among the lowest in the nation at 0.44 fatalities per 100 million miles
traveled. This compares to an index of 1.13 for the national average and 0.8 for all of New York State.
5. Annual Routine Maintenance Activities Over the years, the Authority has developed comprehensive plans for the maintenance of its facilities.
Formal pavement and bridge management systems have been developed to address maintenance issues
and provide input into the development of long‐term infrastructure management programs. Routine
maintenance activities are performed by Authority staff from 21 maintenance locations grouped into
four divisions.
Additional specified routine maintenance activities are provided by the four division highway and bridge
maintenance headquarters and by the Tappan Zee Bridge maintenance team. Responsibilities include
snow and ice removal, pavement and bridge repair and maintenance, guiderail and safety work,
responding to incidents and accident damage, and right‐of‐way maintenance. Additional specialized
maintenance activities are provided by the four centralized division maintenance crews and the Tappan
Zee Bridge crews. Maintenance activities also include innovative preventative maintenance operations
to preserve the highway system and minimize added capital improvement costs.
In addition, environmental stewardship has become an important factor in on‐going maintenance
decisions. Some examples of what is included in these types of enhancements by the Authority are the
use of solar‐powered ITS elements, the planting of living snow fencing, the purchase of flex fuel vehicles
and the planned construction of five wind turbines along the Thruway section south of Lake Erie
between Buffalo and the Pennsylvania border, for the generation of electric power to provide heat and
light for Thruway facilities.
B. Mandated Additions to the Authority In addition to the original mandate of the Authority to operate and maintain the controlled ticket,
bridge and barrier systems along the Thruway, the Authority was given responsibility over several other
transportation facilities in the early 1990’s, described below:
In 1991, the Cross‐Westchester Expressway (I‐287), which starts at I‐87 near Tarrytown and
travels east for 11 miles to the Thruway’s New England Section (I‐95) in Rye became the
Authority’s responsibility for maintenance and operational expenditures only. Capital
improvements remained the responsibility of NYSDOT.
In 1991, the Authority began to operate and maintain I‐84, a 71‐mile section of roadway that
connects the Pennsylvania State Line to the Connecticut State Line. After November 2007, the
Authority was fully reimbursed by NYSDOT for all operating and maintenance costs. The

Page II‐6
operation and maintenance responsibility of I‐84 was transferred back to NYSDOT as of October
11, 2010.
In 1992, the New York State Canal Corporation was formed, as a subsidiary of the Authority, and
the Authority assumed control of the maintenance and operation of the 524‐mile New York
State Canal System. The Authority is also responsible for capital improvements to the Canal
System. The Canal System is composed of the Erie, Champlain, Oswego, and Cayuga‐Seneca
canals. Since the Authority assumed such responsibility, federal funds have offset a portion of
the Authority’s related capital costs.
Financially, both I‐84 and the Canal System projects have been considered to be “Other Authority
Projects.” Funds for the maintenance and operations of these types of projects can only be provided
through the Other Authority Projects Operating Fund, which are junior to Thruway operations, debt
service, and Thruway System capital responsibilities.
C. The New York State Canal System For two centuries, the New York State Canal System has played a very important role in the history and
development of the State and the nation. The ability to efficiently move people and goods across the
State proved instrumental in the westward expansion of the nation, and the development of major cities
in upstate New York including Buffalo, Rochester, Syracuse and Albany, as well as hundreds of smaller
cities, towns and villages. The construction of the Erie Canal and the subsequent Canal System was
primarily responsible for the dominance of New York City as the country's premier shipping port for
many years.
Today, New York State’s 524‐mile Canal System is a world class recreation‐way and tourist destination
that cultivates historic preservation and spurs economic development in upstate New York. The Canal
System links the Hudson River with Lake Champlain, Lake Ontario, the Finger Lakes, the Niagara River
and Lake Erie, passes through 25 counties and is in close proximity to more than 200 villages, hamlets
and towns. It is estimated that this extensive waterway network supports nearly $400 million in
economic activity throughout the Canal corridor. For much of its length, it closely parallels the Thruway
System.
The current Canal System, which began construction in 1905, provides extensive inter‐modal linkages
within and beyond the State's borders and includes four major canals, canalized natural waterways, five
lakes, feeder reservoirs and numerous shipping terminals. It consists of 57 locks, 20 lift bridges, 22
reservoirs, 203 buildings, 114 dams and over 1,500 other structures critical to the maintenance and
operations of the waterways and its feeder systems (water control devices, fixed bridges over the Canal
System, terminals, terminal walls, aqueducts, culverts, roads and reservoirs). Due to the age of the
infrastructure, substantial maintenance activities are required to ensure system reliability.

Page II‐7
Figure II‐2: New York State Canal System
In addition to maintaining these important facilities, the Authority also maintains more than 260 miles
of multi‐use, recreational trails across upstate New York that are adjacent to the waterways of the Canal
System or follow remnants of the historic original canals that date back to the early 1800s.
According to a recent study, an estimated 2.4 million people use the trail network each year for
bicycling, walking, jogging and other activities, providing an economic impact of more than $41 million
per year. More information on the Canal System and Trail Network can be found at
http://www.canals.ny.gov/.

Page III‐1
III. Historical Review of the Authority’s Finances The following section provides an overview of the Authority’s operating, capital and debt service costs
and revenue trends from 2005 through 2011. The section concludes with an overall view of the financial
health of the Authority during this period.
A. Operating and Maintenance Expenses The Authority’s operating expenses include the non‐capitalized costs for the maintenance of highway,
building and canal facilities; equipment purchases; snow and ice removal; Thruway toll collection;
policing; administrative costs and fringe benefits; Thruway traffic operations; and provisions for funding
environmental and other liability reserves. Table III‐1 summarizes the Authority’s operating and
maintenance (O&M) expenses for the period 2005 through 2011, including I‐287, I‐84 and the Canal
System for the period in which these facilities have been the responsibility of the Authority.
Table III‐1: Operating and Maintenance Expenses, Thruway System (millions)
Year Thruway Operations
Reserves(1) I‐84(2)(4) Canal
System(2)
Total Operating Expenses
2005 $303.8 $3.5 $12.5 $38.2 $358.0
2006(3) 310.7 13.0 11.5 42.8 378.0
2007(3)(4) 332.2 6.8 10.3 45.9 395.2
2008(4) 334.8 2.5 ‐ 45.2 382.5
2009 339.4 7.3 ‐ 48.7 395.4
2010(5) 358.2 6.0 ‐ 46.0 410.2
2011 365.4 4.6 ‐ 51.3 421.3
2005‐2011 Total $2,344.5 $43.7 $34.3 $318.1 $2,740.6
(1) The provisions for legal claims and indemnities and environmental remediation reserves. (2) Canal and I‐84 operating expenses are paid out of the Other Authority Projects Operating Fund and funds required are net of Federal Aid reimbursements. (3) Operating expenses in 2006 and 2007 were adversely impacted due to the liability of two legal claims and increases in health insurance and snow and ice removal costs. (4) As of November 2007, expenditures for I‐84 were fully reimbursable from NYSDOT. As noted above, since 2010, the Autority has no operational or funding responsibility related to I‐84. (5) In 2010, operating expenses include $13.3 million for the special early retirement surcharge of which $11.4 million was for the Thruway and $1.9 million in Canal operating expenses. Also in 2010, $5.6 million in Federal funds was received for Canal operations.
Despite the intense pressure that rising benefit, fuel and other commodity prices caused since 2007, the
Authority was able to enhance the efficiency of its operations through a cost containment strategy that
limited operational expense growth to at or below the rate of inflation, depending on what inflation
measure is utilized. After excluding indemnity and reserve allocations and the impacts of Tropical
Storms Irene and Lee on Thruway and Canal operations and benefit costs, core operating expenses
increased by an average of only 2.6 percent per year from 2007‐2011. This rate of growth compares to

Page III‐2
an annual average increase of 3.7 percent in construction costs and 2.5 percent in consumer price
inflation over the same time frame. In addition, as noted in Table III‐2, 2011 was the fifth consecutive
year in which Thruway and Canal operating expenses were below budget estimates.
Table III‐2: Thruway &Canal Operating Expenses – Net of Reserves, Storm, Pension and Health Insurance Costs (in millions)
Year
Original
Thruway &
Canal
Operations
Budget
Actual
Thruway &
Canal
Operating
Budget (1)
Less:
Net
Expenses Change
%
Change Reserves
Storm
(Irene &
Lee) Costs
Pension &
Health
Insurance
2005 $344.0 $350.0 $3.5 $0.0 $73.6 $272.9
2006 372.0 376.2 13.0 0.0 75.9 287.3 14.4 5.3%
2007 391.4 390.8 6.8 0.0 79.8 304.2 16.9 5.9%
2008 404.6 386.5 2.5 0.0 81.0 303.0 ‐1.2 ‐0.4%
2009 412.1 398.9 7.3 0.0 79.2 312.4 9.4 3.1%
2010 420.6 416.8 6.0 0.0 101.7 309.1 ‐3.3 ‐1.1%
2011 443.3 426.6 4.6 6.8 98.4 316.8 7.7 2.5%(1) Excludes I‐84 costs that are no longer an Authority expense, as has been reimbursed since 2007 and eliminated in their
entirety since 2010.
From 2005 through 2011, the Authority was able to limit the level of growth in Thruway and Canal
operating costs primarily through staffing reductions and a stronger workforce management program.
During this period, the Authority eliminated 314 positions, representing a workforce reduction of nearly
10 percent. In addition, the Authority reduced or eliminated expenditures for equipment and projects,
cancelled scheduled salary increases and other employee benefits, relied more heavily upon part‐time
and seasonal workforces, reduced toll lane staffing hours, enhanced energy efficiency measures,
reduced overtime and discretionary expenses and other actions.
As noted later in this report, the Authority will be significantly enhancing the efficiency of its operations
through a new operational streamlining program, scheduled to begin in 2012. This new program will
play an important role in the maintenance of future fiscal balance, involving structural reforms and
other measures that will generate real reductions in Thruway operating expenses.
B. Capital Expenditures Given the age of the Thruway and Canal Systems and the high percentage of their infrastructure that
dates back to original construction, significant capital investments have been necessary to complement
maintenance activities for the system to remain reliable and in a state of good repair. While the
Authority’s recently completed 2005‐2011 Capital Program was primarily focused on maintaining
infrastructure conditions, it did include some heavy reconstruction and capacity improvement activities.
The 2005‐2011 Capital Program was intended to address several key objectives that were critical to
Thruway and Canal customers. Those goals were reliability, increased customer service, improved
safety and mobility and environmental stewardship. The program included projects that addressed the
need for reconstruction and rehabilitation of roadway, bridges, facilities and support systems of the

Page III‐3
Thruway; congestion relief and mobility enhancements; equipment replacement needs; critical canal
capital projects; and higher/highway speed E‐ZPass lanes.
However, beginning in 2007, the fiscal distress resulting from declining traffic and high fuel and
construction commodity prices required the Authority to re‐examine the capital and equipment needs
of the Thruway and Canal systems. As a result of this re‐evaluation, a significant number of project
scopes were reduced, projects were eliminated and others were delayed. These actions reduced the
level of planned infrastructure and equipment investments in the 2005‐2011 Capital Program by $300
million, reducing capital expenses from $2.6 billion to $2.3 billion during this period. Despite these
actions, as noted in Figure V‐1 and Figure V‐2 later in this report, the Authority was able to maintain
good overall highway and bridge conditions during this period.
Given that an overwhelming majority of the Authority’s pavement, bridge and canal facilities date back
to original construction, the postponement or re‐scoping of treatments that occurred during the 2005‐
2011 Capital Program will likely increase the future cost of necessary repairs. Given the current high
price of fuel and other construction commodities and anticipated future price increases, delaying
required treatments will likely increase their ultimate cost. In addition, as noted in Figure III‐1,
deterioration of pavement conditions will be accelerated without appropriate action. A prolonged delay
in addressing infrastructure needs could lead to much larger investments in the long‐run in order to
return the pavement to a good condition.
Figure III‐1: Pavement Condition Over Time
As a result, Jacobs recommends that the Authority exercise caution as it develops and manages its
future highway, bridge and canal capital needs (see Section V.D on page V‐4). It is critical that the

Page III‐4
Authority rely on existing asset management and capital program management systems (and scheduled
improvements thereto) to maximize the impact its capital investments have upon its infrastructure. The
growing needs of the aging Thruway and Canal Systems must be delicately balanced with the Authority’s
ability to finance capital projects, warranting closer attention to project selection.
Total capital expenditures and funding sources for the 2005‐2011 Capital Program are shown in Table
III‐3 and Table III‐4.
Table III‐3: Capital Expenditures, Thruway Authority (millions)
Year Highway and
Bridge
Facilities, Travel Plaza and Equipment
Canal System and Economic
Development Projects (1)
Total Capital Expenditures
2005 $97.1 $27.3 $21.0 $145.4
2006 179.3 50.9 14.4 244.6
2007 267.3 59.0 44.2 370.5
2008 288.7 36.2 30.3 355.2
2009 259.6 35.4 26.1 321.2
2010 311.0 39.9 26.8 377.7
2011 367.6 49.5 27.4 444.5
Total $1,770.6 $298.2 $190.2 $2,259.1 (1) As noted above, these costs are payable only after Thruway operating and maintenance and debt service costs.
Table III‐4: Funding Sources, Thruway Authority (millions)
Year
Funding Sources
Federal
Aid Other
Bond / Note
Proceeds
Subtotal
Exclusive of
Thruway
Revenues on Pay‐
As‐You‐Go Basis
Revenues
Required from
Tolls, etc.
Pay‐As‐
You‐Go %
2005 $43.1 $0.8 $60.4 $104.3 $41.1 58.5%
2006 22.7 7.4 154.8 184.9 59.7 36.7%
2007 30.9 1.2 198.3 230.4 140.1 46.5%
2008 17.6 1.3 299.5 318.4 36.8 15.7%
2009 10.0 2.7 258.4 271.1 50.1 19.6%
2010 8.7 4.9 305.8 319.4 58.3 19.0%
2011 0.0 6.4 366.0 372.4 72.1 17.6%
Total $133.0 $24.7 $1,643.2 $1,800.9 $458.2 27.3%

Page III‐5
It is important to note from Table III‐4 that Federal aid allocated by the NYSDOT to the Authority
declined significantly from 2005 through 2011. This decline is predominately the result of the expiration
of an agreement with NYSDOT in 2005, which had previously authorized the allocation of Federal
Interstate Maintenance Aid (I‐M) and Transportation Enhancement Program (TEP) assistance to the
Authority that supported its capital and operational needs. As noted, declining Federal aid and low
revenue growth led to a reduction in the level of Pay‐as‐you‐go financing for the 2005‐2011 Capital
Program.
C. Debt Service Expenses As a result of reduced Pay‐As‐You‐Go financing from reduced revenues and Federal aid, the Authority
had to rely on greater levels of debt to finance commitments made in the 2005‐2011 Capital Program.
As noted in Table III‐5, the elevated reliance on bonds and the issuance of short‐term notes to finance
programmed capital improvements resulted in annual debt service payments increasing from $108.4
million in 2005 to over $181.8 million in 2011, even in a recent low interest rate environment.
Table III‐5: Debt Service, Thruway System (millions)
Year Service on Outstanding
Debt
2005 $108.4
2006 128.5
2007 135.8
2008 163.5
2009 176.9
2010 191.2
2011 181.8
2005‐2011 Total $1,086.1
D. Revenues
1. Traffic and Toll Revenues With the exception of a small amount of Federal aid and other funds, tolls collected on the controlled
system and through toll barriers support an overwhelming majority of the Authority’s budget. As a
result, the Authority closely monitors traffic volumes and toll revenues for the various Thruway sections.
The Authority had originally planned to finance operating, maintenance and capital responsibilities from
2005 through 2011 through a series of two‐staged toll rate adjustments approved in 2005. This was the
first toll adjustment that was implemented in 17 years and was designed to only provide sufficient

Page III‐6
funding for the Authority's operating, capital and maintenance needs through the end of the 2005‐2011
Capital Program.
The 2005 toll adjustment generally increased toll rates by 25 percent for passenger vehicles and 35
percent for commercial customers in 2005 and increased cash tolls for both passenger and commercial
vehicles by 10 percent in 2008. In addition, the toll adjustment also implemented a new vehicle
classification system (reducing the number of classifications from 43 to 9), created a new E‐ZPass
discount program, continued a graduated volume discount program for commercial customers and
expanded the availability of commuter plans to bridges and barriers on the Thruway System.
In late 2007, rising fuel prices and the recession’s impact on employment, industrial production, housing
starts and other aspects of the economy significantly impacted passenger and commercial traffic
patterns nationwide. As noted in Figure III‐2, total traffic on the Thruway System and on other selected
toll facilities began to decline significantly at that time as travelers reduced the number and distance of
their trips.
Figure III‐2: Comparison of the Thruway System to Regional Toll Facilities
0.88
0.90
0.92
0.94
0.96
0.98
1.00
1.02
1.04
Toll Facility Traffic 12 Month Moving Average
(Index Month Ending September 2007 = 1)
MD Transportation Authority NH Turnpike Delaware Memorial Bridge
Newport Pell Bridge (RI) Richmond Metropolitan Authortiy (VA) NYSTA
In response to the financial pressures brought on by fuel prices and the state of the national economy,
the Authority implemented another series of staged, though smaller adjustments to toll rates in 2008.
This adjustment was only designed to provide additional funding to assist the Authority in financing
operational, maintenance and capital commitments made in the 2005‐2011 period. The 2008 toll
adjustment maintained a 5 percent E‐ZPass discount for all patrons and added two five percent across‐

Page III‐7
the‐board increases, which took effect in 2009 and 2010. Table III‐6 summarizes passenger and
commercial traffic and toll revenues from 2005 through 2011, respectively.
Table III‐6: Traffic Trends (millions of trips)
Year Passenger Commercial
Total Percent Change Control Barrier Control Barrier
2005 125.8 115.7 19.9 12.5 274.0 ‐
2006 127.8 112.6 17.7 11.3 269.4 ‐1.7%
2007 127.7 100.6 17.7 10.1 256.0 ‐5.0%
2008 125.5 96.5 16.9 9.7 248.5 ‐2.9%
2009 128.2 94.3 15.4 8.8 246.7 ‐0.7%
2010 129.0 93.8 15.7 9.1 247.6 0.4%
2011 126.6 93.5 15.8 9.3 245.0 ‐1.0%
2. Other Revenues The Authority collects a variety of non‐toll revenues derived from payments received from
concessionaires at the Thruway service areas restaurant and gasoline stations, sales of surplus property,
revenues from special hauling permits, E‐ZPass fees, fiber optic agreements, interest on various invested
funds, and other miscellaneous sources. These revenues have varied considerably over the last fifteen
years. The Authority’s income from all other revenue sources was $31.4 million in 2011, including
interest earnings. Interest earnings have dropped substantially due to several factors including the
reduced level of funds available for investment and lower market interest rates. Historical collections
of other revenues are outlined in Table III‐7.
Table III‐7: Summary of Total Thruway System Revenues (Millions)
Year Passenger Commercial Total Toll Revenue
Other Revenue Total Revenue
2005 $311.1 $200.1 $511.2 $36.4 $547.6
2006 333.7 220.7 554.4 39.6 594.0
2007 324.7 215.6 540.3 41.4 581.7
2008 347.1 215.6 562.7 33.5 596.2
2009 400.8 210.8 611.6 26.7 638.3
2010 413.1 228.1 641.2 31.3 672.5
2011 403.9 230.2 634.1 31.4 665.5
2005‐2011 Total $2,534.4 $1,521.1 $4,055.5 $240.3 $4,295.8

Page III‐8
E. Historical Flow of Funds Analysis Table III‐8 presents total revenue and expenses for 2005 through 2011 in a format that is consistent with
the flow of funds required by the Authority’s Bond Resolution. As noted in this table, from 2005 through
2011 the Authority was able to maintain fiscal stability and a debt service coverage ratio that warranted
its current favorable credit investment grade credit rating. This was accomplished by the
aforementioned capital program reductions, operational cost containment efforts and toll rate
adjustments. However, these actions were insufficient to fully maintain net revenues at a level that
would result in good coverage and fiscal balance. As a result the Authority relied on the issuance of
short term notes to bridge financing gaps in lieu of taking other actions. The combination of these
measures allowed the Authority to maintain a balanced flow of funds and achieve budget surpluses that
were used to enhance its working capital reserves.
Table III‐8: Revenues, Operating Expenses and Reserve Fund Requirements, 2005 – 2011 (in millions)
Actual Actual Actual Actual Actual Actual Actual Total 2005 2006 2007 2008 2009 2010 2011 2005-2011
Total Revenues 547.3$
594.0$
581.6$
596.2$
638.3$
672.5$
665.5 $
4,295.4$
Less: CWE Debt Service & Reserve 0.3
0.3
Available Revenues 547.6 594.0
581.6
596.2
638.3
672.5
665.5
4,295.7
Less:
Operating Expenses 305.3 310.7
332.2
334.8
339.3
358.2
365.5
2,346.1
Operating Reserves 2.0
13.0
6.8
2.5
7.3
6.0
4.6
42.1
Total 307.3
323.7
339.0
337.3
346.7
364.2
370.0
2,388.2
Net Revenues 240.3 270.3
242.6
258.9
291.7
308.3
295.5
1,907.5
Less: Debt Service 103.8 127.4
135.8
163.5
166.3
167.3
167.4
1,031.5
Net Revenues After Debt Service 136.5 142.9
106.8
95.4
125.4
141.0
128.1
876.0
Less: Retained for Operating Reserves 5.2 ‐5.0 -5.0 5.1
(1.8)
2.3
(4.3)
(3.6)
Net Revenues 141.7 137.9
101.8
100.5
123.5
143.2
123.8
872.4
Less:
Reserve Maintenance Provisions (2) 60.9 69.8
20.7
30.7
34.5
31.0
10.0
257.6
Other Authority Projects (3) 50.7 54.3
53.7
45.2
48.7
46.0
51.3
349.9
General Reserve Fund 24.9 12.8
26.8
24.4
25.1
21.2
48.2
183.5
General Reserve Fund ‐ CP1, CP 2 & BAN's 4.6 -
-
10.6
23.8
14.4
53.4
Balance After Reserve Maintenance 0.6 1.0 0.6 0.0 4.7 21.1 -0.1 28.0
Provisions, Other Authority Projects
and General Reserve Fund
Adjustments for Cash Basis (0.6) (1.0)
(0.6)
-
0.2
(0.1)
0.1
(1.9)
Net Balance Available for Working Capital $0.0 $0.0 $0.0 $0.0 $5.0 $21.1 $0.0 $26.1 Debt Service Coverage Ratios 2.31
2.12
1.79
1.58
1.75
1.84
1.77
Pay‐As‐You‐Go Percentage 58.5% 36.7% 46.5% 15.7% 19.6% 19.0% 17.6%
(1) Totals may not add due to rounding.
(2) Shows the Reserve Maintenance Fund provision will be funded from debt proceeds when sufficient revenues are not available.
(3) As of 10/31/2007, expenditures for I-84 are to be funded from NYSDOT.

Page IV‐1
IV. Special Reports and Analysis The Authority recently commissioned Jacobs to study (i) what toll revenues may have been generated if
toll rates had followed two common measures of increasing costs, (ii) the economic impact of the
Thruway and Canal Systems and (iii) the typical Thruway customer. A summary of these analyses are
included below and provide important context to the discussion in the remaining sections of this report.
A. The Impact of Infrequent Toll Adjustments on Authority Finances Jacobs measured what toll revenues may have been generated if the toll rates had followed each of two
common measures of increasing costs ‐ the Consumer Price index (CPI) measured by the Bureau of
Labor Statistics and the Construction Cost Index (CCI) developed by the Engineering News Record. The
CPI is a common and often used measure of price inflation for consumer goods and services and the CCI
is a composite measure of the cost to construct infrastructure.
Jacobs found that since the Thruway System was established, tolls rates have grown well below both
indices. As shown in Figure IV‐1, the actual per‐mile passenger car rate on the Ticket System is over four
times less than they would be today if toll rates had followed the construction cost index.
Figure IV‐1: Comparison of Actual and Hypothetical Toll Rates for Passenger Cars on the Ticket System
In addition, Jacobs analyzed what toll revenue would have been collected if toll rates were indexed
beginning in 1988 (the start of the longest period between toll modifications on the Thruway System).
The infrequent toll modifications implemented by the Authority since 1988 resulted in large portions of
the Authority’s capital program being funded from debt. The significant additional toll revenues that
may have been available if a regular toll adjustment program had been followed indexed to either CPI or
CCI would have altered the Thruway finances significantly, generating an additional $1.5 billion to $2.5
billion in additional revenues since 1988.

Page IV‐2
Among the outcomes that may have resulted if the additional toll revenues were collected include:
Lower level of bond financing;
Higher pay‐as‐you‐go percentage preserving available revenues for future bond sales;
Larger capital program moving some rehabilitation and reconstruction projects forward to
potentially save on the life cycle cost for the improvements; and
Reduced pressure to increase tolls to fund the current capital program.
While it is impossible to look back and determine precisely what program should have been followed,
nevertheless, significant additional revenues gained by more frequent toll rate increases would have
placed the Thruway in a much stronger financial position as it recapitalized the Thruway System.
Further discussion and analyses considering additional revenues the Authority may have collected had
they implemented regular toll increases over the past 25 years is provided in Appendix B, in the form of
a Technical Memorandum entitled “Hypothetical Toll Analysis”, dated April 4, 2012.
B. The Economic Impact of the Authority’s Capital, Operating and Maintenance Activities on the New York State Economy
Jacobs estimated the economic impact of the Authority’s operations and infrastructure investments on
the New York State and local economies. In dynamic economic conditions, we found that the
transportation systems managed by the Authority (roadways, bridges and canals) are essential to
supporting businesses and communities across the state. The Thruway and Canal Systems are key
arteries of commerce and they transport products, facilitate tourism and recreational activities, and
connect residents with their work places, all of which generate substantial economic activity.
The Thruway and Canal Systems are extensive, with 570 miles of roadways and 524 miles of canals,
making it one of the largest State networks in the nation. From 2005‐2011, the operation, maintenance
and capital improvements of these systems including the privately operated travel plazas supported:
o 6,725 on‐site public and private sector jobs annually;
o 10,150 total jobs throughout New York State annually;
o $575.2 million in personal income and benefits annually;
o $1.2 billion in business sales and production annually; and
o $207.5 million in Federal, State and local tax revenues annually:
o Local and State Tax Revenue: $130.1 million.
o Federal Tax Revenue: $77.4 million.

Page IV‐3
Additionally, the impact was analyzed on a regional basis. Figure IV‐2 shows the five major regions for
which the economic impact (supporting jobs) was estimated.
Figure IV‐2: Annual Economic Impact Analysis Regions ‐ Supporting Jobs
Buffalo Section
Rochester Section
Syracuse Section
Albany Section
Metro NYC Section
Over 1,500
Nearly 500
About 1,260 Nearly
1,775
Over 1,470
10,150 total jobs in New York State4,300 additional jobs elsewhere in the US
C. Thruway Trips and Customers To better understand how toll policy impacts the Thruway customer, it is important to appreciate the
make‐up of traffic on the Thruway System and its customer base. As shown in Figure IV‐3, in 2011 the
majority of traffic on the Thruway System was comprised of passenger cars, making up roughly 90
percent of traffic. The remaining ten percent of traffic is from a variety of different commercial vehicle
types. Though commercial traffic comprises only a small percentage of system‐wide traffic, trucks
accounted 37 percent of Thruway revenues. In addition, in 2011 approximately 66 percent of vehicles
paid a toll with an E‐ZPass transponder. For passenger cars, the E‐ZPass market share equaled
approximately 65 percent, while trucks utilized E‐ZPass more frequently, averaging a market share of
about 82 percent.

Page IV‐4
Figure IV‐3: 2011 System Wide Traffic and Revenue Distribution
Passenger E‐ZPass58%
Passenger Cash32%
Commercial E‐ZPass8%
Commercial Cash2%
2011 Traffic
Passenger E‐ZPass58%
Passenger Cash23%
Commercial E‐ZPass32%
Commercial Cash5%
2011 Revenue
Jacobs further found that the distributions of vehicle class and payment type vary by facility, as shown in
Figure IV‐4. The highest passenger car participation in E‐ZPass is seen at the Tappan Zee Bridge, while
the highest truck participation rate in E‐ZPass payment is seen at the nearby Spring Valley Barrier, which
is a truck‐only toll facility that offers open road tolling. It should be noted that although E‐ZPass
transactions account for about two‐thirds of annual transactions on the Thruway, the majority of
customers (individual people) using the Thruway over the course of a year travel infrequently and pay
with cash.
Figure IV‐4: 2011 Traffic Distribution by Facility
0%
10%
20%
30%
40%
50%
60%
70%
80%
90%
100%
Motorhome
Cash Heavy Truck
Cash Light Truck
EZ Heavy Truck
EZ Light Truck
Cash Car
EZ Car
Commuter

Page IV‐5
Jacobs further analyzed the breakdown of 2011 annual toll revenues by Thruway facility, as presented in
Figure IV‐5. Of the Thruway’s facilities, the Ticket System and the Tappan Zee Bridge generate the most
significant portion of the Thruway’s traffic and revenue. In 2011, the Ticket System generated $416.5
million or more than half (approximately 63 percent) of all Thruway toll revenues and the Tappan Zee
Bridge generated $126.6 million (approximately 19 percent) of total toll revenues. The New York
Metropolitan area barrier tolls (other than the Tappan Zee Bridge) generated about $95.7 million or a
combined 15 percent of 2011 revenues. In the Buffalo area – the Grand Island Bridges plus the Erie
Section of the mainline ‐ generated approximately 11 percent of 2011 revenues.
Figure IV‐5: Distribution of 2011 Toll Revenues by Thruway Facility
Specific regions within the Ticket System that see the most volume include the Albany area, the Buffalo
Mainline plazas, and the Woodbury Mainline toll Plaza. The top six plaza volumes for the ticket system
in 2011 are shown in Table IV‐1.
Table IV‐1: Ticket System Toll Plazas with the Highest Volumes, 2011
Plaza / Interchange Transactions
Exit 24: Albany, Montreal, I‐90 East, I‐87 North 12,700,000
Williamsville 8,900,000
Lackawanna 8,300,000
Woodbury 7,500,000
Exit 25: Schenectady, I‐890, NY Routes 7 & 146 6,900,000
Exit 45: Rochester, Victor, I‐490 5,900,000

Page IV‐6
Finally, in 2011 approximately 62 percent of the Thruway's E‐ZPass toll revenues were generated by the
Authority's customers. Customers that had a transponder issued by a New York State toll agency (the
Authority or the Metropolitan Transportation Authority) accounted for about 78 percent of total E‐ZPass
toll revenues. As a result, 22 percent of E‐ZPass toll revenues were collected from customers that had a
non‐New York issued transponder, underscoring the importance of the Thruway System in the regional
and national economy.

Page V‐1
V. 20122015 MultiYear Capital Program In order to better understand the Authority’s current and future financial condition, consideration must
be given to the size, complexity and capital needs if its highway, bridge and canal infrastructure. The
Authority’s Thruway and Canal Systems are vast and aging and require considerable investments to
remain reliable. This section summarizes the Authority’s 2012‐2015 Capital Program, the infrastructure
investments and program changes that were made therein and the impact that these investments will
likely have on facility condition ratings.
A. Program Details The 2012‐2015 Multi‐Year Capital Program will complete major, job sustaining reconstruction projects
that were let during the previous 2005‐2011 Capital Program and includes new highway, bridge and
canal construction projects and equipment purchases. The program was originally planned at $1.8
billion (and excluded the new Tappan Zee Bridge Project described in the next section of this report).
However, due to fiscal constraints brought on by continued high fuel and construction commodity prices
and a sluggish economic recovery, many projects contained in the original plan have been delayed,
reduced or eliminated. These actions resulted in the program being reduced by $300 million, to its
current investment level of $1.5 billion. In essence, fiscal constraints required the Authority to pursue a
more balanced approach to the program’s project mix, focusing more on high priority and high impact
investments to maintain the useful life of Thruway and Canal infrastructure rather than pursuing major
reconstruction, rehabilitation and capacity improvements that were familiar in the 2005‐2011 Capital
Program.
New Thruway projects included in the four‐year program include:
Grand Island Bridge Deck Replacements and Repairs (2012 and 2013 lettings);
Exit 59 (Dunkirk) to Exit 60 (Westfield) Pavement Resurfacing (2013 letting);
Exit 17 (Newburgh) to Exit 18 (New Paltz) Pavement Rehabilitation (2013 letting);
Exit 33 (Verona) to Exit 34 (Canastota) Pavement Resurfacing (2014 letting);
I‐95, Exit 8B (New Rochelle) to Port Chester Pavement Restoration (2014 letting); and
Exit 54 (West Seneca) to Lackawanna Barrier Pavement Resurfacing and Bridge
Replacements (2015 letting).
Since the transfer of the Canal System to the Authority in the 1990s, the Authority has made significant
maintenance and capital investments into the waterway’s infrastructure. However, given the age of the
Canal System, revitalization of infrastructure is necessary to meet the demands of recreational boaters,
tour and rental boats and a resurgent commercial shipping sector. While the Authority undertakes an
ambitious annual maintenance program, Canal structure conditions continue to deteriorate, with nearly
50 percent of critical Canal structures rated in the fair and poor categories. Complicating efforts to

Page V‐2
reduce this rate of deterioration, a substantial portion of the Canal’s current floating plant equipment
consists of a variety of vessels that need to be replaced and Tropical Storms Irene and Lee caused nearly
$100 million in damages to many components of the Canal System in 2011. In April 2012, the Authority
entered into a $60 million loan agreement with Citibank, N.A. to finance a portion of these emergency
capital repairs and expects Federal Emergency Management Agency to reimburse a substantial portion
of the loan.
Due to fiscal restraints, new Canal projects in the 2012‐2015 Capital Program are limited and primarily
focused on repairing storm damaged facilities. They include the following:
Canal Dredging, Lock Repairs and Other Contracts – Tropical Storms Irene and Lee
Recovery Projects (2012 lettings);
Utica Taintor Gate and Dam Rehabilitation (2012 letting)
Amsterdam Movable Dam Rehabilitation (2012 letting);
Scotia Moveable Dam Rehabilitation (2014 letting); and
Oswego Lock Rehabilitation (2015 letting).
It is also important to note that a considerable portion of the 2012‐2015 Capital Program (some $400
million) is dedicated to financing several ongoing and large‐scale Thruway reconstruction and
rehabilitation improvement projects that were contained in the 2005‐2011 Capital Program. Thruway
projects currently underway that have a financial impact in 2012 and beyond include:
Exit 39 (I‐690) to Exit 40 (Weedsport) Pavement Reconstruction;
Exit 23 (I‐787) to Exit 24 (Northway) Pavement Reconstruction and Capacity
Improvements;
Exit 57 (Hamburg) to Exit 58 (Silver Creek) Pavement Reconstruction and Bridge
Rehabilitations; and
Phase 2 of the Tappan Zee Bridge Deck Replacement.
As mentioned earlier in this report, as the Authority progresses through the 2012‐2015 Capital Program,
it must rely on existing and enhanced asset management and capital program management systems to
ensure that changes to the program maintain the proper project mix, to maximize investment value and
impact as the economy and pricing environments change.
B. The New Tappan Zee Bridge Project The Authority has moved toward undertaking a massive transportation project, the replacement of the
Tappan Zee Bridge. This project is one of the Country’s most extensive transportation enhancement
projects ever envisioned and, in 2011 the Tappan Zee Bridge Project became one of fourteen
infrastructure projects that President Obama tapped for expedited Federal environmental review, with

Page V‐3
construction estimated to begin in late 2012. Pursuant to new statutory authority for the Authority to
undertake procurements on a design build contracting basis, In February 2012, four separate private
joint ventures made up of large domestic and international firms, were short‐listed and have recently
been invited to submit Design‐Build bids under a recently released formal Request for Proposals.
The newly authorized design‐build procurement process being followed allows the private sector to
compete and offer innovative, cost‐effective designs for this major transportation infrastructure
replacement project. The design‐build process further permits an expedited construction schedule
which can take advantage of significant cost savings and provides for less risk if delays and cost overruns
should occur during the process.
The Authority had previously focused on earlier concepts for the Tappan Zee Bridge project and included
a significant public involvement process over the last decade. The re‐launch of the process in October
2011 has resulted in numerous public presentations and meetings which have been heightened by the
hearings on the Draft Environmental Impact Statement for the project.
The Authority continues to guide the process forward. As noted earlier, a specific financing plan for this
project will be developed in late 2012 or early 2013 when more information is available on the cost of
the Project (i.e. when the design‐build procurement process has been completed) and when there is
more certainty on the level of Federal aid or financing assistance that will be received for this Project.
As a result, Tappan Zee Bridge Project costs are not reflected in the financial analysis of this report.
Current, up‐to‐date information on the Tappan Zee Bridge Project can be found at the following
website: http://www.thenewtzb.ny.gov/.
C. Planned Capital Program Expenditures Table V‐1 shows the total planned expenditures over the period 2012 to 2016, excluding the costs of the
Tappan Zee Bridge project. Actual expenditures from 2011 are included as a reference point and the
figures shaded in green make up the adopted 2012‐2015 Capital Program.

Page V‐4
Table V‐1: Projected Total Capital Program Expenditures (millions)
Year
Thruway Highway and
Bridges Capital
Expenditures
Equipment Replacement and Other Facility
Capital Needs
Canal Capital Program
Total Capital Program
Expenditures
2011 (A) $367.6 $49.5 $27.4 $444.5
2012 285.4 47.1 51.4 384.0
2013 263.1 48.8 62.1 374.0
2014 282.5 43.7 50.8 377.0
2015 291.6 40.7 51.2 383.5
2016 380.8 39.2 54.4 474.3
Total 2012‐2016 $1,503.4 $219.5 $269.9 $1,992.8
D. The Impact of the 20122015 Capital Program on Conditions As previously noted, the main goals of the Authority’s capital and maintenance program is to preserve a
high level of patron safety and service, maintain facilities in a state of good repair and ensure the overall
reliability of the highway system. One measure of the effectiveness of these maintenance and capital
programs is the condition ratings of highway and bridge facilities.
Figure V‐1 displays the historic average rating of Thruway pavement surface conditions since 1988 and
the projected ratings as a result of the current Capital Program. During the life of the proposed capital
program, it is projected that the pavement ratings for the Thruway facilities will remain in the “good”
range, though at a level slightly below that of previous years. Similarly, the Authority maintains ratings
of all of the Bridge Structures. Figure V‐2 shows the Bridge ratings since 1988. The current plan will
maintain the average rating of all Bridges at an average rating of “good”. However, it is important to
note that the average bridge condition rating is closely approaching the “fair” category. Table V‐2
presents a summary of Bridge and Pavement ratings on the Thruway as of December 31, 2011. Roughly
half of the bridges are in poor or fair condition and almost all pavement miles (shown as a two
directional total in 1/10th miles) are in good or excellent condition. The Authority strictly complies with
all State and Federal bridge inspection requirements and the assessments in this report reflect results of
such inspections.
Table V‐2: Current Bridge and Pavement Conditions
Condition Number of Bridges Pavement Miles (in 1/10th)
Excellent 35 3,400
Good 364 7,708
Fair 363 70
Poor 49 0
Total 811 11,178

Page V‐5
Figure V‐1 Thruway Pavement Condition Ratings, 1988 ‐2016
0
1
2
3
4
5
6
7
8
9
101
98
8
19
89
19
90
19
91
19
92
19
93
19
94
19
95
19
96
19
97
19
98
19
99
20
00
20
01
20
02
20
03
20
04
20
05
20
06
20
07
20
08
20
09
20
10
20
11
20
12
20
13
20
14
20
15
20
16
Rat
ing
Year
NYS Thruway Authority 1988 - 2016 Annual Pavement Surface Condition Rating Average
Historical Projected
Excellent
Good
Fair
Poor
Figure V‐2 Thruway Bridge Condition Ratings, 1988 – 2016
1.0
1.5
2.0
2.5
3.0
3.5
4.0
4.5
5.0
5.5
6.0
6.5
7.0
19
88
19
89
19
90
19
91
19
92
19
93
19
94
19
95
19
96
19
97
19
98
19
99
20
00
20
01
20
02
20
03
20
04
20
05
20
06
20
07
20
08
20
09
20
10
20
11
20
12
20
13
20
14
20
15
20
16
Ra
tin
g
Year
NYS Thruway Authority 1988 - 2016 Annual Bridge Condition Rating Average
Historical Projected
Excellent
Good
Fair
Poor

Page VI‐1
VI. Expenses and Revenues with the Current Toll Schedule As noted earlier in this report, the current toll schedule implemented by the Authority was only
intended to provide revenues necessary to fulfill operating, capital, maintenance and other
commitments through the end of the 2005‐2011 Capital Program. The following section summarizes the
important components of the Authority’s current long‐term financial plan based on the current toll
structure, the 2012‐2015 Capital Program and operating expenses under a new program of operational
streamlining.
A. Projected Operating and Maintenance Expenses Table VI‐1 shows estimated operating and maintenance expenses for the Thruway and Canal Systems
assuming the impact of the Authority’s new operational streamlining program. As noted earlier in this
report, over the last five years the Authority has been able to limit core operating expense growth.
However, the Authority is currently initiating a new operational streamlining program that is expected
to significantly reduce future operating expenses in 2012 and beyond. Underscoring the significance of
this program, as seen in Table VI‐1, the Authority expects to hold operating costs at relatively the same
level from 2011 through 2014, involving a reduction in operating costs by some $119.5 million over prior
forecasts from 2012 through 2016.
The Authority’s streamlining program will likely consist of further workforce reductions, a realignment of
employee benefits reductions to comport with the State benefit plans, additional departmental
consolidations and reorganizations, reductions in vehicle and equipment fleets, further reductions in
overtime and the number of toll lanes that are staffed, bulk purchasing of goods and services with other
entities to reduce pricing, and many other initiatives.
Table VI‐1: Projected Operating and Maintenance Expenses (millions)
Year Thruway Enhanced Operating
Cuts
Canal System
Enhanced Operating
Cuts
Total Operating and Maintenance Expenses
2011 (A) $370.0 $0.0 $51.3 $0.0 $421.3
2012 375.3 0.0 55.7 0.0 431.0
2013 389.9 ‐21.0 53.2 ‐0.5 421.7
2014 401.5 ‐31.0 54.8 ‐1.0 424.4
2015 413.5 ‐31.0 56.5 ‐1.6 437.4
2016 425.7 ‐31.8 58.2 ‐1.6 450.5
Total 2012‐2016 $2,005.9 ‐$114.8 $278.4 ‐$4.7 $2,165.0
B. Projected (NonTappan Zee) Debt Service Expenses Table VI‐2 shows debt service expenses on general revenue bonds and notes issued under the Bond
Resolution to support the Authority’s current and future capital needs, as manifested in the 2012‐2015
Capital Program. As noted, debt service expenses are expected to increase as the Authority issues

Page VI‐2
additional bonds to refinance outstanding notes and finance the future infrastructure needs of the
Thruway and Canal Systems. As noted above, in the absence of a final approved alternative and
financial plan, this analysis excludes the new Tappan Zee Bridge Project.
Table VI‐2: Projected Annual Debt Service (millions)
Year Debt Service on Outstanding
Bonds & Notes
Debt service on New Debt issued
(non‐TZ)
Total Debt Service and Requirements
2011 (A) $181.8 $0.0 $181.8
2012 167.6 35.2 202.8
2013 167.6 78.9 246.5
2014 167.6 96.5 264.1
2015 167.6 117.4 285.0
2016 167.6 144.8 312.4
Total 2012‐2016 $838.0 $472.8 $1,310.8
C. Projected Toll and Other Revenues Recently, traffic on the Thruway System and on other facilities in certain regions of the economy are
exhibiting signs of growth, suggesting the economic recovery is gaining strength. However, the slow and
deliberate pace of the economic recovery is expected to result in relatively flat growth in passenger car
toll revenues from 2011 to 2012, with only slight growth thereafter. Commercial traffic, however, is
currently showing stronger signs of growth and is expected to lead to healthy revenue growth from
2011 to 2012, with continued growth thereafter. It is important to note that while traffic growth is
expected in the future, total traffic levels are not expected to return to pre‐recession levels within the
forecast period. In addition, Other Revenue, including interest earnings, E‐ZPass fees and other sources
is expected to remain flat from 2012 through 2016. Traffic and revenue projections are contained in
Table VI‐3 and Table VI‐4.

Page VI‐3
Table VI‐3: Traffic Projections with Existing Toll Schedule (millions of Trips)
Year Passenger Commercial Total Growth
2011(A) 220.1 25.2 245
2012 222.6 25.6 248.2 1.2%
2013 223.4 25.9 249.3 0.4%
2014 225.5 26.4 251.9 1.0%
2015 228.5 26.9 255.4 1.4%
2016 231.6 27.4 259.0 1.4%
Table VI‐4: Estimated Annual Revenues with Existing Toll Schedule (millions)
Year Passenger Commercial Total Toll Revenue
Other Revenue
Total Revenue
2011 (A) $403.9 $230.2 $634.1 $31.4 $665.5
2012 409.4 234.0 643.4 32.0 675.4
2013 410.4 235.4 645.8 32.5 678.3
2014 413.8 239.3 653.0 33.8 686.8
2015 418.9 243.1 661.9 34.8 696.7
2016 424.1 246.9 671.0 35.8 706.8
Total 2012‐2016 $2,076.6 $1,198.6 $3,275.1 $168.9 $3,444.0
D. Total Sources and Uses Table VI‐5 and Table VI‐6 identify the total projected annual financial requirements for the period 2012
through 2016, reflecting the Authority’s capital, operational, maintenance and other needs exclusive of
the Tappan Zee Bridge Project and inclusive of the operational streamlining program.

Page VI‐4
Table VI‐5: Total Projected Annual Financial Requirements (millions)
Year Capital Program
Operating and Maintenance Expenses
Debt Service Total
Requirements
2012 $384.0 $431.0 $202.8 $1,017.8
2013 374.0 421.7 246.5 1,042.2
2014 377.0 424.4 246.1 1,065.5
2015 383.5 437.4 285.0 1,105.9
2016 474.3 450.5 312.4 1,237.2
Total 2012‐2016 $1,992.8 $2,165.0 $1,310.8 $5,468.6
Table VI‐6: Projected Funding Sources with Existing Toll Schedule (millions)
Year
Total Requirements without Tappan Zee Replacement
Funding Sources
Federal Aid
Other Debt Proceeds
Subtotal Exclusive of Thruway Revenues
Revenues Required from
Tolls, etc.
2012 $1,017.8 $2.9 $37.5 $277.4 $317.8 $700.0
2013 1,042.2 1.0 41.9 235.4 278.3 763.9
2014 1,065.5 0.7 12.2 278.9 291.8 773.7
2015 1,105.9 0.0 12.4 308.3 320.7 785.2
2016 1,237.2 0.0 13.1 424.5 437.6 799.6
Total 2012‐2016 $5,468.6 $4.6 $117.1 $1,524.5 $1,646.2 $3,822.4

Page VI‐5
E. Flow of Funds Analysis with Current Toll Schedule As noted in Table VI‐7, despite the implementation of operational streamlining and reductions to the
2012‐2015 Capital Program, the Authority’s current toll schedule provides insufficient funding to pay for
planned expenses from 2013 through 2016, resulting in a funding shortage of approximately $374.2
million.
Table VI‐7: Projected Available Revenues vs. Required Revenues with Existing Toll Schedule (millions)
Year Revenues
Required from Tolls, etc.
Revenues with Existing Toll Schedule
Annual Shortage Cumulative Shortage
2012 $700.0 $679.6 ‐$20.4 ‐$20.4
2013 763.9 678.3 ‐85.6 ‐106.0
2014 773.7 686.8 ‐86.9 ‐192.9
2015 785.2 696.7 ‐88.5 ‐281.4
2016 799.6 706.8 ‐92.8 ‐374.2
Total 2012‐2016 $3,822.4 $3,448.2 ‐$374.2
In addition, as shown in Table VI‐8, the Authority’s current toll schedule is insufficient to maintain debt
service coverage and Pay‐As‐You‐Go financing levels. The Authority’s Bond Resolution requires a
minimum debt service coverage ratio of 1.2x and the Authority’s Fiscal Management Guidelines requires
a minimum coverage ratio of 1.5x. As noted in this table, despite capital program reductions and
operational streamlining program, in 2012 the Authority’s debt service coverage ratio is expected to
equal 1.49x and by 2016 the coverage ratio will be as low as 0.97x. Furthermore, Pay‐As‐You‐Go
financing of the Authority’s 2012‐2015 Capital Program will decline to very low levels, ending up in 2016
near 10 percent.
As a result of funding shortages and poor financial metrics, Jacobs is recommending that the Authority
supplement its operational streamlining efforts with an action to enhance revenues so that it may meet
its goal of preserving fiscal stability until a more long‐term plan can be developed that includes the
Tappan Zee Bridge Project.

Page VI‐6
Table VI‐8: Flow of Funds with the Existing Toll Schedule
ACTUAL PROJECTED
2011 2012 2013 2014 2015 2016 Total (2012-2016)
Total Revenues $665.5 $675.4 $678.3 $686.8 $696.7 $706.8 $3,444.0
Less: Operating Expenses 365.5 372.3 365.9 367.5 379.6 390.9 1,876.2 Operating Reserves 4.6 3.0 3.0 3.0 3.0 3.0 15.0 Total 370.0 375.3 368.9 370.5 382.6 393.9 1,891.2
Net Revenues 295.5 300.1 309.4 316.3 314.1 312.9 1,552.8
Less: Debt Service 167.4 200.9 250.3 272.0 295.5 323.5 1,342.2
Net Revenues After Debt Service 128.1 99.2 59.1 44.2 18.6 (10.6) 210.6
Less: Retained for Operating Reserves (4.3) 4.2 - - - - 4.2
Net Revenues 123.8 103.4 59.1 44.2 18.6 (10.6) 214.7
Less: Reserve Maintenance Provisions (2) 10.0 40.6 - - - - 40.6
Other Authority Projects 51.3 55.7 52.7 53.8 54.9 56.6 273.8
General Reserve Fund 48.2 5.2 28.6 33.3 30.4 36.7 134.2
General Reserve Fund - CP1, CP 2 & BAN's 14.4 1.9 0.6 0.6 0.6 0.6 4.3
Balance After Reserve Maintenance -0.1 0.0 -22.9 -43.6 -67.3 -104.5 -238.2Provisions, Other Authority Projectsand General Reserve Fund
Adjustments for Cash Basis - - - - - - -
Net Balance Available for Working Capital -$0.1 $0.0 -$22.9 -$43.6 -$67.3 -$104.5 -$238.2(1) Totals may not add due to rounding. (2) Shows the Reserve Maintenance Fund provision would be funded from Debt proceeds when sufficient revenues are not available.
Debt Service Coverage 1.77 1.49 1.24 1.16 1.06 0.97
Pay go % 17.6% 27.8% 14.3% 12.3% 11.2% 10.5%

Page VII‐1
VII. Proposed Modifications to Current Toll Rates and the Impact to the Authority’s Financials As concluded in the previous section of this report, funding shortages, inadequate debt service coverage
ratios and low Pay‐As‐You‐Go financing generated from the current toll scheduled will require the
Authority to pursue new revenue sources to complement its program of enhancing operational
efficiency. This section recommends a specific toll adjustment that will provide fiscal stability and
healthy financial metrics until a more holistic financing plan, that includes the Tappan Zee Bridge
Project, is developed later in 2012 or in early 2013.
A. Current Toll Rates The 2010 rates are in effect today and the Authority’s current toll rate structure is outlined in Table
VII‐1. Toll collections for passenger and commercial vehicles from 2005 through 2011 are summarized in
Table III‐7.
Table VII‐1: Current Thruway Toll Structure ($)
2010
Controlled (Cents/Mile)
Yonkers Harriman Spring Valley New Rochelle Tappan Zee Grand Island
Cash E-Z
Pass Cash
E-Z Pass
Cash E-Z
Pass Cash
E-Z
Pass(1)
Cash
E-Z Pass
Cash E-Z Pass(1)
Cash E-Z
Pass
Commuter - * - 0.55 - 0.55 - - - 1.10 - 3.00 - 0.28
Motor Cycle
- 0.0235 - 0.63 - 0.63 - - - 0.88 - 2.50 - 0.50
2L 0.0470 0.0447 1.25 1.19 1.25 1.19 - - 1.75 1.66 5.00 4.75 / 4.75 1.00 0.95
3L 0.0728 0.0691 1.50 1.43 1.50 1.43 3.00 3.00 / 1.50 2.50 2.38 11.50 11.50 / 5.75 1.50 1.43
4L 0.0864 0.0821 1.75 1.66 1.75 1.66 4.50 4.50 / 2.25 3.00 2.85 13.75 13.75 / 6.88 1.75 1.66
2H 0.0933 0.0886 2.00 1.90 2.00 1.90 5.25 5.25 / 2.63 3.50 3.33 14.75 14.75 / 7.38 2.00 1.90
3H 0.1604 0.1524 2.25 2.14 2.75 2.61 8.25 8.25 / 4.13 4.25 4.04 20.75 20.75 / 10.38 2.25 2.14
4H 0.1768 0.1680 2.75 2.61 3.00 2.85 8.25 8.25 / 4.13 5.00 4.75 24.75 24.75 / 12.38 2.75 2.61
5H 0.2390 0.2271 4.25 4.04 4.25 4.04 13.50 13.50 / 6.75 8.00 7.60 32.75 32.75 / 16.38 4.25 4.04
6H 0.2963 0.2815 4.50 4.28 5.00 4.75 14.75 14.75 / 7.38 8.75 8.31 41.00 41.00 / 20.50 4.50 4.28
7H 0.3536 0.3359 5.00 4.75 5.75 5.46 16.50 16.50 / 8.25 9.75 9.26 49.25 49.25 / 24.63 5.00 4.75
B. Recommended Increase to Commercial Tolls Jacobs is recommending that the Authority advance a 45 percent increase on commercial toll rates as a
means to meet the goals established above. However, in an effort to lessen the impact on local
businesses that rely on the Thruway System, this recommended toll adjustment would exclude 2H
commercial vehicle types.
Commercial vehicles and overweight trucks represent the single greatest demand on highway and
bridge infrastructure from both an engineering and financial standpoint. It is this impact that supports
our recommendation to implement an adjustment to only commercial toll rates at this time. According
to information received from the Authority, based on a NYSDOT report:

Page VII‐2
An average passenger vehicle (typically 2‐axle) operating at 4,000 pounds causes minimal
harm to highway pavement or bridges;
Pavement damage increases exponentially as vehicle weight increases;
One legally loaded 80,000 pound gross weight (typically 5‐axle) commercial vehicle causes
wear‐and‐tear on the road equal to approximately 9,600 passenger vehicles; and
If a truck is loaded to 95,000 pounds (15,000 pounds overweight/beyond the legal limit), its
pavement damaging impact will nearly double to the similar degree of the damage caused
by 19,000 passenger vehicles.
Figure VII‐1 compares five‐axle trucks’ toll rates per mile on the Thruway ticket system to those charged
on other toll roads in the northeast. Figure VII‐2 compares Tappan Zee Bridge five‐axle truck tolls to
round‐trip tolls on other major river crossings in the northeast. It is important to note that many of the
other toll facilities analyzed are not as old nor do they experience the same heavy weather conditions as
the Thruway. As seen from these figures, current commercial toll rates on both the ticket system and
the Tappan Zee Bridge are below the average in the region.
With the proposed 45 percent increase, ticket system commercial tolls will still remain below the
average for toll roads and the commercial toll rate in the Tappan Zee Bridge toll increase will bring tolls
within the range of rates currently charged at the MTA Bridges & Tunnels and Port Authority of NY and
NJ crossings. It is important to keep in mind that large toll increases are either planned or are likely to
occur at many of the other facilities shown in these figures. As a result, the recommended 45 percent
commercial toll adjustment will maintain the Thruway’s position as a relatively inexpensive toll facility.

Page VII‐3
Figure VII‐1: NYSTA Ticket System Toll Rates Compared to Other Toll Roads in the Northeast, 5‐Axle Trucks
0 20 40 60 80 100 120 140 160 180 200 220
Massachusetts Tpke., State Line to Boston (MA)
Dulles Toll Road (VA)
Garden State Parkway (NJ)
Central Tpke (NH)
Spaulding Tpke (NH)
Maine Turnpike (ME)
West Virginia Turnpike (WV)
Indiana Toll Road (IN)
Chesapeake Expressway (VA)
NEW YORK STATE THRUWAY (CURRENT)
NEW YORK STATE THRUWAY (2012 TOLL INCREASE)
New Jersey Turnpike (NJ)
Pennsylvania Turnpike (PA)
Blue Star Tpke (NH)
North‐South Tollway (IL) (Veterans Memorial)
Massachusetts Tpke., Boston Extension (MA)
JFK Memorial Highway (MD)
Pocahontas Parkway (VA)
Delaware Turnpike (I‐95) (DE)
Dulles Greenway (VA)
Chicago Skyway (IL)
Peak Toll Rate Per Mile (cents per mile), 5‐Axle Trucks
Standard Rate Discounted ETC Rate
Figure VII‐2: Tappan Zee Bridge Toll Rates Compared to Other Tolled Crossings in the Northeast, 5‐Axle Trucks
$0.00 $20.00 $40.00 $60.00 $80.00 $100.00 $120.00
Newburgh‐Beacon Bridge (NY)
I‐80 and I‐78 Bridges (PA/NJ)
Chesapeake Bay Bridge (MD)
Delaware Memorial Bridge (DE/NJ)
TAPPAN ZEE BRIDGE (CURRENT)
Baltimore Harbor & Ft. McHenry Tunnels (MD)*
Ben Franklin & Walt Whitman Bridges (PA/NJ)
TAPPAN ZEE BRIDGE (2012 TOLL INCREASE)
Port Authority Crossings, DEC 2015 (NY/NJ)
Port Authority Crossings, DEC 2014 (NY/NJ)
Port Authority Crossings, DEC 2013 (NY/NJ)
Port Authority Crossings, DEC 2012 (NY/NJ)
Port Authority Crossings, CURRENT (NY/NJ)
RFK, Whitestone, and Throgs Neck Bridges (NYC)*
Verrazano‐Narrows Bridge (NY)
Toll Rate, 5‐Axle Trucks
Discounted Peak E‐Z Off Peak E‐ZPass Toll Standard Peak E‐ZPass Toll Cash Toll
*Round trip tolls. Tolls paid per direction are half of the amount shown.

Page VII‐4
It is important to note that previous toll increases indicate that Thruway traffic is relatively insensitive to
increases in the toll rates. This is due in part to the fact that there are few effective competitive routes,
and that the physical condition of the Thruway is generally better than that of alternative routes. The
safety and security related services, such as snow plowing and police patrols, are better on the Thruway
than on alternative routes. Additionally, travel plazas along the length of the Thruway provide 24‐hour
fuel, rest stop, and food services without the need to exit the system. As a result of any toll increase,
slight declines in traffic volumes are expected. The decline in volumes includes operators that choose an
alternative route, combine trips or choose not to travel at all. The amount of diverted traffic from the
recommended 45 percent adjustment to certain commercial toll rates is not expected to be significant
as a result of the proposed toll modifications. Table VII‐2 presents the proposed commercial toll
schedule.
Table VII‐2: Proposed Commercial Toll Rates, 2012
2012 Controlled Yonkers Harriman Spring Valley New Rochelle Tappan Zee Grand Island
Cash E‐Z
Pass
Cash E‐Z
Pass
Cash E‐Z
Pass
Cash E‐Z Pass(1)
Cash E‐Z
Pass
Cash E‐Z Pass(1)
Cash E‐Z
Pass
3H 0.2326 0.2210 3.50 3.33 4.00 3.80 12.00 12.00/6.00 6.25 5.94 30.25 30.25/15.13 3.50 3.33
4H 0.2564 0.2436 4.00 3.80 4.50 4.28 12.00 12.00/6.00 7.25 6.89 36.00 36.00/18.00 4.00 3.80
5H 0.3466 0.3293 6.25 5.94 6.25 5.94 19.75 19.75/9.88 11.75 11.16 47.50 47.50/23.75 6.25 5.94
6H 0.4296 0.4081 6.75 6.41 7.25 6.89 21.50 21.50/10.75 12.75 12.11 59.50 59.50/29.75 6.75 6.41
7H 0.5127 0.4871 7.25 6.89 8.50 8.08 24.00 24.00/12.00 14.25 13.54 71.50 71.50/35.75 7.25 6.89
(1) Peak/Off Peak E‐ZPass Rates
Table VII‐3 provides a comparison of existing and proposed toll rates for sample trips along the Thruway
System for Class 5H vehicles.
Page VII‐5
Table VII‐3: Current and Proposed Toll Rates for Sample Class 5H Trips
Current Proposed $ Change % Change
Cash $7.10 $10.30 $3.20 45.1%
E‐ZPass $6.75 $9.79 $3.04 45.1%
Cash $28.10 $40.75 $12.65 45.0%
E‐ZPass $26.70 $38.71 $12.02 45.0%
Cash $4.90 $7.05 $2.15 43.9%
E‐ZPass $4.66 $6.69 $2.04 43.7%
Cash $16.30 $23.60 $7.30 44.8%
E‐ZPass $15.49 $22.42 $6.93 44.8%
Cash $5.75 $8.30 $2.55 44.3%
E‐ZPass $5.46 $7.89 $2.43 44.5%
Cash $10.00 $14.50 $4.50 45.0%
E‐ZPass $9.50 $13.78 $4.28 45.0%
Cash $1.65 $2.35 $0.70 42.4%
E‐ZPass $1.57 $2.23 $0.67 42.4%
Syracuse (36) to Rochester (45)
Geneva (42) to Rochester (45)
Leroy (47) to Williamsvil le (50)
Lackawanna (55) to Hamburg (57)
Albany (23) to Schenectady (26)
Sample TripPayment
Type
Class 5H Trip Toll
Woodbury (15) to Newburgh (17)
Woodbury (15) to Albany (24)
C. Toll and Other Revenues Table VII‐5 presents the projected toll revenues based on the recommended 45 percent increase in
commercial tolls. The forecast assumes that commercial traffic will be tempered in 2012 and 2013 as
the proposed toll increase takes effect later in 2012, prompting some commercial customers to reduce
their driving on the Thruway, either by using a different route, combining trips, or not making their trip.
As noted earlier, diversion off the Authority system in response to toll changes has been historically low
and temporary. Modest passenger and commercial traffic growth is projected after 2013 as the
economy recovers from the recent recession. Traffic estimates, inclusive of the recommended
commercial rate adjustment, are contained in Table VII‐4. Figure VII‐3 and Figure VII‐4 show
corresponding graphs of historical and projected traffic and revenue for passenger, commercial and
total vehicles.

Page VII‐6
Table VII‐4: Estimated Traffic with Proposed Toll Schedule (millions)
Year Passenger Cars Commercial Vehicles
Total Percent Change Control Barrier Control Barrier
2010 1 129.0 93.8 15.7 9.1 247.6 ‐
2011 1 126.6 93.5 15.8 9.3 245 ‐1.0%
2012 2 128.0 94.6 15.9 9.4 247.9 1.1%
2013 128.5 94.9 15.4 9.3 248.1 0.1%
2014 129.7 95.8 15.7 9.4 250.6 1.0%
2015 131.5 97.0 16.0 9.6 254.2 1.4%
2016 133.3 98.4 16.3 9.8 257.8 1.4%
1 Actual 2 Toll Increase September 30, 2012
Table VII‐5: Estimated Annual Revenues with Proposed Toll Schedule (millions)
Year Passenger Revenue
Commercial Revenue
Total Toll Revenue
Other Revenue(1)
Total Revenue
2012 $409.4 $254.5 $663.9 $31.9 $695.8
2013 410.4 320.9 731.3 32.5 763.8
2014 413.8 326.1 739.9 33.9 773.7
2015 418.9 331.5 750.4 34.9 785.2
2016 424.2 336.6 760.7 35.9 796.7
Total 2012‐2016 $2,076.6 $1,569.6 $3,646.1 $169.1 $3,815.2 (1) Due to interest earnings on additional revenue

Page VII‐7
Figure VII‐3: Historical and Projected Toll Traffic with Proposed Toll Schedule, Thruway System, 1987 ‐ 2016
Figure VII‐4: Historical and Projected Toll Revenue with Proposed Toll Schedule, Thruway System, 1987 ‐ 2016

Page VII‐8
D. Funding Requirement and Sources Table VII‐6 through Table VII‐8 show the estimated projected expenses and revenues for the Authority,
based on the recommended 45 percent commercial toll adjustment and the operational streamlining
actions outlined earlier. As noted in Table VII‐8, the 45 percent toll adjustment will provide the
revenues required to meet expenses and meet the requirements of the Bond Resolution.
Table VII‐6: Total Projected Annual Requirements with Proposed Toll Schedule (millions)
Table VII‐7: Projected Funding Sources with Proposed Toll Schedule (millions)
Year Total Sources
Funding Sources
Federal Aid
Other Debt
Proceeds
Subtotal Exclusive of Thruway Revenues
Revenues Required from Tolls,
etc.
2012 $1,017.8 $2.9 $37.5 $277.4 $317.8 $700.0
2013 1,042.2 1.0 41.9 235.4 278.3 763.9
2014 1,065.5 0.7 12.2 278.9 291.8 773.7
2015 1,105.9 0.0 12.4 308.3 320.7 785.2
2016 1,237.2 0.0 13.1 424.5 437.6 799.6
Total 2012‐2016 $5,468.6 $4.6 $117.1 $1,524.5 $1,646.2 $3,822.4
Year Capital Program
Operating and Maintenance
Debt Service Total Requirements
2012 $384.0 $431.0 $202.8 $1,017.8
2013 374.0 421.7 246.5 1,042.2
2014 377.0 424.4 264.1 1,065.5
2015 383.5 437.4 285.0 1,105.9
2016 474.3 450.5 312.4 1,237.2
Total 2012‐2016 $1,992.8 $2,165.0 $1,310.8 $5,468.6

Page VII‐9
Table VII‐8: Available Revenues vs. Required Revenues with Proposed Toll Schedule (millions)
Year Revenues
Required from Tolls, etc.
Revenues with Proposed Toll Schedule
Amount Over/Under Minimum Required
Cumulative Amount
Over/Under
2012 $700.0 $700.0 $0.0 $0.0 2013 763.9 763.8 ‐0.1 ‐0.1
2014 773.7 773.7 0.0 ‐0.1
2015 785.2 785.2 0.0 ‐0.1
2016 799.6 796.7 ‐2.9 ‐3.0

Page VIII‐1
VIII. SUMMARY OF FINDINGS Table VIII‐1 shows the projected Flow of Funds, as defined by the Authority’s Bond Resolution, inclusive
of a 45 percent commercial toll adjustment implemented in December 2012. As noted, this adjustment,
coupled with operational streamlining, will allow debt service coverage to be 1.6x in 2012, 1.6x in 2013
and decreasing to 1.53x in 2014, 1.42x in 2015 and 1.29x in 2016. As a result, Jacobs believes that the
revised toll rate structure will allow the Authority to build a strong foundation under which it can
maintain its system in a state of good repair, fulfill its critical role in supporting the State’s growing
economy, preserve its strong financial credit rating and comply with bond holder covenants until a
financing plan is developed to address the Tappan Zee Bridge Project and the Authority’s long‐term
capital needs in late 2012 or early 2013.
Table VIII‐1: Flow of Funds with the Proposed Toll Schedule
ACTUAL PROJECTED
2011 2012 2013 2014 2015 2016 Total (2012 to 2016)
Available Revenues $665.5 $695.8 $763.8 $773.7 $785.2 $796.7 $3,815.2
Less: Operating Expenses 365.5 372.3 365.9 367.5 379.6 390.9 1,876.2 Operating Reserves 4.6 3.0 3.0 3.0 3.0 3.0 15.0 Total 370.0 375.3 368.9 370.5 382.6 393.9 1,891.2
Net Revenues 295.5 320.5 394.8 403.2 402.7 402.7 1,924.0
Less: Debt Service 167.4 200.8 245.9 263.5 284.4 311.8 1,306.5
Net Revenues After Debt Service 128.1 119.7 148.9 139.7 118.3 90.9 617.5
Less: Retained for Operating Reserves (4.3) 4.2 - - - - 4.2
Net Revenues 123.8 123.8 148.9 139.7 118.3 90.9 321.7
Less: Reserve Maintenance Provisions (2) 10.0 61.0 67.0 51.9 32.3 - 212.2
Other Authority Projects 51.3 55.7 52.7 53.8 54.9 56.6 273.8
General Reserve Fund 48.2 5.2 28.6 33.3 30.4 36.7 134.2
General Reserve Fund - BAN's/Line of Credit 14.4 1.9 0.6 0.6 0.6 0.6 4.3
Balance After Reserve Maintenance -0.1 0.0 0.0 0.0 0.0 -3.0 -3.0Provisions, Other Authority Projectsand General Reserve Fund
Adjustments for Cash Basis 0.1 - - - - - -
Net Balance Available for Working Capital $0.0 $0.0 $0.0 $0.0 $0.0 -$3.0 -$3.0(1) Totals may not add due to rounding. (2) Shows the Reserve Maintenance Fund provision will be funded from Debt proceeds when sufficient revenues are not available.
Debt Service Coverage 1.76 1.60 1.61 1.53 1.42 1.29
Pay go % 17.6% 27.8% 37.1% 26.0% 19.6% 10.5%

APPENDIX A
Hypothetical Toll Analysis
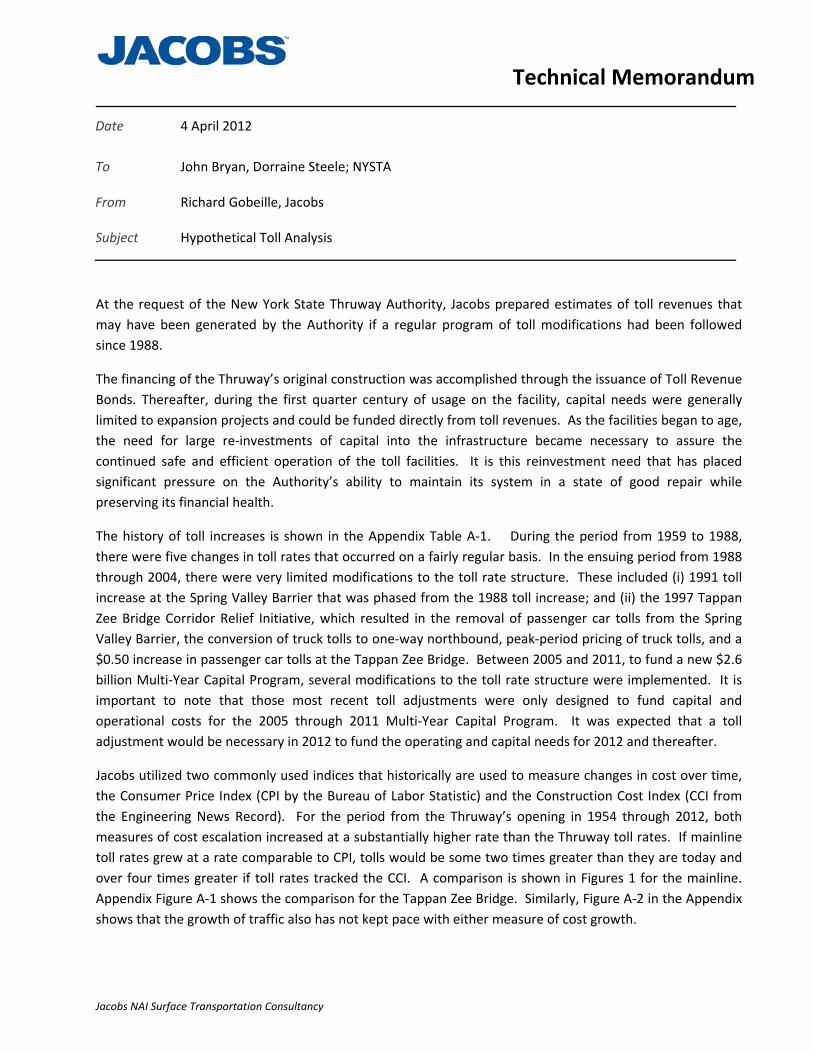
Jacobs NAI Surface Transportation Consultancy
Technical Memorandum
Date 4 April 2012
To John Bryan, Dorraine Steele; NYSTA
From Richard Gobeille, Jacobs
Subject Hypothetical Toll Analysis
At the request of the New York State Thruway Authority, Jacobs prepared estimates of toll revenues that may have been generated by the Authority if a regular program of toll modifications had been followed since 1988.
The financing of the Thruway’s original construction was accomplished through the issuance of Toll Revenue Bonds. Thereafter, during the first quarter century of usage on the facility, capital needs were generally limited to expansion projects and could be funded directly from toll revenues. As the facilities began to age, the need for large re‐investments of capital into the infrastructure became necessary to assure the continued safe and efficient operation of the toll facilities. It is this reinvestment need that has placed significant pressure on the Authority’s ability to maintain its system in a state of good repair while preserving its financial health.
The history of toll increases is shown in the Appendix Table A‐1. During the period from 1959 to 1988, there were five changes in toll rates that occurred on a fairly regular basis. In the ensuing period from 1988 through 2004, there were very limited modifications to the toll rate structure. These included (i) 1991 toll increase at the Spring Valley Barrier that was phased from the 1988 toll increase; and (ii) the 1997 Tappan Zee Bridge Corridor Relief Initiative, which resulted in the removal of passenger car tolls from the Spring Valley Barrier, the conversion of truck tolls to one‐way northbound, peak‐period pricing of truck tolls, and a $0.50 increase in passenger car tolls at the Tappan Zee Bridge. Between 2005 and 2011, to fund a new $2.6 billion Multi‐Year Capital Program, several modifications to the toll rate structure were implemented. It is important to note that those most recent toll adjustments were only designed to fund capital and operational costs for the 2005 through 2011 Multi‐Year Capital Program. It was expected that a toll adjustment would be necessary in 2012 to fund the operating and capital needs for 2012 and thereafter.
Jacobs utilized two commonly used indices that historically are used to measure changes in cost over time, the Consumer Price Index (CPI by the Bureau of Labor Statistic) and the Construction Cost Index (CCI from the Engineering News Record). For the period from the Thruway’s opening in 1954 through 2012, both measures of cost escalation increased at a substantially higher rate than the Thruway toll rates. If mainline toll rates grew at a rate comparable to CPI, tolls would be some two times greater than they are today and over four times greater if toll rates tracked the CCI. A comparison is shown in Figures 1 for the mainline. Appendix Figure A‐1 shows the comparison for the Tappan Zee Bridge. Similarly, Figure A‐2 in the Appendix shows that the growth of traffic also has not kept pace with either measure of cost growth.

Technical Memorandum Page 2 of 4
Jacobs NAI Surface Transportation Consultancy
Figure 1: Comparison of Actual and Hypothetical Toll Rates for Passenger Cars on the Ticket System
Table A‐2 in the appendix shows Revenues, Operating and Maintenance (O&M) Costs, Debt Service, and Revenues Available for Capital for the period 1988 through 2011. Over this period, operating costs appear to have increased significantly during the period from 1988 through 2005. However, there were two onetime changes to the O&M requirements that were the primary contributors to the increase. In 1992, the Authority assumed responsibility for the Canal that added approximately $30 million of additional expenses annually, which have grown to over $80 million today. In addition, operating expenses were impacted in 2002 due to implementation of GASB 34 (Statement #34 of the Governmental Accounting Standards Board), which required certain capital and equipment expenditures to be treated as operating expenses. To help offset these increases, the Authority implemented a significant cost containment program that, among other savings, resulted in the elimination of 613 positions since 1995.
From 1988 through 2005, Debt Service also escalated significantly. During this period, the Thruway completed numerous capacity expansion and safety projects. Also, given the Thruway’s age, significant reinvestment of capital has been required to maintain the quality of service and safety that is expected by the users of the System. Since 1988, a large portion of this capital program was funded through bonding with increasing debt service being a reflection of the continued investment in the Authority’s aging highway and bridge infrastructure.
The Authority’s capital program since 1988 is summarized in Table A‐3. As noted in this table, total revenues collected in 2011 are more than double what was collected in 1988, while the pay‐as‐you‐go funding for capital programs has been reduced by almost 50 percent. Figure A‐2 shows the change over time in the pay‐as‐you‐go share of capital expenses. As the differential between revenues and costs increased over this period, the Thruway was required to take on more debt to fund its primary capital needs and maintain good highway and bridge conditions. With toll rates lagging behind the rising costs of maintenance and construction, the Thruways constantly re‐evaluated the types of infrastructure investments that were necessary to preserve good overall highway and bridge conditions. Those improvements, though effective, were not necessarily the optimum investment from a full life‐cycle perspective due to funding pressures.

Technical Memorandum Page 3 of 4
Jacobs NAI Surface Transportation Consultancy
If tolls had increased periodically in line with CPI over the period 1988 through 2011, it is estimated that the Thruway would have collected some $1.5 billion in additional toll revenues. If tolls had instead increased periodically in line with the CCI over the same period, it is estimated that the Thruway would have collected nearly $2.5 billion in additional revenues. Total revenues for each scenario are shown in Figure 2.
Figure 2: Estimated Annual Revenues (in millions) for Hypothetical Toll Increase Scenarios
Figure A‐4 in the Appendix shows a detailed estimation of toll revenues by year for the period 1988 through 2011, compared to actual toll revenues for this period. Overall, the series of toll increases implemented by the Thruway in the late 2000’s effectively caught up to the toll rates for the CPI scenario in 2010 (again, applying rates of inflation only since 1988, not since Thruway opening). However, the current rates are still well below those hypothetical rates indexed to the CCI.
Summary
Since 1988, the Thruway has implemented a robust capital program that has improved the safety, expanded the capacity in several sections, and began the process of investing in the preservation of the Thruway and Canal infrastructure. The limited toll modifications from 1988 through 2005 have resulted in large portions of the capital program being funded from debt. The significant additional toll revenues that may have been available if a regular toll adjustment program had been followed tied to either CPI or CCI would have altered the Thruway finances significantly. Among the outcomes that may have resulted if the additional toll revenues were collected include:
• Lower level of bond financing, • Higher pay‐as‐you‐go percentage preserving available revenues for future bond sales,

Technical Memorandum Page 4 of 4
Jacobs NAI Surface Transportation Consultancy
• Larger capital program moving some rehabilitation and reconstruction projects forward to potentially save on the life cycle cost for the improvements.
• Reduced pressure to increase tolls to fund the current capital program.
It is impossible to look back and determine precisely what program would have been followed through 2011. However, regardless of the program followed, the significant additional revenues shown in Table 1 would have placed the Thruway in a very strong financial position going forward in the recapitalization of the Thruway System.
Table 1: Estimated Annual Revenues (in millions) for Hypothetical Toll Increase Scenarios
Year Estimated Annual Revenue ($M)
Actual Total Hypothetical Total Hypothetical Additional Revenue CPI CCI CPI CCI
1988 $269.2 $269.2 $269.2 $0.0 $0.01989 $289.9 $289.9 $289.9 $0.0 $0.01990 $290.7 $290.7 $290.7 $0.0 $0.01991 $287.9 $287.9 $287.9 $0.0 $0.01992 $294.3 $294.3 $294.3 $0.0 $0.01993 $300.6 $356.7 $385.0 $56.1 $84.41994 $315.4 $374.3 $404.0 $58.9 $88.61995 $326.9 $387.9 $418.8 $61.0 $91.91996 $336.8 $399.7 $431.5 $62.9 $94.71997 $351.8 $406.9 $439.2 $55.1 $87.41998 $373.9 $479.5 $519.4 $105.6 $145.51999 $391.8 $502.6 $544.5 $110.9 $152.72000 $407.1 $522.6 $566.3 $115.6 $159.22001 $411.8 $528.6 $572.7 $116.8 $160.92002 $423.4 $544.0 $589.4 $120.6 $166.02003 $427.2 $610.7 $658.5 $183.5 $231.32004 $439.6 $628.6 $677.7 $189.0 $238.12005 $511.2 $626.1 $675.6 $114.9 $164.42006 $554.4 $628.8 $679.1 $74.5 $124.72007 $540.3 $614.7 $663.8 $74.4 $123.52008 $562.7 $601.8 $680.8 $39.1 $118.12009 $611.6 $626.9 $709.1 $15.2 $97.52010 $641.2 $632.8 $715.9 ‐$8.4 $74.72011 $634.1 $625.0 $707.2 ‐$9.0 $73.1
Cumulative $9,993.7 $11,530.4 $12,470.6 $1,536.7 $2,476.8
Notes: Green Shading Indicates Actual Toll Increase Orange Shading Indicates Hypothetical Increases at Regular Intervals

Jacobs NAI Surface Transportation Consultancy
Technical MemorandumAPPENDIX
Average toll increases from 1959 through 2010.
Table A‐1: Average Toll Increases 1959 through 2010
Year Average Increase
Notes Cars Trucks
1959 28% 18% Only Class 1‐4 increased 1970 0% 19.0% Class Change 1975 15% 8.0% Varied by Location 1980 25% 30% 1988 32% 38% 1991 14% 0% Spring Valley Passenger Cars Only
1997 20% 100% in Peak‐Period
Tappan Zee Corridor Relief (Congestion Pricing)
2005 25% 35% Class Change 2008 10% 10%
2008 July E‐ZPass Only, Discount Decreased to 5% from cash rate
2009 5% 5% 2010 5% 5%
Average Toll Rate compared to CPI and CCI.
Figure A‐1: Comparison of Actual and Hypothetical Toll Rates for Passenger Cars on the Tappan Zee Bridge

Technical Memorandum Appendix Page 2 of 5
Jacobs NAI Surface Transportation Consultancy
Thruway traffic growth compared to CPI and CCI.
Figure A‐2: Comparison of Thruway Traffic with Inflation and CCI

Technical Memorandum Appendix Page 3 of 5
Jacobs NAI Surface Transportation Consultancy
Pay‐as‐you‐go revenues available for capital Program.
Table A‐2: Revenues Available for Reserve Funds (in millions)
Year Total Revenues
Operating and Maintenance Debt Service(3) Total Costs
Available for Capital
Projects and Equipment Thruway(1) I‐84(2) Canal(2)
1988 $293.5 $135.0 ‐ ‐ $40.2 $175.2 $118.3 1989 319.1 139.6 ‐ ‐ 37.6 $177.2 141.9 1990 321.2 147.2 ‐ ‐ 42.9 $190.1 131.1 1991 308.7 157.9 ‐ ‐ 43.7 $201.6 107.1 1992 307.4 168.8 $5.5 $14.1 39.1 $227.5 79.9 1993 315.4 182.2 10.9 20.7 50.9 $264.7 50.7 1994 335.1 197.6 12.2 32.9 48.7 $291.4 43.7 1995 346.7 194.4 9.0 22.9 62.6 $288.9 57.8 1996 359.5 195.8 9.4 25.3 60.2 $290.7 68.8 1997 380.0 189.5 8.8 26.1 78.3 $302.7 77.3 1998 404.3 198.9 8.3 25.7 80.4 $313.3 91.0 1999 429.9 202.5 8.1 22.2 84.4 $317.2 112.7 2000 434.3 221.6 9.5 5.2 89.7 $326.0 108.3 2001 441.9 229.1 10.3 25.9 92.0 $357.3 84.6 2002 449.9 267.9 10.5 31.9 93.2 $403.5 46.4 2003 454.6 272.5 11.8 30.7 94.0 $409.0 45.6 2004 470.0 299.2 11.9 5.5 92.7 $409.3 60.3 2005 547.3 307.3 12.5 38.2 108.4 $466.4 80.9 2006 594.0 323.7 11.5 42.8 128.5 $506.5 87.5 2007 581.6 339.0 10.3 43.4 135.8 $528.5 53.1 2008 596.2 337.3 ‐ 45.2 163.5 $546.0 50.2 2009 638.3 346.7 ‐ 48.7 176.9 $572.3 66.0 2010 672.5 364.2 ‐ 46.0 191.2 $601.4 74.3 2011 665.5 370.0 ‐ 51.3 181.8 $603.1 62.4 (1) Includes provisions for claims and indemnities and environmental remediation reserves.
(2) Transfers to Other Authority Projects Operating Fund. (3) Includes CWE Bonds and interest expense on Notes.

Technical Memorandum Appendix Page 4 of 5
Jacobs NAI Surface Transportation Consultancy
Pay‐as‐you‐go percentage, revenues available for capital Program.
Figure A‐3: Comparison of Thruway Finances with Percent Pay‐as‐you‐Go

Technical Memorandum Appendix Page 5 of 5
Jacobs NAI Surface Transportation Consultancy
Pay‐as‐you‐go percentage, revenues available for capital Program.
Table A‐3: Capital Spending and Available Funds, 2005‐2011 (millions)
Year Total Capital Expenditures
Revenues Available for
Capital Projects and Equipment (Pay‐Go)
Funding Required from Debt and Other Sources
Percent of Capital Funding Required from Debt and Other Sources
1988 $130.2 $118.3 $11.9 9% 1989 158.3 141.9 16.4 10% 1990 187.5 131.1 56.4 30% 1991 196.0 107.1 88.9 45% 1992 189.8 79.9 109.9 58% 1993 328.1 50.7 277.4 85% 1994 297.4 43.7 253.7 85% 1995 186.7 57.8 128.9 69% 1996 146.3 68.8 77.5 53% 1997 158.5 77.3 81.2 51% 1998 250.7 91.0 159.7 64% 1999 305.2 112.7 192.5 63% 2000 233.7 108.3 125.4 54% 2001 283.2 84.6 198.6 70% 2002 234.0 46.4 187.6 80% 2003 229.0 45.6 183.4 80% 2004 188.6 60.3 128.3 68% 2005 145.4 81.2 64.2 44% 2006 244.6 87.5 157.1 64% 2007 370.5 53.2 317.3 86% 2008 355.2 50.2 305.0 86% 2009 321.2 66.0 255.2 79% 2010 377.7 74.3 303.4 80% 2011 445.5 62.4 383.1 86%

APPENDIX B
Economic Impact of the Thruway Authority Investments and Operations

The Economic Impact of New York State Thruway Authority Investments and Operations
Prepared by:
April 2012April 2012

Executive Summary
• In changing economic conditions, the transportation systems managed by the New York State Thruway Authority – roadways, bridges and canals – are essential to supporting businesses and communities.
• The system is vast – 570 miles of roadways and 524 miles of canals – one of the largest State transportation networks in the Nation.
• Over the 2005‐2011 period, the operations, maintenance and capital improvements of these systems, including the privately operated travel plazas, accounted for an estimated:
– 6,725 on‐site public and private sector jobs annually
– 10,150 total jobs throughout New York State annually
– 4,300 additional jobs elsewhere throughout the US annually
– $575 million in personal income and benefits annually$575 million in personal income and benefits annually
– $1.23 billion in business sales and production annually
– $207.5 million in federal, state and local tax revenues Local and State Tax Revenue: $130.1 million
Federal Tax Revenue: $77 4 millionFederal Tax Revenue: $77.4 million
• These impacts do not include the economic value of the commerce that traverses the Thruway roadways and canals.

Estimated Annual On‐Going On‐Site and Part‐Time Jobs(2005‐2011)( )
Rochester Region
Syracuse Region
Buffalo Region
Albany Region
Over 1,500
Nearly 500
About 1,260 Nearly
1,775
Metro NYC Region
Over 1,470
10,150 total jobs in New York State4,300 additional jobs elsewhere in the US
The New York State Thruway and Canal System

IntroductionIntroduction
• The Thruway and Canal Systems are key arteries of commerce in New York State –transporting products and services, facilitating tourism and recreational activities, and connecting residents with their work placesconnecting residents with their work places.
• The Thruway’s origins begin in 1942 when New York recognized that the State needed a modern and robust highway system that could serve post‐World War II needs.
– The Authority, created in 1950, invested in and operates a 570 mile highway system, one of the largest toll roads in the Nation.
– In 1992, the Authority also assumed responsibility for the operations and maintenance of the 524 mile New York State Canal System, which includes the historic Erie Canal.
– The Authority also maintains 27 travel plazas, many with award winning designs, reflecting the heritage of their areas.
• This report summarizes the economic impacts associated with:
Th i ti d i t f th hi h b id d l t– The ongoing operation and maintenance of the highway, bridge and canal systems.
– The substantial capital investments that have and continue to be made in this important infrastructure network.

The Authority’s Regions
• Economic impacts were assessed b h h N Y k S dat both the New York State and
National levels, as well as the following five local regions that the Authority’s facilities are located in: Rochester
Region
Syracuse Region
– The Metropolitan New York City Region
– The Albany Region
– The Syracuse Region
Buffalo Region
Albany Region
The Syracuse Region
– The Rochester Region
– The Buffalo Region Metro NYC Region

Economic Impacts of Past Capital ExpendituresEconomic Impacts of Past Capital Expenditures(2005‐2011)

Thruway Construction and Investment Create Additional Economic Impact• Capital improvement economic impacts occur only when the construction and investment activities
are taking place.
Th i f h i i l d b Th– These impacts are separate from the ongoing economic value generated by Thruway operations discussed later.
– When the construction activities are completed, the workers move on to other areas and other projects.
• The Thruway has invested substantially since 2005, with nearly $1.9 billion spent in capital y y , y $ p pimprovement projects.
• In New York State, the Thruway‐related construction and investment activity between 2005 and 2011 accounted for the following jobs and economic benefit over the investment period:
– 6,820 on‐site full‐ and part‐time jobs in New York State or about 974 jobs annually
14 850 t t l j b th h t N Y k St t b t 2 121 j b ll– 14,850 total jobs throughout New York State or about 2,121 jobs annually
– An additional 10,790 jobs elsewhere in the US or about 1,541 jobs annually, which includes the many businesses that supply goods and services in support of Thruway construction and capital investments.
– Over $1.13 billion in personal wages and benefits in New York State.
– Nearly $3.2 billion in business sales in New York State
– Over $451 million in federal, state and local tax revenues Local and State Tax Revenue: $185 million
Federal Tax Revenue: $266 million

The Economic Value Generated by ThruwayThe Economic Value Generated by Thruway Investments Made Between 2005 and 2011
Total Impacts Over the Construction Period of 2005‐2011
Not Annualized Geographical Level of Impacts
Regions
New York State Rochester Buffalo Metro NY Albany Syracuse US Level
Direct employment 6 819 251 1 400 2 342 618 704 8 463Direct employment 6,819 251 1,400 2,342 618 704 8,463
Total employment 14,847 559 2,966 4,465 1,272 1,617 25,635
Personal income (in millions $) $ 1,135.3 $ 35.8 $ 165.4 $ 390.9 $ 71.4 $ 104.3 $ 1,521.8
Business activity (in millions $) $ 3,186.6 $ 100.1 $ 555.0 $ 937.0 $ 249.4 $ 333.2 $ 4,691.8
State and Local Taxes (in millions $) $ 185.3 $ 6.0 $ 34.7 $ 50.6 $ 16.0 $ 22.0 $ 207.7
All dollar amounts in millions of 2012 dollars.
Employment includes both full- and part-time workers. The proportion of full-time workers varies by industry. For example, the construction sectors also entirely consist of full-time workers. The food service industry has one of the higher amounts of
Federal Tax Revenue (in millions $) $ 266.0 $ 8.6 $ 44.7 $ 81.6 $ 20.1 $ 28.5 $ 345.7
Total Tax Revenue (in millions $) $ 451.3 $ 14.5 $ 79.4 $ 132.2 $ 36.0 $ 50.4 $ 553.4
the construction sectors also entirely consist of full time workers. The food service industry has one of the higher amounts ofpart-time workers.
Total jobs includes the full multiplier effect – direct, indirect and induced jobs in the region.
Business activity is defined as the value of industry production or, in the case of service industries, sales.
The economic impact assessment was conducted using customized Implan models developed by the team for each of the five regions and for New York State.regions and for New York State.

The Thruway Made Substantial Investmentsy
Capital Investments Undertaken From 2005 through 2011
Project Type Expenditure in MillionsProject Type Expenditure in Millions
Architectural Services $ 80.5
Bridge Projects $ 650.4
Canal Projects $ 128 4Canal Projects $ 128.4
Highway Projects $ 978.2
Intelligent Transportation Systems (ITS) $ 42.3
Rehabilitation Work $ 1.9Rehabilitation Work $ 1.9
Trails $ 11.9
TOTAL $ 1,893.6

Thruway Construction and Capital InvestmentsThruway Construction and Capital Investments Support Many Businesses throughout the State
• Capital and construction expenditures made between 2005 and 2011 rippled through the State’s economy.
• The businesses supported by the expenditures by agencies, suppliers and workers include:include:
Employment
Construction 5,134
Architectural and Engineering Services 1,289
Food Services 608
Health Services 594
Steel Product Manufacturing 567
Wholesale Businesses 320
Real Estate Businesses 317
Concrete Products 278
Mgmt and Technical Consulting 251
All Other 5,489

Economic Impacts of Planned Capital ExpendituresEconomic Impacts of Planned Capital Expenditures (2012‐2015)

The Investments are ContinuousThe Investments are Continuous
• Additional investments are programmed for the Thruway’s transportation systems.
– Nearly $1.2 billion in capital and construction projects are planned to occur between y p p j p2012 and 2015.
– These investments and analysis do not include the proposed $5.3 billion project to replace the Tappan Zee Bridge.
• The impacts of expected 2012‐2015 investments are anticipated to produce the following p p p p gjobs and economic benefit over the construction period:
– 4,350 on‐site full‐ and part‐time jobs in New York State or about 1,088 jobs annually
– 9,460 total jobs throughout New York State or about 2,364 jobs annually
– An additional 6,790 jobs elsewhere in the US or about 1,698 jobs annually, whichAn additional 6,790 jobs elsewhere in the US or about 1,698 jobs annually, which includes the many businesses that supply goods and services in support of Thruway construction and capital investments.
– $723 million in personal wages and benefits in New York State.
– Over $2 billion in business sales in New York StateOver $2 billion in business sales in New York State
– $287 million in federal, state and local tax revenues Local and State Tax Revenue: $118 million
Federal Tax Revenue: $169 million

Estimated Economic Value Generated by ThruwayEstimated Economic Value Generated by Thruway Programmed Investments Between 2012 and 2015
Total Impacts Over the Construction Period of Future Anticipated Investments
Not Annualized Geographical Level of Impacts
Regions
New York State Rochester Buffalo Metro NY Albany Syracuse US Level
Direct employment 4,351 55 1,334 623 597 282 5,399
Total employment 9,456 113 2,803 1,163 1,279 599 16,242
Personal income (in millions $) $ 723.3 $ 6.5 $ 155.4 $ 99.5 $ 73.2 $ 34.9 $ 964.4
Business activity (in millions $) $ 2,009.5 $ 17.4 $ 513.2 $ 231.8 $ 259.8 $ 109.3 $ 2,943.5
State and Local Taxes (in millions $) $ 117.9 $ 0.9 $ 31.0 $ 11.8 $ 16.0 $ 6.6 $ 131.5
Federal Tax Revenue (in millions $) $ 169 0 $ 1 4 $ 41 1 $ 20 2 $ 20 5 $ 9 1 $ 218 5
All dollar amounts in millions of 2012 dollars.
Employment includes both full‐ and part‐time workers. The proportion of full‐time workers varies by industry. For example, theconstruction sectors also entirely consist of full‐time workers. The food service industry has one of the higher amounts of part‐time
Federal Tax Revenue (in millions $) $ 169.0 $ 1.4 $ 41.1 $ 20.2 $ 20.5 $ 9.1 $ 218.5
Total Tax Revenue (in millions $) $ 286.9 $ 2.3 $ 72.1 $ 31.9 $ 36.5 $ 15.7 $ 350.0
y f f f y f g f pworkers.
Total jobs includes the full multiplier effect – direct, indirect and induced jobs in the region.
Business activity is defined as the value of industry production or, in the case of service industries, sales.
The economic impact assessment was conducted using customized Implan models developed by the team for each of the five regions and for New York State.for New York State.

Significant Investments Will Continue to be MadeSignificant Investments Will Continue to be Made
Capital Investments Planned for 2012 through 2015
Project Type Expenditure in MillionsProject Type Expenditure in Millions
Architectural Services $ 23.3
Bridge Projects $ 433.2
Canal Projects $ 166.3 j $
Highway Projects $ 531.8
Intelligent Transportation Systems (ITS) $ 13.2
Rehabilitation Work $ 10.3
Trails $ 9.4
TOTAL $ 1,187.5
Replacement of the Tappan Zee Bridge is not included.

Planned Construction and Capital Investment Will ContinuePlanned Construction and Capital Investment Will Continue Support Many Businesses throughout the State
• Similar to the investments already made, the planned capital and construction expenditures will ripple through the State’s economy.
• The New York businesses supported by the expenditures by agencies, suppliers and workers include:
Employment
Construction 3,179
Architectural and Engineering Services 886
Food Services 390
Health Services 379
Steel Product Manufacturing 362
Real Estate Businesses 202
Wholesale Businesses 201
Mgmt and Technical Consulting 185
All Other 3,673

Economic Impacts of Operations and MaintenanceEconomic Impacts of Operations and Maintenance Expenditures (2005‐2011)

The Economic Value of Thruway Operations AreThe Economic Value of Thruway Operations Are Spread throughout New York State
• In 2011, the New York State Thruway handled 245.2 million vehicle trips.
• The operation and maintenance of the Authority’s transportation systems, including the privately operated travel plazas, account for:
– 5,750 on‐site public and private sector jobs annually
– 8,030 total jobs throughout New York State annually
– 2,760 additional jobs throughout the US annually
– $413 million in personal income and benefits annually
– $772 million in business sales and production annually
– $143 million in federal, state and local tax revenues annually, y
Local and State Tax Revenue: $50.9 million
Federal Tax Revenue: $92 million
• Ongoing on‐site full and part‐time jobs include:
– Nearly 1,690 jobs in the Albany region annually
– Over 1,300 jobs in the Buffalo region annually
– About 1,160 jobs in the Syracuse region annually
– Nearly 1,140 jobs in the Metropolitan New York region annually
– Over 460 jobs in the Rochester region annuallyj g y

Annual Value of Ongoing Thruway and CanalAnnual Value of Ongoing Thruway and Canal Operations
Geographical Level of Impacts
Regions
New York State Rochester Buffalo Metro NY Albany Syracuse US Level
Direct employment 5,751 462 1,304 1,137 1,687 1,161 5,751
Total employment 8,029 653 1,863 1,515 2,408 1,590 10,793
Personal income (in millions $) $ 413.0 $ 31.2 $ 91.2 $ 99.5 $ 123.2 $ 67.9 $ 529.7
Business activity (in millions $) $ 772.0 $ 59.8 $ 174.3 $ 168.1 $ 230.2 $ 139.6 $ 1,142.9
State and Local Taxes (in millions $) $ 50.9 $ 4.0 $ 11.4 $ 10.1 $ 15.7 $ 9.6 $ 53.3
Federal Tax Revenue (in millions $) $ 92 1 $ 7 2 $ 21 0 $ 19 6 $ 28 3 $ 16 0 $ 111 5
All dollar amounts in millions of 2012 dollars.
Employment includes both full- and part-time workers. The proportion of full-time workers varies by industry. For example, the construction sectors also entirely consist of full-time workers. The food service industry has one of the higher proportion
Federal Tax Revenue (in millions $) $ 92.1 $ 7.2 $ 21.0 $ 19.6 $ 28.3 $ 16.0 $ 111.5
Total Tax Revenue (in millions $) $ 143.0 $ 11.2 $ 32.3 $ 29.7 $ 44.0 $ 25.7 $ 164.8
the construction sectors also entirely consist of full time workers. The food service industry has one of the higher proportionof part-time workers.
Total jobs includes the full multiplier effect – direct, indirect and induced jobs in the region.
Business activity is defined as the value of industry production or, in the case of service industries, sales.
The economic impact assessment was conducted using customized Implan models developed by the team for each of the five regions and for New York State.regions and for New York State.

A Wide Range of New York State Businesses andA Wide Range of New York State Businesses and Jobs are Supported
• Annual Authority operations and maintenance efforts support jobs in a wide range of industries, reflecting the spending of agencies, businesses and households.
• The jobs supported include:
Employment
New York State Thruway Authority 4,000
Food Services (Service Areas) 1,856
Health Services 240
Real Estate Businesses 123
Food and Beverage Stores 79
Other Government Agencies 54
All Other 1,677

Definitions and TerminologyDefinitions and Terminology

Economic Impact Definitions – What is a Multiplier?p p• The economic impact assessment estimates the
total impacts, which are defined to include:
– Direct – the spending by the New York State Thruway and its private partners (e g restaurants andand its private partners (e.g., restaurants and gasoline stations in the travel centers). Direct effects
are the focal point of an impact analysis.
– Indirect – the purchases of goods and services by suppliers. By definition, the first round of indirectsuppliers. By definition, the first round of indirect impacts includes the purchase of supplies and services that are required to produce the direct effects. Subsequent purchases of supplies and services generate other rounds of indirect impacts. S h h ti t i l th h thSuch purchases continue to ripple through the regional economy.
– Induced – the purchases (of such items as food, clothing, personal services, vehicles, etc.) that arise, in turn, from the increase in the aggregate laborin turn, from the increase in the aggregate labor income of households.
• The total economic impact consists of the direct, indirect and induced effects.

Economic Impact MeasurementsEconomic Impact Measurements
• Employment Effects –Jobs generated or supported , including:
– Direct employment: onsite full‐ and part‐time equivalent jobs or jobs.
Total employment: The total number of full time equivalent jobs (direct indirect and induced)– Total employment: The total number of full‐time equivalent jobs (direct, indirect and induced) generated in each of the geographically defined regions.
• Total Business Outputs – Output represents the value of industry production. In IMPLAN, these are annual production estimates for the year of the data set and are in producer prices. For manufacturers this would be sales plus/minus change in inventory. For service sectors production = p / g y psales. For Retail and wholesale trade, output = gross margin and not gross sales.
• Total Personal Income Effects – Includes all forms of employment income, including Employee Compensation (wages and benefits) and Proprietor Income.
• Total State and Local Tax Effects – defined as revenues collected by state and sub‐state governments. The taxes include employee, personal proprietor, business, household and corporate taxes.
• Total Federal Tax Effects – defined as revenues collected by the federal government from corporate income, personal income, social security, and excise taxes.

About the ApproachAbout the Approach• Jacobs and A. Strauss‐Wieder, Inc. worked closely with New York State Thruway
Authority staff to:
R i d il i f ti it l i t t d ti i l di– Receive and compile information on capital investments and operations, including information on restaurant and gasoline stations at the travel plazas.
– Define the five sub‐state regions included in the economic impact assessment.
– Separate the capital and operational information into the five regions.
– Create customized versions of the IMPLAN model for New York State and the five regions.
– Translate the capital and operational expenditures into the information needed to undertake the economic impact assessment and conducted the analysisundertake the economic impact assessment and conducted the analysis.
– Undertake post‐assessment checks, including comparing model‐generated estimates of public full‐ and part‐time operations employment with actual jobs.

About the Economic Impact Model
• The IMPLAN version 3.0 model was used for this assessment. Implan is a complete economic assessment package including data and software. The New York State and county‐level information were acquired for this assessment. More information on Implan can be found at http://implan.com/V4/
• The basic framework for input‐output (I‐O) analysis originated nearly 250 years ago when François Quesenay published Tableau Economique in 1758. Quesenay’s “tableau” graphically and numerically portrayed the relationships between sales and purchases of the various industries of an u e ca y po t ayed t e e at o s ps bet ee sa es a d pu c ases o t e a ous dust es o aeconomy. More than a century later, his description was adapted by Leon Walras, who advanced input‐output (I‐O) modeling by providing a concise theoretical formulation of an economic system (including consumer purchases and the economic representation of “technology”).
• Wassily Leontief greatly advanced Walras’s theoretical formulation and was awarded the Nobel Prize in 1973 Leontief first used his approach in 1936 when he developed a model of the 1919 andPrize in 1973. Leontief first used his approach in 1936 when he developed a model of the 1919 and 1929 U.S. economies to estimate the effects of the end of World War I on national employment. Recognition of his work awaited wider acceptance and use of the approach. This meant development of a standardized procedure for compiling the requisite data (today’s national economic census of industries) and enhanced capability for calculations (i.e., the computer). The federal government immediately recognized the importance of Leontief’s development and hasfederal government immediately recognized the importance of Leontief s development and has been publishing input‐output tables of the U.S. economy since 1939.

Background on Input‐Output Analysis• I‐O modeling focuses on the interrelationships among sectors in an economy. Within the I‐O model,
the economy of an area is mapped out in table form, with each industry listed across the top as a consuming sector (or market) and down the side as a producing sector.
• Input‐output modeling is among the most accepted means for assessing economic impacts, as previously indicated The approach provides a concise and accurate means for articulating thepreviously indicated. The approach provides a concise and accurate means for articulating the interrelationships among industry sectors. The models can be quite detailed. As noted previously, the current U.S. and IMPLAN models have more than 400 sectors. This level of detail provides a consistent and systematic approach, as well as a more accurate means for assessing the multiplier effects of changes in economic activity.
• I O Analysis makes several key assumptions First the information used to create an input output• I‐O Analysis makes several key assumptions. First, the information used to create an input‐output model is for a given point in time. The information in the model reflects a “snapshot” of the technical requirements and industry relationships at a given point in time. Because of this, input‐output models are regularly updated.
• Regional input‐output models, such as the one used in this economic impact assessment, need to account for the percentage of the demand for an industry’s output or the requirements for aaccount for the percentage of the demand for an industry’s output or the requirements for a transportation project that can be readily supplied by firms within the specified region. Firms within the specified region may not be able to supply all the products needed. Therefore, goods and services may need to be purchased from outside of the specified region.
• Regional purchase information contained within IMPLAN was generally assumed except where di i i h h N Y k S Th i di d i i h h h fdiscussions with the New York State Thruway indicated unique sourcing, such as the purchase of steel, which comes entirely from New York mills.