new york state testing program 2007: english language arts ... · an overview of the new york state...
TRANSCRIPT

Copyright © 2007 by the New York State Education Department
New York State Testing Program 2007:
English Language Arts, Grades 3–8
Technical Report
Submitted December 2007
CTB/McGraw-Hill Monterey, California 93940

Copyright © 2007 by the New York State Education Department
Copyright
Developed and published under contract with the New York State Education Department by CTB/McGraw-Hill LLC, a subsidiary of The McGraw-Hill Companies, Inc., 20 Ryan Ranch Road, Monterey California 93940-5703. Copyright © 2007 by the New York State Education Department. Any part of this publication may be reproduced or distributed in any form or by any means.
Copyright © 2007 by the New York State Education Department
Table of Contents SECTION I: INTRODUCTION AND OVERVIEW ................................................... 1
INTRODUCTION........................................................................................................................................... 1 TEST PURPOSE............................................................................................................................................ 1 TARGET POPULATION................................................................................................................................. 1 TEST USE AND DECISIONS BASED ON ASSESSMENT ................................................................................... 1
Scale Scores .......................................................................................................................................... 1 Proficiency Level Cut Scores and Classification .................................................................................. 2 Standard Performance Index Scores..................................................................................................... 2
TESTING ACCOMMODATIONS ..................................................................................................................... 2 TEST TRANSCRIPTIONS............................................................................................................................... 3 TEST TRANSLATIONS.................................................................................................................................. 3
SECTION II: TEST DESIGN AND DEVELOPMENT................................................ 4 TEST DESCRIPTION ..................................................................................................................................... 4 TEST CONFIGURATION................................................................................................................................ 4 TEST BLUEPRINT ........................................................................................................................................ 5 2007 ITEM MAPPING BY NEW YORK STATE STANDARDS AND STRANDS.................................................. 16 NEW YORK STATE EDUCATOR’S INVOLVEMENT IN TEST DEVELOPMENT ................................................ 17 CONTENT RATIONALE .............................................................................................................................. 18 ITEM DEVELOPMENT ................................................................................................................................ 18 ITEM REVIEW ........................................................................................................................................... 19 MATERIALS DEVELOPMENT ..................................................................................................................... 20 ITEM SELECTION AND TEST CREATION (CRITERIA AND PROCESS) ........................................................... 20 PROFICIENCY AND PERFORMANCE STANDARDS ....................................................................................... 21
SECTION III: VALIDITY ............................................................................................ 22 CONTENT VALIDITY ................................................................................................................................. 22 CONSTRUCT (INTERNAL STRUCTURE) VALIDITY...................................................................................... 23
Internal Consistency ........................................................................................................................... 23 Unidimensionality ............................................................................................................................... 23 Minimization of Bias ........................................................................................................................... 25
SECTION IV: TEST ADMINISTRATION AND SCORING.................................... 27 TEST ADMINISTRATION ............................................................................................................................ 27 SCORING PROCEDURES OF OPERATIONAL TESTS...................................................................................... 27 SCORING MODELS .................................................................................................................................... 27 SCORING OF CONSTRUCTED-RESPONSE ITEMS ......................................................................................... 28 SCORER QUALIFICATIONS AND TRAINING ................................................................................................ 29 QUALITY CONTROL PROCESS ................................................................................................................... 29
SECTION V: OPERATIONAL TEST DATA COLLECTION AND CLASSICAL ANALYSIS ...................................................................................................................... 30
DATA COLLECTION .................................................................................................................................. 30 DATA PROCESSING ................................................................................................................................... 30 CLASSICAL ANALYSIS AND CALIBRATION SAMPLE CHARACTERISTICS.................................................... 33 CLASSICAL DATA ANALYSIS .................................................................................................................... 37
Item Difficulty and Response Distribution.......................................................................................... 37 Point-Biserial Correlation Coefficients .............................................................................................. 45

Copyright © 2007 by the New York State Education Department
Distractor Analysis ............................................................................................................................. 45 Test Statistics and Reliability Coefficients .......................................................................................... 45 Speededness ........................................................................................................................................ 46 Differential Item Functioning ............................................................................................................. 46
SECTION VI: IRT SCALING AND EQUATING...................................................... 49 IRT MODELS AND RATIONALE FOR USE................................................................................................... 49 CALIBRATION SAMPLE ............................................................................................................................. 50 CALIBRATION PROCESS ............................................................................................................................ 50 ITEM-MODEL FIT...................................................................................................................................... 51 LOCAL INDEPENDENCE............................................................................................................................. 52 SCALING AND EQUATING ......................................................................................................................... 53
Anchor Item Security........................................................................................................................... 55 Anchor Item Evaluation ...................................................................................................................... 56
ITEM PARAMETERS................................................................................................................................... 61 TEST CHARACTERISTIC CURVES............................................................................................................... 67 SCORING PROCEDURE............................................................................................................................... 71
Weighting Constructed-Response Items in Grades 4 and 8 ................................................................ 72 RAW-SCORE TO SCALE-SCORE AND SEM CONVERSION TABLES ............................................................. 73 STANDARD PERFORMANCE INDEX............................................................................................................ 80 IRT DIF STATISTICS................................................................................................................................. 81
SECTION VII: RELIABILITY AND STANDARD ERROR OF MEASUREMENT........................................................................................................................................... 84
TEST RELIABILITY.................................................................................................................................... 84 Reliability for Total Test ..................................................................................................................... 84 Reliability of MC Items ....................................................................................................................... 85 Reliability of CR Items ........................................................................................................................ 85 Test Reliability for NCLB Reporting Categories ................................................................................ 85
STANDARD ERROR OF MEASUREMENT..................................................................................................... 91 PERFORMANCE LEVEL CLASSIFICATION CONSISTENCY AND ACCURACY................................................. 91
Consistency ......................................................................................................................................... 92 Accuracy ............................................................................................................................................. 93
SECTION VIII: SUMMARY OF OPERATIONAL TEST RESULTS .................... 94 SCALE SCORE DISTRIBUTION SUMMARY.................................................................................................. 94
Grade 3 ............................................................................................................................................... 94 Grade 4 ............................................................................................................................................... 95 Grade 5 ............................................................................................................................................... 97 Grade 6 ............................................................................................................................................... 98 Grade 7 ............................................................................................................................................... 99 Grade 8 ............................................................................................................................................. 101
PERFORMANCE LEVEL DISTRIBUTION SUMMARY................................................................................... 102 Grade 3 ............................................................................................................................................. 103 Grade 4 ............................................................................................................................................. 104 Grade 5 ............................................................................................................................................. 105 Grade 6 ............................................................................................................................................. 106 Grade 7 ............................................................................................................................................. 107 Grade 8 ............................................................................................................................................. 108
APPENDIX A—ELA PASSAGE SPECIFICATIONS ............................................. 110
APPENDIX B—CRITERIA FOR ITEM ACCEPTABILITY................................. 116
APPENDIX C—PSYCHOMETRIC GUIDELINES FOR OPERATIONAL ITEM SELECTION ................................................................................................................. 118

Copyright © 2007 by the New York State Education Department
APPENDIX D—FACTOR ANALYSIS RESULTS................................................... 120
APPENDIX E—ITEMS FLAGGED FOR DIF ......................................................... 123
APPENDIX F—ITEM-MODEL FIT STATISTICS ................................................. 125
APPENDIX G—DERIVATION OF THE GENERALIZED SPI PROCEDURE.. 131
APPENDIX H—DERIVATION OF CLASSIFICATION CONSISTENCY AND ACCURACY ................................................................................................................. 137
APPENDIX I—SCALE SCORE FREQUENCY DISTRIBUTIONS ...................... 139
REFERENCES.............................................................................................................. 147

Copyright © 2007 by the New York State Education Department
List of Tables TABLE 1. NYSTP ELA 2007 TEST CONFIGURATION............................................ 4
TABLE 2. NYSTP ELA 2007 CLUSTER ITEMS......................................................... 5
TABLE 3. NYSTP ELA 2007 TEST BLUEPRINT ....................................................... 6
TABLE 4A. NYSTP ELA 2007 OPERATIONAL TEST MAP, GRADE 3 ................ 7
TABLE 4B. NYSTP ELA 2007 OPERATIONAL TEST MAP, GRADE 4 ................ 8
TABLE 4C. NYSTP ELA 2007 OPERATIONAL TEST MAP, GRADE 5 .............. 10
TABLE 4D. NYSTP ELA 2007 OPERATIONAL TEST MAP, GRADE 6 .............. 11
TABLE 4E. NYSTP ELA 2007 OPERATIONAL TEST MAP, GRADE 7 .............. 13
TABLE 4F. NYSTP ELA 2007 OPERATIONAL TEST MAP, GRADE 8............... 15
TABLE 5. NYSTP ELA 2007 STANDARD COVERAGE ......................................... 16
TABLE 6. FACTOR ANALYSIS RESULTS FOR ELA TESTS (TOTAL POPULATION)............................................................................................................... 24
TABLE 7A. NYSTP ELA GRADE 3 DATA CLEANING ......................................... 30
TABLE 7B. NYSTP ELA GRADE 4 DATA CLEANING.......................................... 31
TABLE 7C. NYSTP ELA GRADE 5 DATA CLEANING ......................................... 31
TABLE 7D. NYSTP ELA GRADE 6 DATA CLEANING ......................................... 32
TABLE 7E. NYSTP ELA GRADE 7 DATA CLEANING.......................................... 32
TABLE 7F. NYSTP ELA GRADE 8 DATA CLEANING.......................................... 32
TABLE 8A. GRADE 3 SAMPLE CHARACTERISTICS (N = 194958) ................... 33
TABLE 8B. GRADE 4 SAMPLE CHARACTERISTICS (N = 193715) ................... 34
TABLE 8C. GRADE 5 SAMPLE CHARACTERISTICS (N = 199583) ................... 34
TABLE 8D. GRADE 6 SAMPLE CHARACTERISTICS (N = 202937) ................... 35
TABLE 8E. GRADE 7 SAMPLE CHARACTERISTICS (N = 210218) ................... 36
TABLE 8F. GRADE 8 SAMPLE CHARACTERISTICS (N = 211425).................... 36
TABLE 9A. P-VALUES, SCORED RESPONSE DISTRIBUTIONS, AND POINT BISERIALS, GRADE 3.................................................................................................. 38
TABLE 9B. P-VALUES, SCORED RESPONSE DISTRIBUTIONS, AND POINT BISERIALS, GRADE 4.................................................................................................. 39
TABLE 9C. P-VALUES, SCORED RESPONSE DISTRIBUTIONS, AND POINT BISERIALS, GRADE 5.................................................................................................. 40

Copyright © 2007 by the New York State Education Department
TABLE 9D. P-VALUES, SCORED RESPONSE DISTRIBUTIONS, AND POINT BISERIALS, GRADE 6.................................................................................................. 41
TABLE 9E. P-VALUES, SCORED RESPONSE DISTRIBUTIONS, AND POINT BISERIALS, GRADE 7.................................................................................................. 42
TABLE 9F. P-VALUES, SCORED RESPONSE DISTRIBUTIONS, AND POINT BISERIALS, GRADE 8.................................................................................................. 44
TABLE 10. NYSTP ELA 2007 TEST FORM STATISTICS AND RELIABILITY 46
TABLE 11. NYSTP ELA 2007 CLASSICAL DIF SAMPLE N-COUNTS ............... 47
TABLE 12. NUMBER OF ITEMS FLAGGED BY SMD AND MANTEL-HAENSZEL DIF METHODS ....................................................................................... 48
TABLE 13. NYSTP ELA 2007 CALIBRATION RESULTS...................................... 51
TABLE 14. NYSTP ELA 2007 FINAL TRANSFORMATION CONSTANTS........ 55
TABLE 15. ELA ANCHOR EVALUATION SUMMARY......................................... 57
TABLE 16A. 2007 OPERATIONAL ITEM PARAMETER ESTIMATES, GRADE 3 ......................................................................................................................... 61
TABLE 16B. 2007 OPERATIONAL ITEM PARAMETER ESTIMATES, GRADE 4 ......................................................................................................................... 62
TABLE 16C. 2007 OPERATIONAL ITEM PARAMETER ESTIMATES, GRADE 5 ......................................................................................................................... 63
TABLE 16D. 2007 OPERATIONAL ITEM PARAMETER ESTIMATES, GRADE 6 ......................................................................................................................... 64
TABLE 16E. 2007 OPERATIONAL ITEM PARAMETER ESTIMATES, GRADE 7 ......................................................................................................................... 65
TABLE 16F. 2007 OPERATIONAL ITEM PARAMETER ESTIMATES, GRADE 8 ......................................................................................................................... 66
TABLE 17. ELA GRADE 4 MC AND CR POINT DISTRIBUTION IN 2007 BY LEARNING STANDARDS............................................................................................ 72
TABLE 18. ELA GRADE 8 MC AND CR POINT DISTRIBUTION IN 2007 BY LEARNING STANDARDS............................................................................................ 72
TABLE 19A. GRADE 3 RAW SCORE TO SCALE SCORE (WITH STANDARD ERROR)........................................................................................................................... 73
TABLE 19B. GRADE 4 RAW SCORE TO SCALE SCORE (WITH STANDARD ERROR)........................................................................................................................... 74
TABLE 19C. GRADE 5 RAW SCORE TO SCALE SCORE (WITH STANDARD ERROR)........................................................................................................................... 75
TABLE 19D. GRADE 6 RAW SCORE TO SCALE SCORE (WITH STANDARD ERROR)........................................................................................................................... 76

Copyright © 2007 by the New York State Education Department
TABLE 19E. GRADE 7 RAW SCORE TO SCALE SCORE (WITH STANDARD ERROR)........................................................................................................................... 77
TABLE 19F. GRADE 8 RAW SCORE TO SCALE SCORE (WITH STANDARD ERROR)........................................................................................................................... 78
TABLE 20. SPI TARGET RANGES ............................................................................ 80
TABLE 21. NUMBER OF ITEMS FLAGGED FOR DIF BY THE LINN-HARNISCH METHOD.................................................................................................. 83
TABLE 22. ELA 3–8 TESTS RELIABILITY AND STANDARD ERROR OF MEASUREMENT........................................................................................................... 84
TABLE 23 RELIABILITY AND STANDARD ERROR OF MEASUREMENT—MC ITEMS ONLY ......................................................................................................... 85
TABLE 24 RELIABILITY AND STANDARD ERROR OF MEASUREMENT—CR ITEMS ONLY ................................................................................................................. 85
TABLE 25A. GRADE 3 TEST RELIABILITY BY SUBGROUP............................. 86
TABLE 25B. GRADE 4 TEST RELIABILITY BY SUBGROUP ............................. 87
TABLE 25C. GRADE 5 TEST RELIABILITY BY SUBGROUP............................. 87
TABLE 25D. GRADE 6 TEST RELIABILITY BY SUBGROUP............................. 88
TABLE 25E. GRADE 7 TEST RELIABILITY BY SUBGROUP ............................. 89
TABLE 25F. GRADE 8 TEST RELIABILITY BY SUBGROUP ............................. 90
TABLE 26. DECISION CONSISTENCY (ALL CUTS)............................................. 92
TABLE 27. DECISION CONSISTENCY (LEVEL III CUT).................................... 93
TABLE 28. DECISION AGREEMENT (ACCURACY) ............................................ 93
TABLE 29. ELA GRADES 3–8 SCALE SCORE DISTRIBUTION SUMMARY ... 94
TABLE 30. SCALE SCORE DISTRIBUTION SUMMARY, BY SUBGROUP, GRADE 3 ......................................................................................................................... 95
TABLE 31. SCALE SCORE DISTRIBUTION SUMMARY, BY SUBGROUP, GRADE 4 ......................................................................................................................... 96
TABLE 32. SCALE SCORE DISTRIBUTION SUMMARY, BY SUBGROUP, GRADE 5 ......................................................................................................................... 97
TABLE 33. SCALE SCORE DISTRIBUTION SUMMARY, BY SUBGROUP, GRADE 6 ......................................................................................................................... 99
TABLE 34. SCALE SCORE DISTRIBUTION SUMMARY, BY SUBGROUP, GRADE 7 ....................................................................................................................... 100
TABLE 35. SCALE SCORE DISTRIBUTION SUMMARY, BY SUBGROUP, GRADE 8 ....................................................................................................................... 101

Copyright © 2007 by the New York State Education Department
TABLE 36. ELA GRADES 3–8 TEST PERFORMANCE LEVEL DISTRIBUTIONS......................................................................................................... 102
TABLE 37. PERFORMANCE LEVEL DISTRIBUTION SUMMARY, BY SUBGROUP, GRADE 3............................................................................................... 103
TABLE 38. PERFORMANCE LEVEL DISTRIBUTION SUMMARY, BY SUBGROUP, GRADE 4............................................................................................... 104
TABLE 39. PERFORMANCE LEVEL DISTRIBUTION SUMMARY, BY SUBGROUP, GRADE 5............................................................................................... 105
TABLE 40. PERFORMANCE LEVEL DISTRIBUTION SUMMARY, BY SUBGROUP, GRADE 6............................................................................................... 107
TABLE 41. PERFORMANCE LEVEL DISTRIBUTION SUMMARY, BY SUBGROUP, GRADE 7............................................................................................... 108
TABLE 42. PERFORMANCE LEVEL DISTRIBUTION SUMMARY, BY SUBGROUP, GRADE 8............................................................................................... 109
TABLE A1. READABILITY SUMMARY INFORMATION FOR 2007 OPERATIONAL TEST PASSAGES.......................................................................... 111
TABLE A2. NUMBER, TYPE, AND LENGTH OF PASSAGES............................ 114
TABLE D1. FACTOR ANALYSIS RESULTS FOR ELA TESTS (SELECTED SUBPOPULATIONS)................................................................................................... 120
TABLE E1. NYSTP ELA 2007 CLASSICAL DIF ITEM FLAGS .......................... 123
TABLE E2. ITEMS FLAGGED FOR DIF BY THE LINN-HARNISCH METHOD......................................................................................................................................... 124
TABLE F1. ELA ITEM FIT STATISTICS, GRADE 3 ............................................ 125
TABLE F2. ELA ITEM FIT STATISTICS, GRADE 4 ............................................ 126
TABLE F3. ELA ITEM FIT STATISTICS, GRADE 5 ............................................ 127
TABLE F4. ELA ITEM FIT STATISTICS, GRADE 6 ............................................ 128
TABLE F5. ELA ITEM FIT STATISTICS, GRADE 7 ............................................ 129
TABLE F6. ELA ITEM FIT STATISTICS, GRADE 8 ............................................ 130
TABLE I1. GRADE 3 ELA 2007 SS FREQUENCY DISTRIBUTION, STATE ... 139
TABLE I2. GRADE 4 ELA 2007 SS FREQUENCY DISTRIBUTION, STATE ... 140
TABLE I3. GRADE 5 ELA 2007 SS FREQUENCY DISTRIBUTION, STATE ... 141
TABLE I4. GRADE 6 ELA 2007 SS FREQUENCY DISTRIBUTION, STATE ... 142
TABLE I5. GRADE 7 ELA 2007 SS FREQUENCY DISTRIBUTION, STATE ... 143
TABLE I6. GRADE 8 ELA 2007 SS FREQUENCY DISTRIBUTION, STATE ... 145
Copyright © 2007 by the New York State Education Department 1
Section I: Introduction and Overview
Introduction An overview of the New York State Testing Program (NYSTP), Grades 3–8, English Language Arts (ELA) 2007 Operational (OP) Tests is provided in this report. The report contains information about operational test development and content, item and test statistics, validity and reliability, differential item functioning studies, test administration and scoring, scaling, and student performance.
Test Purpose The NYSTP is an assessment system designed to measure concepts, processes, and skills taught in schools in New York. The ELA Tests target student progress toward three of the four content standards as described in Section II, “Test Design and Development,” subsection “Content Rationale.” The Grades 3–8 ELA Tests are written for all students to have the opportunity to demonstrate their knowledge and skills in these standards. The established cut scores classify student proficiency into one of four levels based on their test performance.
Target Population Students in New York State public school Grades 3, 4, 5, 6, 7, and 8 (and ungraded students of equivalent age) are the target population for the Grades 3–8 testing program. Nonpublic schools may participate in the testing program but the participation is not mandatory for them. In 2007, nonpublic schools participated primarily in the Grades 4, 6, and 8 tests. Given that nonpublic schools were not well represented in the testing program, the New York State Education Department (NYSED) made a decision to exclude these schools from the data analyses. Public school students were required to take all State assessments administered at their grade level, except for a very small percentage of students with disabilities who took the New York State Alternate Assessment (NYSAA) for students with severe disabilities. For more detail on this exemption, please refer to Page 2 of the School Administrator’s Manual for Public Schools (SAM), available online at http://emsc33.nysed.gov/3-8/sam/ela07p.pdf.
Test Use and Decisions Based on Assessment The Grades 3–8 ELA Tests are used to measure the extent to which individual students achieve the New York State Learning Standards in ELA and to determine whether schools, districts, and the State meet the required progress targets specified in the New York State accountability system. There are several types of scores available from the Grades 3–8 ELA Tests and these are discussed in this section.
Scale Scores The scale score is a quantification of the ability measured by the Grades 3–8 ELA Tests at each grade level. The scale scores are comparable within each grade level but not across grades because the Grades 3–8 ELA Tests are not on a vertical scale. The test scores are reported at the individual level and can also be aggregated. Detailed

Copyright © 2007 by the New York State Education Department 2
information on the derivation and properties of scale scores is provided in Section VI, “IRT Scaling and Equating.” Uses of Grades 3–8 ELA Tests scores include: determining student progress within schools and districts, supporting registration of schools and districts, determining eligibility of students for additional instruction time, and providing teachers with indicators of a student’s need, or lack of need, for remediation in specific content-area knowledge.
Proficiency Level Cut Scores and Classification Students are classified as Level I (Not Meeting Learning Standards), Level II (Partially Meeting Learning Standards), Level III (Meeting Learning Standards) and Level IV (Meeting Learning Standards with Distinction). The proficiency cut scores used to distinguish among Levels I, II, III, and IV were established during the process of Standard Setting. There is reason to believe and evidence to support the claim that New York State ELA proficiency cut scores reflect the abilities intended by the New York State Education Department. Performance of students on the Grades 3–8 ELA Tests in relation to proficiency level cut scores is reported in a form of performance level classification. The performances of schools, districts, and the State are reported as percentages of students in each performance level. Detailed information on a process of establishing performance cut scores and their association with test content is provided in the Bookmark Standard Setting Technical Report 2006 for Grades 3, 4, 5, 6, 7, and 8 English Language Arts and the New York State ELA Measurement Review Technical Report 2006 for English Language Arts.
Standard Performance Index Scores Standard Performance Index (SPI) scores are obtained from the Grades 3–8 ELA Tests. The SPI score is an indicator of student ability and knowledge and skills in specific learning standards, and it is used primarily for diagnostic purposes to help teachers evaluate academic strengths and weaknesses of their students. These scores can be effectively used by teachers at the classroom level to modify their instructional content and format to best serve their students’ specific needs. Detailed information on the properties and use of SPI scores are provided in Section VI, “IRT Scaling and Equating.”
Testing Accommodations In accordance with federal law under the Americans with Disabilities Act and Fairness in Testing, as outlined by the Standards for Educational and Psychological Testing (American Education Research Association, American Psychological Association, and National Council on Measurement in Education, 1999), accommodations that do not alter the measurement of any construct being tested are allowed for test takers. The allowance is in accordance with a student’s individual education program (IEP) or section 504 Accommodation Plan (504 Plan). School principals are responsible for ensuring that proper accommodations are provided when necessary and that staff providing accommodations are properly trained. Details on testing accommodations can be found in the School Administrator’s Manual.

Copyright © 2007 by the New York State Education Department 3
Test Transcriptions For the visually impaired students, large-type and braille editions of the test books are provided. The students dictate and/or record their responses; the teachers transcribe student responses to multiple-choice questions onto scannable answer sheets; and the teachers transcribe the responses to the constructed-response questions onto the regular test books. The large-type editions are created by CTB/McGraw-Hill and printed by NYSED, and the braille editions are produced by Braille Publishers, Inc. The lead transcribers are members of the National Braille Association, California Transcribers and Educators of the Visually Handicapped, and the Contra Costa Braille Transcribers, and have Library of Congress and Nemeth Code [Braille] Certifications. Braille Publishers, Inc. produced the braille editions for the previous Grades 4 and 8 Tests. Camera-copy versions of the regular test books are provided to the braille vendor, who then produces the braille editions. Proofs of the braille editions are submitted to NYSED for review and approval prior to production.
Test Translations Since these are assessments of student proficiency in English language arts, the Grades 3–8 ELA Tests are not translated into any other language.

Copyright © 2007 by the New York State Education Department 4
Section II: Test Design and Development
Test Description The Grades 3–8 ELA Tests are New York State Learning Standards-based criterion-referenced tests composed of multiple-choice (MC) and constructed-response (CR) items. The tests were administered in New York classrooms during January 2007 over a two-day (Grades 3, 5, 7, and 8) or three-day (Grades 4 and 6) period. The tests were printed in black and white and incorporated the concepts of universal design. Details on the administration and scoring of these tests can be found in Section IV, “Test Administration and Scoring.”
Test Configuration The OP tests books were administered, in order, on two to three consecutive days, depending on the grade. Table 1 provides information on the number and type of items in each book, as well as testing times. Students were administered a Reading section (Book 1, all grades; Book 3, Grades 4, 6, and 8) and a Listening section (Book 2). Students in Grades 3, 5, and 7 also completed an Editing Paragraph (in Book 2). The 2007 Teacher’s Directions (http://www.nysedregents.org/testing/elaei/07exams/home.htm) and the 2007 School Administrator’s Manual (http://www.emsc.nysed.gov/3-8/sam/ela07p.pdf) provide details on security, scheduling, classroom organization and preparation, test materials, and administration. Table 1. NYSTP ELA 2007 Test Configuration
Number of Items Allotted Time ( minutes) Grade Day Book MC CR* Total** Testing Prep 1 1 20 1 21 40 10 2 2 4 3 7 35 15 3
Totals 24 4 28 75 25 1 1 28 0 28 45 10 2 2 0 3 3 45 15 3 3 0 4 4 60 10 4
Totals 28 7 35 150 35 1 1 20 1 21 45 10 2 2 4 2 6 30 15 5
Totals 24 3 27 75 25 1 1 26 0 26 55 10 2 2 0 4 4 45 15 3 3 0 4 4 60 10 6
Totals 26 8 34 160 35 (Continued on next page)

Copyright © 2007 by the New York State Education Department 5
Table 1. NYSTP ELA 2007 Test Configuration (cont.)
Number of Items Allotted Time ( minutes) Grade Day Book MC CR* Total** Testing Prep 1 1 26 2 28 55 10 2 2 4 3 7 30 15 7
Totals 30 5 35 85 25 1 1 26 0 26 50 10 1 2 0 4 4 45 15 2 3 0 4 4 60 10 8
Totals 26 8 34 155 35 *Does not reflect cluster-scoring. ** Reflects actual items in the test books. In most cases, the test book item number is also the item number for the purposes of data analysis. The exception is that constructed-response items from Grades 4, 6, and 8 are cluster-scored. Table 2 lists the test book item numbers and the item numbers as scored. Because analyses are based on scored data, the latter item numbers will be referred to in this Technical Report. Table 2. NYSTP ELA 2007 Cluster Items
Grade Cluster Type Contributing Book Items
Item Number for Data Analysis
4 Listening 29, 30, 31 29 4 Writing Mechanics 31, 35 30 4 Reading 32, 33, 34, 35 31 6 Listening 27, 28, 29, 30 27 6 Writing Mechanics 30, 34 28 6 Reading 31, 32, 33, 34 29 8 Listening 27, 28, 29, 30 27 8 Writing Mechanics 30, 34 28 8 Reading 31, 32, 33, 34 29
Test Blueprint The NYSTP Grades 3–8 ELA Tests assess students on three learning standards (S1—Information and Understanding, S2—Literary Response and Expression, and S3— Critical Analysis and Evaluation). The test items are indicators used to assess a variety of reading, writing, and listening skills against each of the three learning standards. Standard 1 is assessed primarily by use of test items associated with informational passages; Standard 2 is assessed primarily by use of test items associated with literary passages; and Standard 3 is assessed by use of test items associated with a combination of genres. In addition, students are also tested on writing mechanics, which is assessed independent of alignment to the Learning Standards, since writing mechanics is associated with all three Learning Standards. The distribution of score points across the Learning Standards was determined during blueprint specifications meetings held with panels of New York State educators at the start of the testing program, prior to item development. The

Copyright © 2007 by the New York State Education Department 6
distribution in each grade reflects the number of assessable performance indicators in each standard at that grade and the emphasis placed on those performance indicators by the blueprint-specifications panel members. Table 3 shows the Grades 3–8 ELA Tests blueprint and actual number of score points in 2007 OP tests. Table 3. NYSTP ELA 2007 Test Blueprint
Grade Total Points
Writing Mechanics
Points Standard
Target Reading
and Listening # Points
Selected Reading
and Listening # Points
Target % of Test
(excluding Writing)
Selected % of Test (excluding Writing)
3 33 3 S1 10 10 33.0 33.0 S2 14 15 47.0 50.0 S3 6 5 20.0 17.0 4 39 3 S1 13 12 36.0 33.5 S2 16 16 44.5 44.5 S3 7 8 19.5 22.0 5 31 3 S1 12 13 43.0 46.5 S2 10 9 36.0 32.0 S3 6 6 21.0 21.5 6 39 3 S1 13 12 36.0 33.5 S2 16 16 44.5 44.5 S3 7 8 19.5 22.0 7 41 3 S1 15 16 39.0 42.0 S2 15 14 39.0 37.0 S3 8 8 22.0 21.0 8 39 3 S1 14 13 39.0 36.0 S2 14 14 39.0 39.0 S3 8 9 22.0 25.0
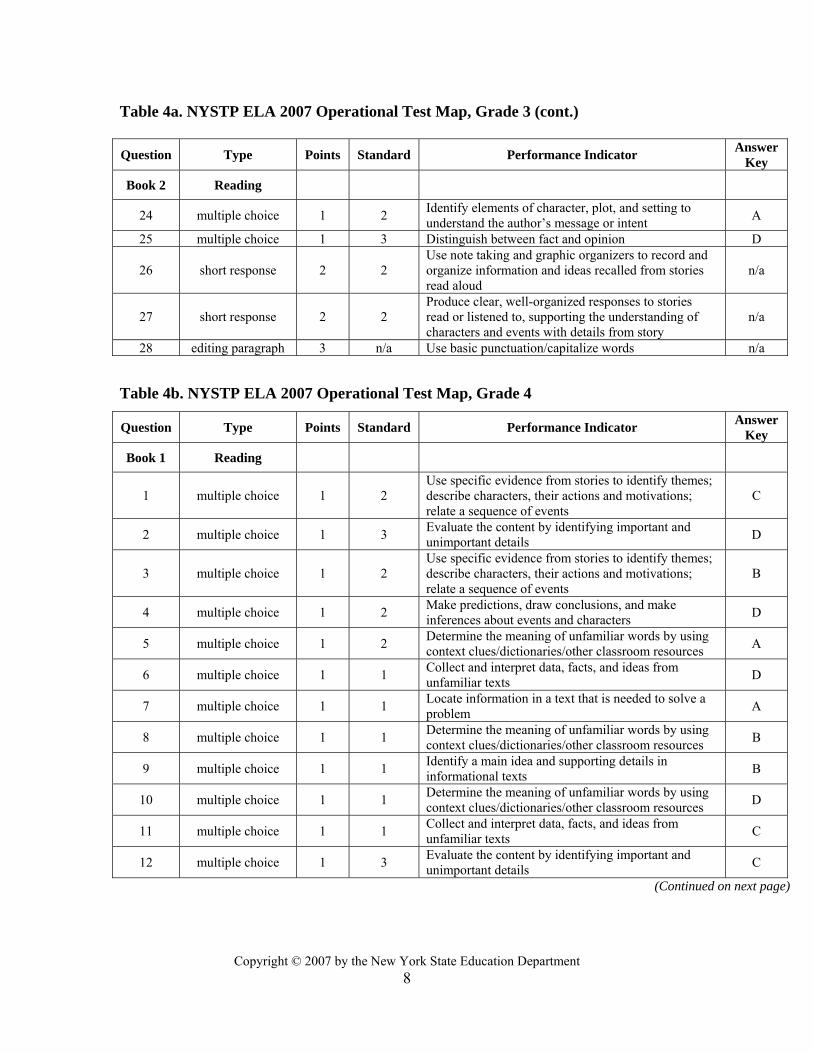
Tables 4a–4f present Grades 3–8 ELA Test item maps with the item type indicator, the maximum number of points obtainable from each item, the Learning Standard measured by each item, and the answer key.

Copyright © 2007 by the New York State Education Department 7
Table 4a. NYSTP ELA 2007 Operational Test Map, Grade 3
Question Type Points Standard Performance Indicator Answer Key
Book 1 Reading
1 multiple choice 1 1 Identify main ideas and supporting details in informational texts D
2 multiple choice 1 1 Read unfamiliar texts to collect data, facts, and ideas B
3 multiple choice 1 1 Determine meaning of unfamiliar words by using context clues/dictionaries/other classroom resources A
4 multiple choice 1 1 Read unfamiliar texts to collect data, facts, and ideas C
5 multiple choice 1 3 Evaluate the content by identifying important and unimportant details B
6 multiple choice 1 3 Evaluate the content by identifying the author’s purpose C
7 multiple choice 1 2 Use specific evidence from stories to describe characters’ actions/motivations; relate sequences of events
A
8 multiple choice 1 2 Use graphic organizers to record significant details about characters and events in stories D
9 multiple choice 1 2 Determine meaning of unfamiliar words by using context clues/dictionaries/other classroom resources A
10 multiple choice 1 3 Evaluate the content by identifying important and unimportant details C
11 multiple choice 1 2 Make predictions, and draw conclusions and inferences about events and characters D
12 multiple choice 1 2 Use knowledge of story structure, story elements, and key vocabulary to interpret stories D
13 multiple choice 1 2 Use specific evidence from stories to describe characters’ actions/motivations; relate sequences of events
C
14 multiple choice 1 2 Use graphic organizers to record significant details about characters and events in stories A
15 multiple choice 1 2 Use letter-sound correspondence, knowledge of grammar, and overall context to determine meaning B
16 multiple choice 1 1 Read and understand written directions B 17 multiple choice 1 1 Read and understand written directions A 18 multiple choice 1 1 Read unfamiliar texts to collect data, facts, and ideas C
19 multiple choice 1 1 Determine meaning of unfamiliar words by using context clues/dictionaries/other classroom resources B
20 multiple choice 1 3 Evaluate the content by identifying the author’s purpose D
21 short response 2 1 Identify main ideas and supporting details in informational texts n/a
Book 2 Listening/Writing
22 multiple choice 1 2 Identify elements of character, plot, and setting to understand the author’s message or intent A
23 multiple choice 1 2 Identify elements of character, plot, and setting to understand the author’s message or intent D
(Continued on next page)
Copyright © 2007 by the New York State Education Department 8
Table 4a. NYSTP ELA 2007 Operational Test Map, Grade 3 (cont.) Question Type Points Standard Performance Indicator Answer
Key
Book 2 Reading
24 multiple choice 1 2 Identify elements of character, plot, and setting to understand the author’s message or intent A
25 multiple choice 1 3 Distinguish between fact and opinion D
26 short response 2 2 Use note taking and graphic organizers to record and organize information and ideas recalled from stories read aloud
n/a
27 short response 2 2 Produce clear, well-organized responses to stories read or listened to, supporting the understanding of characters and events with details from story
n/a
28 editing paragraph 3 n/a Use basic punctuation/capitalize words n/a
Table 4b. NYSTP ELA 2007 Operational Test Map, Grade 4
Question Type Points Standard Performance Indicator Answer Key
Book 1 Reading
1 multiple choice 1 2 Use specific evidence from stories to identify themes; describe characters, their actions and motivations; relate a sequence of events
C
2 multiple choice 1 3 Evaluate the content by identifying important and unimportant details D
3 multiple choice 1 2 Use specific evidence from stories to identify themes; describe characters, their actions and motivations; relate a sequence of events
B
4 multiple choice 1 2 Make predictions, draw conclusions, and make inferences about events and characters D
5 multiple choice 1 2 Determine the meaning of unfamiliar words by using context clues/dictionaries/other classroom resources A
6 multiple choice 1 1 Collect and interpret data, facts, and ideas from unfamiliar texts D
7 multiple choice 1 1 Locate information in a text that is needed to solve a problem A
8 multiple choice 1 1 Determine the meaning of unfamiliar words by using context clues/dictionaries/other classroom resources B
9 multiple choice 1 1 Identify a main idea and supporting details in informational texts B
10 multiple choice 1 1 Determine the meaning of unfamiliar words by using context clues/dictionaries/other classroom resources D
11 multiple choice 1 1 Collect and interpret data, facts, and ideas from unfamiliar texts C
12 multiple choice 1 3 Evaluate the content by identifying important and unimportant details C
(Continued on next page)

Copyright © 2007 by the New York State Education Department 9
Table 4b. NYSTP ELA 2007 Operational Test Map, Grade 4 (cont.)
Question Type Points Standard Performance Indicator Answer Key
Book 1 Reading
13 multiple choice 1 2 Use knowledge of story structure, story elements, and key vocabulary to interpret stories B
14 multiple choice 1 2 Use specific evidence from stories to identify themes; describe characters, their actions and motivations; relate a sequence of events
C
15 multiple choice 1 2 Make predictions, draw conclusions, and make inferences about events and characters B
16 multiple choice 1 3 Evaluate the content by identifying important and unimportant details D
17 multiple choice 1 2 Determine the meaning of unfamiliar words by using context clues/dictionaries/other classroom resources D
18 multiple choice 1 1 Identify a main idea and supporting details in informational texts A
19 multiple choice 1 1 Collect and interpret data, facts, and ideas from unfamiliar texts B
20 multiple choice 1 1 Identify a main idea and supporting details in informational texts A
21 multiple choice 1 1 Identify a main idea and supporting details in informational texts D
22 multiple choice 1 1 Collect and interpret data, facts, and ideas from unfamiliar texts C
23 multiple choice 1 1 Collect and interpret data, facts, and ideas from unfamiliar texts B
24 multiple choice 1 2 Use knowledge of story structure, story elements, and key vocabulary to interpret stories D
25 multiple choice 1 2 Use knowledge of story structure, story elements, and key vocabulary to interpret stories A
26 multiple choice 1 3 Evaluate content by identifying whether events, actions, characters, and/or settings are realistic B
27 multiple choice 1 2 Make predictions, draw conclusions, and make inferences about events and characters D
28 multiple choice 1 2 Use graphic organizers to record significant details about characters and events in stories B
Book 2 Listening/Writing
29-31 short and extended response 4 2 Listening/Writing cluster n/a
Book 3 Reading/Writing
32-35 short and extended response 4 3 Reading/Writing cluster n/a
Book 2 &
Book 3
Writing Mechanics
31 & 35 extended response 3 n/a Writing Mechanics cluster n/a

Copyright © 2007 by the New York State Education Department
10
Table 4c. NYSTP ELA 2007 Operational Test Map, Grade 5
Question Type Points Standard Performance Indicator Answer Key
Book 1 Reading
1 multiple choice 1 2 Read, view, and interpret literary texts from a variety of genres D
2 multiple choice 1 2 Identify literary elements, such as setting, plot, and character, of different genres C
3 multiple choice 1 2 Read, view, and interpret literary texts from a variety of genres A
4 multiple choice 1 2 Determine the meaning of unfamiliar words by using context clues/dictionaries/other classroom resources C
5 multiple choice 1 3 Evaluate information, ideas, opinions, and themes in texts by identifying a central idea and supporting details
C
6 multiple choice 1 1 Read to collect and interpret data, facts, and ideas from multiple sources A
7 multiple choice 1 1 Read to collect and interpret data, facts, and ideas from multiple sources C
8 multiple choice 1 1 Read the steps in a procedure in order to accomplish a task, such as completing a science experiment C
9 multiple choice 1 1 Read the steps in a procedure in order to accomplish a task, such as completing a science experiment B
10 multiple choice 1 1 Recognize organizational formats to assist in comprehension of informational texts D
11 multiple choice 1 1 Recognize organizational formats to assist in comprehension of informational texts C
12 multiple choice 1 1 Identify missing information and irrelevant information A
13 multiple choice 1 3 Evaluate information, ideas, opinions, and themes in texts by identifying a central idea and supporting details
C
14 multiple choice 1 1 Read to collect and interpret data, facts, and ideas from multiple sources C
15 multiple choice 1 3 Evaluate information, ideas, opinions, and themes in texts by identifying a central idea and supporting details
D
16 multiple choice 1 2 Identify literary elements, such as setting, plot, and character, of different genres D
17 multiple choice 1 2 Read, view, and interpret literary texts from a variety of genres B
18 multiple choice 1 2 Determine the meaning of unfamiliar words by using context clues/dictionaries/other classroom resources D
19 multiple choice 1 2 Read, view, and interpret literary texts from a variety of genres C
20 multiple choice 1 2 Define characteristics of different genres B
21 short response 2 3 Evaluate information, ideas, opinions, and themes in texts by identifying a central idea and supporting details
n/a
(Continued on next page)

Copyright © 2007 by the New York State Education Department
11
Table 4c. NYSTP ELA 2007 Operational Test Map, Grade 5 (cont.) Question Type Points Standard Performance Indicator Answer
Key
Book 2 Listening/Writing
22 multiple choice 1 1 Identify information that is implicit rather than stated C
23 multiple choice 1 3 Form an opinion on a subject on the basis of information, ideas, and themes expressed in presentations
A
24 multiple choice 1 1 Identify information that is implicit rather than stated B 25 multiple choice 1 1 Identify information that is implicit rather than stated A 26 short response 2 1 Identify essential details for note taking n/a
27 editing paragraph 3 n/a Observe the rules of punctuation, capitalization, and spelling; use correct grammatical construction n/a
Table 4d. NYSTP ELA 2007 Operational Test Map, Grade 6
Question Type Points Standard Performance Indicator Answer Key
Book 1 Reading
1 multiple choice 1 2 Identify literary elements (e.g. setting, plot, character) of different genres C
2 multiple choice 1 3 Evaluate information, ideas, opinions, and themes by identifying statements of fact, opinion, and exaggeration
D
3 multiple choice 1 2 Identify the ways in which characters change and develop throughout a story C
4 multiple choice 1 2 Define characteristics of different genres C
5 multiple choice 1 2 Read, view, and interpret texts from a variety of genres D
6 multiple choice 1 1 Read to collect and interpret data, facts, and ideas from multiple sources B
7 multiple choice 1 1 Read to collect and interpret data, facts, and ideas from multiple sources D
8 multiple choice 1 1 Use text features, such as headings, captions, and titles, to understand and interpret informational texts C
9 multiple choice 1 1 Identify missing, conflicting, unclear, and irrelevant information C
10 multiple choice 1 1 Determine the meaning of unfamiliar words by using context clues/dictionaries/other classroom resources C
11 multiple choice 1 1 Compare and contrast information about one topic from multiple sources A
12 multiple choice 1 3 Evaluate information, ideas, opinions, and themes by identifying a central idea and supporting details D
13 multiple choice 1 2 Identify literary elements (e.g., setting, plot, character, rhythm, and rhyme) of different genres D
14 multiple choice 1 2 Determine the meaning of unfamiliar words by using context clues/dictionaries/other classroom resources B
(Continued on next page)

Copyright © 2007 by the New York State Education Department
12
Table 4d. NYSTP ELA 2007 Operational Test Map, Grade 6 (cont.)
Question Type Points Standard Performance Indicator Answer Key
Book 1 Reading
15 multiple choice 1 2 Read, view, and interpret texts from a variety of genres C
16 multiple choice 1 1 Recognize organizational formats to assist in comprehension of informational texts C
17 multiple choice 1 1 Read to collect and interpret data, facts, and ideas from multiple sources A
18 multiple choice 1 3 Evaluate information, ideas, opinions, and themes by identifying statements of fact, opinion, and exaggeration
B
19 multiple choice 1 1 Identify information that is implied rather than stated D
20 multiple choice 1 1 Compare and contrast information about one topic from multiple sources B
21 multiple choice 1 1 Read to collect and interpret data, facts, and ideas from multiple sources B
22 multiple choice 1 1 Determine the meaning of unfamiliar words by using context clues/dictionaries/other classroom resources A
23 multiple choice 1 2 Read, view, and interpret texts from a variety of genres A
24 multiple choice 1 2 Recognize how the author uses literary devices, such as simile, metaphor, and personification, to create meaning
B
25 multiple choice 1 2 Identify the ways in which characters change and develop throughout a story D
26 multiple choice 1 2 Determine the meaning of unfamiliar words by using context clues/dictionaries/other classroom resources D
Book 2 Listening/Writing
27-30 short and extended response 5 2 Listening/Writing cluster n/a
Book 3 Reading/Writing
31-34 short and extended response 5 3 Reading/Writing cluster n/a
Book 2 &
Book 3
Writing Mechanics
30 & 34 extended response 3 n/a Writing Mechanics cluster n/a

Copyright © 2007 by the New York State Education Department
13
Table 4e. NYSTP ELA 2007 Operational Test Map, Grade 7
Question Type Points Standard Performance Indicator Answer Key
Book 1 Reading
1 multiple choice 1 2
Determine how the use and meaning of literary devices (symbolism, metaphor and simile, alliteration, personification, flashback, and foreshadowing) convey the author’s message or intent
B
2 multiple choice 1 2 Interpret characters, plot, setting, and theme, using evidence from the text D
3 short response 2 3 Identify differing points of view in texts and presentations n/a
4 multiple choice 1 2 Recognize how the author’s use of language creates images or feelings B
5 multiple choice 1 2 Interpret characters, plot, setting, and theme, using evidence from the text A
6 multiple choice 1 2 Identify the author’s point of view, such as first-person narrator and omniscient narrator A
7 multiple choice 1 2 Identify a purpose for reading B
8 multiple choice 1 1 Interpret data, facts, and ideas from informational texts by applying thinking skills, such as define, classify, and infer
D
9 multiple choice 1 1 Use knowledge of structure, content, and vocabulary to understand informational text A
10 multiple choice 1 1 Draw conclusions and make inferences on the basis of explicit and implied information C
11 multiple choice 1 1 Condense, combine, or categorize new information from one or more sources D
12 multiple choice 1 1 Compare and contrast information from a variety of different sources D
13 multiple choice 1 1 Draw conclusions and make inferences on the basis of explicit and implied information A
14 multiple choice 1 2 Identify the author’s point of view, such as first-person narrator and omniscient narrator C
15 multiple choice 1 2 Recognize how the author’s use of language creates images or feelings B
16 multiple choice 1 2
Determine how the use and meaning of literary devices (symbolism, metaphor and simile, alliteration, personification, flashback, and foreshadowing) convey the author’s message or intent
C
17 multiple choice 1 2 Interpret characters, plot, setting, and theme, using evidence from the text A
18 multiple choice 1 2 Recognize how the author’s use of language creates images or feelings B
19 multiple choice 1 2 Interpret characters, plot, setting, and theme, using evidence from the text C
20 multiple choice 1 2 Interpret characters, plot, setting, and theme, using evidence from the text A
(Continued on next page)

Copyright © 2007 by the New York State Education Department
14
Table 4e. NYSTP ELA 2007 Operational Test Map, Grade 7 (cont.)
Question Type Points Standard Performance Indicator Answer Key
Book 1 Reading
21 multiple choice 1 2
Determine the meaning of unfamiliar words by using context clues, a dictionary, a glossary, and structural analysis (i.e., looking at roots, prefixes, and suffixes of words)
D
22 short response 2 3 Evaluate examples, details, or reasons used to support ideas n/a
23 multiple choice 1 1 Interpret data, facts, and ideas from informational texts by applying thinking skills, such as define, classify, and infer
B
24 multiple choice 1 1 Interpret data, facts, and ideas from informational texts by applying thinking skills, such as define, classify, and infer
C
25 multiple choice 1 1 Draw conclusions and make inferences on the basis of explicit and implied information D
26 multiple choice 1 1 Draw conclusions and make inferences on the basis of explicit and implied information B
27 multiple choice 1 1 Use indexes to locate information and glossaries to define terms C
28 multiple choice 1 1
Determine the meaning of unfamiliar words by using context clues, a dictionary, a glossary, and structural analysis (i.e., looking at roots, prefixes, and suffixes of words)
C
Book 2 Listening/Writing
29 multiple choice 1 1 Recall significant ideas and details, and describe relationships between and among them D
30 multiple choice 1 1 Draw conclusions and make inferences on the basis of explicit information A
31 multiple choice 1 1 Make, confirm, or revise predictions by distinguishing between relevant and irrelevant oral information B
32 multiple choice 1 1 Draw conclusions and make inferences on the basis of explicit information C
33 short response 2 3 Present clear analysis, using examples, details, and reasons from the text n/a
34 short response 2 3 Form an opinion or judgment about the validity and accuracy of information, ideas, opinions, themes, and experiences
n/a
35 editing paragraph 3 n/a Observe rules of punctuation, capitalization, and spelling; use correct grammatical construction n/a

Copyright © 2007 by the New York State Education Department
15
Table 4f. NYSTP ELA 2007 Operational Test Map, Grade 8
Question Type Points Standard Performance Indicator Answer Key
Book 1 Reading
1 multiple choice 1 2 Identify the author’s point of view, such as first-person narrator and omniscient narrator D
2 multiple choice 1 2 Interpret characters, plot, setting, theme, and dialogue, using evidence from the text C
3 multiple choice 1 2
Determine how the use and meaning of literary devices (e.g. symbolism, metaphor and simile, alliteration, personification, flashback, and foreshadowing) convey the author’s message or intent
C
4 multiple choice 1 3 Evaluate examples, details, or reasons used to support ideas A
5 multiple choice 1 2 Interpret characters, plot, setting, theme, and dialogue, using evidence from the text B
6 multiple choice 1 2
Determine the meaning of unfamiliar words by using context clues, a dictionary, a glossary, and structural analysis (i.e., looking at roots, prefixes, and suffixes of words)
D
7 multiple choice 1 3 Evaluate examples, details, or reasons used to support ideas D
8 multiple choice 1 1 Condense, combine, or categorize new information from one or more sources C
9 multiple choice 1 3 Evaluate examples, details, or reasons used to support ideas D
10 multiple choice 1 1 Draw conclusions and make inferences on the basis of explicit and implied information B
11 multiple choice 1 3 Evaluate examples, details, or reasons used to support ideas D
12 multiple choice 1 2
Determine how the use and meaning of literary devices, such as symbolism, metaphor and simile, alliteration, personification, flashback, and foreshadowing, convey the author’s message or intent
A
13 multiple choice 1 2
Determine how the use and meaning of literary devices, such as symbolism, metaphor and simile, alliteration, personification, flashback, and foreshadowing, convey the author’s message or intent
C
14 multiple choice 1 2 Recognize how the author’s use of language creates images or feelings B
15 multiple choice 1 2 Interpret characters, plot, setting, theme, and dialogue, using evidence from the text B
16 multiple choice 1 2 Identify poetic elements, such as repetition, rhythm, and rhyming patterns, in order to interpret poetry D
17 multiple choice 1 2 Interpret characters, plot, setting, theme, and dialogue, using evidence from the text B
18 multiple choice 1 2 Identify the author’s point of view, such as first-person narrator and omniscient narrator A
19 multiple choice 1 2 Interpret characters, plot, setting, theme, and dialogue, using evidence from the text A
(Continued on next page)

Copyright © 2007 by the New York State Education Department
16
Table 4f. NYSTP ELA 2007 Operational Test Map, Grade 8 (cont.)
Question Type Points Standard Performance Indicator Answer Key
Book 1 Reading
20 multiple choice 1 2 Interpret characters, plot, setting, and theme, using evidence from the text A
21 multiple choice 1 2
Determine the meaning of unfamiliar words by using context clues, a dictionary, a glossary, and structural analysis (i.e., looking at roots, prefixes, and suffixes of words)
D
22 short response 2 3 Evaluate examples, details, or reasons used to support ideas n/a
23 multiple choice 1 1 Interpret data, facts, and ideas from informational texts by applying thinking skills, such as define, classify, and infer
B
24 multiple choice 1 1 Interpret data, facts, and ideas from informational texts by applying thinking skills, such as define, classify, and infer
C
25 multiple choice 1 1 Draw conclusions and make inferences on the basis of explicit and implied information D
26 multiple choice 1 1 Use indexes to locate information and glossaries to define terms D
Book 2 Listening/Writing
27-30 short and extended response 5 1 Listening/Writing cluster n/a
Book 3 Reading/Writing
31-34 short and extended response 5 3 Reading/Writing cluster n/a
Book 2 &
Book 3
Writing Mechanics
30 & 34 extended response 3 n/a Writing Mechanics cluster n/a
2007 Item Mapping by New York State Standards and Strands Table 5. NYSTP ELA 2007 Standard Coverage
Grade Standard MC Item #s CR Item #s Total Items
Total Points
3 S1 1, 2, 3, 4, 16, 17, 18, 19 21 9 10
3 S2 7, 8, 9, 11, 12, 13, 14, 14, 15, 22, 23, 24 26, 27 14 16
3 S3 5, 6, 10, 20, 25 n/a 5 5 (Continued on next page)

Copyright © 2007 by the New York State Education Department
17
Table 5. NYSTP ELA 2007 Standard Coverage (cont.)
Grade Standard MC Item #s CR Item #s Total Items
Total Points
4 S1 6, 7, 8, 9, 10, 11, 18, 19, 20, 21, 22, 23 n/a 12 12
4 S2 1, 3, 4, 5, 13, 14, 15, 17, 24, 25, 27, 28 29 13 16
4 S3 2, 12, 16, 26 31 5 8
5 S1 6, 7, 8, 9, 10, 11, 12, 14, 22, 24, 25 26 12 13
5 S2 1, 2, 3, 4, 16, 17, 18, 19, 20 n/a 9 9 5 S3 5, 13, 15, 23 21 5 6
6 S1 6, 7, 8, 9, 10, 11, 16, 17, 19, 20, 21, 22 n/a 12 12
6 S2 1, 3, 4, 5, 13, 14, 15, 23, 24, 25, 26 27 12 16
6 S3 2, 12, 18 29 4 8
7 S1 8, 9, 10, 11, 12, 13, 23, 24, 25, 26, 27, 28, 29, 30, 31, 32 n/a 16 16
7 S2 1, 2, 4, 5, 6, 7, 14, 15, 16, 17, 18, 19, 20, 21 n/a 14 14
7 S3 n/a 3, 22, 33, 34 4 8 8 S1 8, 10, 21, 22, 23, 24, 25, 26 27 9 13
8 S2 1, 2, 3, 5, 6, 12, 13, 14, 15, 16, 17, 18, 19, 20 n/a 14 14
8 S3 4, 7, 9, 11 29 5 9
New York State Educator’s Involvement in Test Development New York State educators are actively involved in ELA test development at different test stages, including the following events: item review, passage review, rangefinding, and test form final eyes review. These events are described in details in the later sections of this report. The State Education Department gathers a diverse group of educators to review all test materials in order to create fair and valid tests. The participants are selected for each testing event based on:
• certification and appropriate grade-level experience • geographical region • gender • ethnicity
The selected participants must be certified and have both teaching and testing experience. The majority of them are classroom teachers, but specialists such as reading coaches, literacy coaches, as well as special education and bilingual instructors, participate. Some
Copyright © 2007 by the New York State Education Department
18
participants are also recommended by principals, professional organizations, Big Five Cities, the Staff and Curriculum Development Network (SCDN), etc. Other criteria are also considered, such as gender, ethnicity, geographic location, and type of school (urban, suburban, and rural). A file of participants is maintained and is routinely updated, with current participant information and the addition of possible future participants as recruitment forms are received. This gives many educators the opportunity to participate in the test development process. Every effort is made to have diverse groups of educators participate in each testing event.
Content Rationale In June 2004, CTB/McGraw-Hill facilitated test specifications meetings in Albany, New York, during which committees of state educators, along with NYSED staff, reviewed the standards and performance indicators to make the following determinations:
• which performance indicators were to be assessed • which item types were to be used for the assessable performance indicators
(For example, some performance indicators lend themselves more easily to assessment by constructed-response items than others)
• how much emphasis to place on each assessable performance indicator (For example, some performance indicators encompass a wider range of skills than others, necessitating a broader range of items to fully assess the performance indicator)
• what limitations, if any, were to be applied to the assessable performance indicators (For example, some portions of a performance indicator may be more appropriately assessed in the classroom than on a paper-and-pencil test)
• what general examples of items could be used • what the final test blueprint was to be for each grade
The committees, which were composed of teachers from around the state that were selected for their grade-level expertise, were grouped by grade band (i.e., grades 3/4, 5/6, 7/8), and met for four days. The committees were composed of approximately ten participants per grade band. Upon completion of the committee meetings, NYSED reviewed the committees’ determinations and approved them, with minor adjustments when necessary to maintain consistency across the grades.
Item Development The first step in the process of item development for the 2007 Grades 3–8 ELA Tests was selection of passages to be used. The CTB/McGraw-Hill passage selectors were provided with specifications based on the test design (see Appendix A). After an internal CTB/McGraw-Hill editorial and supervisory review, the passages were submitted to NYSED for their approval and then brought to a formal passage review meeting in Albany, New York, in March 2005. The purpose of the meeting was for committees of New York educators to review and decide whether to approve the passages. CTB/McGraw-Hill and NYSED staff were both present, with CTB/McGraw-Hill staff

Copyright © 2007 by the New York State Education Department
19
facilitating. After the committees completed their reviews, NYSED reviewed and approved the committees’ decisions regarding the passages.
The lead-content editors at CTB/McGraw-Hill then selected from the approved passages those passages that would best elicit the types of items outlined during the test specifications meetings and distributed writing assignments to experienced item writers. The writers’ assignments outlined the number and type of items (including depth-of-knowledge or thinking skill level) to write for each passage. Writers were trained in the New York State Testing Program and in the test specifications. This training entailed specific assignments that spelled out the performance indicators and depth-of-knowledge levels to assess for each passage. In addition, item writers were trained in the New York State Learning Standards and specifications (which provide information such as limitations and examples for assessing performance indicators) and were provided with item-writing guidelines (see Appendix B), sample New York State test items, and the New York State Style Guide.
CTB/McGraw-Hill editors and supervisors reviewed the items to verify that they met the specifications and criteria outlined in the writing assignments and, as necessary, revised them. After all revisions from CTB/McGraw-Hill staff had been incorporated, the items were submitted to NYSED staff for their review and approval. CTB/McGraw-Hill incorporated any necessary revisions from NYSED and prepared the items for a formal item review.
Item Review As was done for the specifications and passage review meetings, the item review committees were composed of New York State educators selected for their content and grade-level expertise. Each committee was composed of approximately 10 participants per grade band (i.e., grades 3/4, 5/6, and 7/8). The committee members were provided with the test items, the New York State Learning Standards, and the test specifications, and they considered the following elements as they reviewed the test items:
• the accuracy and grade-level appropriateness of the items • the mapping of the items to the assigned performance indicators • the accompanying exemplary responses (for constructed-response items) • the appropriateness of the correct response and distractors (for multiple-choice
items) • the conciseness, preciseness, clarity, and reading load of the items • the existence of any ethnic, gender, regional, or other possible bias evident in
the items
Upon completion of the committee work, NYSED reviewed the decisions of the committee members; NYSED either approved the changes to the items or suggested additional revisions so that the nature and format of the items were consistent across grades and with the format and style of the testing program. All approved changes were then incorporated into the items prior to field testing.
Copyright © 2007 by the New York State Education Department
20
Materials Development Following item review, CTB/McGraw-Hill staff assembled the approved passages and items into field test forms and submitted the field test forms to NYSED for their review and approval. The Grades 3–8 ELA Field Tests were administered to students across New York State during the week of January 22–26, 2006, using the State Sampling Matrix to ensure appropriate sampling of students. In addition, CTB/McGraw-Hill, in conjunction with NYSED test specialists, developed a field test Teacher’s Directions and School Administrator’s Manual to help ensure that the field tests were administered in a uniform manner to all participating students. Field test forms were assigned to participants at the school (grade) level while balancing the demographic statistics across forms, in order to proactively sample the students.
After administration of the field tests, rangefinding meetings were conducted in March 2006 in New York State to examine a sampling of the short- and extended-student responses. Committees of New York State educators with content and grade-level expertise were again assembled. Each committee was composed of approximately eight to ten participants per grade level. CTB/McGraw-Hill staff facilitated the meetings, and NYSED staff reviewed the decisions made by the committees and verified that the decisions made were consistent across grades. The committees’ charge was to select student responses that exemplified each score point of each constructed-response item. These responses, in conjunction with the rubrics, were then used by CTB/McGraw-Hill scoring staff to score the constructed response field test items.
Item Selection and Test Creation (Criteria and Process) The second year of operational NYSTP Grades 3–8 ELA Tests were administered in January 2007. The test items were selected from the pool of items primarily field-tested in 2005 and 2006, using the data from those field tests. CTB/McGraw-Hill made preliminary selections for each grade. The selections were reviewed for alignment with the test design, blueprint, and the research guidelines for item selection (Appendix C). Item selection for the NYSTP Grades 3–8 ELA Tests was based on the classical and item response theory (IRT) statistics of the test items. Selection was conducted by content experts from CTB/McGraw-Hill and NYSED and reviewed by psychometricians at CTB/McGraw-Hill and at NYSED. Final approval of the selected items was given by NYSED. Two criteria governed the item selection process. The first of these was to meet the content specifications provided by NYSED. Second, within the limits set by these requirements, developers selected items with the best psychometric characteristics from the field-test item pool.
Item selection for the operational tests was facilitated using the proprietary program ITEMWIN (Burket, 1988). This program creates an interactive connection between the developer selecting the test items and the item database. This program monitors the impact of each decision made during the item selection process and offers a variety of options for grouping, classifying, sorting, and ranking items to highlight key information as it is needed (see Green, Yen, and Burket, 1989).
The program has three parts. The first part of the program selects a working item pool of manageable size from the larger pool. The second part uses this selected item pool to

Copyright © 2007 by the New York State Education Department
21
perform the final test selection. The third part of the program includes a table showing the expected number correct and the standard error of ability estimate (a function of scale score), as well as statistical and graphic summaries on bias, fit, and the standard error of the final test. Any fault in the final selection becomes apparent as the final statistics are generated. Examples of possible faults that may occur are cases when the test is too easy or too difficult, contains items demonstrating differential item functioning (DIF), or does not adequately measure part of the range of performance. A developer detecting any such problems can then return to the second stage of the program and revise the selection. The flexibility and utility of the program encourages multiple attempts at fine-tuning the item selection.
After preliminary selections were completed, they were reviewed for alignment with the test design, blueprint, and research guidelines for item selection (see Appendix C).
NYSED staff (including their content and research representative experts) traveled to CTB/McGraw-Hill in Monterey in July 2006 to finalize item selection and test creation. There, they discussed the content and data of the proposed selections, explored alternate selections for consideration, determined the final item selections, and ordered those items (assigned positions) in the operational test books. The final test forms were approved by the final eyes committee that consisted of approximately 20 participants across all grade levels. After the approval by NYSED, the tests were produced and administered in January 2007.
In addition to the test books, CTB/McGraw-Hill and NYSED produced two School Administrator’s Manuals, one for public schools and the other for nonpublic schools, as well as Teacher’s Directions for each grade so that the tests were administered in a standardized fashion across the state. These documents are located at the following web sites:
• http://www.emsc.nysed.gov/3-8/sam/ela07p.pdf (public schools) • http://www.emsc.nysed.gov/3-8/sam/ela07np.pdf (nonpublic schools) • http://www.nysedregents.org/testing/elaei/07exams/home.htm
Proficiency and Performance Standards Proficiency cut score recommendations and the drafting of performance standards occurred at the NYSTP ELA standard setting review held in Albany in June 2006. The results were reviewed by a measurement review committee and were approved in August 2006. For each grade level, there are four proficiency levels. Three cut points demarcate the performance standards needed to demonstrate each ascending level of proficiency. For details on standard setting method, participants, achievement levels, and results (impact), refer to the Bookmark Standard Setting Technical Report 2006 for Grades 3, 4, 5, 6, 7, and 8 English Language Arts and New York State ELA Measurement Review Technical Report 2006 for English Language Arts.

Copyright © 2007 by the New York State Education Department
22
Section III: Validity Validity refers to the degree to which evidence and theory support the interpretations of test scores entailed by proposed uses of tests. Test validation is an ongoing process of gathering evidence from many sources to evaluate the soundness of the desired score interpretation or use. This evidence is acquired from studies of the content of the test as well as from studies involving scores produced by the test. Additionally, reliability is a necessary test to conduct before considerations of validity are made. A test cannot be valid if it is not also reliable. The American Educational Research Association (AERA), American Psychological Association (APA), and National Council on Measurement in Education (NCME) Standards for Educational and Psychological Testing (1999) addressed the concept of validity in testing. Validity is the most important consideration in test evaluation. The concept refers to the appropriateness, meaningfulness, and usefulness of the specific inferences made from test scores. Test validation is the process for accumulating evidence to support any particular inference. Validity, however, is a unitary concept. Although evidence may be accumulated in many ways, validity refers to the degree to which evidence supports the inferences made from test scores.
Content Validity Generally, achievement tests are used for student-level outcomes, either for making predictions about students, or for describing students’ performance (Mehrens and Lehmann, 1991). In addition, tests are now also used for the purpose of accountability and adequate yearly progress (AYP). NYSED uses various assessment data in reporting AYP. Specific to student-level outcomes, NYSTP documents student performance in the area of ELA as defined by the New York State ELA Learning Standards. To allow test score interpretations appropriate for this purpose, the content of the test must be carefully matched to the specified standards. The 1999 AERA/APA/NCME standards state that content-related evidence of validity is a central concern during test development. Expert professional judgment should play an integral part in developing the definition of what is to be measured, such as describing the universe of the content, generating or selecting the content sample, and specifying the item format and scoring system. Logical analysis of test content indicates the degree to which the content of a test covers the domain of content the test is intended to measure. In the case of the NYSTP, the content is defined by detailed, written specifications and blueprints that describe New York State content standards and define the skills that must be measured to assess these content standards (see Tables 3–5 in Section II). The test development process requires specific attention to content representation and the balance within each test form. New York State educators were involved in test constructions in various test development stages. For example, during the item review process, they reviewed field tests for their alignment with test blueprint. Educators also participated in a process of establishing scoring rubrics (during rangefinding meetings) for constructed-response items. Section II, “Test Design and Development,” contains more information specific to the item review
Copyright © 2007 by the New York State Education Department
23
process. An independent study of alignment between the New York State curriculum and the New York State Grades 3–8 ELA Tests was conducted using Norman Webb’s method. The results of the study provided additional evidence of test content validity (refer to An External Alignment Study for New York State’s Assessment Program, April 2006, Educational Testing Services).
Construct (Internal Structure) Validity Construct validity, what scores mean and what kind of inferences they support, is often considered the most important type of test validity. Construct validity of the New York State Grades 3–8 ELA Tests is supported by several types of evidence that can be obtained from the ELA test data.
Internal Consistency Empirical studies of the internal structure of the test provide one type of evidence of construct validity. For example, high internal consistency constitutes evidence of validity. This is because high coefficients imply that the test questions are measuring the same domain of skill and are reliable and consistent. Reliability coefficients of the tests for total populations and subgroups of students are presented in Section VIII, “Reliability and Standard Error of Measurement.” For the total population, the reliability coefficients (Cronbach’s alpha) ranged from 0.84–0.89, and for most subgroups the reliability coefficient was greater than 0.80 (the exception was for Grade 3 and 5 students of mixed ethnic origin, Grade 5 students from districts classified as low need, and Grade 5 students from charter schools). Overall, high internal consistency of the New York State ELA Tests provided sound evidence of construct validity.
Unidimensionality Other evidence comes from analyses of the degree to which the test questions conform to the requirements of the statistical models used to scale and equate the tests, as well as to generate student scores. Among other things, the models require that the items fit the model well and the questions in a test measure a single domain of skill: that they are unidimensional. The item-model fit was assessed using Q1 statistics (Yen, 1981) and the results are described in detail in Section VI. It was found that all items on the 2007 Grades 3–8 ELA Tests displayed good item-model fit, which provided solid evidence for the appropriateness of IRT models used to calibrate and scale the test data. Another evidence for the efficacy of modeling ability was provided by demonstrating that the questions on New York State ELA Tests were related. What relates the questions is most parsimoniously claimed to be the common ability acquired by students studying the subject. Factor analysis of the test data is one way of modeling the common ability. This analysis may show that there is a single or main factor that can account for much of the variability among responses to test questions. A large first component would provide evidence of the latent ability students have in common with respect to the particular questions asked. A large main factor found from a factor analysis of an achievement test would suggest a primary ability construct that may be considered related to what the questions were designed to have in common, i.e., English language arts ability.

Copyright © 2007 by the New York State Education Department
24
To demonstrate the common factor (ability) underlying student responses to ELA test items, a principal component factor analysis was conducted on a correlation matrix of individual items for each test. Factoring a correlation matrix rather than actual item response data is preferable when dichotomous variables are in the analyzed data set. Because the New York State ELA Tests contain both MC and CR items, the matrix of polychoric correlations was used as input for factor analysis (polychoric correlation is an extension of tetrachoric correlations that are appropriate only for MC items). The study was conducted on the total population of New York State public and charter school students in each grade. A large first principal component was evident in each analysis.
More than one factor with an eigenvalue greater than 1.0 present in each data set would suggest the presence of small additional factors. However, the ratio of the variance accounted for by the first factor to the remaining factors was sufficiently large to support the claim that these tests were essentially unidimensional. These ratios showed that the first eigenvalues were at least four times as large as the second eigenvalues for all of the grades. In addition, total amount of variance accounted for by the main factor was evaluated. According to M. Reckase (1979), “…the 1PL and the 3PL models estimate different abilities when a test measures independent factors, but … both estimate the first principal component when it is large relative to the other factors. In this latter case, good ability estimates can be obtained from the models, even when the first factor accounts for less than 10 percent of the test variance, although item calibration results will be unstable.” It was found that all the New York State Grades 3–8 ELA Tests exhibited first principle components accounting for more than 10 percent of the test variance. The results of factor analysis including eigenvalues greater than 1.0 and proportion of variance explained by extracted factors are presented in Table 6. Table 6. Factor Analysis Results for ELA Tests (Total Population)
Initial Eigenvalues Grade Component Total % of
Variance Cumulative
% 1 5.97 21.33 21.33 2 1.21 4.31 25.64 3 3 1.06 3.77 29.41 1 7.95 25.65 25.65 2 1.35 4.36 30.01 3 1.07 3.46 33.46 4
4 1.02 3.30 36.76 1 5.64 20.90 20.90 2 1.17 4.35 25.26 5 3 1.01 3.73 28.99 1 7.06 24.36 24.36 2 1.10 3.80 28.16 6 3 1.06 3.66 31.82 (Continued on next page)

Copyright © 2007 by the New York State Education Department
25
Table 6. Factor Analysis Results for ELA Tests (Total Population) (cont.)
Initial Eigenvalues Grade Component Total % of
Variance Cumulative
% 1 7.54 21.54 21.54 2 1.32 3.78 25.32 3 1.09 3.11 28.43 4 1.06 3.02 31.46
7
5 1.01 2.88 34.33 1 6.24 21.53 21.53 2 1.18 4.09 25.61 8 3 1.03 3.56 29.17
This evidence supports the claim that there is a construct ability underlying the items/tasks in each ELA test and that scores from each test would be representing performance primarily determined by that ability. Construct-irrelevant variance does not appear to create significant nuisance factors. As an additional evidence for construct validity, the same factor analysis procedure was employed to assess dimensionality of ELA construct for selected subgroups of students in each grade: limited English proficiency (LEP) students, students with disabilities (SWD), and students using test accommodations (SUA). The results were comparable to the results obtained from the total population data. Evaluation of eigenvalue magnitude and proportions of variance explained by the main and secondary factors provide evidence of essential unidimensionality of the construct measured by the ELA tests for the analyzed subgroups. Factor analysis results for LEP, SWD and SUA classifications are provided in Table D1 of Appendix D.
Minimization of Bias Minimizing item bias contributes to minimization of construct-irrelevant variance and contributes to improved test validity. The developers of the NYSTP tests gave careful attention to questions of possible ethnic, gender, and socioeconomic status (SES) bias. All materials were written and reviewed to conform to CTB/McGraw-Hill’s editorial policies and guidelines for equitable assessment, as well as NYSED’s guidelines for item development. At the same time, all materials were written to NYSED’s specifications and carefully checked by groups of trained New York State educators during the item review process.
Four procedures were used to eliminate bias and minimize differential item functioning (DIF) in the New York State ELA Tests.
The first procedure was based on the premise that careful editorial attention to validity is an essential step in keeping bias to a minimum. Bias occurs if the test is differentially valid for a given group of test takers. If the test entails irrelevant skills or knowledge, the possibility of DIF is increased. Thus, preserving content validity is essential.

Copyright © 2007 by the New York State Education Department
26
The second procedure was to follow the item writing guidelines established by NYSED. Developers reviewed NYSTP materials with these guidelines in mind. These internal editorial reviews were done by at least four separate people: the content editor, who directly supervises the item writers; the project director; a style editor; and a proofreader. The final test built from the field test materials was reviewed by at least these same people.
In the third procedure, New York State educators who reviewed all field test materials were asked to consider and comment on the appropriateness of language, content, and gender and cultural distribution.
It is believed that these three procedures improved the quality of the New York State tests and reduced bias. However, current evidence suggests that expertise in this area is no substitute for data; reviewers are sometimes wrong about which items work to the disadvantage of a group, apparently because some of their ideas about how students will react to items may be faulty (Sandoval and Mille, 1979; Jensen, 1980). Thus, empirical studies were conducted.
In the fourth procedure, statistical methods were used to identify items exhibiting possible DIF. Although items flagged for DIF in the field test stage were closely examined for content bias and avoided during the operational test construction, DIF analyses were conducted again on operational test data. Three methods were employed to evaluate the amount of DIF in all test items: standardized mean difference, Mantel-Haenszel (see Section V “Operational Test Data Collection and Classical Analysis”), and Linn-Harnisch (see Section VI, “IRT Scaling and Equating”). A few items in each grade were flagged for DIF, and typically the amount of DIF present was not large. Very few items were flagged by multiple methods. Items that were flagged for statistically significant DIF were carefully reviewed by multiple reviewers during the operational test item selection. Only those items deemed free of bias were included in the operational tests.

Copyright © 2007 by the New York State Education Department
27
Section IV: Test Administration and Scoring Listed in this section are brief summaries of New York State test administration and scoring procedures. For further information, refer to the New York State Scoring Leader Handbooks and School Administrator’s Manual (SAM). In addition, please refer to the Scoring Site Operations Manual (2007) located at http://www.emsc.nysed.gov/3-8/archived.htm#scoring.
Test Administration NYSTP Grades 3–8 ELA Tests were administered at the classroom level during January 2007. The testing window for Grades 3, 4, and 5 was January 8–12. The testing window for Grades 6, 7, and 8 was January 16–19. The makeup test administration window for Grades 3, 4, and 5 was January 17–18, and for Grades 6, 7, and 8, it was January 24–25. The makeup test administration windows allowed students who were ill or otherwise unable to test during the assigned window to take the test.
Scoring Procedures of Operational Tests The scoring of the operational test was performed at designated sites by qualified teachers and administrators. The number of personnel at a given site varied, as districts have the option of regional, districtwide, or schoolwide scoring (please refer to the next subsection, “Scoring Models,” for more detail). Administrators were responsible for the oversight of scoring operations, including the preparation of the test site, the security of test books, and the supervision of the scoring process. At each site, designated trainers taught scoring committee members the basic criteria for scoring each question and monitored the scoring sessions in the room. The trainers were assisted by facilitators or leaders who also helped in monitoring the sessions and enforced scoring accuracy. The titles for administrators, trainers, and facilitators vary by the scoring model that is selected. At the regional level, oversight was conducted by a site coordinator. A scoring leader trained the scoring committee members and monitored the sessions, and a table facilitator assisted in monitoring the sessions. At the districtwide level, a school district administrator oversaw operational scoring. A district ELA leader trained and monitored the sessions, and a school ELA leader assisted in monitoring the sessions. For schoolwide scoring, oversight was provided by the principal; otherwise, titles for the schoolwide model were the same as those for the districtwide model. The general title “scoring committee members” included scorers at every site.
Scoring Models For the 2006–07 school year, schools and school districts used local decision-making processes to select the model that best met their needs for the scoring of the Grades 3–8 ELA Tests. Schools were able to score these tests regionally, districtwide, or individually. Schools were required to enter one of the following scoring model codes on student answer sheets:
1. Regional scoring—The scorers for the school’s test papers included either staff from three or more school districts or staff from all nonpublic schools in an

Copyright © 2007 by the New York State Education Department
28
affiliation group (nonpublic or charter schools may participate in regional scoring with public school districts and may be counted as one district);
2. Schools from two districts—The scorers for the school’s test papers included staff
from two school districts, nonpublic schools, charter school districts, or a combination thereof;
3. Three or more schools within a district—The scorers for the school’s test papers
included staff from all schools administering this test in a district, provided at least three schools are represented;
4. Two schools within a district—The scorers for the school’s test papers included
staff from all schools administering this test in a district, provided that two schools are represented; or
5. One school only (local scoring)—The first readers for the school’s test papers
included staff from the only school in the district administering this test, staff from one charter school, or staff from one nonpublic school.
Schools and districts were instructed to carefully analyze their individual needs and capacities to determine their appropriate scoring model. BOCES and the Staff and Curriculum Development Network (SCDN) provided districts with technical support and advice in making this decision.
For further information, refer to the following link for a brief comparison between regional, district, and local scoring: http://www.emsc.nysed.gov/3-8/update-rev-dec05.htm (see Attachment C).
Scoring of Constructed-Response Items The scoring of constructed-response items was based primarily on the scoring guides, which were created by CTB/McGraw-Hill handscoring and content development specialists with guidance from NYSED and New York State teachers during the rangefinding sessions. The CTB ELA handscoring team was composed of six supervisors, each representing one grade. Supervisors are selected on the basis of their handscoring experiences along with their educational and professional backgrounds. In April 2007, CTB/McGraw-Hill staff met with groups of teachers from across the state in rangefinding sessions. Sets of actual student responses from the field tests were reviewed and discussed openly, and consensus scores were agreed upon by the teachers based on the teaching methods and criteria across the state, as well as on NYSED policies. In addition, a DVD was created to further explain each section of the scoring guides. Trainers used these materials to train scoring committee members on the criteria for scoring constructed-response items. Scoring Leader Handbooks were also distributed to outline the responsibilities of the scoring roles. Handscoring staff also conducted training sessions in New York City to better equip teachers and administrators with enhanced knowledge of scoring principles and criteria.

Copyright © 2007 by the New York State Education Department
29
At this time, scoring was conducted with pen and pencil scoring as opposed to electronic scoring, and each scoring committee member evaluated actual student papers instead of electronically scanned papers. All scoring committee members were trained by previously trained and approved trainers along with guidance from scoring guides, ELA Frequently Asked Questions (FAQs) document, and a DVD that highlighted important elements of the scoring guides. Each test book was scored by three separate scoring committee members, who scored three distinct sections of the test book. After each test book was completed, the table facilitator or ELA leader conducted a “read-behind” of approximately 12 sets of test books per hour to verify the accuracy of scoring. If a question arose that was not covered in the training materials, facilitators or trainers were to call the New York State ELA Helpline (see the subsection “Quality Control Process”).
Scorer Qualifications and Training The scoring of the operational test was conducted by qualified administrators and teachers. Trainers used the scoring guides and DVDs to train scoring committee members on the criteria for scoring constructed-response items. Part of the training process was the administration of a consistency assurance set (CAS) that provided the State’s scoring sites with information regarding strengths and weaknesses of their scorers. This tool allowed trainers to retrain their scorers, if necessary. The CAS also acknowledged those scorers who had grasped all aspects of the content area being scored and were well prepared to score test responses.
Quality Control Process Test books were randomly distributed throughout each scoring room so that books from each region, district, school, or class were evenly dispersed. Teams were divided into groups of three to ensure that a variety of scorers graded each book. If a scorer and facilitator could not reach a decision on a paper after reviewing the scoring guides, ELA FAQs, and DVD, they called the New York State ELA Helpline. This call center was established to help teachers and administrators during operational scoring. The helpline staff consisted of previously trained and prepared CTB/McGraw-Hill handscoring personnel who answered questions by phone, fax, or email. When a member of the staff was unable to resolve an issue, they deferred to NYSED for a scoring decision. After books were completely scored, the table facilitator conducted a “read-behind” of approximately 12 completed sets of books per hour to verify accuracy of scoring. A quality check was also performed on each completed box of scored tests to certify that all questions were scored and that the scoring committee members darkened each score appropriately. To affirm that all schools across the state adhered to scoring guidelines and policies, approximately 5 percent of the schools’ results are audited each year by an outside vendor.

Copyright © 2007 by the New York State Education Department
30
Section V: Operational Test Data Collection and Classical Analysis
Data Collection Operational test data were collected in two phases. During Phase 1, a sample of approximately 97% to 99% of the student test records were received from the data warehouse and delivered to CTB/McGraw-Hill in April 2007. These data were used for all data analysis. Phase 2 involved submitting “straggler files” to CTB/McGraw-Hill in May 2007. The straggler files were later merged with the main data sets. The straggler files contained fewer than 3 percent of the total population cases and due to late submission were excluded from research data analyses. Data from nonpublic schools were delivered in separate files to CTB/McGraw-Hill (only Grades 4, 6, and 8) by NYSED and were not used for any data analysis.
Data Processing Data processing refers to the cleaning and screening procedures used to identify errors (such as out-of-range data) and the decisions made to exclude student cases or to suppress particular items in analyses. CTB/McGraw-Hill established a scoring program, EDITCHECKER, to do initial quality assurance on data and identify errors. This program verifies that the data fields are in-range (as defined), that students’ identifying information is present, and that the data are acceptable for delivery to CTB/McGraw-Hill research. NYSED and the data repository were provided with the results of the checking, and some edits to the initial data were made; however, CTB/McGraw-Hill research performs data cleaning to the delivered data and excludes some student cases in order to obtain a sample of the utmost integrity. It should be noted that the major groups of cases excluded from the data set were out-of-grade students (students whose grade level did not match the test level) and students from nonpublic schools. Other deleted cases included students with no grade level data and duplicate record cases. A list of the data cleaning procedures conducted by research and accompanying case counts is presented in Tables 7a–7f. Table 7a. NYSTP ELA Grade 3 Data Cleaning
Exclusion Rule # Deleted # Cases Remain Initial # of cases 195900
Out of grade 228 195672 No grade 15 195657
Duplicate student ID/ BEDS code 0 195657
Duplicate bio and response vector 4 195653
Nonpublic and out-of-district schools 687 194966
(Continued on next page)

Copyright © 2007 by the New York State Education Department
31
Table 7a. NYSTP ELA Grade 3 Data Cleaning (cont.)
Exclusion Rule # Deleted # Cases Remain Missing values
for all items 8 194958
Out-of-range CR scores 0 194958 Table 7b. NYSTP ELA Grade 4 Data Cleaning
Exclusion Rule # Deleted # Cases Remain Initial # of cases 195258
Out of grade 307 194951 No grade 9 194942
Duplicate student ID/ BEDS code 1 194941
Duplicate bio and response vector 1 194940
Nonpublic and out-of-district schools 1215 193725
Missing values for all items 10 193715
Out-of-range CR scores 0 193715
Table 7c. NYSTP ELA Grade 5 Data Cleaning
Exclusion Rule # Deleted # Cases Remain Initial # of cases 200750
Out of grade 317 200433 No grade 9 200424
Duplicate student ID/ BEDS code 0 200424
Duplicate bio and response vector 1 200423
Nonpublic and out-of-district schools 839 199584
Missing values for all items 1 199583
Out-of-range CR scores 0 199583

Copyright © 2007 by the New York State Education Department
32
Table 7d. NYSTP ELA Grade 6 Data Cleaning
Exclusion Rule # Deleted # Cases Remain Initial # of cases 204105
Out of grade 325 203780 No grade 50 203730
Duplicate student ID/ BEDS code 2 203728
Duplicate bio and response vector 3 203725
Nonpublic and out-of-district schools 786 202939
Missing values for all items 2 202937
Out-of-range CR scores 0 202937
Table 7e. NYSTP ELA Grade 7 Data Cleaning
Exclusion Rule # Deleted # Cases Remain Initial # of cases 211642
Out of grade 493 211149 No grade 8 211141
Duplicate student ID/ BEDS code 0 211141
Duplicate bio and response vector 2 211139
Nonpublic and out-of-district schools 919 210220
Missing values for all items 2 210218
Out-of-range CR scores 0 210218
Table 7f. NYSTP ELA Grade 8 Data Cleaning
Exclusion Rule # Deleted # Cases Remain Initial # of cases 213196
Out of grade 534 212662 No grade 6 212656
Duplicate student ID/ BEDS code 1 212655
(Continued on next page)

Copyright © 2007 by the New York State Education Department
33
Table 7f. NYSTP ELA Grade 8 Data Cleaning (cont.)
Exclusion Rule # Deleted # Cases Remain Duplicate bio and response vector 4 212651
Nonpublic and out-of-district schools 1216 211435
Missing values for all items 10 211425
Out-of-range CR scores 0 211425
Classical Analysis and Calibration Sample Characteristics The demographic characteristics of students in the cleaned calibration and equating datasets are presented in the proceeding tables. The clean data sets included over 95% of New York State students and were used for classical analyses presented in this section and calibrations. The needs resource code (NRC) is assigned at district level and is an indicator of district and school socioeconomic status. The ethnicity and gender designations are assigned at the student level. Please note that the tables do not include data for gender variable as it was found that the New York State population is fairly evenly split by gender categories.
Table 8a. Grade 3 Sample Characteristics (N = 194958)
Demographic Category N-count % of Total N-count New York City 68200 35.0
Big 4 Cities 8012 4.1 Urban/Suburban 15892 8.2
Rural 11515 5.9 Average Needs 58942 30.2
Low Needs 29798 15.3 Charter 2058 1.1
NRC
Missing 541 0.3 Asian 13660 7.0
Black/African American 37467 19.2 Hispanic/Latino 40204 20.6
Native American/ Alaskan Native 962 0.5
Ethnicity
Mixed Ethnicity 108 0.1 Native Hawaiian/Other
Pacific Islander 82 0.0 Ethnicity White 102475 52.6
No 179691 92.2 LEP Yes 15267 7.8 (Continued on next page)

Copyright © 2007 by the New York State Education Department
34
Table 8a. Grade 3 Sample Characteristics (N = 194958) (cont.)
Demographic Category N-count % of Total N-count No 170101 87.3 SWD Yes 24857 12.7 No 157075 80.6 SUA Yes 37883 19.4
Table 8b. Grade 4 Sample Characteristics (N = 193715)
Demographic Category N-count % of Total N-count New York City 66871 34.5
Big 4 Cities 7834 4.0 Urban/Suburban 15441 8.0
Rural 11335 5.9 Average Needs 59677 30.8
Low Needs 30267 15.6 Charter 1797 0.9
NRC
Missing 493 0.3 Asian 13867 7.2
Black/African American 36698 18.9 Hispanic/Latino 39114 20.2
Native American/ Alaskan Native 903 0.5
Mixed Ethnicity 70 0.0 Native Hawaiian/Other
Pacific Islander 54 0.0
Ethnicity
White 103009 53.2 No 181333 93.6 LEP Yes 12382 6.4 No 167102 86.3 SWD Yes 26613 13.7 No 154682 79.9 SUA Yes 39033 20.1
Table 8c. Grade 5 Sample Characteristics (N = 199583)
Demographic Category N-count % of Total N-count New York City 69472 34.8
Big 4 Cities 7642 3.8 Urban/Suburban 15548 7.8
Rural 11687 5.9 Average Needs 61055 30.6
NRC
Low Needs 31213 15.6 (Continued on next page)

Copyright © 2007 by the New York State Education Department
35
Table 8c. Grade 5 Sample Characteristics (N = 199583) (cont.)
Demographic Category N-count % of Total N-count Charter 2441 1.2 NRC Missing 525 0.3 Asian 14180 7.1
Black/African American 38025 19.1 Hispanic/Latino 40107 20.1
Native American/ Alaskan Native 918 0.5
Mixed Ethnicity 92 0.0 Native Hawaiian/Other
Pacific Islander 77 0.0
Ethnicity
White 106184 53.2 No 189696 95.0 LEP Yes 9887 5.0 No 171021 85.7 SWD Yes 28562 14.3 No 160681 80.5 SUA Yes 38902 19.5
Table 8d. Grade 6 Sample Characteristics (N = 202937)
Demographic Category N-count % of Total N-count New York City 68912 34.0
Big 4 Cities 7889 3.9 Urban/Suburban 15827 7.8
Rural 12124 6.0 Average Needs 63563 31.3
Low Needs 31616 15.6 Charter 2413 1.2
NRC
Missing 593 0.3 Asian 14099 6.9
Black/African American 38858 19.1 Hispanic/Latino 39910 19.7
Native American/ Alaskan Native 989 0.5
Mixed Ethnicity 104 0.1 Native Hawaiian/Other
Pacific Islander 60 0.0
Ethnicity
White 108917 53.7 No 194536 95.9 LEP Yes 8401 4.1
(Continued on next page)

Copyright © 2007 by the New York State Education Department
36
Table 8d. Grade 6 Sample Characteristics (N = 202937) (cont.)
Demographic Category N-count % of Total N-count No 174987 86.2 SWD Yes 27950 13.8 No 165900 81.7 SUA Yes 37037 18.3
Table 8e. Grade 7 Sample Characteristics (N = 210218)
Demographic Category N-count % of Total N-count New York City 72244 34.4
Big 4 Cities 8852 4.2 Urban/Suburban 16176 7.7
Rural 13335 6.3 Average Needs 66083 31.4
Low Needs 31551 15.0 Charter 1370 0.7
NRC
Missing 607 0.3 Asian 13867 6.6
Black/African American 41407 19.7 Hispanic/Latino 41003 19.5
Native American/ Alaskan Native 1098 0.5
Mixed Ethnicity 77 0.0 Native Hawaiian/Other
Pacific Islander 55 0.0
Ethnicity
White 112711 53.6 No 202285 96.2 LEP Yes 7933 3.8 No 181610 86.4 SWD Yes 28608 13.6 No 173387 82.5 SUA Yes 36831 17.5
Table 8f. Grade 8 Sample Characteristics (N = 211425)
Demographic Category N-count % of Total N-count New York City 72339 34.2
Big 4 Cities 8541 4.0 Urban/Suburban 16210 7.7
Rural 13332 6.3 Average Needs 67566 32.0
NRC
Low Needs 31592 14.9 (Continued on next page)

Copyright © 2007 by the New York State Education Department
37
Table 8f. Grade 8 Sample Characteristics (N = 211425) (cont.)
Demographic Category N-count % of Total N-count Charter 1144 0.5 NRC Missing 701 0.3 Asian 13687 6.5
Black/African American 41305 19.5 Hispanic/Latino 40625 19.2
Native American/ Alaskan Native 1041 0.5
Mixed Ethnicity 59 0.0
Ethnicity
Native Hawaiian/Other Pacific Islander 60 0.0
Ethnicity White 114648 54.2
No 202836 95.9 LEP Yes 8589 4.1 No 183784 86.9 SWD Yes 27641 13.1 No 174528 82.5 SUA Yes 36897 17.5
Classical Data Analysis Classical data analysis of the Grades 3–8 ELA Tests consists of four primary elements. One element is the analysis of item level statistical information about student performance. It is important to verify that the items and test forms function as intended. Information on item response patterns, item difficulty (p-value), and item-test correlation (point biserial) is examined thoroughly. If any serious error were to occur with an item (i.e., a printing error or potentially correct distractor), item analysis is the stage that errors should be flagged and evaluated for rectification (suppression, credit, or other acceptable solution). Analyses of test level data comprise the second element of classical data analysis. These include examination of the raw score statistics (mean and standard deviation) and test reliability measures (Cronbach’s alpha and Feldt-Raju coefficient). Assessment of test speededness is another important element of classical analysis. Additionally, classical differential item functioning (DIF) analysis is conducted at this stage. DIF analysis includes computation of standardized mean differences and Mantel-Haenszel statistics for New York State items to identify potential item bias. All classical data analysis results contribute information on the validity and reliability of the tests (also see Sections III and VII).
Item Difficulty and Response Distribution Item difficulty and response distribution tables (Table 9a–9f) illustrate student test performance, as observed from both MC and CR item responses. Omit rates signify the percentage of students who did not attempt the item. For MC items, “% at 0” represents the percentage of students who double-bubbled responses, and other “% SEL” categories

Copyright © 2007 by the New York State Education Department
38
represent the percentage of students who selected each answer response (without double marking). Proportions of students who selected the correct answer option are denoted with an asterisk (*) and are repeated in the p-value field. For CR items, the “% at 0,” “% SEL,” and “% at 5” (only in Grades 6 and 8) categories depict the percentage of students who earned each valid score on the item, from zero to the maximum score. Item difficulty is classically measured by the p-value statistic. It assesses the proportion of students who responded correctly to each MC item or the average percentage of the maximum score that students earned on each CR item. It is important to have a good range of p-values, to increase test information, and to avoid floor or ceiling effects. Generally, p-values should range between 0.30 and 0.90. P-values represent the overall degree of difficulty, but do not account for demonstrated student performance on other test items. Usually, p-value information is coupled with point biserial (pbis) statistics, to verify that items are functioning as intended (point biserials are discussed in the next subsection). Item difficulties (p-values) on the ELA tests ranged from 0.36 to 0.95. For Grade 3, the item p-values were between 0.44 and 0.93 with a mean of 0.76. For Grade 4, the item p-values were between 0.45 and 0.91 with a mean of 0.74. For Grade 5, the item p-values were between 0.46 and 0.95 with a mean of 0.75. For Grade 6, the item p-values were between 0.56 and 0.88 with a mean of 0.73. For Grade 7, the item p-values were between 0.36 and 0.91 with a mean of 0.73. For Grade 8, the item p-values were between 0.43 and 0.92 with a mean of 0.74. These mean p-value statistics are also provided in Table 10, along with other classical test summary statistics.
Table 9a. P-values, Scored Response Distributions, and Point Biserials, Grade 3
Item
N-c
ount
P-va
lue
% O
mit
% a
t 0
% S
el
Opt
ion
1
% S
el
Opt
ion
2
% S
el
Opt
ion
3
% S
el
Opt
ion
4
Pbis
O
ptio
n 1
Pbis
O
ptio
n 2
Pbis
O
ptio
n 3
Pbis
O
ptio
n 4
Pbis
Key
1 194958 0.71 0.09 0.04 8.70 3.55 16.41 *71.20 -0.17 -0.15 -0.17 *0.31 0.31
2 194958 0.60 0.10 0.07 15.28 *60.28 22.74 1.52 -0.11 *0.24 -0.12 -0.19 0.24
3 194958 0.68 0.21 0.20 *67.93 6.02 13.72 11.91 *0.44 -0.23 -0.17 -0.28 0.44
4 194958 0.80 0.31 0.17 3.12 7.03 *79.53 9.83 -0.25 -0.25 *0.49 -0.28 0.49
5 194958 0.63 0.45 0.12 25.34 *63.35 3.24 7.50 -0.10 *0.30 -0.23 -0.20 0.30
6 194958 0.87 0.57 0.13 5.43 2.88 *86.72 4.27 -0.27 -0.24 *0.48 -0.26 0.48
7 194958 0.87 0.10 0.12 *87.11 2.06 4.26 6.35 *0.43 -0.24 -0.15 -0.32 0.43
8 194958 0.45 0.13 0.23 26.51 14.82 12.94 *45.37 -0.08 -0.09 -0.23 *0.29 0.29
9 194958 0.82 0.16 0.14 *81.53 8.44 3.80 5.94 *0.22 -0.14 -0.12 -0.08 0.22
10 194958 0.72 0.22 0.08 4.94 16.36 *72.43 5.97 -0.20 -0.24 *0.43 -0.23 0.43
11 194958 0.82 0.31 0.05 7.52 4.10 6.35 *81.67 -0.21 -0.21 -0.20 *0.39 0.39
12 194958 0.84 0.19 0.04 5.90 3.05 6.94 *83.88 -0.33 -0.24 -0.21 *0.48 0.48
13 194958 0.77 0.29 0.07 7.55 7.65 *76.53 7.92 -0.18 -0.22 *0.41 -0.23 0.41
14 194958 0.73 0.54 0.10 *72.82 7.88 11.40 7.25 *0.52 -0.31 -0.23 -0.25 0.52 (Continued on next page)

Copyright © 2007 by the New York State Education Department
39
Table 9a. P-values, Scored Response Distributions, and Point Biserials, Grade 3
(cont.)
Item
N-c
ount
P-va
lue
% O
mit
% a
t 0
% S
el
Opt
ion
1
% S
el
Opt
ion
2
% S
el
Opt
ion
3
% S
el
Opt
ion
4
Pbis
O
ptio
n 1
Pbis
O
ptio
n 2
Pbis
O
ptio
n 3
Pbis
O
ptio
n 4
Pbis
Key
15 194958 0.75 0.69 0.09 15.08 *75.30 4.09 4.75 -0.28 *0.47 -0.17 -0.28 0.47
16 194958 0.44 0.19 0.10 41.60 *44.10 9.05 4.96 -0.15 *0.34 -0.19 -0.17 0.34
17 194958 0.75 0.21 0.13 *74.90 10.14 5.99 8.63 *0.47 -0.24 -0.26 -0.23 0.47
18 194958 0.83 0.25 0.09 4.10 9.52 *83.09 2.94 -0.26 -0.28 *0.48 -0.27 0.48
19 194958 0.76 0.34 0.09 6.17 *75.67 6.29 11.43 -0.23 *0.40 -0.18 -0.21 0.40
20 194958 0.84 0.56 0.02 7.28 4.63 3.21 *84.30 -0.30 -0.19 -0.26 *0.47 0.47
21 189700 0.65 0.00 24.60 18.49 54.22
22 194958 0.93 0.03 0.03 *92.72 2.68 1.32 3.23 *0.31 -0.15 -0.16 -0.21 0.31
23 194958 0.75 0.05 0.07 1.35 22.04 1.25 *75.25 -0.16 -0.26 -0.17 *0.34 0.34
24 194958 0.78 0.07 0.05 *77.79 3.68 10.75 7.66 *0.26 -0.18 -0.14 -0.12 0.26
25 194958 0.59 0.10 0.03 13.69 15.55 11.80 *58.83 -0.22 -0.03 -0.17 *0.29 0.29
26 194268 0.90 0.00 2.46 15.04 82.14
27 193858 0.81 0.00 12.03 13.83 73.58
28 194431 0.91 0.00 3.99 3.25 7.38 85.10
Table 9b. P-values, Scored Response Distributions, and Point Biserials, Grade 4
Item
N-c
ount
P-va
lue
% O
mit
% a
t 0
% S
el
Opt
ion
1
% S
el
Opt
ion
2
% S
el
Opt
ion
3
% S
el
Opt
ion
4
Pbis
O
ptio
n 1
Pbis
O
ptio
n 2
Pbis
O
ptio
n 3
Pbis
O
ptio
n 4
Pbis
Key
1 193715 0.86 0.02 0.01 2.07 6.16 *86.20 5.53 -0.27 -0.28 *0.47 -0.25 0.47
2 193715 0.84 0.03 0.07 8.06 5.53 2.30 *84.01 -0.24 -0.22 -0.21 *0.41 0.41
3 193715 0.80 0.04 0.06 16.38 *79.51 1.95 2.06 -0.25 *0.41 -0.26 -0.23 0.41
4 193715 0.81 0.06 0.12 1.90 15.29 1.75 *80.88 -0.23 -0.15 -0.25 *0.30 0.30
5 193715 0.82 0.04 0.06 *82.23 2.84 12.45 2.38 *0.35 -0.18 -0.21 -0.22 0.35
6 193715 0.91 0.05 0.10 4.50 3.15 1.38 *90.83 -0.29 -0.32 -0.22 *0.50 0.50
7 193715 0.85 0.06 0.05 *85.04 3.45 7.82 3.58 *0.50 -0.23 -0.30 -0.30 0.50
8 193715 0.90 0.05 0.04 4.19 *90.35 3.76 1.61 -0.24 *0.46 -0.30 -0.24 0.46
9 193715 0.89 0.07 0.07 2.19 *89.17 3.85 4.65 -0.24 *0.51 -0.28 -0.32 0.51
10 193715 0.86 0.05 0.08 6.17 5.69 1.90 *86.10 -0.27 -0.37 -0.22 *0.52 0.52
11 193715 0.69 0.05 0.05 8.48 7.70 *69.17 14.57 -0.16 -0.23 *0.37 -0.18 0.37
12 193715 0.61 0.07 0.06 20.01 12.61 *60.56 6.68 -0.15 -0.16 *0.35 -0.23 0.35
13 193715 0.65 0.10 0.06 17.55 *65.38 13.09 3.82 -0.29 *0.46 -0.21 -0.17 0.46
14 193715 0.64 0.13 0.04 8.83 13.22 *63.54 14.24 -0.19 -0.18 *0.36 -0.16 0.36 (Continued on next page)

Copyright © 2007 by the New York State Education Department
40
Table 9b. P-values, Scored Response Distributions, and Point Biserials, Grade 4
(cont.)
Item
N-c
ount
P-va
lue
% O
mit
% a
t 0
% S
el
Opt
ion
1
% S
el
Opt
ion
2
% S
el
Opt
ion
3
% S
el
Opt
ion
4
Pbis
O
ptio
n 1
Pbis
O
ptio
n 2
Pbis
O
ptio
n 3
Pbis
O
ptio
n 4
Pbis
Key
15 193715 0.60 0.13 0.06 3.51 *59.85 30.99 5.47 -0.30 *0.44 -0.25 -0.19 0.44
16 193715 0.64 0.18 0.08 14.10 9.41 12.18 *64.05 -0.17 -0.20 -0.13 *0.34 0.34
17 193715 0.45 0.18 0.07 29.42 10.96 14.20 *45.18 -0.07 -0.20 -0.21 *0.34 0.34
18 193715 0.88 0.31 0.06 *88.32 2.43 5.05 3.84 *0.41 -0.20 -0.23 -0.22 0.41
19 193715 0.59 0.35 0.06 18.31 *58.65 10.22 12.40 -0.17 *0.29 -0.03 -0.18 0.29
20 193715 0.88 0.37 0.06 *87.52 6.45 2.76 2.84 *0.49 -0.29 -0.25 -0.25 0.49
21 193715 0.77 0.41 0.06 7.47 7.99 7.31 *76.76 -0.22 -0.20 -0.19 *0.40 0.40
22 193715 0.86 0.50 0.04 3.54 4.58 *86.05 5.29 -0.29 -0.27 *0.50 -0.25 0.50
23 193715 0.60 0.58 0.06 21.44 *60.09 12.41 5.43 -0.15 *0.36 -0.15 -0.25 0.36
24 193715 0.65 0.82 0.10 4.49 26.46 3.39 *64.73 -0.24 -0.27 -0.27 *0.48 0.48
25 193715 0.72 0.91 0.07 *72.23 7.55 11.90 7.34 *0.49 -0.30 -0.19 -0.27 0.49
26 193715 0.85 1.00 0.05 5.45 *84.55 4.79 4.16 -0.30 *0.55 -0.29 -0.29 0.55
27 193715 0.66 1.11 0.04 22.87 5.70 4.45 *65.83 -0.26 -0.25 -0.29 *0.50 0.50
28 193715 0.72 1.24 0.03 7.77 *72.09 7.75 11.13 -0.25 *0.50 -0.26 -0.24 0.50
29 193556 0.71 0.00 0.82 5.35 24.41 46.88 22.45
30 193475 0.73 0.00 1.50 14.67 47.38 36.33
31 193470 0.70 0.00 1.14 5.38 23.98 50.54 18.85
Table 9c. P-values, Scored Response Distributions, and Point Biserials, Grade 5
Item
N-c
ount
P-va
lue
% O
mit
% a
t 0
% S
el
Opt
ion
1
% S
el
Opt
ion
2
% S
el
Opt
ion
3
% S
el
Opt
ion
4
Pbis
O
ptio
n 1
Pbis
O
ptio
n 2
Pbis
O
ptio
n 3
Pbis
O
ptio
n 4
Pbis
Key
1 199583 0.94 0.01 0.01 1.10 1.18 4.14 *93.57 -0.21 -0.19 -0.25 *0.38 0.38
2 199583 0.82 0.02 0.01 3.34 3.02 *81.47 12.13 -0.22 -0.15 *0.34 -0.21 0.34
3 199583 0.76 0.03 0.05 *76.08 7.25 4.78 11.81 *0.38 -0.20 -0.26 -0.16 0.38
4 199583 0.85 0.02 0.02 1.79 11.97 *84.65 1.55 -0.21 -0.27 *0.39 -0.20 0.39
5 199583 0.94 0.02 0.02 1.92 1.38 *94.02 2.64 -0.16 -0.20 *0.37 -0.27 0.37
6 199583 0.84 0.04 0.04 *83.92 3.26 6.74 6.00 *0.27 -0.17 -0.11 -0.17 0.27
7 199583 0.70 0.03 0.04 18.56 9.42 *70.32 1.63 -0.23 -0.16 *0.36 -0.21 0.36
8 199583 0.83 0.03 0.03 1.85 5.12 *83.45 9.53 -0.24 -0.23 *0.35 -0.15 0.35
9 199583 0.90 0.02 0.03 5.87 *90.14 2.51 1.43 -0.27 *0.41 -0.19 -0.23 0.41
10 199583 0.95 0.03 0.05 1.74 2.10 1.26 *94.82 -0.25 -0.22 -0.19 *0.39 0.39
11 199583 0.74 0.07 0.02 5.10 14.49 *73.46 6.87 -0.21 -0.03 *0.28 -0.26 0.28 (Continued on next page)

Copyright © 2007 by the New York State Education Department
41
Table 9c. P-values, Scored Response Distributions, and Point Biserials, Grade 5
(cont.)
Item
N-c
ount
P-va
lue
% O
mit
% a
t 0
% S
el
Opt
ion
1
% S
el
Opt
ion
2
% S
el
Opt
ion
3
% S
el
Opt
ion
4
Pbis
O
ptio
n 1
Pbis
O
ptio
n 2
Pbis
O
ptio
n 3
Pbis
O
ptio
n 4
Pbis
Key
12 199583 0.86 0.06 0.03 *86.35 5.29 4.73 3.53 *0.35 -0.20 -0.19 -0.18 0.35
13 199583 0.83 0.06 0.03 3.86 3.72 *82.86 9.46 -0.23 -0.24 *0.5 -0.33 0.50
14 199583 0.58 0.10 0.04 18.43 14.93 *57.81 8.69 -0.13 -0.06 *0.28 -0.23 0.28
15 199583 0.68 0.10 0.05 17.23 6.45 8.43 *67.74 -0.13 -0.26 -0.20 *0.36 0.36
16 199583 0.77 0.16 0.04 6.50 6.84 9.88 *76.59 -0.37 -0.21 -0.26 *0.52 0.52
17 199583 0.84 0.15 0.03 3.19 *83.50 8.85 4.28 -0.24 *0.44 -0.25 -0.24 0.44
18 199583 0.66 0.19 0.03 11.61 6.60 15.23 *66.33 -0.17 -0.20 -0.30 *0.45 0.45
19 199583 0.72 0.23 0.04 8.37 6.57 *71.54 13.27 -0.27 -0.15 *0.40 -0.19 0.40
20 199583 0.56 0.33 0.01 8.78 *55.96 14.49 20.43 -0.20 *0.26 -0.11 -0.07 0.26
21 198053 0.72 0.00 16.22 23.55 59.46
22 199583 0.79 0.03 0.01 9.83 2.28 *78.49 9.35 -0.13 -0.15 *0.24 -0.12 0.24
23 199583 0.87 0.04 0.02 *86.70 6.80 3.25 3.20 *0.46 -0.29 -0.24 -0.22 0.46
24 199583 0.77 0.04 0.02 1.52 *77.33 6.15 14.94 -0.21 *0.35 -0.24 -0.17 0.35
25 199583 0.80 0.07 0.01 *80.20 4.22 2.49 13.01 *0.32 -0.18 -0.17 -0.19 0.32
26 199047 0.66 0.00 11.59 43.97 44.17
27 199135 0.46 0.00 26.49 26.17 30.05 17.06
Table 9d. P-values, Scored Response Distributions, and Point Biserials, Grade 6
Item
N-c
ount
P-va
lue
% O
mit
% a
t 0
% S
el
Opt
ion
1
% S
el
Opt
ion
2
% S
el
Opt
ion
3
% S
el
Opt
ion
4
% a
t 5
Pbis
O
ptio
n 1
Pbis
O
ptio
n 2
Pbis
O
ptio
n 3
Pbis
O
ptio
n 4
Pbis
Key
1 202937 0.70 0.05 0.02 1.39 22.44 *70.27 5.84 -0.19 -0.24 *0.36 -0.17 0.36
2 202937 0.78 0.03 0.03 1.27 10.21 10.50 *77.96 -0.12 -0.21 -0.28 *0.39 0.39
3 202937 0.82 0.07 0.02 7.71 4.20 *82.28 5.71 -0.11 -0.22 *0.25 -0.09 0.25
4 202937 0.73 0.07 0.04 8.82 15.01 *72.65 3.41 -0.28 -0.22 *0.42 -0.15 0.42
5 202937 0.59 0.06 0.06 1.71 34.04 5.57 *58.56 -0.18 -0.20 -0.23 *0.35 0.35
6 202937 0.87 0.07 0.04 4.13 *86.59 2.22 6.95 -0.26 *0.46 -0.18 -0.31 0.46
7 202937 0.62 0.10 0.05 16.14 11.78 10.08 *61.84 -0.07 -0.14 -0.28 *0.32 0.32
8 202937 0.72 0.13 0.05 17.94 5.28 *72.30 4.30 -0.16 -0.24 *0.36 -0.21 0.36
9 202937 0.56 0.13 0.03 20.73 9.87 *56.43 12.81 -0.05 -0.37 *0.35 -0.13 0.35
10 202937 0.85 0.08 0.03 8.99 3.04 *84.56 3.30 -0.24 -0.27 *0.45 -0.25 0.45
11 202937 0.71 0.11 0.04 *71.24 11.11 8.89 8.61 *0.41 -0.26 -0.16 -0.20 0.41
(Continued on next page)

Copyright © 2007 by the New York State Education Department
42
Table 9d. P-values, Scored Response Distributions, and Point Biserials, Grade 6
(cont.)
Item
N-c
ount
P-va
lue
% O
mit
% a
t 0
% S
el
Opt
ion
1
% S
el
Opt
ion
2
% S
el
Opt
ion
3
% S
el
Opt
ion
4
% a
t 5
Pbis
O
ptio
n 1
Pbis
O
ptio
n 2
Pbis
O
ptio
n 3
Pbis
O
ptio
n 4
Pbis
Key
12 202937 0.85 0.10 0.04 4.56 5.84 4.15 *85.31 -0.16 -0.23 -0.21 *0.37 0.37
13 202937 0.72 0.08 0.04 8.11 8.80 11.28 *71.69 -0.22 -0.20 -0.22 *0.42 0.42
14 202937 0.88 0.07 0.02 2.12 *87.74 6.63 3.42 -0.20 *0.36 -0.21 -0.20 0.36
15 202937 0.81 0.08 0.03 1.88 9.75 *81.04 7.22 -0.24 -0.21 *0.44 -0.30 0.44
16 202937 0.66 0.16 0.03 9.65 13.67 *65.59 10.89 -0.32 -0.26 *0.49 -0.15 0.49
17 202937 0.86 0.13 0.04 *86.40 5.04 2.20 6.19 *0.38 -0.20 -0.21 -0.22 0.38
18 202937 0.84 0.16 0.03 4.99 *83.58 4.04 7.20 -0.25 *0.46 -0.24 -0.25 0.46
19 202937 0.69 0.16 0.06 5.61 19.61 5.16 *69.41 -0.30 -0.19 -0.20 *0.42 0.42
20 202937 0.62 0.23 0.05 9.42 *62.12 16.45 11.74 -0.18 *0.38 -0.23 -0.12 0.38
21 202937 0.84 0.25 0.05 6.32 *84.39 3.52 5.48 -0.29 *0.48 -0.24 -0.25 0.48
22 202937 0.83 0.26 0.04 *83.37 3.79 6.79 5.73 *0.43 -0.24 -0.25 -0.20 0.43
23 202937 0.66 0.52 0.05 *66.37 8.56 14.81 9.69 *0.46 -0.27 -0.23 -0.18 0.46
24 202937 0.80 0.49 0.04 8.93 *80.11 5.72 4.70 -0.27 *0.47 -0.21 -0.26 0.47
25 202937 0.82 0.60 0.05 6.49 5.14 6.20 *81.53 -0.27 -0.27 -0.26 *0.50 0.50
26 202937 0.75 0.61 0.02 13.50 6.35 4.86 *74.65 -0.19 -0.23 -0.32 *0.45 0.45
27 202686 0.70 0.00 0.51 3.07 11.74 31.94 36.91 15.70
28 202603 0.75 0.00 1.09 13.04 47.09 38.62
29 202590 0.67 0.00 0.78 5.19 15.36 32.14 32.02 14.34
Table 9e. P-values, Scored Response Distributions, and Point Biserials, Grade 7
Item
N-c
ount
P-va
lue
% O
mit
% a
t 0
% S
el
Opt
ion
1
% S
el
Opt
ion
2
% S
el
Opt
ion
3
% S
el
Opt
ion
4
Pbis
O
ptio
n 1
Pbis
O
ptio
n 2
Pbis
O
ptio
n 3
Pbis
O
ptio
n 4
Pbis
Key
1 210218 0.59 0.11 0.02 18.56 *59.43 5.05 16.84 -0.21 *0.26 -0.21 0.00 0.26
2 210218 0.47 0.10 0.02 9.54 30.02 13.04 *47.28 -0.09 -0.22 -0.10 *0.32 0.32
3 208455 0.85 0.00 5.97 17.80 75.39
4 210218 0.56 0.19 0.01 30.80 *55.56 10.74 2.70 -0.1 *0.24 -0.11 -0.25 0.24
5 210218 0.91 0.08 0.02 *90.86 2.13 4.66 2.25 *0.45 -0.23 -0.26 -0.28 0.45
6 210218 0.89 0.06 0.04 *89.27 2.18 4.82 3.64 *0.48 -0.15 -0.36 -0.26 0.48
7 210218 0.78 0.08 0.04 4.84 *77.58 3.65 13.82 -0.24 *0.37 -0.13 -0.22 0.37
8 210218 0.72 0.12 0.13 4.35 16.21% 7.55 *71.64 -0.24 -0.29 -0.19 *0.47 0.47 (Continued on next page)

Copyright © 2007 by the New York State Education Department
43
Table 9e. P-values, Scored Response Distributions, and Point Biserials, Grade 7
(cont.)
Item
N-c
ount
P-va
lue
% O
mit
% a
t 0
% S
el
Opt
ion
1
% S
el
Opt
ion
2
% S
el
Opt
ion
3
% S
el
Opt
ion
4
Pbis
O
ptio
n 1
Pbis
O
ptio
n 2
Pbis
O
ptio
n 3
Pbis
O
ptio
n 4
Pbis
Key
9 210218 0.87 0.10 0.06 *86.79 5.87 3.72 3.48 *0.43 -0.24 -0.23 -0.24 0.43
10 210218 0.68 0.11 0.04 7.96 6.52 *67.64 17.74 -0.31 -0.19 *0.43 -0.18 0.43
11 210218 0.85 0.11 0.04 4.83 4.55 5.62 *84.85 -0.24 -0.23 -0.27 *0.46 0.46
12 210218 0.65 0.18 0.05 5.71 5.79 23.34 *64.93 -0.19 -0.22 -0.19 *0.37 0.37
13 210218 0.61 0.19 0.03 *61.34 4.63 30.71 3.09 *0.45 -0.24 -0.27 -0.25 0.45
14 210218 0.87 0.16 0.04 1.57 9.43 *86.80 2.00 -0.23 -0.32 *0.44 -0.17 0.44
15 210218 0.88 0.12 0.02 3.90 *88.38 4.12 3.45 -0.25 *0.42 -0.23 -0.20 0.42
16 210218 0.87 0.13 0.04 5.12 4.25 *87.20 3.26 -0.24 -0.18 *0.40 -0.23 0.40
17 210218 0.91 0.19 0.03 *90.79 2.36 2.22 4.40 *0.43 -0.23 -0.25 -0.23 0.43
18 210218 0.91 0.18 0.03 3.39 *90.94 3.64 1.82 -0.29 *0.50 -0.29 -0.24 0.50
19 210218 0.67 0.27 0.03 18.15 5.17 *67.19 9.18 -0.22 -0.19 *0.32 -0.06 0.32
20 210218 0.66 0.31 0.05 *66.37 15.25 11.86 6.17 *0.37 -0.14 -0.20 -0.22 0.37
21 210218 0.79 0.45 0.02 7.92 6.19 6.02 *79.40 -0.27 -0.27 -0.19 *0.47 0.47
22 206963 0.77 0.00 6.46 33.05 58.95
23 210218 0.88 0.84 0.01 6.85 *87.72 3.64 0.94 -0.30 *0.39 -0.15 -0.15 0.39
24 210218 0.71 0.98 0.03 8.48 13.21 *71.29 6.01 -0.26 -0.14 *0.42 -0.25 0.42
25 210218 0.54 1.18 0.06 32.32 3.45 9.25 *53.73 -0.21 -0.23 -0.20 *0.42 0.42
26 210218 0.69 1.34 0.06 10.19 *68.83 14.86 4.73 -0.25 *0.44 -0.18 -0.26 0.44
27 210218 0.66 1.41 0.05 10.45 17.05 *65.92 5.12 -0.18 -0.13 *0.37 -0.26 0.37
28 210218 0.74 1.47 0.02 7.38 13.60 *73.72 3.81 -0.24 -0.29 *0.51 -0.23 0.51
29 210218 0.80 0.27 0.01 12.72 4.75 1.82 *80.44 -0.37 -0.28 -0.14 *0.52 0.52
30 210218 0.90 0.27 0.02 *90.43 1.25 4.39 3.63 *0.32 -0.20 -0.22 -0.12 0.32
31 210218 0.72 0.29 0.02 2.02 *71.47 10.71 15.50 -0.20 *0.35 -0.23 -0.15 0.35
32 210218 0.83 0.34 0.01 7.28 6.52 *82.58 3.27 -0.18 -0.16 *0.34 -0.23 0.34
33 209053 0.78 0.00 5.47 32.41 61.57
34 209296 0.83 0.00 4.22 25.08 70.26
35 208878 0.36 0.00 33.57 31.14 29.22 5.43

Copyright © 2007 by the New York State Education Department
44
Table 9f. P-values, Scored Response Distributions, and Point Biserials, Grade 8 Ite
m
N-c
ount
P-va
lue
% O
mit
% a
t 0
% S
el
Opt
ion
1
% S
el
Opt
ion
2
% S
el
Opt
ion
3
% S
el
Opt
ion
4
% a
t 5
Pbis
O
ptio
n 1
Pbis
O
ptio
n 2
Pbis
O
ptio
n 3
Pbis
O
ptio
n 4
Pbis
Key
1 211425 0.78 0.03 0.02 4.25 1.37 16.68 *77.66 -0.30 -0.17 -0.20 *0.38 0.38
2 211425 0.70 0.11 0.02 21.65 2.83 *70.01 5.37 -0.21 -0.27 *0.36 -0.16 0.36
3 211425 0.87 0.07 0.03 2.76 2.23 *87.26 7.65 -0.20 -0.25 *0.42 -0.26 0.42
4 211425 0.87 0.07 0.03 *86.76 4.29 4.12 4.74 *0.34 -0.23 -0.17 -0.17 0.34
5 211425 0.78 0.09 0.03 13.51 *77.75 4.61 4.00 -0.11 *0.26 -0.15 -0.21 0.26
6 211425 0.49 0.06 0.04 32.01 14.13 5.11 *48.64 -0.11 -0.12 -0.14 *0.25 0.25
7 211425 0.79 0.09 0.03 7.43 6.27 7.56 *78.62 -0.20 -0.11 -0.25 *0.36 0.36
8 211425 0.92 0.08 0.02 3.63 2.31 *92.07 1.89 -0.24 -0.26 *0.44 -0.24 0.44
9 211425 0.43 0.15 0.03 36.48 16.12 3.81 *43.42 -0.10 -0.31 -0.15 *0.38 0.38
10 211425 0.72 0.06 0.04 12.62 *71.97 5.27 10.04 -0.22 *0.38 -0.14 -0.22 0.38
11 211425 0.83 0.08 0.08 4.27 5.38 6.80 *83.40 -0.24 -0.30 -0.24 *0.48 0.48
12 211425 0.84 0.09 0.04 *83.98 10.62 4.32 0.94 *0.26 -0.11 -0.22 -0.17 0.26
13 211425 0.83 0.07 0.03 2.33 10.70 *82.58 4.28 -0.14 -0.14 *0.28 -0.20 0.28
14 211425 0.55 0.11 0.03 16.12 *55.22 10.29 18.23 -0.18 *0.35 -0.20 -0.12 0.35
15 211425 0.71 0.10 0.04 6.53 *70.79 10.59 11.95 -0.18 *0.31 -0.16 -0.14 0.31
16 211425 0.72 0.11 0.08 3.49 16.92 6.91 *72.49 -0.22 -0.20 -0.14 *0.35 0.35
17 211425 0.88 0.15 0.02 7.52 *87.64 2.70 1.97 -0.23 *0.37 -0.20 -0.19 0.37
18 211425 0.71 0.14 0.03 *71.45 23.35 3.73 1.31 *0.35 -0.17 -0.31 -0.20 0.35
19 211425 0.82 0.14 0.03 *81.83 13.07 2.58 2.36 *0.33 -0.14 -0.23 -0.26 0.33
20 211425 0.83 0.16 0.03 8.62 *82.81 4.44 3.94 -0.19 *0.36 -0.26 -0.13 0.36
21 211425 0.79 0.39 0.04 *79.39 4.68 9.34 6.16 *0.36 -0.15 -0.24 -0.16 0.36
22 211425 0.61 0.39 0.06 *60.92 8.38 7.99 22.26 *0.44 -0.25 -0.25 -0.17 0.44
23 211425 0.64 0.49 0.06 6.60 14.71 *64.29 13.85 -0.20 -0.16 *0.36 -0.17 0.36
24 211425 0.73 0.51 0.06 *72.87 5.21 6.46 14.89 *0.41 -0.28 -0.30 -0.11 0.41
25 211425 0.78 0.56 0.02 3.23 13.38 *78.00 4.81 -0.25 -0.18 *0.36 -0.16 0.36
26 211425 0.86 0.56 0.02 5.65 4.82 2.51 *86.43 -0.20 -0.28 -0.23 *0.44 0.44
27 210958 0.74 0.00 0.67 3.54 10.16 24.06 33.25 28.10
28 210899 0.76 0.00 1.21 11.58 45.43 41.52
29 210947 0.72 0.00 0.92 5.09 11.32 24.37 33.21 24.87

Copyright © 2007 by the New York State Education Department
45
Point-Biserial Correlation Coefficients Point-biserial (pbis) statistics are used to examine item-test correlations or item discrimination for MC items. In the Tables 9a–9f, point-biserial correlation coefficients were computed for each answer option. Point biserials for the correct answer option are denoted with an asterisk (*) and are repeated in the Pbis Key field. The point-biserial correlation is a measure of internal consistency that ranges between +/-1. It indicates a correlation of students’ responses to an item relative to their performance on the rest of the test. The criterion for point biserial for the correct answer option used for New York State test was 0.15. The point biserials for the correct answer option that was equal to or greater than 0.15 indicated that students who responded correctly also tended to do well on the overall test. For incorrect answer options (distractors), the point biserial should be negative, which indicated that students who scored lower on the overall test had a tendency to pick a distractor. None of the grades had any item answer keys that were flagged for low point biserials. Point biserials for correct answer options (pbis*) on the tests ranged 0.22–0.55. For Grade 3, the pbis* were between 0.22 and 0.52. For Grade 4, the pbis* were between 0.29 and 0.55. For Grade 5, the pbis* were between 0.24 and 0.52. For Grade 6, pbis* were between 0.25 and 0.50. For Grade 7, the pbis* were between 0.24 and 0.52. For Grade 8, the pbis* were between 0.25 and 0.48.
Distractor Analysis Item distractors provide additional information on student performance on test questions. Two types of information on item distractors are available from New York State test data: information on proportion of students selecting incorrect item response options and the point biserial coefficient of distractors (discrimination power of incorrect answer choices). The proportions of students selecting incorrect responses while responding to MC items are provided in Tables 9a–9f of this report. Distribution of student responses across answer choices was evaluated. It was expected that the proportion of students selecting the correct answer would be higher than proportions of students selecting any other answer choice. This was true for all New York State ELA items. As mentioned in the “Point-Biserial Correlations Coefficients” subsection, items were flagged if the point biserial of any distractor was positive. The only item with a distractor that had a non-negative point biserial was item number 1 in Grade 7, which had a point biserial of 0. All other point biserials for distractors in each grade were negative.
Test Statistics and Reliability Coefficients Test statistics including raw-score mean and raw-score standard deviation are presented in Table 10. For both Grades 4 and 8, weighted and unweighted test statistics are provided. Grade 4 and 8 CR items were weighted by a 1.38 factor to increase proportion of score points obtainable from these items. Weighting CR items for these two grades resulted in better alignment of proportions of test raw-score points obtainable from MC and CR items between 2005 and 2007 ELA operational tests for these grades. More information on weighting CR items and the effect on test content is provided in Section VI, “IRT Scaling and Equating.” Reliability coefficients provide measures of internal consistency that range from zero to one. Two reliability coefficients, Cronbach’s alpha and Feldt-Raju coefficient, were computed for the Grades 3–8 ELA Tests. Both types of

Copyright © 2007 by the New York State Education Department
46
reliability estimates are appropriate to use when a test contains both MC and CR items. Calculated Cronbach’s alpha reliabilities ranged 0.84–0.89. Feldt-Raju reliability coefficients ranged 0.85–0.90. The lowest reliability was observed for the Grade 5 test, but since that test had the lowest number of score points it was reasonable that its reliability would not be as high as the other grades’ tests. The highest reliability was observed for the Grade 4 test. All reliabilities met or exceeded 0.80, across statistics, which is a good indication that the NYSTP 3–8 ELA Tests are acceptably reliable. High reliability indicates that scores are consistent and not unduly influenced by random error (for more information on test reliability and standard error of measurement, see Section VII, “Reliability and Standard Error of Measurement”). Table 10. NYSTP ELA 2007 Test Form Statistics and Reliability
Grade Max RS RS Mean RS SD P-value Mean
Cronbach’s alpha
Feldt-Raju
3 33 25.13 6.00 0.76 0.86 0.86
4 39 (43 WGT)
28.82 (31.80 WGT)
7.11 (7.76 WGT) 0.74 0.89 0.90
5 31 23.10 5.54 0.75 0.84 0.85 6 39 28.62 7.02 0.73 0.88 0.89 7 41 30.07 7.38 0.73 0.89 0.89
8 39 (44 WGT)
29.03 (32.66 WGT)
6.78 (7.69 WGT) 0.74 0.89 0.88
Note: WGT = weighted results
Speededness Speededness is the term used to refer to interference in test score observation due to insufficient testing time. Test developers considered speededness in the development of the NYSTP tests. NYSED believes that achievement tests should not be speeded; little or no useful instructional information can be obtained from the fact that a student does not finish a test, while a great deal can be learned from student responses to questions. Further, NYSED prefers all scores to be based on actual student performance, because all students should have ample opportunity to demonstrate that performance to enhance the validity of their scores. Test reliability is directly impacted by the number of test questions, so excluding questions that were impacted by a lack of timing would negatively impact reliability. For these reasons, sufficient administration time limits were set for the NYSTP tests. The research department at CTB/McGraw-Hill routinely conducts additional speededness analyses based on actual test data. The general rule of thumb is that omit rates should be less than 5.0 %. Tables 9a–9f show the omit rates for items on the Grades 3–8 ELA Tests. These results provide no evidence of speededness on these tests.
Differential Item Functioning Classical differential item functioning (DIF) was evaluated using two methods. First, the standardized mean difference (SMD) was computed for all items. The SMD statistic (Dorans, Schmitt, and Bleistein, 1992) compares the mean scores of reference and focal
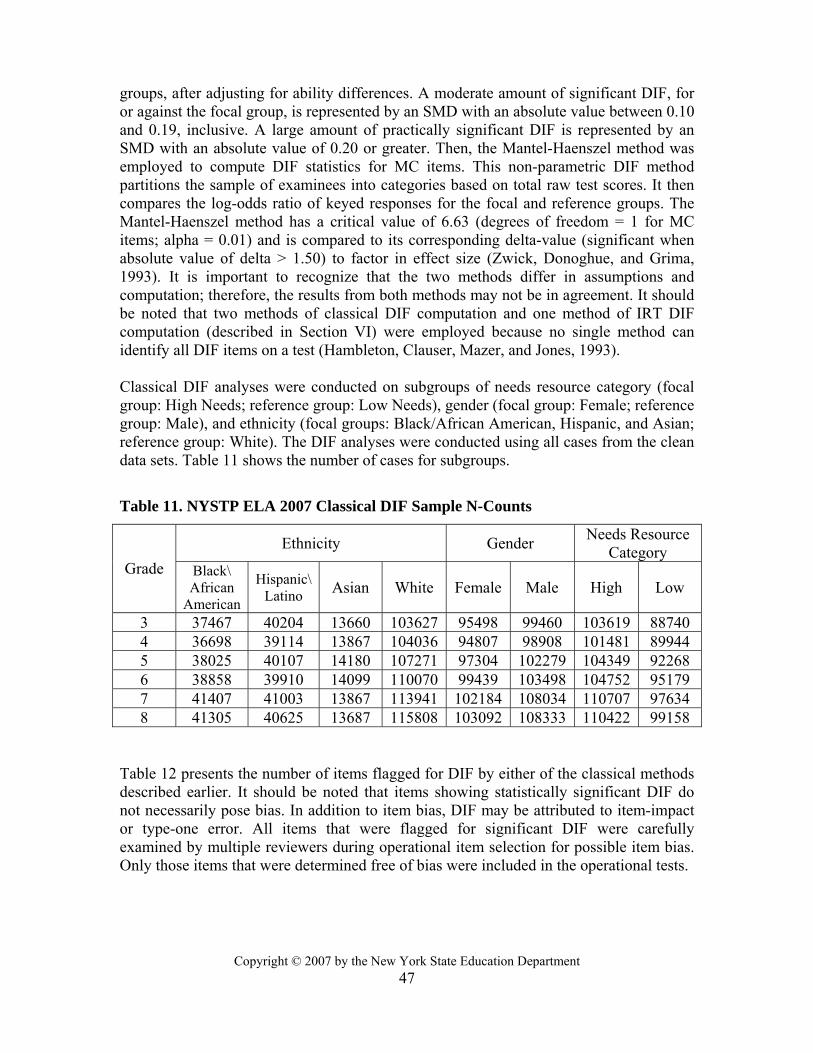
Copyright © 2007 by the New York State Education Department
47
groups, after adjusting for ability differences. A moderate amount of significant DIF, for or against the focal group, is represented by an SMD with an absolute value between 0.10 and 0.19, inclusive. A large amount of practically significant DIF is represented by an SMD with an absolute value of 0.20 or greater. Then, the Mantel-Haenszel method was employed to compute DIF statistics for MC items. This non-parametric DIF method partitions the sample of examinees into categories based on total raw test scores. It then compares the log-odds ratio of keyed responses for the focal and reference groups. The Mantel-Haenszel method has a critical value of 6.63 (degrees of freedom = 1 for MC items; alpha = 0.01) and is compared to its corresponding delta-value (significant when absolute value of delta > 1.50) to factor in effect size (Zwick, Donoghue, and Grima, 1993). It is important to recognize that the two methods differ in assumptions and computation; therefore, the results from both methods may not be in agreement. It should be noted that two methods of classical DIF computation and one method of IRT DIF computation (described in Section VI) were employed because no single method can identify all DIF items on a test (Hambleton, Clauser, Mazer, and Jones, 1993). Classical DIF analyses were conducted on subgroups of needs resource category (focal group: High Needs; reference group: Low Needs), gender (focal group: Female; reference group: Male), and ethnicity (focal groups: Black/African American, Hispanic, and Asian; reference group: White). The DIF analyses were conducted using all cases from the clean data sets. Table 11 shows the number of cases for subgroups.
Table 11. NYSTP ELA 2007 Classical DIF Sample N-Counts
Ethnicity Gender Needs Resource Category
Grade Black\ African
American
Hispanic\ Latino Asian White Female Male High Low
3 37467 40204 13660 103627 95498 99460 103619 88740 4 36698 39114 13867 104036 94807 98908 101481 89944 5 38025 40107 14180 107271 97304 102279 104349 92268 6 38858 39910 14099 110070 99439 103498 104752 95179 7 41407 41003 13867 113941 102184 108034 110707 97634 8 41305 40625 13687 115808 103092 108333 110422 99158
Table 12 presents the number of items flagged for DIF by either of the classical methods described earlier. It should be noted that items showing statistically significant DIF do not necessarily pose bias. In addition to item bias, DIF may be attributed to item-impact or type-one error. All items that were flagged for significant DIF were carefully examined by multiple reviewers during operational item selection for possible item bias. Only those items that were determined free of bias were included in the operational tests.
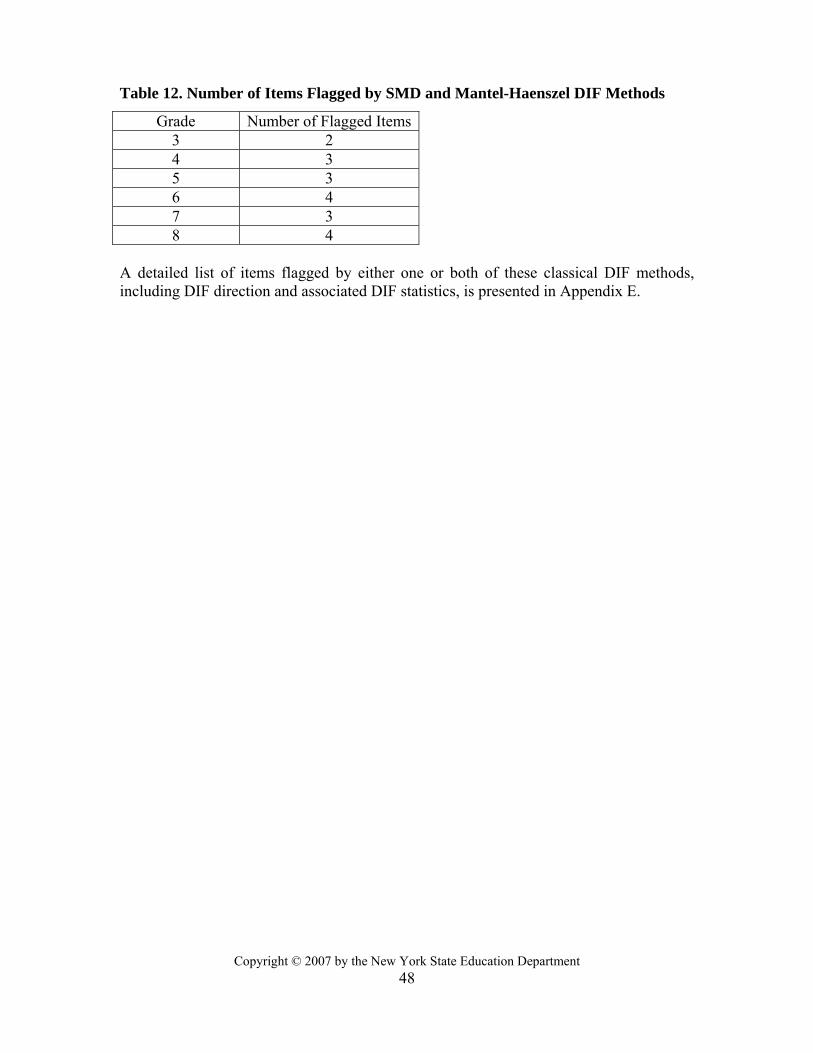
Copyright © 2007 by the New York State Education Department
48
Table 12. Number of Items Flagged by SMD and Mantel-Haenszel DIF Methods
Grade Number of Flagged Items3 2 4 3 5 3 6 4 7 3 8 4
A detailed list of items flagged by either one or both of these classical DIF methods, including DIF direction and associated DIF statistics, is presented in Appendix E.

Copyright © 2007 by the New York State Education Department
49
Section VI: IRT Scaling and Equating
IRT Models and Rationale for Use Item response theory (IRT) allows comparisons among items and scale scores, even those from different test forms, by using a common scale for all items and examinees (i.e., as if there were a hypothetical test that contained items from all forms). The three-parameter logistic (3PL) model (Lord and Novick, 1968; Lord, 1980) was used to analyze item responses on the multiple-choice items. For analysis of the constructed-response items, the two-parameter partial credit (2PPC) model (Muraki, 1992; Yen, 1993) was used. IRT is a statistical methodology that takes into account the fact that not all test items are alike and that all items do not provide the same amount of information in determining how much a student knows or can do. Computer programs that implement IRT models use actual student data to estimate the characteristics of the items on a test, called “parameters.” The parameter estimation process is called “item calibration.” IRT models typically vary according to the number of parameters estimated. For the New York State tests, three parameters are estimated: the discrimination parameter, the difficulty parameter(s), and, for multiple-choice items, the guessing parameter. The discrimination parameter is an index of how well an item differentiates between high-performing and low-performing students. An item that cannot be answered correctly by low-performing students, but can be answered correctly by high-performing students, will have a high-discrimination value. The difficulty parameter is an index of how easy or difficult an item is. The higher the difficulty parameter is, the harder the item. The guessing parameter is the probability that a student with very low ability will answer the item correctly. Because the characteristics of MC and CR items are different, two IRT models were used in item calibration. The three-parameter logistic (3PL) was used in the analysis of MC items. In this model, the probability that a student with abilityθ responds correctly to item i is
P ca bii
i i
( ) = ( )]
θθ
ci +−
+ − −1
1 17exp[ . ,
where
ai is the item discrimination, bi is the item difficulty, and ci is the probability of a correct response by a very low-scoring student.
For analysis of the CR items, the two-parameter partial credit (2PPC) model was used. The 2PPC model is a special case of Bock’s (1972) nominal model. Bock’s model states that the probability of an examinee with ability θ having a score (k –1) at the k-th level of the j-th item is

Copyright © 2007 by the New York State Education Department
50
jm
iji
jkjjk
mk
Z
ZkPP
jX K1,
)1(=)(
1=exp
exp| ==−=
∑θθ ,
where kjkjkj CAZ += θ . The mj denotes the number of score levels for the j-th item, and typically the highest score level is assigned (mj – 1) score points. For the special case of the 2PPC model used here, the following constraints were used: A kjk j= −α ( )1 , and
,1
0∑−
=
−=k
iijkjC γ
where γ j0 0= ,
where
αj and γji are the free parameters to be estimated from the data. Each item has (mj –1) independent γji parameters and one αj parameter; a total of mj parameters are estimated for each item.
Calibration Sample The cleaned classical analysis and calibration sample data (as described in Section V, subsection, “Classical Analysis and Calibration Sample Characteristics,”) was used for calibration and scaling of New York State ELA Tests. It should be noted that the scaling was done on nearly the total New York State population of students in public schools and exclusion of some cases during the data cleaning had very minimal or no effect on parameter estimation.
Calibration Process The IRT model parameters were estimated using CTB/McGraw-Hill’s PARDUX software (Burket, 2002). PARDUX estimates parameters simultaneously for MC and CR items using marginal maximum likelihood procedures implemented via the expectation-maximization (EM) algorithm (Bock and Aitkin, 1981; Thissen, 1982). Simulation studies have compared PARDUX with MULTILOG (Thissen, 1991), PARSCALE (Muraki and Bock, 1991), and BIGSTEPS (Wright and Linacre, 1992). PARSCALE, MULTILOG, and BIGSTEPS are among the most widely known and used IRT programs. PARDUX was found to perform at least as well as these other programs (Fitzpatrick, 1990; Fitzpatrick, 1994; Fitzpatrick and Julian, 1996). The NYSTP ELA Tests did not incur anything problematic during item calibration. The number of estimation cycles was set to 50 for all grades with convergence criterion of

Copyright © 2007 by the New York State Education Department
51
0.001 for all grades. The maximum value of a-parameter was set to 3.4, and range for b-parameter was set to be between -7.5 and 7.5. The maximum c-parameter value was set to 0.50. These are default parameters that have always been used for calibration of NYS test data. The estimated parameters were in the original theta metric, and all the items were well within the prescribed parameter ranges. It should be noted that there was a number of items with default value of c-parameter on the operational test. When the PARDUX program encounters difficulty estimating the c-parameter (guessing), it assigns a default c-parameter value of 0.200. These default values of c-parameter were obtained during the field test calibration and remained unchanged between field test and operational administrations. For the Grades 3–8 ELA Tests, all calibration estimation results are reasonable. The summary of calibration results is presented in Table 13. Table 13. NYSTP ELA 2007 Calibration Results
Grade Largest a- parameter
b-parameter Range
# Items with Default
c-parameter
Theta Mean
Theta Standard Deviation
# Students
3 2.348 -2.942 1.467 9 0.10 1.303 194958 4 2.738 -3.596 1.213 12 0.05 1.179 193715 5 2.559 -4.172 0.222 20 0.07 1.260 199583 6 2.310 -2.433 0.084 5 0.05 1.189 202937 7 3.030 -3.688 0.524 16 0.04 1.174 210218 8 2.118 -3.595 0.758 11 0.05 1.194 211425
Item-Model Fit Item fit statistics discern the appropriateness of using an item in the 3PL or 2PPC model. A procedure described by Yen (1981) was used to measure fit to the three-parameter model. Students are rank-ordered on the basis of θ̂ values and sorted into ten cells with 10% of the sample in each cell. For each item, the number of students in cell k who answered item i, Nik, and the number of students in that cell who answered item i correctly, Rik, were determined. The observed proportion in cell k passing item i, Oik, is Rik/Nik. The fit index for item i is
∑= −
−=
10
1 )(1)( 2
k ikik
ikikiki EE
EONQ1 ,
with
∑=ikN
kjji
ikik P
NE
cell
)ˆ(1ε
θ .
A modification of this procedure was used to measure fit to the two-parameter partial credit model. For the two-parameter partial credit model, Q1j was assumed to have approximately a chi-square distribution with the following degree of freedom:

Copyright © 2007 by the New York State Education Department
52
df = − −I m mj j( )1 ,
where
I is the total number of cells (usually 10) and mj is the possible number of score levels for item j.
To adjust for differences in degrees of freedom among items, Q1 was transformed to ZQ1
where 2/1)2/)(Z dfdfQ1Q (−= 1 . The value of Z still will increase with sample size, all else being equal. To use this standardized statistic to flag items for potential poor fit, it has been CTB/McGraw-Hill’s practice to vary the critical value for Z as a function of sample size. For the operational tests that have large calibration sample sizes, the criterion Crit1QZ used to flag items was calculated using the expression
4*1500
Z ⎟⎠⎞
⎜⎝⎛=
NCrit1Q
where
N is the calibration sample size.
Items were considered to have poor fit if the value of obtained ZQ1 was greater than the value of ZQ1 Bcritical. If the obtained ZQ1was less than ZQ1 Bcritical, the items were rated as having acceptable fit. It should be noted that all items in the NYSTP 2007 ELA Tests demonstrated good model fit, further supporting use of the chosen models. No items exhibited poor item-model fit statistics. These statistics are presented in Appendix F.
Local Independence In using IRT models, one of the assumptions made is that the items are locally independent. That is, a student’s response on one item is not dependent upon his or her response to another item. In other words, when a student’s ability is accounted for, his or her response to each item is statistically independent. One way to measure the statistical independence of items within a test is via the Q3 statistic (Yen, 1984). This statistic was obtained by correlating differences between students’ observed and expected responses for pairs of items after taking into account overall test performance. The Q3 for binary items was computed as

Copyright © 2007 by the New York State Education Department
53
( )ajjaja Pud θ̂23−≡ and
( )''3 , jjjj ddrQ = . The generalization to items with multiple response categories uses
jajaja Exd −≡ where
( ) ( )a
m
kjkaja
j
kPxEE θθ ˆˆ1
2∑=
=≡ .
If a substantial number of items in the test demonstrate local dependence, these items may need to be calibrated separately. All pairs of items with Q3 values greater than 0.20 were classified as locally dependent. The maximum value for this index is 1.00. The content of the flagged items was examined to identify possible sources of the local dependence. The Q3 statistics were examined on all ELA tests, and only one pair of items was found to be locally dependent. Grade 6 items 27 and 29 (both CR items) were found to be locally dependent (Q3 = 0.208). The magnitude of this statistic was not sufficient to warrant concern.
Scaling and Equating The 2007 Grades 3–8 ELA assessments were calibrated and equated to the associated 2006 assessments, using two separate equating procedures. In the first equating procedure, the new 2007 operational (OP) forms were pre-equated to the corresponding 2006 assessments. During this procedure the field test (FT) items administered in 2005 and 2006 (and eligible FT items from 2003 FT administration for Grades 4 and 8) were placed onto the 2006 baseline year scales in each grade. The equating of 2006 FT items to the 2006 OP scale was conducted via common examinees, and the equating of 2005 and 2003 FT items to the 2006 OP scale was conducted via common items contained in 2006 OP test and previous years field tests (for more details on equating of FT items to the 2006 OP scale, refer to New York State Testing Program 2006: English Language Arts Grades 3–8, page 56). This pool of FT items was used to select the 2007 OP test forms using the following criteria:
• Content coverage of each form matched the test blueprint • Psychometric properties of the items:
Copyright © 2007 by the New York State Education Department
54
o item fit (see subsection “Item-Model Fit”) o differential item functioning (see subsections “Differential Item Functioning” and “IRT DIF Statistics”) o item difficulty (see subsection “Item Difficulty and Response Distribution”) o item discrimination (see subsection “Point-Biserial Correlation Coefficient”) o omit rates (see subsection “Speededness”)
• Test characteristic curve (TCC) and standard error (SE) curve alignment of the 2007 forms with the target 2006 OP forms (note that the 2006 OP TCC and SE curves were based on OP parameters and the 2007 TCC and SE curves were based on FT parameters transformed to 2006 scale)
Although it was not possible to entirely avoid including flagged items in OP tests, the number of flagged items included in OP tests was small and content of all flagged items was carefully reviewed. In the second equating procedure, the 2007 ELA OP data were re-calibrated after the 2007 OP administration. FT parameters for all MC items in OP tests were used as anchors to transform the 2007 OP item parameters to 2006 scale. The CR items were not used as anchors in order to avoid potential error associated with rater effect. The MC items contained in the anchor sets were representative of the content of the entire test for each grade. The equating was performed using a test characteristic curve (TCC) method (Stocking and Lord, 1983). TCC methods find the linear transformation (M1 and M2) that transforms the original item parameter estimates to the scale score metric and minimizes the difference between the relationship between raw scores and ability estimates (i.e., TCC) defined by the FT form anchor item parameter estimates and that relationship defined by OP form anchor item parameter estimates. This places the transformed parameters for the OP test items onto the New York State OP scale.
In this procedure, new OP parameter estimates were obtained for all items. The a-parameters and b-parameters were allowed to be estimated freely while c-parameters of anchor items were fixed to their FT parameter values.
The relationships between the new and old linear transformation constants that are applied to the original ability metric parameters to place them onto the NYS scale via the Stocking and Lord method are presented below:
M1 = A* M1Ft M2 = A* M2Ft + B
where
M1 and M2 are the OP linear transformation constants from the Stocking and Lord (1983) procedure calculated to place the OP test items onto the NYS scale, and M1Ft and M2Ft are the transformation constants previously used to place the anchor item FT parameter estimates onto the NYS scale.

Copyright © 2007 by the New York State Education Department
55
The A and B values are derived from the input (FT) and estimate (OP) values of anchor items. Anchor input or FT values are known item parameter estimates entered into equating. Anchor estimate or OP values are parameter estimates for the same anchor items re-estimated during the equating procedure. The input and estimate anchor parameter estimates are expected to have similar values. The A and B constants are computed as follows:
Ft
Op
SDSD
A =
)( Ft
Ft
Op
OP MeanSDSD
MeanB −=
where
SDOp is the standard deviation of anchor estimates in scale score metric. SDFt is the standard deviation of anchor input values in scale score metric. MeanOp is the mean of anchor estimates in scale score metric. MeanFt is the mean of anchor input in scale score metric.
The M1 and M2 transformation parameters obtained in the Stocking and Lord equating process were used to transform item parameters obtained in a calibration process into the final scale-score metric. Table 14 presents the 2007 OP transformation parameters for New York State Grades 3–8 ELA Tests.
Table 14. NYSTP ELA 2007 Final Transformation Constants
Grade M1 M2
3 33.3759 665.5064 4 33.4081 664.8568 5 27.7291 664.2415 6 27.9956 660.2644 7 30.7297 654.4707 8 31.3153 653.8245
Anchor Item Security In order for an equating to accurately place the items and forms onto the operational scale, it is important to keep the anchor items secure and to reduce anchor item exposure to students and teachers. In the New York State Testing Program, different anchor sets are used each year to minimize item exposure that could adversely affect the accuracy of the equatings.

Copyright © 2007 by the New York State Education Department
56
Anchor Item Evaluation Anchor items were evaluated using several procedures. Procedures 1 and 2 evaluate the overall anchor set, while procedures 3, 4 and 5 evaluate individual anchor items.
1. Anchor set input and estimate TCC alignment. The overall alignment of TCCs for anchor set input and estimate was evaluated to determine the overall stability of anchor item parameters between FT and 2007 OP administration.
2. Correlations of anchor input and estimate of a- and b-parameters and p-values.
Correlations of anchor input and estimate of a- and b-parameters and p-values were evaluated for magnitude. Ideally, the correlations between anchor input and estimate for a-parameter should be at least 0.80 and correlation for b-parameter and p-value should be at least 0.90. Items contributing to lower than expected correlations were flagged.
3. Iterative linking using Stocking and Lord’s TCC method. This procedure, called
the TCC method, minimizes the mean squared difference between the two TCCs: one based on FT estimates and the other on transformed estimates from the 2007 OP calibration. The differential item performance was evaluated by examining previous (input) and transformed (estimated) item parameters. The items with absolute difference of parameters greater than two times the root mean square deviation were flagged.
4. Delta plots (differences in the standardized proportion correct value). The delta-
plot method relies on the differences in the standardized proportion correct value (p-value). P-values of the anchor items based on the FT (years 2003, 2005, and/or 2006) and the 2007 OP administration were calculated. The p-values were then converted to z-scores that correspond to the (1-p)th percentiles. A rule to identify outlier items that are functioning differentially between the two groups with respect to the level of difficulty is to draw perpendicular distance to the line-of-best-fit. The fitted line is chosen so as to minimize the sum of squared perpendicular distances of the points to the line. Items lying more than two standard deviations of the distance away from the fitted line are flagged as outliers.
5. Lord’s chi-square criterion. Lord’s χ2 criterion involves significance testing of
both item difficulty and discrimination parameters simultaneously for each item and evaluating the results based on the chi-square distribution table (for details see Divgi, 1985; Lord, 1980). If the null hypothesis that the item difficulty and discrimination parameters are equal is true, the item is not flagged for differential performance. If the null hypothesis is rejected and the observed value for χ2 is greater, than the critical χ2 value, the items are flagged for performance differences between the two item administrations.
Table 15 provides a summary of anchor item evaluation and item flags.

Copyright © 2007 by the New York State Education Department
57
Table 15. ELA Anchor Evaluation Summary
Anchor Input/ Estimate Correlation Flagged Anchors
G
rade
N
umbe
r of
Anc
hors
a-par b-par p-value
RMSD a-par
RMSD b-par Delta
Lord’s Chi-
Square 3 24 0.88 0.92 0.95 4, 14 13 22
4 28 0.72 0.86 0.92 25, 26, 28
25, 26, 27 27 25, 26, 27,
28 5 24 0.92 0.92 0.96 10 16 6 26 0.87 0.89 0.95 3 15, 23 7 30 0.82 0.93 0.97 5, 6 5, 9 5 5
8 26 0.56 0.74 0.91 8, 11 8, 11 11 5, 8, 11, 17
It should be noted that in all cases the overall TCC alignment for anchor set input and estimate was very good. The correlations for input and estimate p-values were over 0.90. Correlations for b-parameter input and estimate ranged from 0.74 for Grade 8 to 0.93 for Grade 7. Correlations for a-parameter input and estimate ranged from 0.56 for Grade 8 to 0.92 for Grade 5. An investigation of lower than expected correlations for Grade 8 revealed that items 7–11 displayed least stability between FT and OP administrations contributing to low anchor input and estimate correlation. This single aberrant passage was field tested in 2003, and several factors (including population change, curriculum changes, etc.) might have contributed to item parameter change between 2003 and 2007. However, this passage was not removed from the anchor set due to content coverage. Three out of five items in this passage measured critical analysis and evaluation standard, and removing them from the anchor set would have affected anchor set representation of the test blueprint. Also, a test run of Grade 8 equating without anchors 8 and 11 (flagged by multiple methods) revealed that there would be only a minimal impact of these items removal from the anchor set on the estimated parameters and no impact on scoring table and student scores. Because the overall anchor set TCC alignment were good (see Figures 1–6) and correlations between parameter input and estimates were satisfactory, despite the fact that some individual items were flagged by different methods in each grade, no anchors were removed from any of the anchor sets. Retaining all anchor items allowed for adequate anchor item content coverage and maintaining anchor set reliability.

Copyright © 2007 by the New York State Education Department
58
Figure 1. ELA Grade 3 Anchor Set and Whole Test TCC Alignment
Figure 2. ELA Grade 4 Anchor Set and Whole Test TCC Alignment.

Copyright © 2007 by the New York State Education Department
59
Figure 3. ELA Grade 5 Anchor Set and Whole Test TCC Alignment
Figure 4. ELA Grade 6 Anchor Set and Whole Test TCC Alignment

Copyright © 2007 by the New York State Education Department
60
Figure 5. ELA Grade 7 Anchor Set and Whole Test TCC Alignment
Figure 6. ELA Grade 8 Anchor Set and Whole Test TCC Alignment
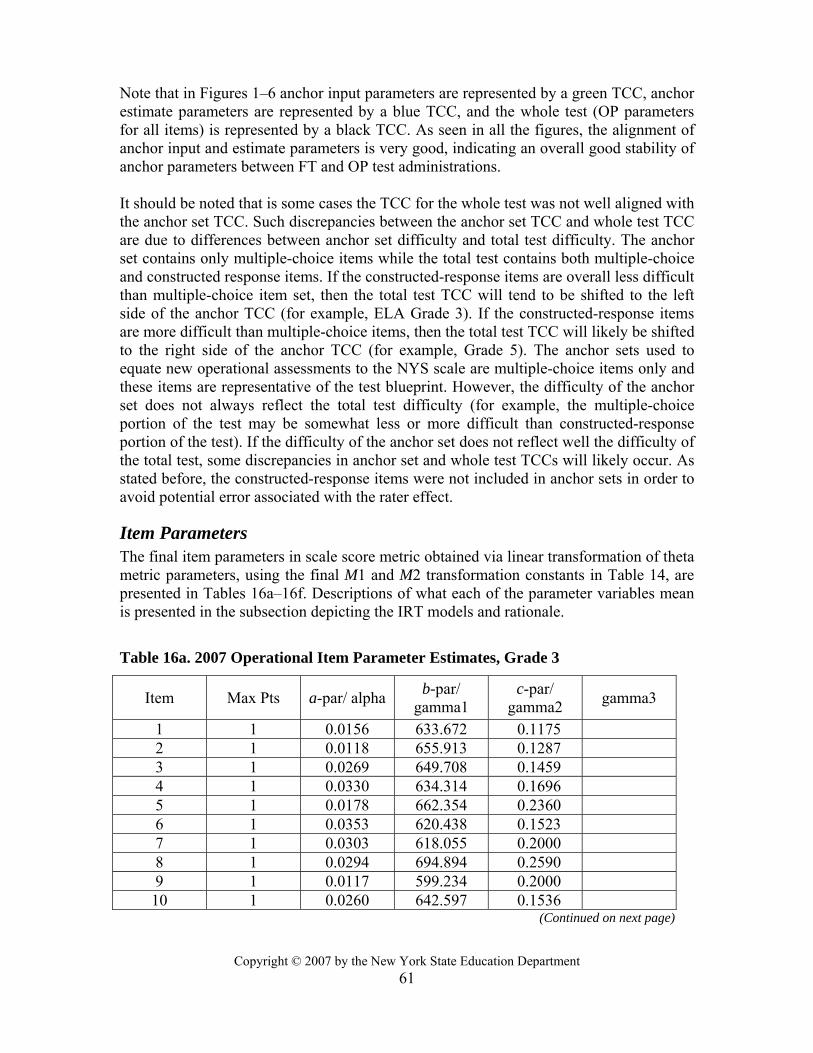
Copyright © 2007 by the New York State Education Department
61
Note that in Figures 1–6 anchor input parameters are represented by a green TCC, anchor estimate parameters are represented by a blue TCC, and the whole test (OP parameters for all items) is represented by a black TCC. As seen in all the figures, the alignment of anchor input and estimate parameters is very good, indicating an overall good stability of anchor parameters between FT and OP test administrations. It should be noted that is some cases the TCC for the whole test was not well aligned with the anchor set TCC. Such discrepancies between the anchor set TCC and whole test TCC are due to differences between anchor set difficulty and total test difficulty. The anchor set contains only multiple-choice items while the total test contains both multiple-choice and constructed response items. If the constructed-response items are overall less difficult than multiple-choice item set, then the total test TCC will tend to be shifted to the left side of the anchor TCC (for example, ELA Grade 3). If the constructed-response items are more difficult than multiple-choice items, then the total test TCC will likely be shifted to the right side of the anchor TCC (for example, Grade 5). The anchor sets used to equate new operational assessments to the NYS scale are multiple-choice items only and these items are representative of the test blueprint. However, the difficulty of the anchor set does not always reflect the total test difficulty (for example, the multiple-choice portion of the test may be somewhat less or more difficult than constructed-response portion of the test). If the difficulty of the anchor set does not reflect well the difficulty of the total test, some discrepancies in anchor set and whole test TCCs will likely occur. As stated before, the constructed-response items were not included in anchor sets in order to avoid potential error associated with the rater effect.
Item Parameters The final item parameters in scale score metric obtained via linear transformation of theta metric parameters, using the final M1 and M2 transformation constants in Table 14, are presented in Tables 16a–16f. Descriptions of what each of the parameter variables mean is presented in the subsection depicting the IRT models and rationale.
Table 16a. 2007 Operational Item Parameter Estimates, Grade 3
Item Max Pts a-par/ alpha b-par/ gamma1
c-par/ gamma2 gamma3
1 1 0.0156 633.672 0.1175 2 1 0.0118 655.913 0.1287 3 1 0.0269 649.708 0.1459 4 1 0.0330 634.314 0.1696 5 1 0.0178 662.354 0.2360 6 1 0.0353 620.438 0.1523 7 1 0.0303 618.055 0.2000 8 1 0.0294 694.894 0.2590 9 1 0.0117 599.234 0.2000 10 1 0.0260 642.597 0.1536
(Continued on next page)

Copyright © 2007 by the New York State Education Department
62
Table 16a. 2007 Operational Item Parameter Estimates, Grade 3 (cont.)
Item Max Pts a-par/ alpha b-par/ gamma1
c-par/ gamma2
gamma3
11 1 0.0243 626.083 0.2000 12 1 0.0343 627.781 0.2000 13 1 0.0248 636.924 0.2000 14 1 0.0414 648.384 0.2000 15 1 0.0289 637.623 0.1231 16 1 0.0245 685.076 0.1334 17 1 0.0295 638.502 0.1198 18 1 0.0344 627.014 0.1326 19 1 0.0220 631.790 0.1147 20 1 0.0314 621.861 0.1052 21 2 0.0319 20.949 20.3029 22 1 0.0231 590.628 0.2000 23 1 0.0193 635.233 0.2000 24 1 0.0131 617.120 0.2000 25 1 0.0199 671.437 0.2318 26 2 0.0349 20.012 21.1904 27 2 0.0201 12.804 11.6535 28 3 0.0276 17.206 16.7192 15.7135
Table 16b. 2007 Operational Item Parameter Estimates, Grade 4
Item Max Pts a-par/ alpha
b-par/ gamma1
c-par/ gamma2 Gamma3 gamma4
1 1 0.0316 620.984 0.2000 2 1 0.0248 621.044 0.2000 3 1 0.0234 629.991 0.2000 4 1 0.0156 614.347 0.2000 5 1 0.0197 618.928 0.2000 6 1 0.0414 613.812 0.1905 7 1 0.0351 623.891 0.1461 8 1 0.0336 610.116 0.1667 9 1 0.0429 618.895 0.1764 10 1 0.0371 621.741 0.1232 11 1 0.0203 646.649 0.1762 12 1 0.0232 666.228 0.2148 13 1 0.0295 655.041 0.1540
(Continued on next page)
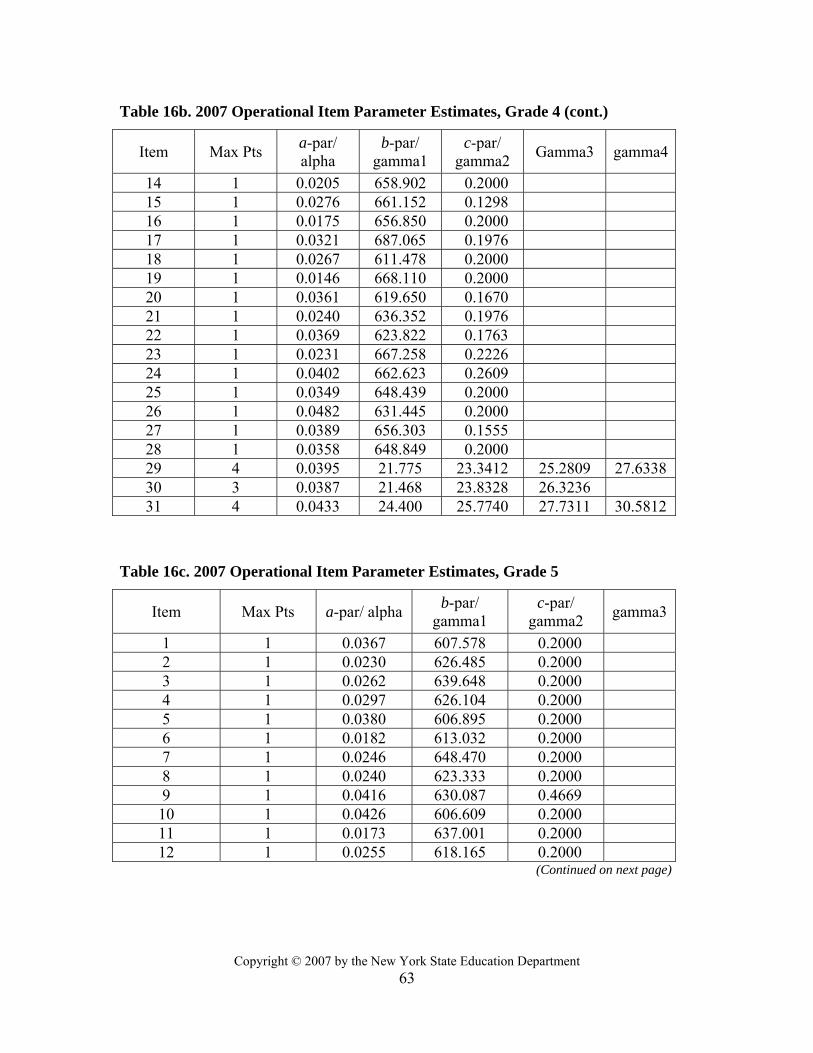
Copyright © 2007 by the New York State Education Department
63
Table 16b. 2007 Operational Item Parameter Estimates, Grade 4 (cont.)
Item Max Pts a-par/ alpha
b-par/ gamma1
c-par/ gamma2 Gamma3 gamma4
14 1 0.0205 658.902 0.2000 15 1 0.0276 661.152 0.1298 16 1 0.0175 656.850 0.2000 17 1 0.0321 687.065 0.1976 18 1 0.0267 611.478 0.2000 19 1 0.0146 668.110 0.2000 20 1 0.0361 619.650 0.1670 21 1 0.0240 636.352 0.1976 22 1 0.0369 623.822 0.1763 23 1 0.0231 667.258 0.2226 24 1 0.0402 662.623 0.2609 25 1 0.0349 648.439 0.2000 26 1 0.0482 631.445 0.2000 27 1 0.0389 656.303 0.1555 28 1 0.0358 648.849 0.2000 29 4 0.0395 21.775 23.3412 25.2809 27.6338 30 3 0.0387 21.468 23.8328 26.3236 31 4 0.0433 24.400 25.7740 27.7311 30.5812
Table 16c. 2007 Operational Item Parameter Estimates, Grade 5
Item Max Pts a-par/ alpha b-par/ gamma1
c-par/ gamma2 gamma3
1 1 0.0367 607.578 0.2000 2 1 0.0230 626.485 0.2000 3 1 0.0262 639.648 0.2000 4 1 0.0297 626.104 0.2000 5 1 0.0380 606.895 0.2000 6 1 0.0182 613.032 0.2000 7 1 0.0246 648.470 0.2000 8 1 0.0240 623.333 0.2000 9 1 0.0416 630.087 0.4669 10 1 0.0426 606.609 0.2000 11 1 0.0173 637.001 0.2000 12 1 0.0255 618.165 0.2000
(Continued on next page)

Copyright © 2007 by the New York State Education Department
64
Table 16c. 2007 Operational Item Parameter Estimates, Grade 5 (cont.)
Item Max Pts a-par/ alpha b-par/ gamma1
c-par/ gamma2
gamma3
13 1 0.0472 636.722 0.2000 14 1 0.0207 668.245 0.2000 15 1 0.0278 655.438 0.2314 16 1 0.0481 645.414 0.2000 17 1 0.0367 632.383 0.2000 18 1 0.0352 653.536 0.1343 19 1 0.0288 648.113 0.2000 20 1 0.0159 672.440 0.2000 21 2 0.0350 22.273 22.3976 22 1 0.0145 619.594 0.2000 23 1 0.0543 641.058 0.4685 24 1 0.0242 636.207 0.2000 25 1 0.0201 625.727 0.2000 26 2 0.0428 26.306 28.6227 27 3 0.0348 22.624 23.0431 24.2795
Table 16d. 2007 Operational Item Parameter Estimates, Grade 6
Item Max Pts
a-par/ alpha
b-par/ gamma1
c-par/ gamma2 gamma3 gamma4 gamma5
1 1 0.0205 636.020 0.1005 2 1 0.0279 633.179 0.1958 3 1 0.0156 607.378 0.2000 4 1 0.0272 638.904 0.1488 5 1 0.0257 662.179 0.1952 6 1 0.0485 632.042 0.3671 7 1 0.0208 657.049 0.2000 8 1 0.0226 639.723 0.2000 9 1 0.0217 661.575 0.1488 10 1 0.0349 624.121 0.1708 11 1 0.0267 640.490 0.1397 12 1 0.0262 615.226 0.1484 13 1 0.0284 640.210 0.1302 14 1 0.0276 612.747 0.2000 15 1 0.0317 626.734 0.1122 16 1 0.0384 649.551 0.1085 17 1 0.0303 618.656 0.2000
(Continued on next page)

Copyright © 2007 by the New York State Education Department
65
Table 16d. 2007 Operational Item Parameter Estimates, Grade 6 (cont.)
Item Max Pts
a-par/ alpha
b-par/ gamma1
c-par/ gamma2 gamma3 gamma4 gamma5
18 1 0.0362 625.073 0.1225 19 1 0.0311 648.504 0.2165 20 1 0.0263 653.315 0.1332 21 1 0.0418 626.031 0.1209 22 1 0.0332 625.135 0.1602 23 1 0.0333 647.188 0.0932 24 1 0.0360 631.290 0.1400 25 1 0.0439 632.106 0.1541 26 1 0.0323 638.215 0.1488 27 5 0.0432 24.262 25.5946 26.7502 28.3918 30.1999 28 3 0.0520 29.549 32.1104 34.8617 29 5 0.0443 25.061 26.7568 27.8970 29.4048 31.0019
Table 16e. 2007 Operational Item Parameter Estimates, Grade 7
Item Max Pts a-par/ alpha b-par/ gamma1
c-par/ gamma2 gamma3
1 1 0.0149 656.012 0.2000 2 1 0.0214 668.851 0.1195 3 2 0.0454 27.027 28.0133 4 1 0.0128 665.630 0.2000 5 1 0.0372 606.387 0.2758 6 1 0.0520 621.938 0.4257 7 1 0.0216 622.636 0.1997 8 1 0.0316 636.590 0.1540 9 1 0.0308 610.721 0.2000 10 1 0.0260 640.858 0.1652 11 1 0.0340 617.228 0.2000 12 1 0.0229 646.793 0.2000 13 1 0.0427 655.550 0.2310 14 1 0.0288 606.344 0.1415 15 1 0.0289 604.840 0.2000 16 1 0.0267 605.778 0.2000 17 1 0.0334 601.705 0.2000 18 1 0.0452 606.526 0.1570 19 1 0.0180 640.713 0.2000
(Continued on next page)
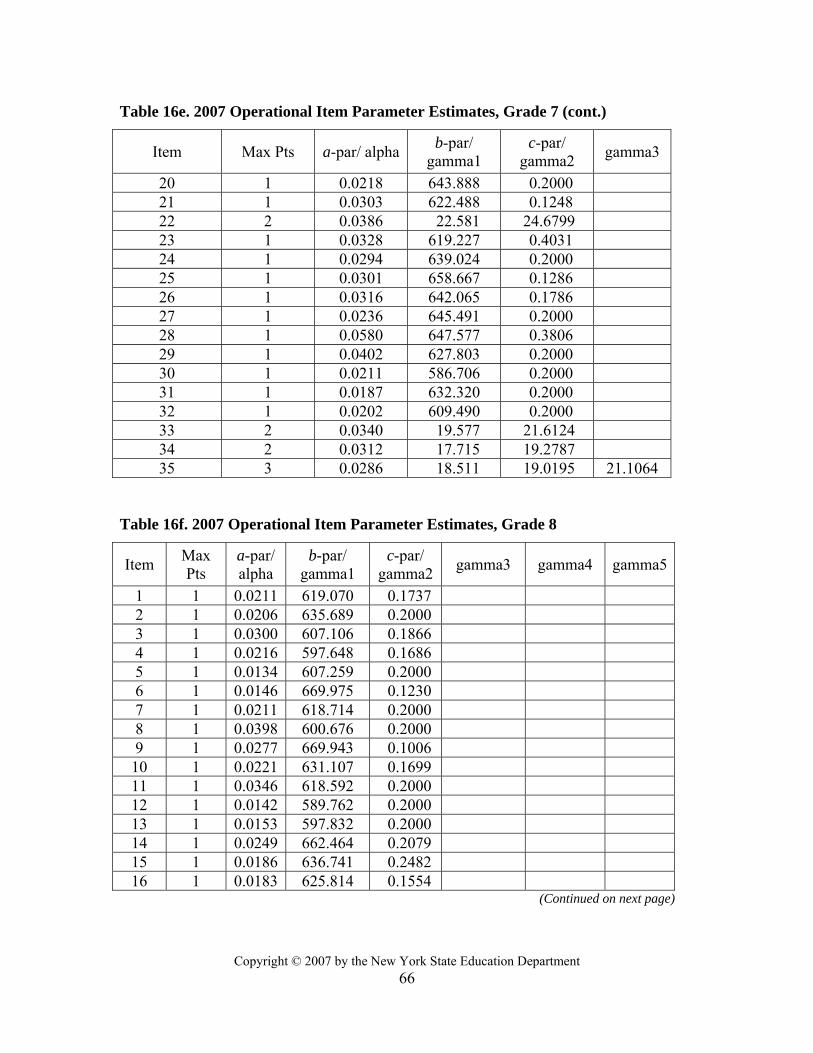
Copyright © 2007 by the New York State Education Department
66
Table 16e. 2007 Operational Item Parameter Estimates, Grade 7 (cont.)
Item Max Pts a-par/ alpha b-par/ gamma1
c-par/ gamma2 gamma3
20 1 0.0218 643.888 0.2000 21 1 0.0303 622.488 0.1248 22 2 0.0386 22.581 24.6799 23 1 0.0328 619.227 0.4031 24 1 0.0294 639.024 0.2000 25 1 0.0301 658.667 0.1286 26 1 0.0316 642.065 0.1786 27 1 0.0236 645.491 0.2000 28 1 0.0580 647.577 0.3806 29 1 0.0402 627.803 0.2000 30 1 0.0211 586.706 0.2000 31 1 0.0187 632.320 0.2000 32 1 0.0202 609.490 0.2000 33 2 0.0340 19.577 21.6124 34 2 0.0312 17.715 19.2787 35 3 0.0286 18.511 19.0195 21.1064
Table 16f. 2007 Operational Item Parameter Estimates, Grade 8
Item Max Pts
a-par/ alpha
b-par/ gamma1
c-par/ gamma2 gamma3 gamma4 gamma5
1 1 0.0211 619.070 0.1737 2 1 0.0206 635.689 0.2000 3 1 0.0300 607.106 0.1866 4 1 0.0216 597.648 0.1686 5 1 0.0134 607.259 0.2000 6 1 0.0146 669.975 0.1230 7 1 0.0211 618.714 0.2000 8 1 0.0398 600.676 0.2000 9 1 0.0277 669.943 0.1006 10 1 0.0221 631.107 0.1699 11 1 0.0346 618.592 0.2000 12 1 0.0142 589.762 0.2000 13 1 0.0153 597.832 0.2000 14 1 0.0249 662.464 0.2079 15 1 0.0186 636.741 0.2482 16 1 0.0183 625.814 0.1554
(Continued on next page)

Copyright © 2007 by the New York State Education Department
67
Table 16f. 2007 Operational Item Parameter Estimates, Grade 8 (cont.)
Item Max Pts
a-par/ alpha
b-par/ gamma1
c-par/ gamma2 gamma3 gamma4 gamma5
17 1 0.0248 601.313 0.2000 18 1 0.0197 632.305 0.2000 19 1 0.0179 604.232 0.1663 20 1 0.0209 606.888 0.1663 21 1 0.0209 616.778 0.2000 22 1 0.0305 649.712 0.1485 23 1 0.0210 642.031 0.1378 24 1 0.0246 632.759 0.2000 25 1 0.0197 614.767 0.1374 26 1 0.0305 608.257 0.1558 27 5 0.0566 31.428 33.3234 34.7002 36.3790 38.1052 28 3 0.0558 31.230 33.8540 36.9398 29 5 0.0595 33.267 35.5360 36.7662 38.3868 40.2734
Test Characteristic Curves
Test characteristic curves (TCCs) provide an overview of the test in IRT SS metric. The 2007 TCCs were generated using final OP item parameters for all test items. TCCs are the summation of all the item characteristic curves (ICCs), for items that contribute to the OP scale score. Standard error (SE) curves graphically show the amount of measurement error at different ability levels. The 2006 and 2007 TCCs and SE curves are presented in Figures 7–12. The 2006 curves are considered to be target curves for the 2007 test from TCCs. In subsequent years, following the adoption of the chain equating method by New York State, the TCCs for OP test forms will be compared to the previous year TCCs rather than to the baseline 2006 test from TCCs. In the chain equating method, the new test forms are equated to the previous year form and not a baseline form. This equating process generally will not affect the comparisons of impact results between adjacent test administrations. Note that in all figures the blue TCCs and SE curves represent 2006 OP test and pink TCCs and SE curves represent 2007 OP test.

Copyright © 2007 by the New York State Education Department
68
Figure 7. Grade 3 ELA 2006 and 2007 OP TCCs and SE
Figure 8. Grade 4 ELA 2006 and 2007 OP TCCs and SE

Copyright © 2007 by the New York State Education Department
69
Figure 9. Grade 5 ELA 2006 and 2007 OP TCCs and SE
Figure 10. Grade 6 ELA 2006 and 2007 TCCs and SE

Copyright © 2007 by the New York State Education Department
70
Figure 11. Grade 7 ELA 2006 and 2007 TCCs and SE
Figure 12. Grade 8 ELA 2006 and 2007 TCCs and SE

Copyright © 2007 by the New York State Education Department
71
As seen in Figures 7–12, good alignments of 2006 and 2007 TCCs and SE curves were found for Grades 3, 4, 7 and 8. The TCCs for Grade 5 were somewhat less well aligned at the upper end of the scale (indicating that the 2007 form tended to be slightly less difficult for higher-ability students), and the TCCs for Grade 6 were less well aligned at the upper and lower ends of ability scales (indicating that the 2007 test form tended to be slightly less difficult for higher-ability students and slightly more difficult for lower-ability students). Also, the SE curves for Grade 6 were not as well aligned for this grade at the lower end of ability scale as for other grades, indicating a higher standard error for low-ability students in 2007 compared to 2006. It should be noted, however, that potential differences in test form difficulty at different ability levels are accounted for in the equating and in the resulting raw-score to scale-score conversion tables, so that students of the same ability are expected to obtain the same scale score regardless of which form they took.
Scoring Procedure New York State students were scored using the number correct (NC) scoring method. This method considers how many score points a student obtained on a test in determining his or her score. That is, two students with the same number of score points on the test will receive the same score, regardless of which items they answered correctly. In this method, the number correct (or raw) score on the test is converted to a scale score by means of a conversion table. This traditional scoring method is often preferred for its conceptual simplicity and familiarity.
The final item parameters in scale score metric were used to produce raw-score to scale-score conversion tables for the Grades 3–8 ELA Tests. An inverse TCC method was employed. The scoring tables were created using CTB/McGraw-Hill’s proprietary FLUX program. The inverse of the TCC procedure produces trait values based on unweighted raw scores. These estimates show negligible bias for tests with maximum possible raw scores of at least 30 points. All New York State ELA Tests have a maximum raw score higher than 30 points. In the inverse TCC method, a student’s trait estimate is taken to be the trait value that has an expected raw score equal to the student’s observed raw score. It was found that for tests containing all MC items, the inverse of the TCC is an excellent first-order approximation to the number correct maximum likelihood estimates (MLE) showing negligible bias for tests of at least 30 items. For tests with a mixture of MC and CR items, the MLE and TCC estimates are even more similar (Yen, 1984).
The inverse of the TCC method relies on the following equation:
)~(11
θii
n
iii
n
iXEvxv
==Σ=Σ
where ix is a student’s observed raw score on item i.
iv is a non-optimal weight specified in a scoring process ( iv =1 if no weights are specified). θ~ is a trait estimate.

Copyright © 2007 by the New York State Education Department
72
Weighting Constructed-Response Items in Grades 4 and 8 Consistently with 2006 scoring procedures, a weight factor of 1.38 was applied to all CR items in Grades 4 and 8. The CR items were weighted in order to align proportions of raw score points obtainable from MC and CR items on 2007 and past ELA Grade 4 and 8 tests. Tables 17 and 18 present number of score points obtainable from MC and CR items on 2007 Grade 4 and 8 tests. The abbreviations describing CR items are as follows: R/W is Reading/Writing, L/W is Listening/Writing, and WM is Writing Mechanics. Target points (pts) refer to the number of test point obtainable from each standard as specified by the test blueprint. Target points percentage (pts %) refers to the proportion of test points obtainable from each content standard as specified in the test blueprint. It is desirable that the target and actual percentage of score points obtainable from content standards do not differ by more than 10%. CTB/McGraw-Hill’s content specialists’ goal is to restrict this difference to 5% or less. Table 17. ELA Grade 4 MC and CR Point Distribution in 2007 by Learning Standards
Standard MC pts
CR (R/W)
pts
CR (L/W)
pts
CR (WM)
pts
Total pts
Target pts
Total pts %
Target pts %
Total pts
WGT*
Total pts % WGT*
1 12 12 13 31 33 12 28 2 12 4 16 16 41 41 18 41 3 4 4 8 7 21 18 10 22 3 3 3 8 8 4 10
Totals 28 4 4 3 39 39 100 100 43 100 Note: WGT = weighted results Table 18. ELA Grade 8 MC and CR Point Distribution in 2007 by Learning Standards
Standard MC pts
CR (R/W)
pts
CR (L/W)
pts
CR (WM)
pts
Total pts
Target pts
Total pts %
Target pts %
Total pts
WGT*
Total pts % WGT*
1 8 5 13 14 33 36 15 34 2 14 14 14 36 36 14 32 3 4 5 9 8 23 21 11 25 3 3 3 8 8 4 9
Totals 26 5 5 3 39 39 100 100 44 100 Note: WGT = weighted results Weighting CR items in Grades 4 and 8 had no significant effect on the test blueprint (content). For both of the grades and all learning standards the difference between target percent and actual percent of score points measuring each standard was 5% or less. The inverse TCC scoring method was extended to incorporate weights for CR items for Grades 4 and 8 and non-optimal weights of 1.38 were specified for these items. It should be noted that if weights are applied, the statistical characteristics of the trait estimates (bias and standard errors) will depend on the weights that are specified and the statistical characteristics of the items.

Copyright © 2007 by the New York State Education Department
73
Raw-Score to Scale-Score and SEM Conversion Tables The scale score (SS) is the basic score for the New York State tests. It is used to derive other scores that describe test performance, such as the four performance levels and the standard-based performance index scores (SPIs). Scores on the NYSTP tests are determined using number correct scoring. Raw-score to scale-score conversion tables are presented in this section. Note that the lowest and highest obtainable scores for each grade were the same as in 2006. The standard error (SE) of a scale score indicates the precision with which the ability is estimated, and it inversely is related to the amount of information provided by the test at each ability level. The SE is estimated as follows:
( )( )θ
θI
SE 1ˆ =
where ( )θ̂SE is the standard error of the scale score (theta) and
( )θI is the amount of information provided by the test at a given ability level. It should be noted that the information is estimated based on thetas in SS metric; therefore, the SE is also expressed in scale score metric. It is also important to note that the SE value varies across ability levels and is the highest at the extreme ends of the scale where the amount of test information is typically the lowest. Table 19a. Grade 3 Raw Score to Scale Score (with Standard Error)
Raw Score Scale Score Standard Error 0 475 116 1 475 116 2 475 116 3 475 116 4 475 116 5 523 68 6 550 41 7 565 28 8 575 22 9 583 19 10 590 17 11 595 15 12 600 14 13 605 13 14 610 13
(Continued on next page)

Copyright © 2007 by the New York State Education Department
74
Table 19a. Grade 3 Raw Score to Scale Score (with Standard Error) (cont.)
Raw Score Scale Score Standard Error 15 614 12 16 618 12 17 622 12 18 626 11 19 630 11 20 634 11 21 638 11 22 643 11 23 647 12 24 652 12 25 657 12 26 662 13 27 668 14 28 675 15 29 684 17 30 694 19 31 708 23 32 732 33 33 780 73
Table 19b. Grade 4 Raw Score to Scale Score (with Standard Error)
Weighted Raw Score Scale Score Standard Error 0 430 149 1 430 149 2 430 149 3 430 149 4 430 149 5 430 149 6 511 68 7 536 43 8 550 31 9 561 26 10 569 22 11 577 19 12 583 17 13 589 16 14 594 14 15 599 13
(Continued on next page)

Copyright © 2007 by the New York State Education Department
75
Table 19b. Grade 4 Raw Score to Scale Score (with Standard Error) (cont.)
Weighted Raw Score Scale Score Standard Error 16 603 12 17 607 12 18 611 11 19 615 11 20 618 10 21 621 10 22 625 10 23 628 10 24 631 10 25 635 10 26 638 10 27 641 10 28 645 10 29 649 10 30 652 10 31 656 10 32 660 11 33 664 11 34 669 11 35 674 12 36 679 12 37 685 13 38 692 14 39 699 16 40 709 18 41 721 21 42 739 28 43 775 53
Table 19c. Grade 5 Raw Score to Scale Score (with Standard Error)
Raw Score Scale Score Standard Error 0 495 113 1 495 113 2 495 113 3 495 113 4 495 113 5 495 113 6 547 61 7 572 36
(Continued on next page)

Copyright © 2007 by the New York State Education Department
76
Table 19c. Grade 5 Raw Score to Scale Score (with Standard Error) (cont.)
Raw Score Scale Score Standard Error 8 585 24 9 594 19 10 601 16 11 607 14 12 612 13 13 617 12 14 621 11 15 626 11 16 630 10 17 634 10 18 638 10 19 641 10 20 645 10 21 649 10 22 654 10 23 658 11 24 663 11 25 669 12 26 675 13 27 683 15 28 692 17 29 705 21 30 727 30 31 795 93
Table 19d. Grade 6 Raw Score to Scale Score (with Standard Error)
Raw Score Scale Score Standard Error 0 480 106 1 480 106 2 480 106 3 480 106 4 480 106 5 529 57 6 551 34 7 564 25 8 574 20 9 582 17 10 588 15 11 594 14 12 599 12
(Continued on next page)

Copyright © 2007 by the New York State Education Department
77
Table 19d. Grade 6 Raw Score to Scale Score (with Standard Error) (cont.)
Raw Score Scale Score Standard Error 13 604 11 14 608 11 15 611 10 16 615 10 17 618 9 18 622 9 19 625 9 20 628 8 21 631 8 22 634 8 23 637 8 24 640 8 25 643 8 26 646 8 27 649 9 28 653 9 29 656 9 30 660 9 31 665 10 32 669 10 33 674 11 34 680 12 35 687 13 36 696 15 37 708 18 38 726 25 39 785 80
Table 19e. Grade 7 Raw Score to Scale Score (with Standard Error)
Raw Score Scale Score Standard Error 0 470 117 1 470 117 2 470 117 3 470 117 4 470 117 5 470 117 6 470 117 7 517 70 8 544 44 9 558 30
(Continued on next page)

Copyright © 2007 by the New York State Education Department
78
Table 19e. Grade 7 Raw Score to Scale Score (with Standard Error) (cont.)
Raw Score Scale Score Standard Error 10 568 23 11 575 19 12 582 16 13 587 14 14 592 13 15 596 12 16 600 12 17 604 11 18 608 11 19 611 10 20 614 10 21 618 10 22 621 10 23 624 10 24 628 10 25 631 10 26 634 10 27 638 10 28 641 10 29 645 10 30 649 10 31 653 10 32 657 11 33 662 11 34 667 12 35 673 13 36 680 15 37 688 17 38 700 20 39 716 25 40 745 37 41 790 65
Table 19f. Grade 8 Raw Score to Scale Score (with Standard Error)
Weighted Raw Score Scale Score Standard Error 0 430 136 1 430 136 2 430 136 3 430 136 4 430 136
(Continued on next page)

Copyright © 2007 by the New York State Education Department
79
Table 19f. Grade 8 Raw Score to Scale Score (with Standard Error) (cont.)
Weighted Raw Score Scale Score Standard Error 5 486 80 6 524 42 7 539 28 8 548 22 9 556 18 10 563 16 11 569 15 12 574 14 13 579 13 14 583 12 15 587 12 16 591 11 17 595 11 18 598 11 19 602 10 20 605 10 21 609 10 22 612 10 23 615 10 24 619 10 25 622 10 26 625 10 27 629 10 28 632 10 29 635 10 30 639 10 31 643 10 32 646 10 33 650 10 34 654 11 35 659 11 36 663 11 37 668 12 38 673 12 39 679 13 40 686 14 41 694 16 42 706 20 43 726 29 44 790 94

Copyright © 2007 by the New York State Education Department
80
Standard Performance Index The standard performance index (SPI) reported for each objective measured by the Grades 3–8 ELA Tests is an estimate of the percentage of a related set of appropriate items that the student could be expected to answer correctly. An SPI of 75 on an objective measured by a test means, for example, that the student could be expected to respond correctly to 75 out of 100 items that could be considered appropriate measures of that objective. Stated another way, an SPI of 75 indicates that the student would have a 75% chance of responding correctly to any item chosen at random from the hypothetical pool of all possible items that may be used to measure that objective.
Because objectives on all achievement tests are measured by relatively small numbers of items, CTB/McGraw-Hill’s scoring system looks not only at how many of those items the student answered correctly but at additional information as well. In technical terms, the procedure CTB/McGraw-Hill uses to calculate the SPI is based on a combination of item response theory (IRT) and Bayesian methodology. In non-technical terms, the procedure takes into consideration the number of items related to the objective that the student answered correctly, the difficulty level of those items, as well as the student’s performance on the rest of the test in which the objective is found. This use of additional information increases the accuracy of the SPI. Details on the SPI derivation procedure are provided in Appendix G.
For the 2007 Grades 3–8 ELA Tests, the performance on objectives was tied to the Level III cut score by computing the SPI target ranges. The expected SPI cuts were computed for the scale scores that are 1 standard error above and 1 standard error below the Level III cut (scale score of 650 for all grades). Table 20 presents the SPI target ranges. The objectives in this table are denoted as follows: 1—Information and Understanding, 2—Literary Response and Expression, and 3—Critical Analysis and Evaluation.
Table 20. SPI Target Ranges
Grade Objective # Items Total Points Level III Cut SPI Target Range
1 9 10 51–70 2 13 15 68–82 3 3 5 5 59–75 1 12 12 72–84 2 13 16 54–69 4 3 5 8 61–72 1 12 13 66–78 2 9 9 61–78 5 3 5 6 64–82 1 12 12 62–77 2 12 16 63–76 6 3 4 8 63–75
(Continued on next page)

Copyright © 2007 by the New York State Education Department
81
Table 20. SPI Target Ranges (cont.)
Grade Objective # Items Total Points Level III Cut SPI Target Range
1 16 16 66–81 2 14 14 73–83 7 3 4 8 77–87 1 9 13 69–82 2 14 14 70–80 8 3 5 9 66–79
The SPI is most meaningful in terms of its description of the student’s level of skills and knowledge measured by a given objective. The SPI increases the instructional value of test results by breaking down the information provided by the test into smaller, more manageable units. A total test score for a student in Grade 3 who scores below the average on the ELA test does not provide sufficient information of what specific type of problem the student may be having. On the other hand, this kind of information may be provided by the SPI. For example, evidence that the student has attained an acceptable level of knowledge in the content strand of Information and Understanding but has a low level of knowledge in Literary Response and Expression provides the teacher with a good indication of what type of educational assistance might be of greatest value to improving student achievement. Instruction focused on the identified needs of students has the best chance of helping those students increase their skills in the areas measured by the test. SPI reports provide students, parents, and educators the opportunity to identify and target specific areas within the broader content domain for improving student academic performance.
IRT DIF Statistics In addition to classical DIF analysis, an IRT-based Linn-Harnisch statistical procedure was used to detect DIF on the Grades 3–8 ELA Tests (Linn and Harnisch, 1981). In this procedure, item parameters (discrimination, location, and guessing) and the scale score (θ ) for each examinee were estimated for the three-parameter logistic model or the two-parameter partial credit model in the case of constructed-response items. The item parameters were based on data from the total population of examinees. Then the population was divided into NRC, gender, or ethnic groups, and the members in each group are sorted into 10 equal score categories (deciles) based upon their location on the scale score (θ ) scale. The expected proportion correct for each group based on the model prediction is compared to the observed (actual) proportion correct obtained by the group. The proportion of people in decile g who are expected to answer item i correctly is
,1 ∑=gj
ijg
ig PnPε
where ng is the number of examinees in decile g.

Copyright © 2007 by the New York State Education Department
82
To compute the proportion of students expected to answer item i correctly, over all deciles, for a group (e.g., African American) the formula is given by
Pn P
ni
g ig
g
g
g
.= =
=
∑
∑1
10
1
10.
The corresponding observed proportion correct for examinees in a decile (Oig) is the number of examinees in decile g who answered item i correctly divided by the number of students in the decile (ng). That is,
Ou
nig
ij
g
j g=∑ε ,
where uij is the dichotomous score for item i for examinee j.
The corresponding formula to compute the observed proportion answering each item correctly, over all deciles, for a complete ethnic group is given by
On O
ni
g ig
g
g
g
.= =
=
∑
∑1
10
1
10.
After the values are calculated for these variables, the difference between the observed proportion correct, for an ethnic group, and expected proportion correct can be computed. The decile group difference (Dig) for observed and expected proportion correctly answering item i in decile g is Dig = Oig – Pig , and the overall group difference (Di) between observed and expected proportion correct for item i in the complete group (over all deciles) is Di. = Oi. – Pi .

Copyright © 2007 by the New York State Education Department
83
These indices are indicators of the degree to which members of a specific subgroup perform better or worse than expected on each item. Differences for decile groups provide an index for each of the ten regions on the scale score (θ ) scale. The decile group difference (Dig) can be either positive or negative. When the difference (Dig) is greater than or equal to 0.100, or less than or equal to -0.100, the item is flagged for potential DIF. The following groups were analyzed using the IRT-based DIF analysis: Female, Male, Asian, Black/African American, Hispanic/Latino, White, High Needs districts (by NRC code), and Low Needs districts (by NRC code). As shown in Table 21, one item was flagged for DIF in the Grades 4, 6 and 7 tests, and two items were flagged in the Grade 5 test by the Linn-Harnisch method. No items were flagged for DIF in Grades 3 or 8. A detailed list of flagged items including DIF direction and magnitude is presented in Appendix E.
Table 21. Number of Items Flagged for DIF by the Linn-Harnisch Method
Grade Number of Flagged Items
4 1 5 2 6 1 7 1

Copyright © 2007 by the New York State Education Department
84
Section VII: Reliability and Standard Error of Measurement This section presents specific information on various test reliability statistics (RS) and standard errors of measurement (SEM), as well as the results from a study of performance level classification accuracy and consistency. The dataset for these studies includes all tested New York State public and charter school students who received valid scores. A study of inter-rater reliability was conducted by a vendor other than CTB/McGraw-Hill and is not included in this Technical Report.
Test Reliability Test reliability is directly related to score stability and standard error and, as such, is an essential element of fairness and validity. Test reliability can be directly measured with an alpha statistic, or the alpha statistic can be used to derive the SEM. For the Grades 3–8 ELA Tests, we calculated two types of reliability statistics: Cronbach’s alpha (Cronbach, 1951) and Feldt-Raju coefficient (Qualls, 1995). These two measures are appropriate for assessment of a test’s internal consistency when a single test is administered to a group of examinees on one occasion. The reliability of the test is then estimated by considering how well the items that reflect the same construct yield similar results (or how consistent the results are for different items for the same construct measured by the test). Both Cronbach’s alpha and Feldt-Raju coefficient measures are appropriate for tests of multiple-item formats (multiple choice and constructed response).
Reliability for Total Test Overall test reliability is a very good indication of each test’s internal consistency. Included in Table 22 are the case counts (N-count), number of test items (# Items), Cronbach’s alpha and associated SEM, and Feldt-Raju coefficient and associated SEM obtained for the total ELA tests. Table 22. ELA 3–8 Tests Reliability and Standard Error of Measurement
Grade N-count # Items
# RS points
Cronbach’s Alpha
SEM of Cronbach
Feldt-Raju coefficient
SEM of Feldt-Raju
3 200053 28 33 0.86 2.29 0.87 2.23 4 199587 31 39 0.89 2.34 0.90 2.24 5 203641 27 31 0.84 2.23 0.85 2.13 6 205341 29 39 0.88 2.45 0.89 2.29 7 213241 35 41 0.89 2.46 0.90 2.41 8 216141 29 39 0.86 2.55 0.89 2.31
All the coefficients for total test reliability are in the range of 0.84–0.90, which indicates high internal consistency. As expected, the lowest reliabilities were found for the shortest test (i.e., Grade 5), and the highest reliabilities were associated with the longer tests (Grades 4, 6, 7, and 8).
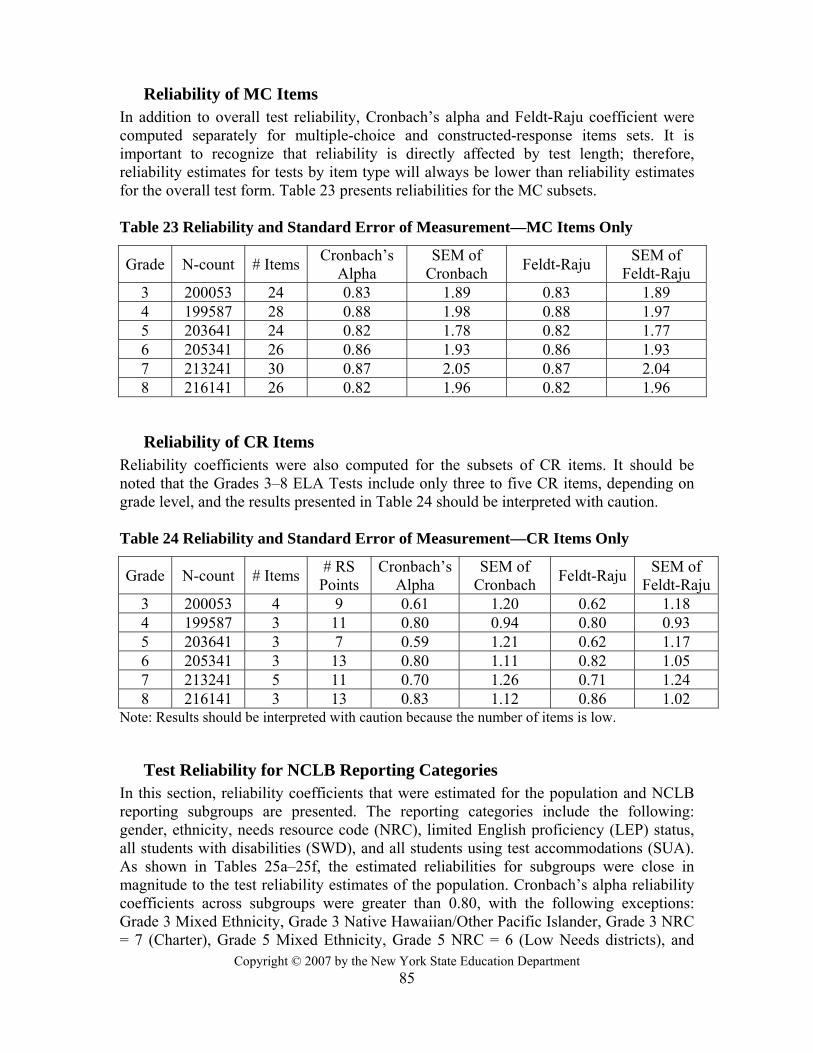
Copyright © 2007 by the New York State Education Department
85
Reliability of MC Items In addition to overall test reliability, Cronbach’s alpha and Feldt-Raju coefficient were computed separately for multiple-choice and constructed-response items sets. It is important to recognize that reliability is directly affected by test length; therefore, reliability estimates for tests by item type will always be lower than reliability estimates for the overall test form. Table 23 presents reliabilities for the MC subsets. Table 23 Reliability and Standard Error of Measurement—MC Items Only
Grade N-count # Items Cronbach’s Alpha
SEM of Cronbach Feldt-Raju SEM of
Feldt-Raju 3 200053 24 0.83 1.89 0.83 1.89 4 199587 28 0.88 1.98 0.88 1.97 5 203641 24 0.82 1.78 0.82 1.77 6 205341 26 0.86 1.93 0.86 1.93 7 213241 30 0.87 2.05 0.87 2.04 8 216141 26 0.82 1.96 0.82 1.96
Reliability of CR Items Reliability coefficients were also computed for the subsets of CR items. It should be noted that the Grades 3–8 ELA Tests include only three to five CR items, depending on grade level, and the results presented in Table 24 should be interpreted with caution. Table 24 Reliability and Standard Error of Measurement—CR Items Only
Grade N-count # Items # RS Points
Cronbach’s Alpha
SEM of Cronbach Feldt-Raju SEM of
Feldt-Raju3 200053 4 9 0.61 1.20 0.62 1.18 4 199587 3 11 0.80 0.94 0.80 0.93 5 203641 3 7 0.59 1.21 0.62 1.17 6 205341 3 13 0.80 1.11 0.82 1.05 7 213241 5 11 0.70 1.26 0.71 1.24 8 216141 3 13 0.83 1.12 0.86 1.02
Note: Results should be interpreted with caution because the number of items is low.
Test Reliability for NCLB Reporting Categories In this section, reliability coefficients that were estimated for the population and NCLB reporting subgroups are presented. The reporting categories include the following: gender, ethnicity, needs resource code (NRC), limited English proficiency (LEP) status, all students with disabilities (SWD), and all students using test accommodations (SUA). As shown in Tables 25a–25f, the estimated reliabilities for subgroups were close in magnitude to the test reliability estimates of the population. Cronbach’s alpha reliability coefficients across subgroups were greater than 0.80, with the following exceptions: Grade 3 Mixed Ethnicity, Grade 3 Native Hawaiian/Other Pacific Islander, Grade 3 NRC = 7 (Charter), Grade 5 Mixed Ethnicity, Grade 5 NRC = 6 (Low Needs districts), and

Copyright © 2007 by the New York State Education Department
86
Grade 5 NRC = 7 (Charter). Feldt-Raju reliability coefficients, which tend to be larger than the Cronbach alpha estimates for the same group, were all larger than 0.80 with the following exceptions: Grade 3 Mixed Ethnicity, Grade 5 Mixed Ethnicity, Grade 5 NRC = 6 (Low Needs districts), and Grade 5 NRC = 7 (Charter). All other test reliability alpha statistics were in the 0.81–0.92 range, indicating very good test internal consistency (reliability) for analyzed subgroups of examinees. Table 25a. Grade 3 Test Reliability by Subgroup
Group Subgroup N-count Cronbach’s Alpha
SEM of Cronbach
Feldt-Raju
SEM of Feldt-Raju
State All Students 200053 0.86 2.29 0.87 2.23 Female 97789 0.85 2.22 0.85 2.17 Gender Male 102264 0.86 2.35 0.87 2.29 Asian 14008 0.83 2.11 0.83 2.07
Black/African American 39439 0.84 2.51 0.85 2.45
Hispanic/Latino 41480 0.85 2.51 0.85 2.45 Native
American/ Alaskan Native
987 0.85 2.44 0.86 2.38
Mixed Ethnicity 124 0.79 2.27 0.80 2.23 Native Hawaiian/
Other Pacific Islander
82 0.80 2.15 0.82 2.08
Ethnicity
White 103933 0.84 2.11 0.85 2.06 New York City 72075 0.86 2.44 0.87 2.38
Big 4 Cites 8068 0.85 2.59 0.85 2.51 High Needs
Urban/Suburban 16052 0.85 2.39 0.86 2.34
High Needs Rural 11682 0.84 2.31 0.85 2.26
Average Needs 59395 0.84 2.15 0.84 2.10 Low Needs 30067 0.81 1.94 0.81 1.91
NRC
Charter 2117 0.80 2.40 0.81 2.36 SWD All Codes 25757 0.85 2.74 0.86 2.64 SUA All Codes 39244 0.84 2.72 0.85 2.63 LEP LEP = Y 15675 0.81 2.70 0.82 2.63
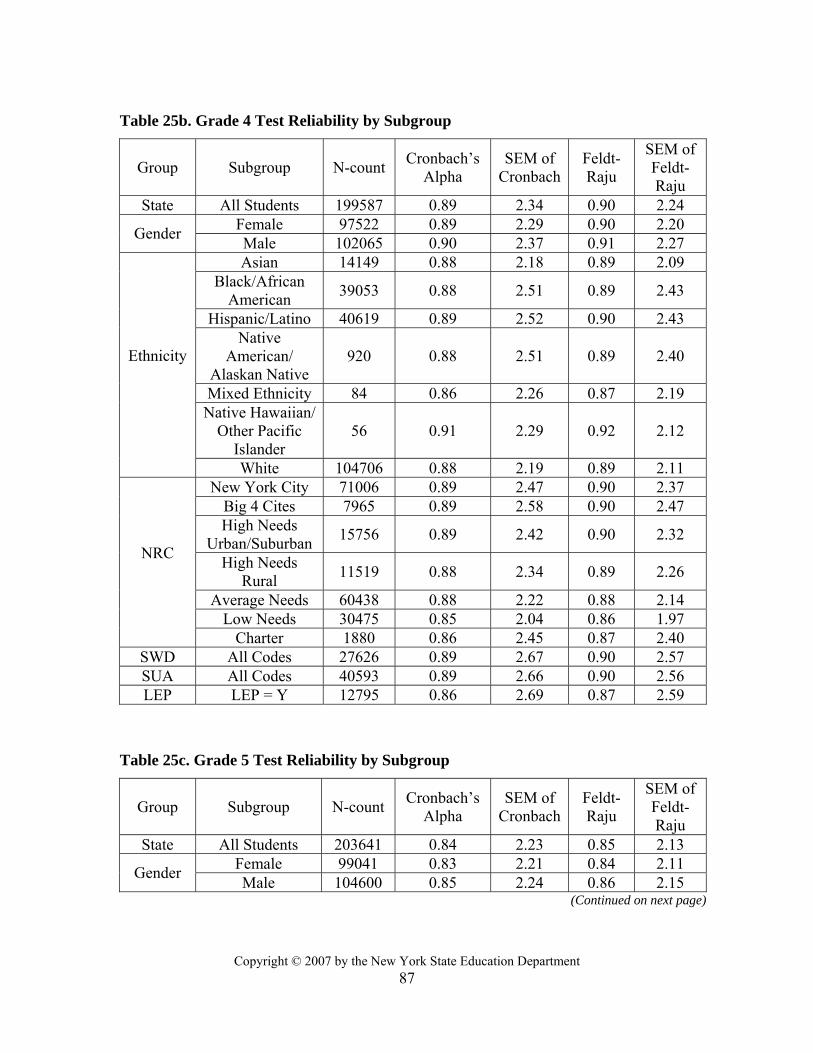
Copyright © 2007 by the New York State Education Department
87
Table 25b. Grade 4 Test Reliability by Subgroup
Group Subgroup N-count Cronbach’s Alpha
SEM of Cronbach
Feldt-Raju
SEM of Feldt-Raju
State All Students 199587 0.89 2.34 0.90 2.24 Female 97522 0.89 2.29 0.90 2.20 Gender Male 102065 0.90 2.37 0.91 2.27 Asian 14149 0.88 2.18 0.89 2.09
Black/African American 39053 0.88 2.51 0.89 2.43
Hispanic/Latino 40619 0.89 2.52 0.90 2.43 Native
American/ Alaskan Native
920 0.88 2.51 0.89 2.40
Mixed Ethnicity 84 0.86 2.26 0.87 2.19 Native Hawaiian/
Other Pacific Islander
56 0.91 2.29 0.92 2.12
Ethnicity
White 104706 0.88 2.19 0.89 2.11 New York City 71006 0.89 2.47 0.90 2.37
Big 4 Cites 7965 0.89 2.58 0.90 2.47 High Needs
Urban/Suburban 15756 0.89 2.42 0.90 2.32
High Needs Rural 11519 0.88 2.34 0.89 2.26
Average Needs 60438 0.88 2.22 0.88 2.14 Low Needs 30475 0.85 2.04 0.86 1.97
NRC
Charter 1880 0.86 2.45 0.87 2.40 SWD All Codes 27626 0.89 2.67 0.90 2.57 SUA All Codes 40593 0.89 2.66 0.90 2.56 LEP LEP = Y 12795 0.86 2.69 0.87 2.59
Table 25c. Grade 5 Test Reliability by Subgroup
Group Subgroup N-count Cronbach’s Alpha
SEM of Cronbach
Feldt-Raju
SEM of Feldt-Raju
State All Students 203641 0.84 2.23 0.85 2.13 Female 99041 0.83 2.21 0.84 2.11 Gender Male 104600 0.85 2.24 0.86 2.15
(Continued on next page)

Copyright © 2007 by the New York State Education Department
88
Table 25c. Grade 5 Test Reliability by Subgroup (cont.)
Group Subgroup N-count Cronbach’s Alpha
SEM of Cronbach
Feldt-Raju
SEM of Feldt-Raju
Asian 14365 0.82 2.10 0.84 2.01 Black/African
American 39404 0.83 2.37 0.84 2.29
Hispanic/Latino 41042 0.84 2.37 0.85 2.30 Native
American/ Alaskan Native
937 0.84 2.32 0.85 2.25
Mixed Ethnicity 96 0.74 2.25 0.76 2.17 Native Hawaiian/
Other Pacific Islander
81 0.85 2.14 0.86 2.03
Ethnicity
White 107716 0.81 2.09 0.82 2.01 New York City 72099 0.85 2.33 0.86 2.24
Big 4 Cites 7763 0.85 2.40 0.86 2.33 High Needs
Urban/Suburban 15761 0.84 2.30 0.85 2.22
High Needs Rural 11872 0.82 2.21 0.83 2.14
Average Needs 61541 0.81 2.12 0.82 2.04 Low Needs 31541 0.77 1.98 0.79 1.90
NRC
Charter 2514 0.79 2.36 0.80 2.30 SWD All Codes 29441 0.85 2.47 0.86 2.42 SUA All Codes 40149 0.85 2.47 0.85 2.41 LEP LEP = Y 10088 0.83 2.48 0.83 2.44
Table 25d. Grade 6 Test Reliability by Subgroup
Group Subgroup N-count Cronbach’s Alpha
SEM of Cronbach
Feldt-Raju
SEM of Feldt-Raju
State All Students 205341 0.88 2.45 0.89 2.29 Female 100462 0.87 2.39 0.89 2.25 Gender Male 104879 0.88 2.48 0.90 2.32 Asian 14170 0.88 2.29 0.89 2.13
Black/African American 39534 0.86 2.62 0.88 2.49
Hispanic/Latino 40495 0.87 2.65 0.88 2.50 Ethnicity
Native American/
Alaskan Native 1001 0.87 2.54 0.89 2.42
(Continued on next page)

Copyright © 2007 by the New York State Education Department
89
Table 25d. Grade 6 Test Reliability by Subgroup (cont.)
Group Subgroup N-count Cronbach’s Alpha
SEM of Cronbach
Feldt-Raju
SEM of Feldt-Raju
Mixed Ethnicity 107 0.86 2.50 0.87 2.34 Native Hawaiian/
Other Pacific Islander
63 0.87 2.47 0.89 2.27 Ethnicity
White 109971 0.86 2.30 0.88 2.15 New York City 70079 0.88 2.60 0.89 2.44
Big 4 Cites 7994 0.87 2.67 0.88 2.53 High Needs
Urban/Suburban 15998 0.87 2.52 0.89 2.38
High Needs Rural 12321 0.87 2.42 0.88 2.28
Average Needs 64050 0.86 2.32 0.87 2.18 Low Needs 31859 0.84 2.13 0.86 2.01
NRC
Charter 2431 0.85 2.49 0.86 2.40 SWD All Codes 28524 0.86 2.76 0.87 2.64 SUA All Codes 37865 0.86 2.77 0.87 2.64 LEP LEP = Y 8474 0.82 2.86 0.84 2.70
Table 25e. Grade 7 Test Reliability by Subgroup
Group Subgroup N-count Cronbach’s Alpha
SEM of Cronbach
Feldt-Raju
SEM of Feldt-Raju
State All Students 213241 0.89 2.46 0.90 2.41 Female 103465 0.88 2.40 0.89 2.34 Gender Male 109776 0.89 2.52 0.90 2.46 Asian 13981 0.89 2.30 0.90 2.24
Black/African American 42370 0.88 2.64 0.88 2.60
Hispanic/Latino 41590 0.89 2.63 0.90 2.58 Native
American/ Alaskan Native
1114 0.89 2.59 0.89 2.54
Mixed Ethnicity 78 0.82 2.42 0.83 2.35 Native Hawaiian/
Other Pacific Islander
57 0.89 2.45 0.89 2.36
Ethnicity
White 114051 0.86 2.32 0.87 2.27 (Continued on next page)

Copyright © 2007 by the New York State Education Department
90
Table 25e. Grade 7 Test Reliability by Subgroup (cont.)
Group Subgroup N-count Cronbach’s Alpha
SEM of Cronbach
Feldt-Raju
SEM of Feldt-Raju
New York City 73787 0.90 2.57 0.90 2.52 Big 4 Cites 9011 0.89 2.70 0.90 2.65 High Needs
Urban/Suburban 16430 0.89 2.57 0.89 2.52
High Needs Rural 13448 0.87 2.49 0.87 2.45
Average Needs 66758 0.86 2.36 0.87 2.31 Low Needs 31800 0.82 2.16 0.83 2.11
NRC
Charter 1374 0.86 2.60 0.86 2.55 SWD All Codes 29312 0.88 2.81 0.89 2.76 SUA All Codes 37781 0.89 2.81 0.89 2.75 LEP LEP = Y 7994 0.87 2.87 0.88 2.79
Table 25f. Grade 8 Test Reliability by Subgroup
Group Subgroup N-count Cronbach’s Alpha
SEM of Cronbach
Feldt-Raju
SEM of Feldt-Raju
State All Students 216141 0.86 2.55 0.89 2.31 Female 104951 0.86 2.46 0.88 2.25 Gender Male 111190 0.87 2.60 0.89 2.35 Asian 13787 0.87 2.42 0.89 2.17
Black/African American 43469 0.84 2.69 0.87 2.48
Hispanic/Latino 41626 0.85 2.74 0.88 2.49 Native
American/ Alaskan Native
1063 0.85 2.63 0.87 2.42
Mixed Ethnicity 59 0.87 2.53 0.89 2.31 Native Hawaiian/
Other Pacific Islander
61 0.85 2.40 0.87 2.22
Ethnicity
White 116076 0.84 2.35 0.86 2.17 New York City 75234 0.86 2.70 0.88 2.44
Big 4 Cites 8701 0.86 2.75 0.88 2.53 NRC High Needs Urban/Suburban 16608 0.86 2.61 0.88 2.40
(Continued on next page)

Copyright © 2007 by the New York State Education Department
91
Table 25f. Grade 8 Test Reliability by Subgroup (cont.)
Group Subgroup N-count Cronbach’s Alpha
SEM of Cronbach
Feldt-Raju
SEM of Feldt-Raju
High Needs Rural 13525 0.84 2.51 0.86 2.33
Average Needs 68410 0.84 2.37 0.86 2.20 Low Needs 31761 0.81 2.14 0.84 2.01
NRC
Charter 1150 0.83 2.59 0.85 2.41 SWD All Codes 29098 0.84 2.82 0.86 2.64 SUA All Codes 38608 0.85 2.85 0.87 2.64
Standard Error of Measurement The standard errors of measurement (SEM), as computed from Cronbach’s alpha and the Feldt-Raju reliability statistics, are presented in Table 22. SEMs ranged 2.13–2.41, which is reasonable and small. In other words, the error of measurement from the observed test score ranged from approximately +/-2–3 raw score points. SEMs are directly related to reliability: the higher the reliability, the lower the standard error. As discussed, the reliability of these tests is relatively high, so it was expected that the SEMs would be very low. The SEMs for subpopulations, as computed from Cronbach’s alpha and the Feldt-Raju reliability statistics, are presented in Tables 25a–25f. The SEMs associated with all reliability estimates for all subpopulations are in the range of 1.97–2.79, which is acceptably close to those for the entire population. This narrow range indicates that across the Grades 3–8 ELA Tests, all students’ test scores are reasonably reliable with minimal error.
Performance Level Classification Consistency and Accuracy This subsection describes the analyses conducted to estimate performance level classification consistency and accuracy for the Grades 3–8 ELA Tests. In other words, this provides statistical information on the classification of students into the four performance categories. Classification consistency refers to the estimated degree of agreement between examinees’ performance classification from two independent administrations of the same test (or two parallel forms of the test). Because obtaining test scores from two independent administrations of New York State tests was not feasible due to item release after each administration, a psychometric model was used to obtain the estimated classification consistency indices using test scores from a single administration. Classification accuracy can be defined as the agreement between the actual classifications using observed cut scores and true classifications based on known true cut scores (Livingston and Lewis, 1995). In conjunction with measures of internal consistency, classification consistency is an important type of reliability and is particularly relevant to high stakes pass/fail tests. As a

Copyright © 2007 by the New York State Education Department
92
form of reliability, classification consistency represents how reliably students can be classified into performance categories. Classification consistency is most relevant for students whose ability is near the pass/fail cut score. Students whose ability is far above or far below the value established for passing are unlikely to be misclassified because repeated administration of the test will nearly always result in the same classification. Examinees whose true scores are close to the cut score are a more serious concern. These students’ true scores will likely lie within the SEM of the cut score. For this reason, the measurement error at the cut scores should be considered when evaluating the classification consistency of a test. Furthermore, the number of students near the cut scores should also be considered when evaluating classification consistency; these numbers show the number of students who are most likely to be misclassified. Scoring tables with SEMs are located in Section VI, “IRT Scaling and Equating,” and student scale score frequency distributions are located in Appendix I. Classification consistency and accuracy were estimated using the IRT procedure suggested by Lee, Hanson, and Brennan (2002) and Wang, Kolen, and Harris (2000). Appendix H includes a description of the calculations and procedure based on the paper by Lee et al. (2002).
Consistency The results for classifying students into four performance levels are separated from results based solely on the Level III cut. Tables 26 and 27 include case counts (N-count), classification consistency (Agreement), classification inconsistency (Inconsistency), and Cohen’s kappa (Kappa). Consistency indicates the rate which a second administration would yield the same performance category designation (or a different designation for the inconsistency rate). The agreement index is a sum of the diagonal element in the contingency table. The inconsistency index is equal to 1- agreement index. Kappa is a measure of agreement corrected for chance. Table 26 depicts the consistency study results based on the range of performance levels for all grades. Overall, between 71% and 77% of students were estimated to be classified consistently to one of the four performance categories. The coefficient kappa, which indicates the consistency of the placement in the absence of chance, ranged 0.54–0.62. Table 26. Decision Consistency (All Cuts)
Grade N-count Agreement Inconsistency Kappa 3 194958 0.7107 0.2893 0.5398 4 193715 0.7620 0.2380 0.6015 5 199583 0.7342 0.2658 0.5483 6 202937 0.7684 0.2316 0.6202 7 210218 0.7464 0.2536 0.5911 8 211425 0.7608 0.2392 0.6128

Copyright © 2007 by the New York State Education Department
93
Table 27 depicts the consistency study results based on two performance levels (passing and not passing) as defined by the Level III cut. Overall, about 86%–89% of the classifications of individual students are estimated to remain stable with a second administration. Kappa coefficients for classification consistency based on one cut ranged 0.68–0.74.
Table 27. Decision Consistency (Level III Cut)
Grade N-count Agreement Inconsistency Kappa 3 194958 0.8711 0.1289 0.7048 4 193715 0.8875 0.1125 0.7398 5 199583 0.8618 0.1382 0.6841 6 202937 0.8763 0.1237 0.7349 7 210218 0.8605 0.1395 0.7144 8 211425 0.8637 0.1363 0.7219
Accuracy The results of classification accuracy are presented in Table 28. Included in the table are case counts (N-count), classification accuracy (Accuracy) for all performance levels (All Cuts) and for the Level III (meeting learning standards) cut score as well as “false positive” and “false negative” rates for both scenarios. It is always the case that the accuracy of the Level III cut score exceeds the accuracy referring to the entire set of cut scores, because there are only two categories for the true variable to be located in, instead of four. The accuracy rates indicate that the categorization of a student’s observed performance is in agreement with the location of their true ability approximately 78%–83% of the time across all performance levels, and approximately 90% of the time in regards to the Level III cut score. Table 28. Decision Agreement (Accuracy)
Accuracy
Grade
N-count All Cuts False
Positive (All Cuts)
False Negative (All Cuts)
Level III Cut
False Positive
(Level III Cut)
False Negative (Level III
Cut) 3 194958 0.7844 0.1432 0.0724 0.9080 0.0469 0.0451 4 193715 0.8244 0.1223 0.0534 0.9169 0.0527 0.0305 5 199583 0.8043 0.1374 0.0583 0.8972 0.0639 0.0389 6 202937 0.8307 0.1165 0.0528 0.9090 0.0575 0.0335 7 210218 0.8125 0.1324 0.0550 0.8980 0.0625 0.0395 8 211425 0.8227 0.1142 0.0630 0.9033 0.0485 0.0482

Copyright © 2007 by the New York State Education Department
94
Section VIII: Summary of Operational Test Results This section summarizes the distribution of operational scale score results on the New York State 2007 Grades 3–8 ELA Tests. These include the scale score means, standard deviations, percentiles and performance level distributions for each grade’s population and specific subgroups. Gender, ethnic identification, needs resource code (NRC), limited English proficiency (LEP), students with disabilities (SWD), and students using test accommodations (SUA) variables were used to calculate the results of subgroups required for federal reporting and test equity purposes. Data include examinees with valid scores from all public and charter schools. Note that complete scale score frequency distribution tables are located in Appendix I.
Scale Score Distribution Summary Scale score distribution summary tables are presented and discussed in Tables 29–35. In Table 29, scale score statistics for total populations of students from public and charter schools are presented. In Tables 30–35, scale score statistics are presented for selected subgroups in each grade level. Some general observations: Females outperformed Males; Asian and White ethnicities outperformed their peers from other ethnic groups; students from Low Needs and Average Needs districts (as identified by NRC) outperformed students from other districts (New York City, Big 4 Cities, Urban/Suburban, Rural, and Charter); and students with LEP, SWD and/or SUA achieved below the State aggregate (All Students) in every percentile. This pattern of achievement was consistent across all grades. Table 29. ELA Grades 3–8 Scale Score Distribution Summary
Grade N-count SS Mean
SS Std Dev
10th %tile
25th %tile
50th
%tile 75th
%tile 90th
%tile 3 198320 666.99 42.23 618 643 668 694 708 4 197306 664.70 39.52 618 641 664 685 709 5 201841 665.39 37.98 626 645 663 683 705 6 204237 661.47 33.98 622 640 660 680 696 7 211545 654.84 38.23 611 634 657 680 700 8 213676 655.39 39.32 612 632 654 679 706
Grade 3 Scale score statistics and N-counts of demographic groups for Grade 3 are presented in Table 30. The population scale score mean was 666.99 with a standard deviation of 42.23. By gender subgroup, Females outperformed Males, but the difference was less than nine scale score points. Asian, Mixed Ethnicity, Native Hawaiian/Other Pacific Islander and White students’ scale score means exceeded the average scale score, as did students from Low Needs and Average Needs districts. Among all ethnic groups the Asian ethnic group had the highest average scale score mean (678.56). Students from the Big 4 Cities achieved a lower scale score mean than their peers from schools with other

Copyright © 2007 by the New York State Education Department
95
NRC designations and about a half of standard deviation below the population mean. SWD, SUA, and LEP subgroups scored, on average, approximately one standard deviation below the mean scale score for the population. The SWD subgroup, which had a scale score mean about 39 scale score units below the population mean, was the lowest performing group analyzed. At the 50th percentile, the following groups exceeded the population score of 668: Asian (675), Native Hawaiian/Other Pacific Islander (675), White (675), Average Needs districts (675), and Low Needs districts (684). Table 30. Scale Score Distribution Summary, by Subgroup, Grade 3
Demographic Category (Subgroup)
N-count
SS
Mean
SS Std
Dev
10th
%tile
25th
%tile
50th
%tile
75th
%tile
90th
%tile State All Students 198320 666.99 42.23 618 643 668 694 708
Female 97002 671.14 41.27 622 647 668 694 732 Gender Male 101318 663.02 42.75 614 638 662 684 708 Native
American/Alaskan Native
985 656.17 38.29 610 634 657 675 708
Asian 13880 678.56 40.04 634 652 675 694 732 Black/African
American 38891 650.49 38.37 610 630 652 675 694
Hispanic/ Latino 41403 650.13 38.85 605 626 652 675 694
Mixed Ethnicity 122 669 37.46 630 643 662 694 708 Native
Hawaiian/Other Pacific Islander
82 677.81 37.13 634 657 675 708 732
Ethnicity
White 102957 678.53 40.86 630 652 675 708 732 New York City 71137 655.91 41.66 610 630 657 675 708
Big 4 Cities 8023 644.26 38.65 600 622 643 668 694 High Needs
Urban/Suburban 15928 659.64 39.60 614 634 657 684 708
High Needs Rural 11566 664.41 38.64 618 643 662 684 708
Average Needs 59076 675.77 39.83 630 652 675 694 732 Low Needs 29876 688.29 39.19 643 662 684 708 732
NRC
Charter 2117 658.07 33.28 618 638 657 675 694 LEP LEP = Y 15675 634.11 34.46 595 618 634 657 675 SWD All Codes 25625 628.04 42.04 583 605 630 652 675 SUA All Codes 38992 631.75 38.61 590 610 634 657 675
Grade 4 Scale score statistics and N-counts of demographic groups for Grade 4 are presented in Table 31. The Grade 4 population (All Students) mean was 664.70, with a standard deviation of 39.52. By gender subgroup, Females outperformed Males, but the difference

Copyright © 2007 by the New York State Education Department
96
was less than nine scale score points. Asian, Mixed Ethnicity, Native Hawaiian/Other Pacific Islander, and White students’ scale score means exceeded the average scale score, as did students from Low Needs and Average Needs districts. Among all ethnic groups, the Asian ethnic group had the highest average scale score mean (677.38). Students from the Big 4 Cities achieved a lower scale score mean than their peers from schools with other NRC designations and about a half of standard deviation below the population mean. The SWD subgroup had a scale score mean nearly 40 scale score units (more than a standard deviation) below the population mean and were at or below the scale score of any given percentile for any other subgroup. At the 50th percentile, the following groups exceeded the population score of 664: Female (669), Asian (679), Native Hawaiian/Other Pacific Islander (679), White (674), Average Needs districts (674), and Low Needs districts (685). Table 31. Scale Score Distribution Summary, by Subgroup, Grade 4
Demographic Category (Subgroup)
N-count
SS
Mean
SS Std
Dev
10th
%tile
25th
%tile
50th
%tile
75th
%tile
90th
%tile State All Students 197306 664.70 39.52 618 641 664 685 709
Female 96426 669.19 38.52 625 649 669 692 721 Gender Male 100880 660.42 39.99 615 641 664 685 699 Native
American/Alaskan Native
915 651.93 36.46 607 631 652 674 692
Asian 14092 677.38 37.29 635 656 679 699 721 Black/African
American 38231 649.55 37.22 607 631 652 674 692
Hispanic/Latino 40412 648.26 38.69 603 628 652 669 692 Mixed Ethnicity 83 668.52 30.28 631 649 664 692 709
Native Hawaiian/Other Pacific Islander
54 674.35 41.64 621 649 679 699 721
Ethnicity
White 103519 675.10 36.83 635 656 674 692 721 New York City 70010 653.75 40.07 607 635 656 679 699
Big 4 Cities 7842 644.75 39.55 599 625 649 669 692 High Needs
Urban/Suburban 15474 657.62 38.25 611 638 660 679 699
High Needs Rural 11383 662.78 35.75 621 645 664 685 699
New York City 70010 653.75 40.07 607 635 656 679 699 Big 4 Cities 7842 644.75 39.55 599 625 649 669 692
NRC
High Needs Urban/Suburban 15474 657.62 38.25 611 638 660 679 699
(Continued on next page)

Copyright © 2007 by the New York State Education Department
97
Table 31. Scale Score Distribution Summary, by Subgroup, Grade 4 (cont.)
Demographic Category (Subgroup)
N-count
SS
Mean
SS Std
Dev
10th
%tile
25th
%tile
50th
%tile
75th
%tile
90th
%tile High Needs
Rural 11383 662.78 35.75 621 645 664 685 699
Average Needs 59829 672.59 35.83 631 652 674 692 709 Low Needs 30341 685.21 34.50 649 664 685 699 721
NRC
Charter 1880 655.47 32.73 618 635 656 674 692 LEP LEP = Y 12794 625.91 38.40 583 607 631 649 664 SWD All Codes 27483 624.98 43.74 577 603 631 652 674 SUA All Codes 40260 628.31 41.52 583 607 635 656 674
Grade 5 Scale score summary statistics for Grade 5 students are in Table 32. Overall, the scale score mean was 665.39, with a standard deviation of 37.98. The difference between mean scale scores by gender groups was very small (less than four scale score units). Asian, Native Hawaiian/Other Pacific Islander and White students’ scale score means exceeded the population mean scale score, as did students from Low Needs and Average Needs districts. Among all ethnic groups the White ethnic group had the highest average scale score mean (675.42). The students from the Big 4 Cities scored below their peers from schools with other NRC designations and about a half of standard deviation below the population mean. SWD, SUA, and LEP subgroups scored approximately one standard deviation below the mean scale score for the population. The LEP subgroup, which had a scale score mean slightly more than forty-two scale score units below the population mean, was the lowest performing group analyzed. At the 50th percentile, the following groups exceeded the population score of 663: Female (669), Asian (675), Native Hawaiian/Other Pacific Islander (669), White (675), Average Needs districts (669), and Low Needs districts (683).
Table 32. Scale Score Distribution Summary, by Subgroup, Grade 5
Demographic Category (Subgroup)
N-count
SS
Mean
SS Std
Dev
10th
%tile
25th
%tile
50th
%tile
75th
%tile
90th
%tile State All Students 201841 665.39 37.98 626 645 663 683 705
Female 98258 667.86 37.15 630 649 669 683 705 Gender Male 103583 663.06 38.59 621 645 663 683 705 Native
American/Alaskan Native
932 654.62 34.53 617 638 658 675 692 Ethnicity
Asian 14301 675.16 37.77 638 654 675 692 727 (Continued on next page)

Copyright © 2007 by the New York State Education Department
98
Table 32. Scale Score Distribution Summary, by Subgroup, Grade 5 (cont.)
Demographic Category (Subgroup)
N-count
SS
Mean
SS Std
Dev
10th
%tile
25th
%tile
50th
%tile
75th
%tile
90th
%tile Native
American/Alaskan Native
932 654.62 34.53 617 638 658 675 692
Asian 14301 675.16 37.77 638 654 675 692 727 Black/African
American 38906 651.34 34.05 617 634 654 669 692
Hispanic/Latino 40925 649.44 36.51 612 634 654 669 692 Mixed Ethnicity 96 664.65 32.02 626 645 658 683 692
Native Hawaiian/Other Pacific Islander
79 671.44 38.62 630 649 669 692 727
Ethnicity
White 106602 675.42 36.16 638 658 675 692 705 New York City 71293 655.58 38.24 617 638 654 675 692
Big 4 Cities 7688 645.60 37.59 607 630 649 669 683 High Needs
Urban/Suburban 15609 658.43 35.62 621 641 658 675 692
High Needs Rural 11736 664.29 33.97 626 645 663 683 705
Average Needs 61177 672.93 35.01 638 654 669 692 705 Low Needs 31275 683.27 35.37 649 663 683 705 727
NRC
Charter 2514 655.09 28.88 621 638 654 669 692 LEP LEP = Y 10087 622.86 38.78 572 607 630 645 663 SWD All Codes 29196 631.11 39.49 585 612 638 654 669 SUA All Codes 39724 632.38 38.81 585 617 638 654 675
Grade 6 Scale score summary statistics for Grade 6 students are in Table 33. The scale score mean was 661.47, with a standard deviation of 33.98. The difference between mean scale scores by gender groups was about one-quarter of a standard deviation. Asian, Mixed Ethnicity, Native Hawaiian/Other Pacific Islander, and White students’ scale score means exceeded the population mean scale score, as did students from Low Needs and Average Needs districts. Among all ethnic groups the Asian ethnic group had the highest average scale score mean (673.50). The students from the Big 4 Cities scored below their peers from schools with other NRC designations and about a half of standard deviation below the population mean. SWD, SUA, and LEP subgroups scored over one standard deviation below the mean scale score for the population. The LEP subgroup, which had a scale score mean slightly more than forty scale score units below the population mean, was the lowest performing group analyzed. At the 50th percentile, the following groups exceeded the population score of 660: Female (665), Asian (669), Native Hawaiian/Other Pacific

Copyright © 2007 by the New York State Education Department
99
Islander (665), White (669), Average Needs districts (669), and Low Needs districts (674). Table 33. Scale Score Distribution Summary, by Subgroup, Grade 6
Demographic Category (Subgroup)
N-count
SS
Mean
SS Std
Dev
10th
%tile
25th
%tile
50th
%tile
75th
%tile
90th
%tile State All Students 204237 661.47 33.98 622 640 660 680 696
Female 99986 665.68 34.23 628 646 665 687 708 Gender Male 104251 657.43 33.25 618 637 656 674 696 Native
American/Alaskan Native
996 652.08 31.35 618 634 653 669 687
Asian 14149 673.50 36.76 634 653 669 696 708 Black/African
American 39270 647.78 29.52 615 631 646 665 680
Hispanic/Latino 40401 647.44 30.70 611 631 646 665 680 Mixed Ethnicity 107 662.25 32.78 625 643 660 680 696
Native Hawaiian/Other Pacific Islander
61 663.98 31.26 628 640 665 680 708
Ethnicity
White 109253 670.10 32.82 634 653 669 687 708 New York City 69784 651.71 33.01 615 634 649 669 687
Big 4 Cities 7953 643.69 30.49 608 628 643 660 680 High Needs
Urban/Suburban 15857 655.04 31.24 618 637 656 674 687
High Needs Rural 12204 659.69 30.56 625 643 660 674 696
Average Needs 63717 668.25 32.08 634 649 669 687 708 Low Needs 31682 678.97 32.66 643 660 674 696 726
NRC
Charter 2431 653.64 26.47 622 637 653 669 687 LEP LEP = Y 8473 621.93 27.83 588 608 625 640 653 SWD All Codes 28340 628.17 29.31 594 611 631 646 660 SUA All Codes 37513 629.58 29.64 594 611 631 649 665
Grade 7 Scale score statistics and N-counts of demographic groups for Grade 7 are presented in Table 34. The population scale score mean was 654.84 and the population standard deviation was 38.23. By gender subgroup, Females outperformed Males, but the difference was about one quarter of a standard deviation. Asian, Mixed Ethnicity, Native Hawaiian/Other Pacific Islander and White students’ scale score means exceeded the population mean scale score, as did students from Low Needs and Average Needs districts. Among all ethnic groups the Asian ethnic group had the highest average scale score mean (665.87). The students from the Big 4 Cities scored below their peers from

Copyright © 2007 by the New York State Education Department
100
schools with other NRC designations and about a half of standard deviation below the population mean. SWD and SUA subgroups scored approximately one standard deviation below the mean scale score for the population. The LEP subgroup, which had a scale score mean slightly more than fifty scale score units below the population mean, was the lowest performing group analyzed. At the 50th percentile, the following groups exceeded the population score of 657: Female (662), Asian (667), White (667), Average Needs districts (662), and Low Needs districts (673). Table 34. Scale Score Distribution Summary, by Subgroup, Grade 7
Demographic Category (Subgroup)
N-count
SS
Mean
SS Std
Dev
10th
%tile
25th
%tile
50th
%tile
75th
%tile
90th
%tile State All Students 211545 654.84 38.23 611 634 657 680 700
Female 102737 660.03 37.07 618 641 662 680 700 Gender Male 108808 649.94 38.66 608 631 653 673 688 Native
American/Alaskan Native
1105 643.08 36.62 600 624 645 667 680
Asian 13915 665.87 39.70 621 645 667 688 716 Black/African
American 41877 639.56 35.50 600 621 641 662 680
Hispanic/Latino 41465 638.94 39.41 596 621 645 662 680 Mixed Ethnicity 78 659.55 28.51 621 638 657 673 700
Native Hawaiian/Other Pacific Islander
55 660.93 40.85 621 638 657 680 700
Ethnicity
White 113050 665.09 34.48 628 645 667 680 700 New York City 73087 644.55 39.78 600 624 649 667 688
Big 4 Cities 8925 631.53 39.03 587 614 634 657 673 High Needs
Urban/Suburban 16283 646.47 36.22 604 628 649 667 688
High Needs Rural 13384 653.25 33.80 614 634 653 673 688
Average Needs 66256 662.71 33.59 624 645 662 680 700 Low Needs 31603 675.03 32.24 641 657 673 688 716
NRC
Charter 1374 647.64 33.01 611 631 649 667 688 LEP LEP = Y 7994 600.12 45.06 544 582 608 631 645 SWD All Codes 29034 617.48 40.98 568 600 624 645 662 SUA All Codes 37347 617.35 42.21 568 600 624 645 662

Copyright © 2007 by the New York State Education Department
101
Grade 8 Scale score statistics and N-counts of demographic groups for Grade 8 are presented in Table 35. The population scale score mean was 655.39 with a standard deviation of 39.32. By gender subgroup, Females outperformed Males, but the difference was about a quarter of a standard deviation. Asian, Native Hawaiian/Other Pacific Islander, and White students’ scale score means exceeded the population mean scale score, as did students from Low Needs and Average Needs districts. Among all ethnic groups the Asian ethnic group had the highest average scale score mean (667.06). The students from the Big 4 Cities scored below their peers from schools with other NRC designations and about a half of standard deviation below the population mean. SWD and SUA subgroups scored approximately one standard deviation below the mean scale score for the population. The LEP subgroup, which had a scale score mean slightly more than fifty scale score units below the population mean, was the lowest performing group analyzed. At the 50th percentile, the following groups exceeded the population score of 654: Female (659), Asian (668), Native Hawaiian/Other Pacific Islander (659), White (663), Average Needs districts (663), and Low Needs districts (673).
Table 35. Scale Score Distribution Summary, by Subgroup, Grade 8
Demographic Category (Subgroup)
N-count
SS
Mean
SS Std
Dev
10th
%tile
25th
%tile
50th
%tile
75th
%tile
90th
%tile State All Students 213676 655.39 39.32 612 632 654 679 706
Female 103868 661.01 39.26 619 635 659 679 706 Gender Male 109808 650.07 38.63 605 629 650 673 694 Native
American/Alaskan Native
1057 646.14 35.11 605 625 646 668 686
Asian 13759 667.06 42.51 619 643 668 686 726 Black/African
American 42231 638.90 33.41 602 619 639 659 679
Hispanic/Latino 41433 638.08 35.87 595 619 639 659 679 Mixed Ethnicity 59 647.44 35.90 609 622 639 673 706
Native Hawaiian/Other Pacific Islander
60 662.80 36.85 618 641 659 686 716
Ethnicity
White 115077 666.36 37.74 625 643 663 686 706 New York City 74161 642.55 37.28 602 622 643 663 686
Big 4 Cities 8617 633.63 35.76 591 615 635 654 673 High Needs
Urban/Suburban 16247 647.59 36.35 605 625 646 668 686
High Needs Rural 13410 654.09 35.24 615 632 654 673 694
NRC
Average Needs 67682 664.45 36.39 625 643 663 686 706 (Continued on next page)

Copyright © 2007 by the New York State Education Department
102
Table 35. Scale Score Distribution Summary, by Subgroup, Grade 8 (cont.)
Demographic Category (Subgroup)
N-count
SS
Mean
SS Std
Dev
10th
%tile
25th
%tile
50th
%tile
75th
%tile
90th
%tile Low Needs 31657 678.17 37.56 639 654 673 694 726 NRC Charter 1150 644.90 31.62 609 625 643 663 682
LEP LEP = Y 8663 605.67 34.45 563 587 609 629 643 SWD All Codes 28795 618.36 33.54 579 598 622 639 654 SUA All Codes 38059 618.84 34.68 579 598 622 639 659
Performance Level Distribution Summary Tables 36–42 show the performance level distribution for all examinees from public and charter school with valid scores. Table 36 presents performance level data for total populations of students in Grades 3–8. Tables 37–42 contain performance level data for selected subgroups of students. In general, these distributions reflect the same achievement trends in the scale score summary discussion. More Female students were classified in Level III and above categories as compared to Male students. Similarly more White and Asian students were classified in Level III and above categories as compared to their peers from other ethnic groups. Consistently with the scale score distribution across group pattern, students from Low and Average Needs districts outperformed students from High Needs districts (New York City, Big 4 Cities, Urban/Suburban, and Rural). The Level III and above rates for LEP students, SWD, and SUA were low, compared to the total population of examinees. Across grades, the following subgroups consistently performed above the population average: Asian, White, Average Needs, Low Needs. Please note that the case counts for the Native Hawaiian/Other Pacific Islander subgroup are very low and are heavily influenced by very high and/or very low achieving individual students. Table 36. ELA Grades 3–8 Test Performance Level Distributions
Percentage of NYS Student Population in Performance Level Grade N-count Level I Level II Level III Level IV Levels
III & IV 3 198320 8.92 23.89 57.29 9.90 67.20 4 197306 7.79 24.17 59.82 8.22 68.04 5 201841 4.89 26.88 61.37 6.86 68.24 6 204237 2.46 34.22 53.93 9.40 63.32 7 211545 5.90 36.22 51.91 5.98 57.89 8 213676 6.12 36.75 51.45 5.68 57.13
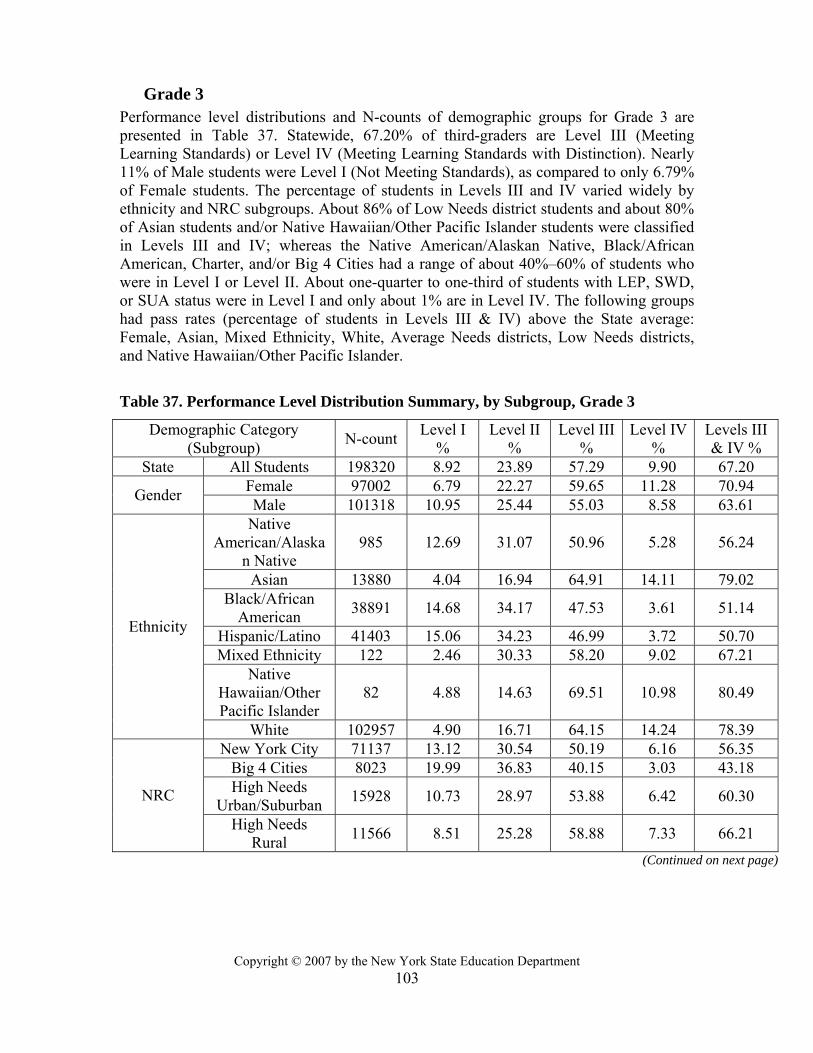
Copyright © 2007 by the New York State Education Department
103
Grade 3 Performance level distributions and N-counts of demographic groups for Grade 3 are presented in Table 37. Statewide, 67.20% of third-graders are Level III (Meeting Learning Standards) or Level IV (Meeting Learning Standards with Distinction). Nearly 11% of Male students were Level I (Not Meeting Standards), as compared to only 6.79% of Female students. The percentage of students in Levels III and IV varied widely by ethnicity and NRC subgroups. About 86% of Low Needs district students and about 80% of Asian students and/or Native Hawaiian/Other Pacific Islander students were classified in Levels III and IV; whereas the Native American/Alaskan Native, Black/African American, Charter, and/or Big 4 Cities had a range of about 40%–60% of students who were in Level I or Level II. About one-quarter to one-third of students with LEP, SWD, or SUA status were in Level I and only about 1% are in Level IV. The following groups had pass rates (percentage of students in Levels III & IV) above the State average: Female, Asian, Mixed Ethnicity, White, Average Needs districts, Low Needs districts, and Native Hawaiian/Other Pacific Islander.
Table 37. Performance Level Distribution Summary, by Subgroup, Grade 3
Demographic Category (Subgroup) N-count Level I
% Level II
% Level III
% Level IV
% Levels III & IV %
State All Students 198320 8.92 23.89 57.29 9.90 67.20 Female 97002 6.79 22.27 59.65 11.28 70.94 Gender Male 101318 10.95 25.44 55.03 8.58 63.61 Native
American/Alaskan Native
985 12.69 31.07 50.96 5.28 56.24
Asian 13880 4.04 16.94 64.91 14.11 79.02 Black/African
American 38891 14.68 34.17 47.53 3.61 51.14
Hispanic/Latino 41403 15.06 34.23 46.99 3.72 50.70 Mixed Ethnicity 122 2.46 30.33 58.20 9.02 67.21
Native Hawaiian/Other Pacific Islander
82 4.88 14.63 69.51 10.98 80.49
Ethnicity
White 102957 4.90 16.71 64.15 14.24 78.39 New York City 71137 13.12 30.54 50.19 6.16 56.35
Big 4 Cities 8023 19.99 36.83 40.15 3.03 43.18 High Needs
Urban/Suburban 15928 10.73 28.97 53.88 6.42 60.30 NRC
High Needs Rural 11566 8.51 25.28 58.88 7.33 66.21
(Continued on next page)

Copyright © 2007 by the New York State Education Department
104
Table 37. Performance Level Distribution Summary, by Subgroup, Grade 3 (cont.)
Demographic Category (Subgroup) N-count Level I
% Level II
% Level III
% Level IV
% Levels III & IV %
Average Needs 59076 5.12 18.45 64.01 12.42 76.44 Low Needs 29876 2.25 11.47 67.19 19.09 86.28
Charter 2117 7.94 32.03 55.88 4.16 60.04 LEP LEP = Y 15675 24.26 44.26 30.72 0.77 31.48 SWD All Codes 25625 34.95 36.80 26.66 1.59 28.25 SUA All Codes 38992 29.48 39.89 29.44 1.20 30.64
Grade 4 Performance level distributions and N-counts of demographic groups for Grade 4 are presented in Table 38. Across New York, approximately 68% of fourth-grade students are in Levels III and IV. As was seen in Grade 3, the Low Needs subgroup had the highest percentage of students in Levels III and IV (87.80%), and the LEP subgroup had the lowest (24.15%). Students in the Native American/Alaskan Native, Black/African American, and Hispanic/Latino subgroups had percentage classified in Levels III and IV slightly above 50% which was over 20% below the other ethnic subgroups. Over twice as many Big 4 City students were in Level I than the population. Over a quarter of students with LEP, SWD, or SUA status were in Level I (over three times the amount of the Statewide rate of 7.79%) and fewer than 1% were in Level IV. The following groups had percentages of students classified in Levels III and IV, above the State average: Female, Asian, Mixed ethnicity, Native Hawaiian/Other Pacific Islander, White, Average Needs districts, and Low Needs districts. Table 38. Performance Level Distribution Summary, by Subgroup, Grade 4
Demographic Category (Subgroup) N-count Level I
% Level II
% Level III
% Level IV
% Levels III & IV %
State All Students 197306 7.79 24.17 59.82 8.22 68.04 Female 96426 5.92 22.62 61.25 10.21 71.46 Gender Male 100880 9.58 25.65 58.45 6.32 64.77
Native American/ Alaskan Native 915 12.13 33.44 50.93 3.50 54.43
Asian 14092 3.94 16.36 65.90 13.81 79.70 Black/African
American 38231 12.43 36.20 48.46 2.90 51.37
Hispanic/Latino 40412 13.86 35.28 48.01 2.86 50.86 Mixed Ethnicity 83 1.20 26.51 65.06 7.23 72.29
Native Hawaiian/Other Pacific Islander
54 9.26 16.67 57.41 16.67 74.07
Ethnicity
White 103519 4.19 16.38 67.88 11.55 79.43 (Continued on next page)

Copyright © 2007 by the New York State Education Department
105
Table 38. Performance Level Distribution Summary, by Subgroup, Grade 4 (cont.)
Demographic Category (Subgroup) N-count Level I
% Level II
% Level III
% Level IV
% Levels III & IV %
New York City 70010 11.59 32.43 51.06 4.92 55.98 Big 4 Cities 7842 17.25 36.15 43.96 2.64 46.60 High Needs
Urban/Suburban 15474 10.02 28.68 56.08 5.22 61.30
High Needs Rural 11383 7.25 24.98 61.84 5.94 67.78
Average Needs 59829 4.39 18.19 67.62 9.80 77.42 Low Needs 30341 1.90 10.30 70.83 16.97 87.80
NRC
Charter 1880 8.19 35.80 52.55 3.46 56.01 LEP LEP = Y 12794 28.76 47.08 23.93 0.23 24.15 SWD All Codes 27483 33.22 38.97 27.10 0.71 27.81 SUA All Codes 40260 29.04 41.25 29.09 0.63 29.71
Grade 5 Performance level distributions and N-counts of demographic groups for Grade 5 are presented in Table 39. About 68% of the Grade 5 population was in Levels III and IV. As was seen in Grades 3 and 4, the Low Needs subgroup had the highest percentage of students in Levels III and IV (87.10%). The SWD subgroup had 29.28% of students classified in Levels III and IV, second only to the LEP subgroup (19.52%). Fewer Male students were in the Level I category than was observed with Grades 3 and 4, by a few percentage points. Students in the Native American/Alaskan Native, Black/African American, and Hispanic/Latino subgroups had rates around 50% of students classified in Levels III and IV, approximately 20% to 30% less than other ethnic subgroups. Over twice as many Big 4 City students were in Level I than the population’s rate. Close to a quarter of the students with LEP, SWD, or SUA status were in Level I (approximately four to five times as many as the Statewide rate of 4.89%), yet fewer than a third were in Levels III and IV (combined) and a very low percentage (less than 1%) in Level IV. The following groups had percentages of students classified in Levels III and IV, above the State average: Female, Asian, Native Hawaiian/Other Pacific Islander, White, High Needs Rural, Average Needs districts, and Low Needs districts. Table 39. Performance Level Distribution Summary, by Subgroup, Grade 5
Demographic Category (Subgroup) N-count Level I
% Level II
% Level III
% Level IV
% Levels III & IV %
State All Students 201841 4.89 26.88 61.37 6.86 68.24 Female 98258 3.80 25.87 62.71 7.62 70.33 Gender Male 103583 5.91 27.84 60.10 6.14 66.25
Ethnicity Native American/ Alaskan Native 932 6.76 36.70 53.97 2.58 56.55
(Continued on next page)

Copyright © 2007 by the New York State Education Department
106
Table 39. Performance Level Distribution Summary, by Subgroup, Grade 5 (cont.)
Demographic Category (Subgroup) N-count Level I
% Level II
% Level III
% Level IV
% Levels III & IV %
Asian 14301 2.94 18.24 68.32 10.50 78.82 Black/African
American 38906 7.30 41.40 48.97 2.33 51.30
Hispanic/Latino 40925 9.63 40.33 47.67 2.37 50.04 Mixed Ethnicity 96 0.00 32.29 63.54 4.17 67.71
Native Hawaiian/Other Pacific Islander
79 5.06 21.52 62.03 11.39 73.42
Ethnicity
White 106602 2.43 17.49 70.29 9.79 80.08 New York City 71293 7.47 36.40 51.74 4.39 56.13
Big 4 Cities 7688 11.97 42.83 43.34 1.86 45.20 High Needs
Urban/Suburban 15609 6.18 32.69 56.83 4.29 61.13
High Needs Rural 11736 4.27 26.31 64.43 4.99 69.42
Average Needs 61177 2.50 19.41 69.76 8.33 78.09 Low Needs 31275 1.14 11.75 73.78 13.33 87.10
NRC
Charter 2514 4.34 41.05 52.19 2.43 54.61 LEP LEP = Y 10087 26.43 54.05 19.45 0.07 19.52 SWD All Codes 29196 21.33 49.39 28.57 0.72 29.28 SUA All Codes 39724 19.88 49.77 29.68 0.66 30.35
Grade 6 Performance level distributions and N-counts of demographic groups for Grade 6 are presented in Table 40. Statewide, 63.32% of Grade 6 students were classified in Levels III and IV. As was seen in other grades, the Low Need subgroup had the most students classified in these two proficiency levels (84.58%), and the LEP, SWD, and SUA subgroups had the fewest. Students in the Native American/Alaskan Native, Black/African American, and Hispanic/Latino subgroups had around 50% of students classified in Level III and above. Students from Low Needs districts outperformed students in all other subgroups, across demographic categories as in the previous grades. Over twice as many Big 4 City students were placed in Level I than the general population and only about 39% of students from those districts were classified in Levels III and IV (with 2.62% in Level IV). The majority of students with LEP, SWD, and/or SUA status were in Level II, but fewer than 1% were in Level IV. The following groups had percentages of students classified in Levels III and IV, above the State average: Female, Asian, Mixed Ethnicity, White, High Needs Rural, Average Needs districts, and Low Needs districts.

Copyright © 2007 by the New York State Education Department
107
Table 40. Performance Level Distribution Summary, by Subgroup, Grade 6
Demographic Category (Subgroup) N-count Level I
% Level II
% Level III
% Level IV
% Levels III & IV %
State All Students 204237 2.46 34.22 53.93 9.40 63.32 Female 99986 1.55 31.37 55.25 11.82 67.08 Gender Male 104251 3.32 36.96 52.65 7.07 59.72 Native
American/Alaskan Native 996 3.61 45.08 46.59 4.72 51.31
Asian 14149 1.59 22.79 57.86 17.76 75.62 Black/African
American 39270 3.75 51.72 41.25 3.28 44.53 Hispanic/Latino 40401 4.56 50.66 41.43 3.35 44.78 Mixed Ethnicity 107 1.87 34.58 55.14 8.41 63.55
Native Hawaiian/Other Pacific Islander 61 0.00 39.34 45.9 14.75 60.66
Ethnicity
White 109253 1.32 23.23 62.66 12.79 75.45 New York City 69784 3.98 46.32 44.03 5.66 49.70
Big 4 Cities 7953 5.29 55.38 36.72 2.62 39.33 High Needs
Urban/Suburban 15857 2.84 41.89 49.62 5.65 55.28 High Needs
Rural 12204 2.20 34.47 56.87 6.46 63.33 Average Needs 63717 1.21 25.40 62.04 11.35 73.39
Low Needs 31682 0.52 14.90 65.60 18.98 84.58
NRC
Charter 2431 1.69 44.96 49.69 3.66 53.35 LEP LEP = Y 8473 14.95 74.18 10.67 0.20 10.87 SWD All Codes 28340 12.14 67.98 19.44 0.44 19.88 SUA All Codes 37513 11.27 67.36 20.73 0.64 21.37
Grade 7 Performance level distributions and N-counts of demographic groups for Grade 7 are presented in Table 41. In Grade 7, 57.89% of the population was in Levels III and IV. Over 10% more Female than Male students were classified in these two proficiency levels. Asian, Mixed Ethnicity, Native Hawaiian/Other Pacific Islander, and White subgroups were above average for combined Levels III and IV, whereas all other ethnic subgroups were below the population average. Close to 60% of Native American/Alaskan Native, Black/African American, and Hispanic/Latino students were in Levels I and II, and around 70% of Big 4 Cities students were in those levels. Over 80% of Low Needs students were in Levels III and IV. Average Needs schools outperformed the State average, with 67.77% of students in Levels III and IV. Fewer than 8% of LEP students were in Levels III and IV. The LEP, SWD, and SUA subgroups were well below the performance achievement of the general population, with over 80% of those students in

Copyright © 2007 by the New York State Education Department
108
Levels I and II. The following subgroups had percentages of students in Levels III and IV, above the general population: Female, Asian, Mixed Ethnicity, Native Hawaiian/Other Pacific Islander, White, Average Needs districts, and Low Needs districts. Table 41. Performance Level Distribution Summary, by Subgroup, Grade 7
Demographic Category (Subgroup) N-count Level I
% Level II
% Level III
% Level IV
% Levels III & IV %
State All Students 211545 5.90 36.22 51.91 5.98 57.89 Female 102737 4.30 32.41 55.65 7.64 63.29 Gender Male 108808 7.40 39.81 48.38 4.41 52.79
Native American/ Alaskan Native 1105 9.77 46.61 41.18 2.44 43.62
Asian 13915 4.48 24.52 60.29 10.71 71.00 Black/African
American 41877 9.19 52.88 36.20 1.74 37.94
Hispanic/Latino 41465 11.32 48.81 37.84 2.02 39.86
Mixed Ethnicity 78 2.56 38.46 53.85 5.13 58.97
Ethnicity
Native Hawaiian/Other Pacific Islander
55 7.27 29.09 54.55 9.09 63.64
Ethnicity White 113050 2.83 26.77 61.96 8.45 70.41 New York City 73087 9.17 45.54 41.61 3.68 45.29
Big 4 Cities 8925 14.61 55.06 29.08 1.25 30.30 High Needs
Urban/Suburban 16283 7.81 44.64 44.54 3.01 47.55
High Needs Rural 13384 4.65 39.98 51.10 4.27 55.37
Average Needs 66256 2.88 29.36 60.51 7.26 67.77 Low Needs 31603 1.16 16.98 69.40 12.46 81.86
NRC
Charter 1374 5.17 49.20 42.79 2.84 45.63 LEP LEP = Y 7994 38.87 53.83 7.28 0.03 7.31
SWD All Codes 29034 24.09 58.50 17.06 0.35 17.40
SUA All Codes 37347 24.57 57.26 17.75 0.43 18.17
Grade 8 Performance level distributions and N-counts of demographic groups for Grade 8 are presented in Table 42. In grade 8, 57.13% of the population was in Levels III and IV. About 10% more Female than Male students were in Levels III or IV. Over 55% of Native American/Alaskan Native, Black/African American, Hispanic/Latino, and Mixed Ethnicity students were in Levels I and II. Over 82% of Low Needs students were in Levels III and IV, while fewer than 7% of LEP students were in Levels III and IV. The

Copyright © 2007 by the New York State Education Department
109
LEP, SWD, and SUA subgroups were well below the performance achievement of the general population, with over 80% of those students in Levels I and II. The following subgroups had a higher percentage of students in Levels III and IV than the general population: Female, Asian, Native Hawaiian/Other Pacific Islander, White, Average Needs districts, and Low Needs districts.
Table 42. Performance Level Distribution Summary, by Subgroup, Grade 8
Demographic Category (Subgroup) N-count Level I
% Level II
% Level III
% Level IV
% Levels III & IV %
State All Students 213676 6.12 36.75 51.45 5.68 57.13 Female 103868 4.42 32.73 55.61 7.23 62.84 Gender Male 109808 7.72 40.56 47.52 4.21 51.73
Native American/ Alaskan Native 1057 8.04 47.02 41.34 3.60 44.94
Asian 13759 4.49 25.99 59.52 10.00 69.52 Ethnicity Black/African
American 42231 9.91 53.41 35.18 1.50 36.68
Hispanic/Latino 41433 11.76 50.66 36.05 1.52 37.57 Mixed Ethnicity 59 5.08 59.32 30.51 5.08 35.59
Native Hawaiian/Other Pacific Islander
60 3.33 30.00 56.67 10.00 66.67 Ethnicity
White 115077 2.87 26.82 62.11 8.21 70.31 New York City 74161 9.95 48.49 38.87 2.69 41.56
Big 4 Cities 8617 13.91 54.74 29.98 1.37 31.35 High Needs
Urban/Suburban 16247 7.67 44.32 44.77 3.25 48.02
High Needs Rural 13410 4.72 39.28 51.68 4.33 56.00
Average Needs 67682 2.79 28.37 61.65 7.19 68.83 Low Needs 31657 1.18 16.45 69.65 12.71 82.36
NRC
Charter 1150 5.39 51.74 40.70 2.17 42.87 LEP LEP = Y 8663 37.69 56.17 6.08 0.06 6.14 SWD All Codes 28795 25.12 59.26 15.36 0.26 15.62 SUA All Codes 38059 25.29 58.13 16.20 0.38 16.58
Copyright © 2007 by the New York State Education Department
110
Appendix A—ELA Passage Specifications General Guidelines • Each passage must have a clear beginning, middle, and end. • Passages may be excerpted from larger works, but internal editing must be avoided.
No edits may be made to poems. • Passages should be age- and grade- appropriate and should contain subject matter of
interest to the students being tested. • Informational passage subjects should span a broad range of topics, including history,
science, careers, career training, etc. • Literary passages should span a variety of genres and should include both classic and
contemporary literature. • Material may be selected from books, magazines (such as Cricket, Cobblestone,
Odyssey, National Geographic World, and Sport Illustrated for Kids), and newspapers.
• Avoid selecting literature that is widely studied. To that end, do not select passages from basals.
• If the accompanying art is not integral to the passage, and if permissions are granted separately, you may choose not to use that art or to use different art.
• Illustration- or photograph-dependent passages should be avoided whenever possible. • Passages should bring a range of cultural diversity to the tests. They should be written
by, as well as about, people of different cultures and races. • Passages should be suitable for items to be written that test the performance
indicators as outlined in the New York State Learning Standards Core Curricula. • Passages (excluding poetry) should be analyzed for readability. Readability statistics
are useful in helping to determine grade-level appropriateness of text prior to presenting the passages for formal committee review. An overview of readability concept and summary statistics for passages selected for 2007 operational administration are provided below.
Use of Readability Formulae in New York State Assessments
A variety of readability formulae currently exist that can be used to help determine the readability level of text. The formulae most associated with the K–12 environment are the Dale-Chall, the Fry, and the Spache formulae. Others (such as Flesch-Kincaid) are more associated with general text (such as newspapers and mainstream publications). Readability formulae provide some useful information about the reading difficulty of a passage or stimulus. However, it should be noted that a readability score is not the most reliable indicator of grade-level appropriateness and, therefore, should not be the sole determinant of whether a particular passage or stimulus should be included in assessment or instructional materials.

Copyright © 2007 by the New York State Education Department
111
Readability formulae are quantitative measures that assess the surface characteristics of text (e.g., the number of letters or syllables in a word, the number of words in a sentence, the number of sentences in a paragraph, the length of the passage). In order to truly measure the readability of any text, qualitative factors (e.g., density of concepts, organization of text, coherence of ideas, level of student interest, and quality of writing) must also be considered. One basic drawback to the usability of readability formulae is that not all passage or stimulus formats can be processed. To produce a score, the formulae generally require a minimum of 100 words in a sample (for Flesch Reading Ease and the Flesch-Kincaid, 200-word samples are recommended). This requirement renders the readability formulae essentially unusable for passages such as poems and many functional documents. Another drawback is evident in passages with specialized vocabulary. For example, if a passage contains scientific terminology, the readability score might appear to be above grade-level, even though the terms might be footnoted or explained within the context of the passage. In light of the drawbacks that exist in the use of readability formulae, rather than relying solely on readability indices, CTB/McGraw-Hill relies on the expertise of the educators in the State of New York to help determine the suitability of passages and stimuli to be used in Statewide assessments. Prospective passages are submitted for review to panels of New York State educators familiar with the abilities of the students to be tested and with the grade-level curricula. The passages are reviewed for readability, appropriateness of content, potential interest level, quality of writing, and other qualitative features that cannot be measured via readability formulae. Table A1. Readability Summary Information for 2007 Operational Test Passages
Title Passage Type
Word Count
Avg. Prose Score
Fry Graph
Spache/ Dale-Chall*
Flesch-Kincaid Formula
GRADE 3 Book 1 (Reading) As Cheerful as Cheerful Can Be Lit-Fiction 390 4.79 3.64 2.44 3.04
Robots Info-Article 225 6.22 5.33 3.65 4.40
Song of the Polar Bear Lit-Poem 165 n/a n/a n/a n/a
Fool a Fruit Info-How to 150 4.71 4.10 3.24 3.37
Readability Averages* 5.24 4.36 3.11 3.60 Book 2 (Listening) The Missing Horse Lit-Fiction 440 2.84 1.53 2.04 1.00
(Continued on next page)

Copyright © 2007 by the New York State Education Department
112
Table A1. Readability Summary information for 2007 Operational Test Passages (cont.)
Title Passage Type
Word Count
Avg. Prose Score
Fry Graph
Spache/ Dale-Chall*
Flesch-Kincaid Formula
GRADE 4 Book 1 (Reading) Song of the Cicada Lit-Fiction 375 5.26 4.15 2.82 3.49
Red, White, and Blue Info-Article 275 5.17 4.40 3.67 3.67
The Cracked Chinese Jug Lit-Fiction 320 5.20 4.15 3.47 3.05
A Koala Isn't a Bear Info-Article 425 5.94 5.32 3.58 4.38
The Island Lit-Poem 230 n/a n/a n/a n/a Book 2 (Listening) Hand-Me-Down Crayons Lit-Fiction 520 5.04 4.15 3.75 3.50 Book 3 (Reading pair) Thanks for All the Flies Lit-Fiction 580 4.07 3.41 3.11 2.82 Finders Keepers Lit-Fiction 635 4.17 3.52 2.70 2.88 Readability Averages* 4.97 4.16 3.22 3.38
GRADE 5 Book 1 (Reading) Mystery Flats Lit-Fiction 330 4.62 3.85 5-6 3.21
5 Steps to Safe Skating! Info-How to 545 4.15 2.87 5-6 2.19
Busy Builders Info-Article 450 6.59 6.46 7-8 5.30
Treasure in the Field Lit-Fiction 540 4.17 3.00 5-6 2.37 Readability Averages* 4.88 4.05 5-6 3.27 Book 2 (Listening)
Lion Around Info-Article 410 5.85 5.15 7-8 4.28
GRADE 6 Book 1 (Reading) Blugee Lit-Fiction 585 6.32 6.51 7-8 5.47
Songs of the Sea Info-Article 510 6.61 6.24 5-6 5.02
A Lunar Lament Lit-Poem 120 n/a n/a n/a n/a
Penguins are Funny Info-Article 625 7.47 7.09 7-8 6.04
(Continued on next page)
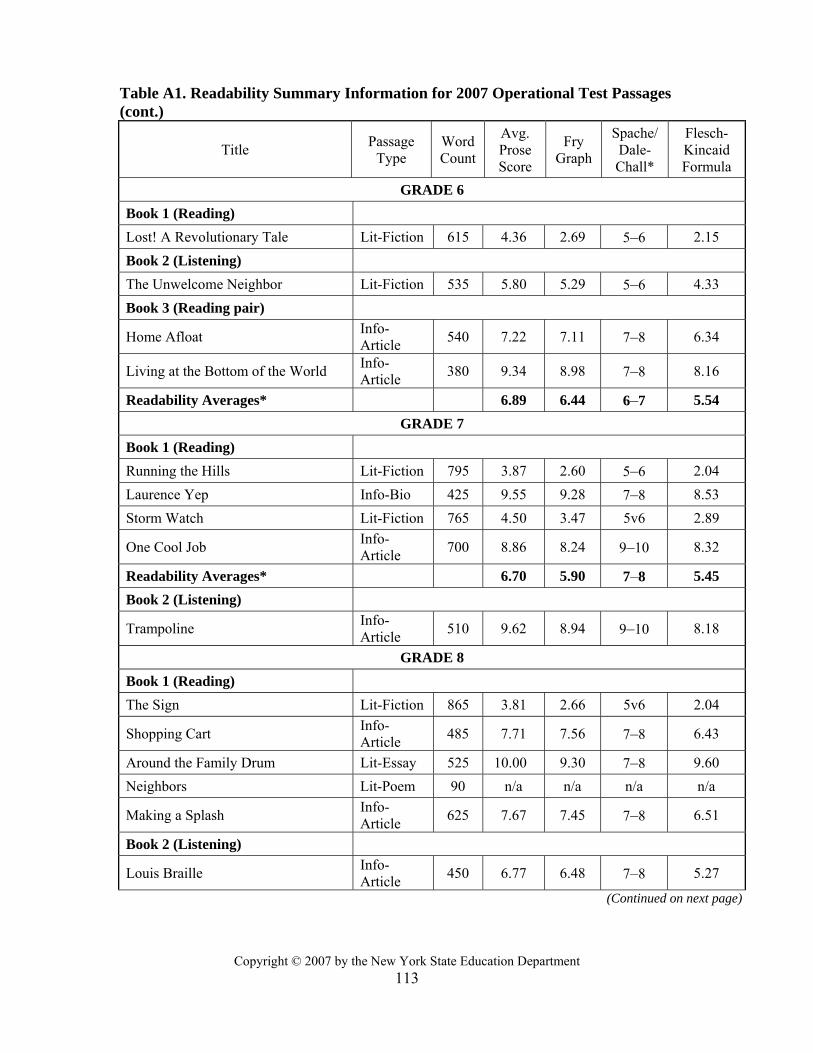
Copyright © 2007 by the New York State Education Department
113
Table A1. Readability Summary Information for 2007 Operational Test Passages (cont.)
Title Passage Type
Word Count
Avg. Prose Score
Fry Graph
Spache/ Dale-Chall*
Flesch-Kincaid Formula
GRADE 6 Book 1 (Reading) Lost! A Revolutionary Tale Lit-Fiction 615 4.36 2.69 5–6 2.15 Book 2 (Listening) The Unwelcome Neighbor Lit-Fiction 535 5.80 5.29 5–6 4.33 Book 3 (Reading pair)
Home Afloat Info-Article 540 7.22 7.11 7–8 6.34
Living at the Bottom of the World Info-Article 380 9.34 8.98 7–8 8.16
Readability Averages* 6.89 6.44 6–7 5.54 GRADE 7
Book 1 (Reading) Running the Hills Lit-Fiction 795 3.87 2.60 5–6 2.04 Laurence Yep Info-Bio 425 9.55 9.28 7–8 8.53 Storm Watch Lit-Fiction 765 4.50 3.47 5v6 2.89
One Cool Job Info-Article 700 8.86 8.24 9–10 8.32
Readability Averages* 6.70 5.90 7–8 5.45 Book 2 (Listening)
Trampoline Info-Article 510 9.62 8.94 9–10 8.18
GRADE 8 Book 1 (Reading) The Sign Lit-Fiction 865 3.81 2.66 5v6 2.04
Shopping Cart Info-Article 485 7.71 7.56 7–8 6.43
Around the Family Drum Lit-Essay 525 10.00 9.30 7–8 9.60 Neighbors Lit-Poem 90 n/a n/a n/a n/a
Making a Splash Info-Article 625 7.67 7.45 7–8 6.51
Book 2 (Listening)
Louis Braille Info-Article 450 6.77 6.48 7–8 5.27
(Continued on next page)

Copyright © 2007 by the New York State Education Department
114
Table A1. Readability Summary Information for 2007 Operational Test Passages (cont.)
Title Passage Type
Word Count
Avg. Prose Score
Fry Graph
Spache/ Dale-Chall*
Flesch-Kincaid Formula
GRADE 8 Book 3 (Reading pair)
This Car Runs on Thin Air Info-Article 610 11.28 10.92 11–12 10.21
Clothes Washer and Dryer Info-Article 460 9.16 8.63 7–8 8.36
Readability Averages* 8.27 7.75 7–8 7.17 Table A2. Number, Type, and Length of Passages
Grade # of
Listening Passages
Approximate Word Length
# of Reading Passages
Passage Types
Approximate Word Length
Passage Types
3 8 200-400
20 (includes 5 sets of
short paired-
passages)
Literary 200–600 50% Literary;
50% Informational
4 5 250-450
20 (includes 8 sets of
short paired-
passages)
Literary 250–600
50% Literary; 50%
Informational
5 12 300-500
20 (includes 5 sets of
short paired-
passages)
Literary 250–600 50% Literary;
50% Informational
6 8 350-550
24 (includes 5 sets of
short paired-
passages)
Informa-tional 300–650
50% Literary; 50%
Informational
(Continued on next page)

Copyright © 2007 by the New York State Education Department
115
Table A2. Number, Type, and Length of Passages (cont.)
Grade # of
Listening Passages
Approximate Word Length
# of Reading Passages
Passage Types
Approximate Word Length
Passage Types
7 8 400-600
24 (includes 5 sets of
short paired-
passages)
Informa-tional
(May be 2 short paired- pieces)
350-700 50% Literary;
50% Informational
8 5 450-650
20 (includes 8 sets of
short paired-
passages)
Informa-tional
(May be 2 short paired- pieces)
350-800 50% Literary;
50% Informational

Copyright © 2007 by the New York State Education Department
116
Appendix B—Criteria for Item Acceptability For Multiple-Choice Items: Check that the content of each item • is targeted to assess only one objective or skill (unless specifications indicate otherwise) • deals with material that is important in testing the targeted performance indicator • uses grade-appropriate content and thinking skills • is presented at a reading level suitable for the grade level being tested • has a stem that facilitates answering the question or completing the statement without
looking at the answer choices • has a stem that does not present clues to the correct answer choice • has answer choices that are plausible and attractive to the student who has not mastered
the objective or skill • has mutually exclusive distractors • has one and only one correct answer choice • is free of cultural, racial, ethnic, age, gender, disability, regional, or other apparent bias Check that the format of each item • is worded in the positive unless it is absolutely necessary to use the negative form • is free of extraneous words or expressions in both the stem and the answer choices (e.g.,
the same word or phrase does not begin each answer choice) • indicates emphasis on key words, such as best, first, least, not, and others, that are
important and might be overlooked • places the interrogative word at the beginning of a stem in the form of a question or
places the omitted portion of an incomplete statement at the end of the statement • indicates the correct answer choice • provides the rationale for all distractors • is conceptually, grammatically, and syntactically consistent—between the stem and
answer choices, and among the answer choices • has answer choices balanced in length or contains two long and two short choices • clearly identifies the passage or other stimulus material associated with the item • clearly identifies a need of art, if applicable, and the art is conceptualized and sketched,
with important considerations explicated Also check that • one item does not present clues to the correct answer choice for any other item • any item based on a passage is answerable from the information given in the passage and
is not dependent on skills related to other content areas • any item based on a passage is truly passage-dependent; that is, not answerable without
reference to the passage • there is a balance of reasonable, non-stereotypic representation of economic classes,
races, cultures, ages, genders, and persons with disabilities in context and art

Copyright © 2007 by the New York State Education Department
117
For Constructed-Response Items: Check that the content of each item is • designed to assess the targeted performance indicator • appropriate for the grade level being tested • presented at a reading level suitable for the grade level being tested • appropriate in context • written so that a student possessing knowledge or skill being tested can construct a
response that can be scored with the specified rubric or scoring tool; that is, the range of possible correct responses must be wide enough to allow for diversity of responses, but narrow enough so that students who do not clearly show their grasp of the objective or skill being assessed cannot obtain the maximum score
• presented without clue to the correct response • checked for accuracy and documented against reliable, up-to-date sources (including
rubrics) • free of cultural, racial, ethnic, age, gender, disability, or other apparent bias Check that the format of each item is • appropriate for the question being asked and the intended response • worded clearly and concisely, using simple vocabulary and sentence structure • precise and unambiguous in its directions for the desired response • free of extraneous words or expressions • worded in the positive rather than in the negative form • conceptually, grammatically, and syntactically consistent • marked with emphasis on key words, such as best, first, least, and others, that are
important and might be overlooked • clearly identified as needing art, if applicable, and the art is conceptualized and sketched,
with important considerations explicated Also check that • one item does not present clues to the correct response to any other item • there is balance of reasonable, non-stereotypic representation of economic classes, races,
cultures, ages, genders, and persons with disabilities in context and art • for each set of items related to a reading passage, each item is designed to elicit a unique
and independent response • items designed to assess reading do not depend on prior knowledge of the subject matter
used in the prompt/question

Copyright © 2007 by the New York State Education Department
118
Appendix C—Psychometric Guidelines for Operational Item Selection It is primarily up to the content development department to select items for the 2007 operational test. Research will provide support, as necessary, and will review the final item selection. Research will provide data files with parameters for all FT items eligible for item pool. The pools of items eligible for 2007 item selection will include 2005 and 2006 FT items for Grades 3, 5, 6, and 7 and 2003, 2005, and 2006 FT items for Grades 4 and 8. All items for each grade will be on the same (grade specific) scale. Here are general guidelines for item selection: • Satisfy the content specifications in terms of objective coverage and the number and
percentage of MC and CR items on the test. An often used criterion for objective coverage is within 5% of the percentages of score points and items per objective.
• Avoid selecting poor-fitting items, items with too high/low p-values, items with flagged point biserials (the research department will provide a list of such items).
• Avoid items flagged for local dependency if the flagged items come from different passages. If the flagged items come from the same passage, they are expected to be dependent on each other to some degree and it is not a problem.
• Minimize the number of items flagged for DIF (gender, ethnic, and high/Low Needs schools). Flagged items should be reviewed for content again. It needs to be remembered that some items may be flagged for DIF by chance only and their content may not necessarily be biased against any of the analyzed groups. Research will provide DIF information for each item. It is also possible to get “significant” DIF yet not bias if the content is a necessary part of the construct that is measured. That is, some items may be flagged for DIF not out of chance and still not represent bias.
• Verify that the items will be administered in the same relative positions in both the FT and OP forms (e.g., the first item in a FT form should also be the first item in an OP form). When that is impossible, please ensure that they are in the same one-third section of the forms.
• Evaluate the alignment of TCC and SE curves of the proposed 2007 OP forms and the 2006 OP forms.
• From the ITEMWIN output evaluate expected percentage of maximum raw score at each scale score and difference between reference set (2006) and working set (2007)—we want the difference to be no more than 0.01, which is unfortunately sometimes hard to achieve, but please try your best.
o It is especially important to get a good curve alignment at and around proficiency level cut scores. Good alignment will help preserve the impact data from the previous year of testing.
• Try to get the best scale coverage—make sure that MC items cover a wide range of the scale.
• Provide the research department with the following item selection information:

Copyright © 2007 by the New York State Education Department
119
o Percentage of score points per learning standard (target, 2007 full selection, 2007 MC items only)
o Item number in 2007 OP book o Item unique identification number, item type, FT year, FT
form, and FT item number o Item classical statistics (p-values, point biserial, etc.) o ITEMWIN output (including TCCs) o Summary file with IRT item parameters for selected items

Copyright © 2007 by the New York State Education Department
120
Appendix D—Factor Analysis Results As described in Section III, “Validity,” a principal component factor analysis was conducted on the Grades 3–8 ELA Tests data. The analyses were conducted for the total population of students and selected subpopulations: limited English proficiency (LEP), students with disabilities (SWD), and students using accommodations (SUA). Table D1 contains the results of factor analysis on subpopulation data. Table D1. Factor Analysis Results for ELA Tests (Selected Subpopulations)
Initial Eigenvalues Grade Subgroup Component Total % of variance Cumulative % 1 4.81 17.16 17.16 2 1.22 4.35 21.52 3 1.15 4.10 25.61 LEP
4 1.07 3.83 29.44 1 5.71 20.39 20.39 2 1.25 4.48 24.87 3 1.11 3.96 28.83 SWD
4 1.06 3.80 32.63 1 5.32 19.01 19.01 2 1.23 4.38 23.39 3 1.13 4.04 27.43
3
SUA
4 1.08 3.86 31.29 1 6.51 20.99 20.99 2 1.29 4.16 25.15 3 1.06 3.41 28.56 LEP
4 1.05 3.37 31.93 1 7.75 25.01 25.01 2 1.30 4.18 29.20 SWD 3 1.04 3.34 32.54 1 7.45 24.02 24.02 2 1.32 4.25 28.27 3 1.03 3.32 31.59
4
SUA
4 1.01 3.25 34.83 1 5.05 18.71 18.71 2 1.15 4.27 22.98 3 1.05 3.88 26.85 LEP
4 1.01 3.75 30.60 1 5.60 20.73 20.73 2 1.17 4.33 25.06
5
SWD 3 1.06 3.91 28.97
(Continued on next page)

Copyright © 2007 by the New York State Education Department
121
Table D1. Factor Analysis Results for ELA Tests (Selected Subpopulations) (cont.) Initial Eigenvalues Grade Subgroup Component Total % of Variance Cumulative %
1 5.53 20.47 20.47 2 1.17 4.34 24.81 5 SUA 3 1.04 3.86 28.67 1 4.91 16.93 16.93 2 1.29 4.45 21.38 3 1.06 3.66 25.05 4 1.05 3.63 28.68 5 1.05 3.61 32.29 6 1.03 3.54 35.83
LEP
7 1.01 3.47 39.30 1 6.01 20.73 20.73 2 1.27 4.36 25.10 3 1.09 3.75 28.85 SWD
4 1.01 3.48 32.33 1 6.05 20.85 20.85 2 1.28 4.41 25.26 3 1.07 3.69 28.95
6
SUA
4 1.01 3.47 32.42 1 6.34 18.11 18.11 2 1.29 3.68 21.79 3 1.18 3.37 25.16 4 1.07 3.06 28.22 5 1.06 3.03 31.26
LEP
6 1.02 2.92 34.18 1 7.02 20.05 20.05 2 1.28 3.65 23.69 3 1.22 3.47 27.17 4 1.07 3.04 30.21
SWD
5 1.01 2.90 33.11 1 7.20 20.57 20.57 2 1.28 3.66 24.23 3 1.19 3.40 27.63 4 1.06 3.03 30.66
7
SUA
5 1.01 2.89 33.55 1 4.99 17.22 17.22 2 1.15 3.97 21.19 3 1.11 3.82 25.01 4 1.09 3.76 28.76 5 1.05 3.63 32.39 6 1.05 3.61 36.00
8 LEP
7 1.02 3.51 39.51 (Continued on next page)

Copyright © 2007 by the New York State Education Department
122
Table D1. Factor Analysis Results for ELA Tests (Selected Subpopulations) (cont.) Initial Eigenvalues Grade Subgroup Component Total % of Variance Cumulative %
1 4.99 17.22 17.22 2 1.15 3.97 21.19 3 1.11 3.82 25.01 4 1.09 3.76 28.76 5 1.05 3.63 32.39 6 1.05 3.61 36.00
LEP
7 1.02 3.51 39.51 1 5.57 19.20 19.20 2 1.16 4.01 23.21 3 1.09 3.77 26.98 4 1.03 3.56 30.54
SWD
5 1.02 3.51 34.05 1 5.69 19.64 19.64 2 1.18 4.06 23.70 3 1.06 3.65 27.35 4 1.03 3.56 30.91
8
SUA
5 1.01 3.48 34.39

Copyright © 2007 by the New York State Education Department
123
Appendix E—Items Flagged for DIF These tables support the DIF information in Section V, “Operational Test Data Collection and Classical Analyses” and Section VI, “IRT Scaling and Equating.” They include item numbers, focal group, and directions of DIF and DIF statistics. Table E1 shows items flagged by the SMD and Mantel-Haenszel methods, and Table E2 presents items flagged by the Linn-Harnisch method. Note that positive values of SMD and Delta in Table E1 indicate DIF in favor of a focal group and negative values of SMD and Delta indicate DIF against a focal group. Table E1. NYSTP ELA 2007 Classical DIF Item Flags
Grade Item # Subgroup DIF SMD Mantel-Haenszel Delta 3 22 Hispanic Against No Flag 912.77 -1.75 3 27 Black In favor 0.12 n/a n/a 4 29 Female In favor 0.15 n/a n/a 4 30 Asian In favor 0.18 n/a n/a 4 30 Black In favor 0.11 n/a n/a 4 30 Female In favor 0.14 n/a n/a 4 30 Hispanic In favor 0.13 n/a n/a 4 31 Black In favor 0.11 n/a n/a 4 31 Female In favor 0.16 n/a n/a 4 31 Hispanic In favor 0.12 n/a n/a 5 4 Asian Against No Flag 1458.19 -2.39 5 4 Hispanic Against No Flag 1388.71 -1.58 5 21 Asian In favor 0.13 n/a n/a 5 21 Hispanic In favor 0.10 n/a n/a 5 27 Asian Against -0.10 n/a n/a 5 27 Black Against -0.15 n/a n/a 5 27 High Needs Against -0.14 n/a n/a 5 27 Hispanic Against -0.12 n/a n/a 6 20 Female Against -0.11 No Flag No Flag 6 27 Asian In favor 0.14 n/a n/a 6 27 Black In favor 0.10 n/a n/a 6 27 Female In favor 0.14 n/a n/a 6 27 Hispanic In favor 0.11 n/a n/a 6 28 Asian In favor 0.11 n/a n/a 6 28 Female In favor 0.13 n/a n/a 6 29 Asian In favor 0.10 n/a n/a 6 29 Black In favor 0.10 n/a n/a 6 29 Female In favor 0.18 n/a n/a 6 29 Hispanic In favor 0.15 n/a n/a
(Continued on next page)

Copyright © 2007 by the New York State Education Department
124
Table E1. NYSTP ELA 2007 Classical DIF Item Flags (cont.)
Grade Item # Subgroup DIF SMD Mantel-Haenszel Delta 7 8 Asian In favor No Flag 635.38 1.67 7 30 Asian Against No Flag 481.69 -1.68 7 35 Black Against -0.12 n/a n/a 7 35 High Needs Against -0.11 n/a n/a 7 35 Hispanic Against -0.12 n/a n/a 8 9 Female Against -0.10 No Flag No Flag 8 14 Asian Against -0.11 No Flag No Flag 8 14 Black Against -0.13 No Flag No Flag 8 14 Hispanic Against -0.10 No Flag No Flag 8 27 Female In favor 0.14 n/a n/a 8 28 Asian In favor 0.13 n/a n/a 8 28 Female In favor 0.12 n/a n/a
In Table E2, note that positive values of Dig indicate DIF in favor of a focal group and negative values of Dig indicate DIF against a focal group.
Table E2. Items Flagged for DIF by the Linn-Harnisch Method
Grade Item Focal Group Direction Magnitude (Dig)4 30 Asian In Favor 0.101 5 21 Asian In Favor 0.105 5 27 Black Against -0.124 5 27 Hispanic Against -0.102 6 29 Male Against -0.105 7 35 Black Against -0.105
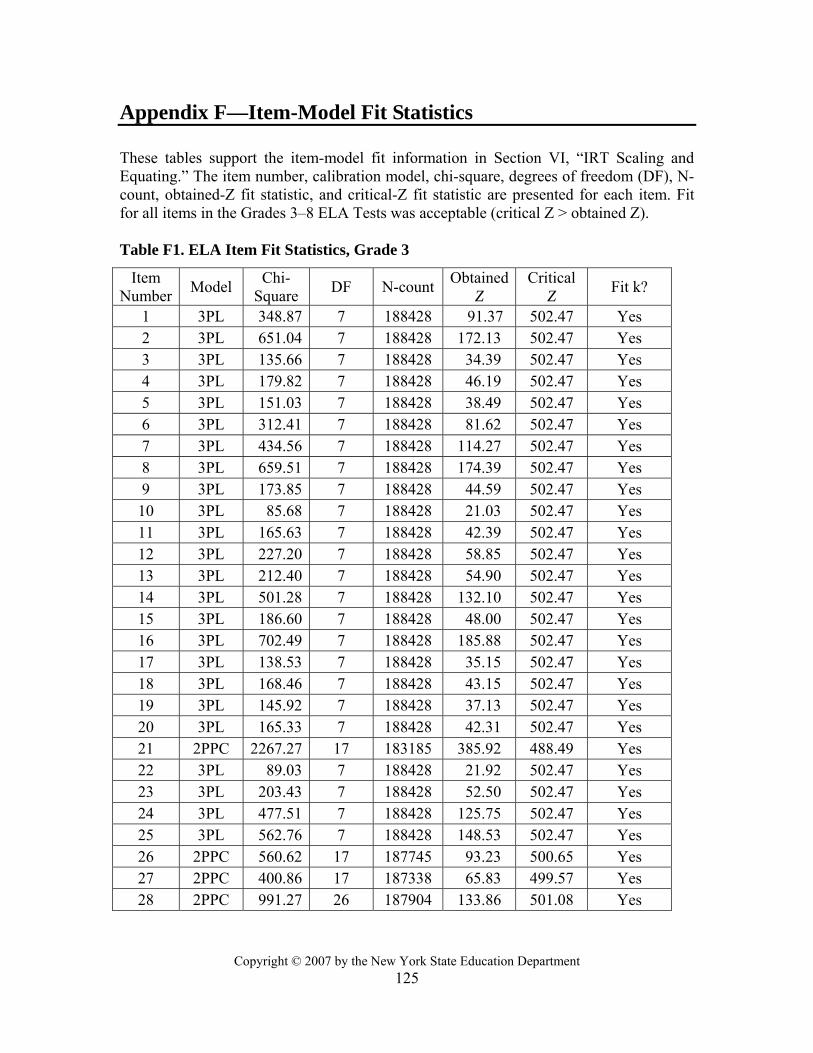
Copyright © 2007 by the New York State Education Department
125
Appendix F—Item-Model Fit Statistics These tables support the item-model fit information in Section VI, “IRT Scaling and Equating.” The item number, calibration model, chi-square, degrees of freedom (DF), N-count, obtained-Z fit statistic, and critical-Z fit statistic are presented for each item. Fit for all items in the Grades 3–8 ELA Tests was acceptable (critical Z > obtained Z). Table F1. ELA Item Fit Statistics, Grade 3
Item Number Model Chi-
Square DF N-count ObtainedZ
Critical Z Fit k?
1 3PL 348.87 7 188428 91.37 502.47 Yes 2 3PL 651.04 7 188428 172.13 502.47 Yes 3 3PL 135.66 7 188428 34.39 502.47 Yes 4 3PL 179.82 7 188428 46.19 502.47 Yes 5 3PL 151.03 7 188428 38.49 502.47 Yes 6 3PL 312.41 7 188428 81.62 502.47 Yes 7 3PL 434.56 7 188428 114.27 502.47 Yes 8 3PL 659.51 7 188428 174.39 502.47 Yes 9 3PL 173.85 7 188428 44.59 502.47 Yes 10 3PL 85.68 7 188428 21.03 502.47 Yes 11 3PL 165.63 7 188428 42.39 502.47 Yes 12 3PL 227.20 7 188428 58.85 502.47 Yes 13 3PL 212.40 7 188428 54.90 502.47 Yes 14 3PL 501.28 7 188428 132.10 502.47 Yes 15 3PL 186.60 7 188428 48.00 502.47 Yes 16 3PL 702.49 7 188428 185.88 502.47 Yes 17 3PL 138.53 7 188428 35.15 502.47 Yes 18 3PL 168.46 7 188428 43.15 502.47 Yes 19 3PL 145.92 7 188428 37.13 502.47 Yes 20 3PL 165.33 7 188428 42.31 502.47 Yes 21 2PPC 2267.27 17 183185 385.92 488.49 Yes 22 3PL 89.03 7 188428 21.92 502.47 Yes 23 3PL 203.43 7 188428 52.50 502.47 Yes 24 3PL 477.51 7 188428 125.75 502.47 Yes 25 3PL 562.76 7 188428 148.53 502.47 Yes 26 2PPC 560.62 17 187745 93.23 500.65 Yes 27 2PPC 400.86 17 187338 65.83 499.57 Yes 28 2PPC 991.27 26 187904 133.86 501.08 Yes

Copyright © 2007 by the New York State Education Department
126
Table F2. ELA Item Fit Statistics, Grade 4
Item Number Model Chi-
Square DF N-count ObtainedZ
Critical Z Fit Ok?
1 3PL 136.43 7 190878 34.59 509.01 Yes 2 3PL 103.30 7 190878 25.74 509.01 Yes 3 3PL 89.29 7 190878 21.99 509.01 Yes 4 3PL 159.48 7 190878 40.75 509.01 Yes 5 3PL 61.29 7 190878 14.51 509.01 Yes 6 3PL 128.82 7 190878 32.56 509.01 Yes 7 3PL 59.44 7 190878 14.02 509.01 Yes 8 3PL 160.27 7 190878 40.96 509.01 Yes 9 3PL 95.83 7 190878 23.74 509.01 Yes 10 3PL 180.44 7 190878 46.35 509.01 Yes 11 3PL 82.71 7 190878 20.23 509.01 Yes 12 3PL 358.61 7 190878 93.97 509.01 Yes 13 3PL 295.86 7 190878 77.20 509.01 Yes 14 3PL 86.39 7 190878 21.22 509.01 Yes 15 3PL 306.36 7 190878 80.01 509.01 Yes 16 3PL 802.50 7 190878 212.61 509.01 Yes 17 3PL 347.09 7 190878 90.89 509.01 Yes 18 3PL 96.21 7 190878 23.84 509.01 Yes 19 3PL 855.24 7 190878 226.70 509.01 Yes 20 3PL 129.38 7 190878 32.71 509.01 Yes 21 3PL 571.81 7 190878 150.95 509.01 Yes 22 3PL 139.15 7 190878 35.32 509.01 Yes 23 3PL 130.26 7 190878 32.94 509.01 Yes 24 3PL 908.48 7 190878 240.93 509.01 Yes 25 3PL 497.95 7 190878 131.21 509.01 Yes 26 3PL 282.64 7 190878 73.67 509.01 Yes 27 3PL 823.53 7 190878 218.23 509.01 Yes 28 3PL 357.39 7 190878 93.65 509.01 Yes 29 2PPC 1353.10 35 190721 157.54 508.59 Yes 30 2PPC 1063.09 26 190644 143.82 508.38 Yes 31 2PPC 2727.93 35 190638 321.87 508.37 Yes
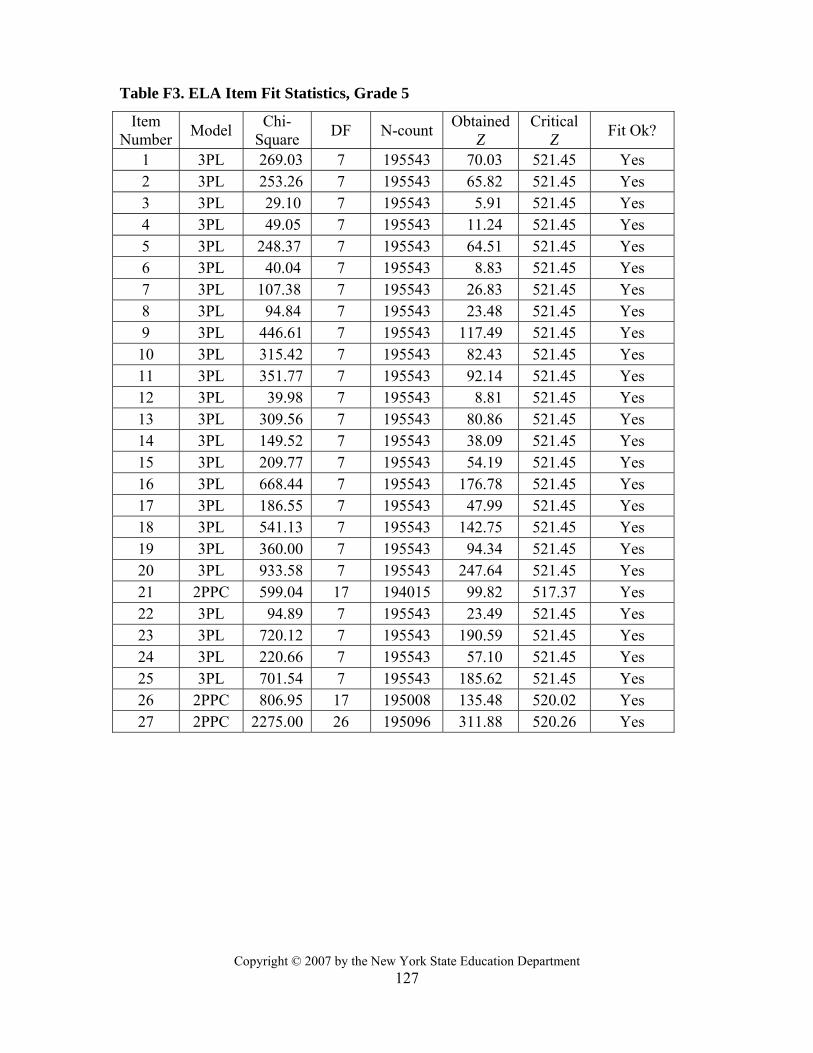
Copyright © 2007 by the New York State Education Department
127
Table F3. ELA Item Fit Statistics, Grade 5
Item Number Model Chi-
Square DF N-count Obtained Z
Critical Z Fit Ok?
1 3PL 269.03 7 195543 70.03 521.45 Yes 2 3PL 253.26 7 195543 65.82 521.45 Yes 3 3PL 29.10 7 195543 5.91 521.45 Yes 4 3PL 49.05 7 195543 11.24 521.45 Yes 5 3PL 248.37 7 195543 64.51 521.45 Yes 6 3PL 40.04 7 195543 8.83 521.45 Yes 7 3PL 107.38 7 195543 26.83 521.45 Yes 8 3PL 94.84 7 195543 23.48 521.45 Yes 9 3PL 446.61 7 195543 117.49 521.45 Yes 10 3PL 315.42 7 195543 82.43 521.45 Yes 11 3PL 351.77 7 195543 92.14 521.45 Yes 12 3PL 39.98 7 195543 8.81 521.45 Yes 13 3PL 309.56 7 195543 80.86 521.45 Yes 14 3PL 149.52 7 195543 38.09 521.45 Yes 15 3PL 209.77 7 195543 54.19 521.45 Yes 16 3PL 668.44 7 195543 176.78 521.45 Yes 17 3PL 186.55 7 195543 47.99 521.45 Yes 18 3PL 541.13 7 195543 142.75 521.45 Yes 19 3PL 360.00 7 195543 94.34 521.45 Yes 20 3PL 933.58 7 195543 247.64 521.45 Yes 21 2PPC 599.04 17 194015 99.82 517.37 Yes 22 3PL 94.89 7 195543 23.49 521.45 Yes 23 3PL 720.12 7 195543 190.59 521.45 Yes 24 3PL 220.66 7 195543 57.10 521.45 Yes 25 3PL 701.54 7 195543 185.62 521.45 Yes 26 2PPC 806.95 17 195008 135.48 520.02 Yes 27 2PPC 2275.00 26 195096 311.88 520.26 Yes

Copyright © 2007 by the New York State Education Department
128
Table F4. ELA Item Fit Statistics, Grade 6
Item Number Model Chi-
Square DF N-count ObtainedZ
Critical Z Fit Ok?
1 3PL 540.63 7 199771 142.62 532.72 Yes 2 3PL 152.01 7 199771 38.75 532.72 Yes 3 3PL 445.01 7 199771 117.06 532.72 Yes 4 3PL 82.90 7 199771 20.28 532.72 Yes 5 3PL 149.93 7 199771 38.20 532.72 Yes 6 3PL 194.44 7 199771 50.09 532.72 Yes 7 3PL 481.51 7 199771 126.82 532.72 Yes 8 3PL 270.68 7 199771 70.47 532.72 Yes 9 3PL 1113.23 7 199771 295.65 532.72 Yes 10 3PL 305.67 7 199771 79.82 532.72 Yes 11 3PL 115.53 7 199771 29.01 532.72 Yes 12 3PL 185.57 7 199771 47.73 532.72 Yes 13 3PL 202.99 7 199771 52.38 532.72 Yes 14 3PL 144.33 7 199771 36.70 532.72 Yes 15 3PL 162.36 7 199771 41.52 532.72 Yes 16 3PL 495.60 7 199771 130.58 532.72 Yes 17 3PL 98.64 7 199771 24.49 532.72 Yes 18 3PL 100.05 7 199771 24.87 532.72 Yes 19 3PL 82.50 7 199771 20.18 532.72 Yes 20 3PL 968.27 7 199771 256.91 532.72 Yes 21 3PL 223.76 7 199771 57.93 532.72 Yes 22 3PL 37.96 7 199771 8.27 532.72 Yes 23 3PL 790.52 7 199771 209.40 532.72 Yes 24 3PL 147.06 7 199771 37.43 532.72 Yes 25 3PL 194.69 7 199771 50.16 532.72 Yes 26 3PL 171.56 7 199771 43.98 532.72 Yes 27 2PPC 2469.81 44 199522 258.59 532.06 Yes 28 2PPC 1237.93 26 199440 168.06 531.84 Yes 29 2PPC 3263.27 44 199427 343.18 531.81 Yes

Copyright © 2007 by the New York State Education Department
129
Table F5. ELA Item Fit Statistics, Grade 7
Item Number Model Chi-
Square DF N-count ObtainedZ
Critical Z Fit Ok?
1 3PL 76.86 7 209280 18.67 558.08 Yes 2 3PL 334.14 7 209280 87.43 558.08 Yes 3 2PPC 351.02 17 207521 57.28 553.39 Yes 4 3PL 845.64 7 209280 224.14 558.08 Yes 5 3PL 139.76 7 209280 35.48 558.08 Yes 6 3PL 226.17 7 209280 58.58 558.08 Yes 7 3PL 148.26 7 209280 37.75 558.08 Yes 8 3PL 190.84 7 209280 49.13 558.08 Yes 9 3PL 81.58 7 209280 19.93 558.08 Yes 10 3PL 974.98 7 209280 258.70 558.08 Yes 11 3PL 189.07 7 209280 48.66 558.08 Yes 12 3PL 86.59 7 209280 21.27 558.08 Yes 13 3PL 715.44 7 209280 189.34 558.08 Yes 14 3PL 1207.36 7 209280 320.81 558.08 Yes 15 3PL 140.74 7 209280 35.74 558.08 Yes 16 3PL 121.63 7 209280 30.64 558.08 Yes 17 3PL 144.58 7 209280 36.77 558.08 Yes 18 3PL 187.12 7 209280 48.14 558.08 Yes 19 3PL 67.23 7 209280 16.10 558.08 Yes 20 3PL 249.55 7 209280 64.82 558.08 Yes 21 3PL 54.15 7 209280 12.60 558.08 Yes 22 2PPC 435.00 17 206029 71.69 549.41 Yes 23 3PL 131.00 7 209280 33.14 558.08 Yes 24 3PL 430.77 7 209280 113.26 558.08 Yes 25 3PL 346.08 7 209280 90.62 558.08 Yes 26 3PL 392.85 7 209280 103.12 558.08 Yes 27 3PL 68.05 7 209280 16.31 558.08 Yes 28 3PL 1665.28 7 209280 443.19 558.08 Yes 29 3PL 198.45 7 209280 51.17 558.08 Yes 30 3PL 111.08 7 209280 27.82 558.08 Yes 31 3PL 941.45 7 209280 249.74 558.08 Yes 32 3PL 34.17 7 209280 7.26 558.08 Yes 33 2PPC 397.98 17 208118 65.34 554.98 Yes 34 2PPC 438.59 17 208361 72.30 555.63 Yes 35 2PPC 1218.64 26 207943 165.39 554.51 Yes

Copyright © 2007 by the New York State Education Department
130
Table F6. ELA Item Fit Statistics, Grade 8
Item Number Model Chi-
Square DF N-count ObtainedZ
Critical Z Fit Ok?
1 3PL 847.47 7 207444 224.62 553.18 Yes 2 3PL 378.70 7 207444 99.34 553.18 Yes 3 3PL 61.99 7 207444 14.70 553.18 Yes 4 3PL 371.53 7 207444 97.42 553.18 Yes 5 3PL 363.58 7 207444 95.30 553.18 Yes 6 3PL 846.21 7 207444 224.29 553.18 Yes 7 3PL 165.12 7 207444 42.26 553.18 Yes 8 3PL 115.71 7 207444 29.05 553.18 Yes 9 3PL 468.81 7 207444 123.42 553.18 Yes 10 3PL 107.51 7 207444 26.86 553.18 Yes 11 3PL 432.25 7 207444 113.65 553.18 Yes 12 3PL 248.65 7 207444 64.58 553.18 Yes 13 3PL 281.28 7 207444 73.30 553.18 Yes 14 3PL 218.21 7 207444 56.45 553.18 Yes 15 3PL 74.62 7 207444 18.07 553.18 Yes 16 3PL 159.67 7 207444 40.80 553.18 Yes 17 3PL 67.49 7 207444 16.17 553.18 Yes 18 3PL 51.89 7 207444 12.00 553.18 Yes 19 3PL 714.14 7 207444 188.99 553.18 Yes 20 3PL 504.65 7 207444 133.00 553.18 Yes 21 3PL 214.73 7 207444 55.52 553.18 Yes 22 3PL 295.12 7 207444 77.00 553.18 Yes 23 3PL 360.53 7 207444 94.48 553.18 Yes 24 3PL 103.19 7 207444 25.71 553.18 Yes 25 3PL 396.99 7 207444 104.23 553.18 Yes 26 3PL 214.44 7 207444 55.44 553.18 Yes 27 2PPC 3184.21 44 206980 334.75 551.95 Yes 28 2PPC 1113.74 26 206920 150.84 551.79 Yes 29 2PPC 4147.68 44 206966 437.45 551.91 Yes

Copyright © 2007 by the New York State Education Department
131
Appendix G—Derivation of the Generalized SPI Procedure The Standard Performance Index (SPI) is an estimated true score (estimated proportion of total or maximum points obtained) based on the performance of a given examinee for the items in a given learning standard. Assume a k-item test composed of j standards with a maximum possible raw score of n. Also assume that each item contributes to at most one standard, and the kj items in standard j contribute a maximum of nj points. Define Xj as the observed raw score on standard j. The true score is T E X nj j j≡ ( / ). It is assumed that there is information available about the examinee in addition to the standard score, and this information provides a prior distribution for Tj . This prior distribution of Tj for a given examinee is assumed to be ( , )j jr sβ :
g Tr s T T
r sjj j j
rj
s
j j
j j
( )( )! ( )
( )!( )!=
+ − −
− −
− −1 11 1
1 1
(1)
for 0 1; , 0j j jT r s≤ ≤ > . Estimates of rj and sj are derived from IRT (Lord, 1980). It is assumed that X j follows a binomial distribution, given Tj :
1
( ) ( , / )jk
j j j j j i ji
p X x T Binomial n T T n=
= = =∑ ,
where
Ti is the expected value of the score for item i in standard j for a given θ . Given these assumptions, the posterior distribution of Tj , given xj , is
( ) ( , )j j j j jg T X x p qβ= = , (2) with p r xj j j= + (3) and q s n xj j j j= + − . (4) The SPI is defined to be the mean of this posterior distribution:
~Tp
p qjj
j j=
+.
Following Novick and Jackson (1974, p.119), a mastery band is created to be the C% central credibility interval for Tj. It is obtained by identifying the values that place 1 (100 )%2
C− of the ( , )j jp qβ density in each tail of the distribution.

Copyright © 2007 by the New York State Education Department
132
Estimation of the Prior Distribution of jT The k items in each test are scaled together using a generalized IRT model (3PL/2PPC) that fits a three-parameter logistic model (3PL) to the multiple-choice items and a generalized partia-credit model (2PPC) to the constructed-response items (Yen, 1993). The 3PL model is
( )
1( ) ( 1 )1 exp 1.7
ii i i
i i
cP P X cA B
θ θθ
−= = = +
⎡ ⎤+ − −⎣ ⎦ (5)
where Ai is the discrimination, Bi is the location, and ci is the guessing parameter for item i.
A generalization of Master’s (1982) partial-credit (2PPC) model was used for the constructed-response items. The 2PPC model, the same as Muraki’s (1992) “generalized partial credit model,” has been shown to fit response data obtained from a wide variety of mixed-item type achievement tests (Fitzpatrick, Link, Yen, Burket, Ito, and Sykes, 1996). For a constructed-response item with 1i score levels, integer scores are assigned that ranged from 0 to1 1i − :
P P X mz
zim i
im
igg
i( ) ( | )
exp( )
exp( )θ θ= = − =
=∑
1
1
1 , 1, . . .1im = (6)
where
( )1
01
m
ig i ihh
z mα θ γ−
=
′= − −∑ (7)
and γ i0 0= Alpha (αi ) is the item discrimination and gamma (γ ih ) is related to the difficulty of the item levels: the trace lines for adjacent score levels intersect at ih iγ α . Item parameters estimated from the national standardization sample are used to obtain SPI values. ( )Tij θ is the expected score for item i in standard j, and θ is the common trait value to which the items are scaled:
( ) ( ) ( )T m Pij ijmm
i
θ θ= −=∑ 1
1
1
where 1i is the number of score levels in item i, including 0.
Tj , the expected proportion of maximum score for standard j, is
Tn
Tjj
iji
k j
=⎡
⎣⎢⎢
⎤
⎦⎥⎥=
∑11
( )θ . (8)
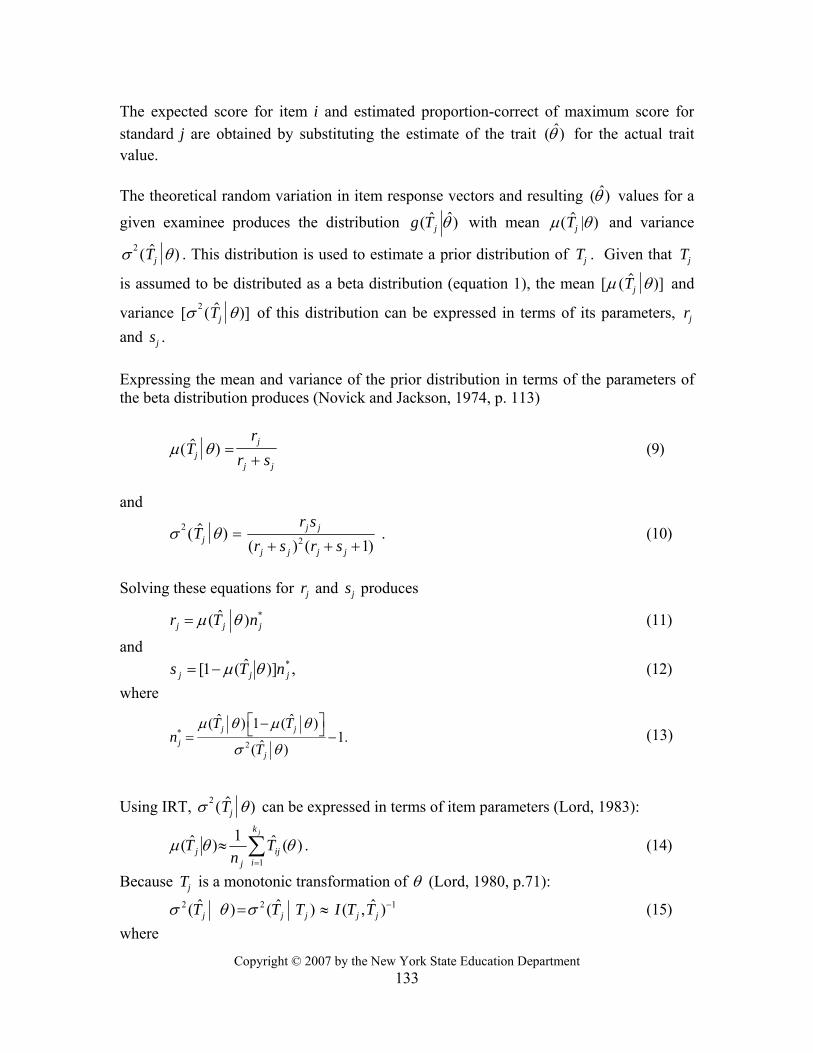
Copyright © 2007 by the New York State Education Department
133
The expected score for item i and estimated proportion-correct of maximum score for standard j are obtained by substituting the estimate of the trait ˆ( )θ for the actual trait value. The theoretical random variation in item response vectors and resulting ˆ( )θ values for a
given examinee produces the distribution ˆˆ( )jg T θ with mean µ θ( $ | )Tj and variance
σ θ2 ( $ )Tj . This distribution is used to estimate a prior distribution of Tj . Given that Tj
is assumed to be distributed as a beta distribution (equation 1), the mean [ ( $ )]µ θTj and
variance [ ( $ )]σ θ2 Tj of this distribution can be expressed in terms of its parameters, rj and sj . Expressing the mean and variance of the prior distribution in terms of the parameters of the beta distribution produces (Novick and Jackson, 1974, p. 113)
µ θ( $ )Tr
r sjj
j j=
+ (9)
and
σ θ2 ( $ )Tj = 2( ) ( 1)j j
j j j j
r sr s r s+ + +
. (10)
Solving these equations for rj and sj produces
*ˆ( )j j jr T nµ θ= (11)
and ,)]ˆ(1[ *
jjj nTs θµ−= (12) where
*2
ˆ ˆ( ) 1 ( )1.ˆ( )
j jj
j
T Tn
T
µ θ µ θ
σ θ
⎡ ⎤−⎣ ⎦= − (13)
Using IRT, σ θ2 ( $ )Tj can be expressed in terms of item parameters (Lord, 1983):
∑=
≈jk
iij
jj T
nT
1
)(ˆ1)ˆ( θθµ . (14)
Because Tj is a monotonic transformation of θ (Lord, 1980, p.71): 2 2 1ˆ ˆ ˆ( ) ( ) ( , )j j j j jT T T I T Tσ θ σ −= ≈ (15)
where
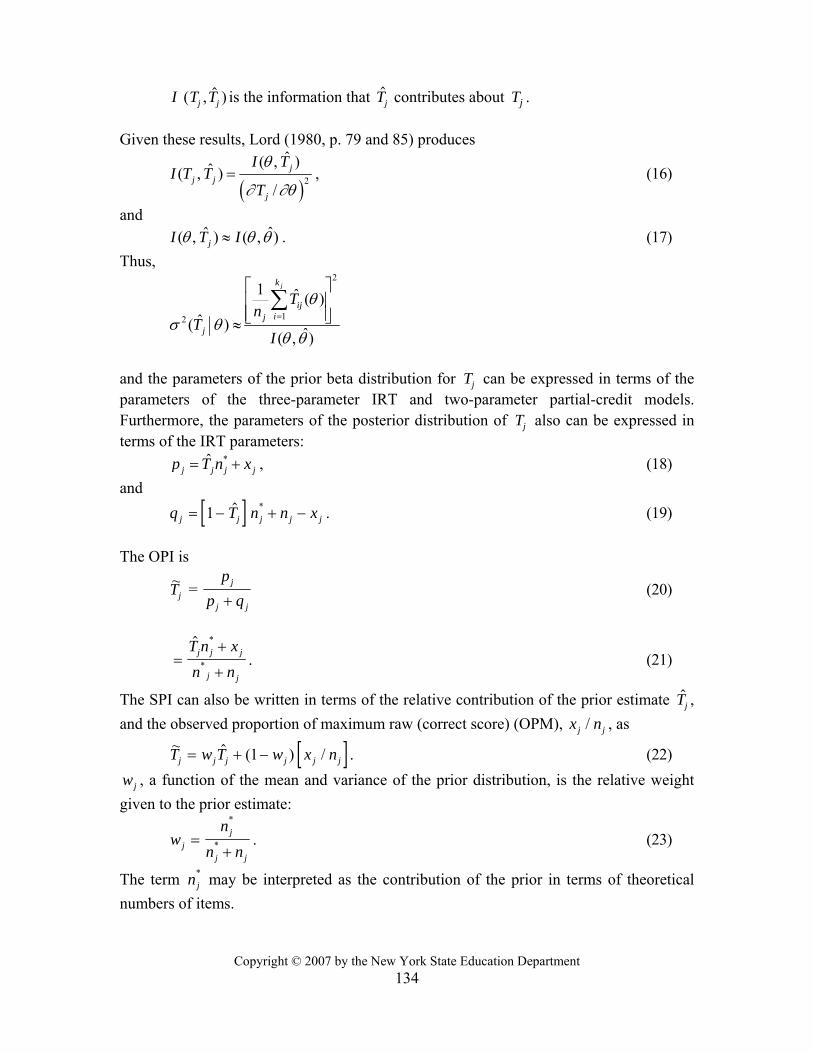
Copyright © 2007 by the New York State Education Department
134
I ( , $ )T Tj j is the information that $Tj contributes about Tj . Given these results, Lord (1980, p. 79 and 85) produces
( )2
ˆ( , )ˆ( , )/
jj j
j
I TI T T
T
θ
∂ ∂θ= , (16)
and ˆˆ( , ) ( , )jI T Iθ θ θ≈ . (17) Thus,
2
12
1 ˆ ( )ˆ( ) ˆ( , )
jk
ijij
j
Tn
TI
θσ θ
θ θ=
⎡ ⎤⎢ ⎥⎢ ⎥⎣ ⎦≈∑
and the parameters of the prior beta distribution for Tj can be expressed in terms of the parameters of the three-parameter IRT and two-parameter partial-credit models. Furthermore, the parameters of the posterior distribution of Tj also can be expressed in terms of the IRT parameters: *ˆ
j j j jp T n x= + , (18) and [ ]q T n n xj j j j j= − + −1 $ * . (19) The OPI is
~Tj = p
p qj
j j+ (20)
=+
+
$ *
*
T n xn n
j j j
j j
. (21)
The SPI can also be written in terms of the relative contribution of the prior estimate $Tj , and the observed proportion of maximum raw (correct score) (OPM), x nj j/ , as
[ ]~ $ ( ) /T w T w x nj j j j j j= + −1 . (22) wj , a function of the mean and variance of the prior distribution, is the relative weight given to the prior estimate:
wn
n njj
j j
=+
*
* . (23)
The term nj* may be interpreted as the contribution of the prior in terms of theoretical
numbers of items.

Copyright © 2007 by the New York State Education Department
135
Check on Consistency and Adjustment of Weight Given to Prior The item responses are assumed to be described by ˆ( )iP θ or ˆ( )imP θ , depending on the type of item. Even if the IRT model accurately described item performance over examinees, their item responses grouped by standard may be multidimensional. For example, a particular examinee may be able to perform difficult addition but not easy subtraction. Under these circumstances, it is not appropriate to pool the prior estimate, $Tj , with x nj j/ . In calculating the SPI, the following statistic was used to identify
examinees with unexpected performance on the standards in a test:
Q nxn
T T Tjj
jj
j
J
j j= − −=∑ ( $ ) /( $ ( $ ))2
11 . (24)
If 2 ( , .10)Q Jχ≤ , the weight, wj , is computed and the SPI is produced. If 2 ( , .10)Q Jχ> , nj
* and subsequently wj is set equal to 0 and the OPM is used as the estimate of standard performance. As previously noted, the prior is estimated using an ability estimate based on responses to all the items (including the items of standard j) and hence is not independent of X j . An adjustment for the overlapping information that requires minimal computation is to multiply the test information in equation 5 by the factor ( ) /n n nj− . The application of this factor produces an “adjusted” SPI estimate that can be compared to the “unadjusted” estimate. Possible Violations of the Assumptions Even if the IRT model fits the test items, the responses for a given examinee, grouped by standard, may be multidimensional. In these cases, it would not be appropriate to pool the prior estimate, $Tj , with x nj j/ . A chi-square fit statistic is used to evaluate the observed proportion of maximum raw score (OPM) relative to that predicted for the items in the standard on the basis of the student’s overall trait estimate. If the chi-square is significant, the prior estimate is not used and the OPM obtained becomes the student’s standard score. If the items in the standard do not permit guessing, it is reasonable to assume $Tj , the expected proportion correct of maximum score for a standard, will be greater or equal to zero. If correct guessing is possible, as it is with selected-response items, there will be a non-zero lower limit to $Tj , and a three-parameter beta distribution in which $Tj is greater than or equal to this lower limit (Johnson and Kotz, 1979, p. 37) would be more appropriate. The use of the two-parameter beta distribution would tend to underestimate Tj among very low-scoring examinees. Yen working with tests containing exclusively multiple-choice items, found that there does not appear to be a practical importance to this underestimation (Yen, 1987). The impact of any such effect would be reduced as the proportion of constructed-response items in the test increases. The size of this effect, nonetheless, was evaluated using simulations (Yen, Sykes, Ito, and Julian 1997).

Copyright © 2007 by the New York State Education Department
136
The SPI procedure assumes that p X Tj j( ) is a binomial distribution. This assumption is appropriate only when all the items in a standard have the same Bernoulli item response function. Not only do real items differ in difficulty, but when there are mixed-item types, X j is not the sum of nj independent Bernoulli variables. It is instead the total raw score. In essence, the simplifying assumption has been made that each constructed-response item with a maximum score of 1 1j − is the sum of 1 1j − independent Bernoulli variables. Thus, a complex compound distribution is theoretically more applicable than the binomial. Given the complexity of working with such a model, it appears valuable to determine if the simpler model described here is sufficiently accurate to be useful. Finally, because the prior estimate of ˆ,j jT T , is based on performance on the entire test, including standard j, the prior estimate is not independent of X j . The smaller the ratio n nj / , the less impact this dependence will have. The effect of the overlapping information would be to understate the width of the credibility interval. The extent to which the size of the credibility interval is too small was examined (Yen et al., 1997) by simulating standards that contained varying proportions of the total test points.

Copyright © 2007 by the New York State Education Department
137
Appendix H—Derivation of Classification Consistency and Accuracy
Classification Consistency Assume that θ is a single latent trait measured by a test and denoteΦ as a latent random variable. When a test X consists of K items and its maximum number-correct score is N, the marginal probability of the number-correct (NC) score x is
∫ ==Φ=== NxdgxXPxXP ,...,1,0,)()|()( θθθ
where )(θg is the density of θ .
In this report, the marginal distribution )( xXP = is denoted as )(xf , and the conditional error distribution )|( θ=Φ= xXP is denoted as )|( θxf . It is assumed that examinees are classified into one of H mutually exclusive categories on the basis of predetermined H-1 observed score cutoffs, C1, C2, …, CH-1. Let hL represent the h th category into which examinees with hh CXC ≤≤−1 are classified. 00 =C and =HC the maximum number-correct score. Then, the conditional and marginal probabilities of each category classification are as follows:
∑−
−=
=∈1
1
)|()|(h
h
C
Cxh xfLXP θθ , h =1, 2,…, H.
θθθ dgxfLXPh
h
C
Cxh )()|()(
1
1
∫ ∑−
−=
=∈ , h =1, 2,…, H.
Because obtaining test scores from two independent administrations of New York State tests was not feasible due to item release after each operational administration, a psychometric model was used to obtain the estimated classification consistency indices using test scores from a single administration. Based on the psychometric model, a symmetric H*H contingency table can be constructed. The elements of H*H contingency table consist of the joint probabilities of the row and column observed category classifications. That two administrations are independent implies that if X1 and X2 represent the raw score random variables on the two administrations, then, conditioned on θ , X1 and X2 are independent and identically distributed. Consequently, the conditional bivariate distribution of X1 and X2 is
)|()|()|,( 2121 θθθ xfxfxxf = .
The marginal bivariate distribution of X1 and X2 can be expressed as follows:

Copyright © 2007 by the New York State Education Department
138
∫= .)()|,(),( 2121 θθθ dfxxfxxf
Consistent classification means that both X1 and X2 fall in the same category. The conditional probability of falling in the same category on the two administrations is
2
121
1
11
)|()|,( ⎥⎦
⎤⎢⎣
⎡=∈∈ ∑
−
−=
h
h
C
Cxhh xfLXLXP θθ , h =1, 2,…, H.
The agreement index P , conditional on theta, is obtained by
∑=
∈∈=H
hhh LXLXPP
121 )|,()( θθ .
The agreement index (classification consistency) can be computed as
∫= )()()( θθθ dgPP .
The probability of consistent classification by chance, CP , is the sum of squared marginal probabilities of each category classification.
CP = [ ]2
11
121 )()()( ∑∑
==
∈=∈∈H
hh
H
hhh LXPLXPLXP .
Then, the coefficient kappa (Cohen, 1960) is
C
C
PPP
k−−
=1
Classification Accuracy
Let wΓ denote true category. When an examinee has an observed score, hLx∈ ( h =1, 2,…, H), and a latent score , ww (Γ∈θ =1, 2,…, H), an accurate classification is made when h = w . The conditional probability of accurate classification is
),|()( θθγ wLXP ∈=
where
w is the category such that wΓ∈θ .
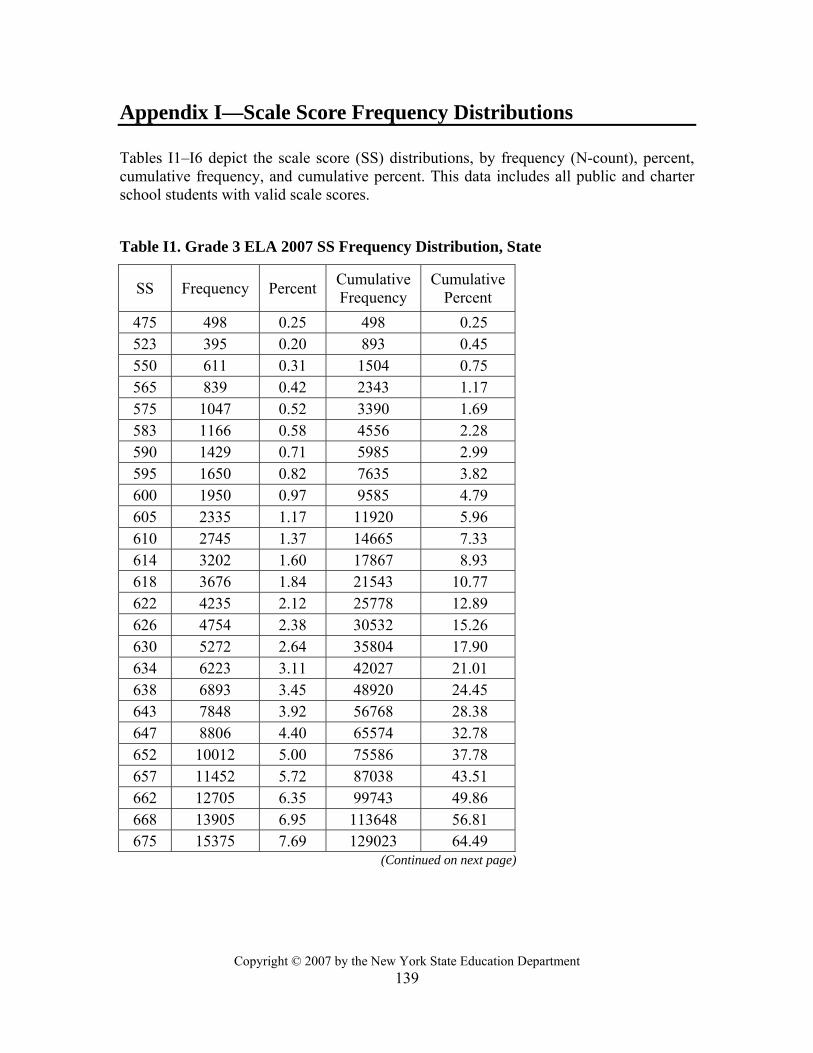
Copyright © 2007 by the New York State Education Department
139
Appendix I—Scale Score Frequency Distributions Tables I1–I6 depict the scale score (SS) distributions, by frequency (N-count), percent, cumulative frequency, and cumulative percent. This data includes all public and charter school students with valid scale scores. Table I1. Grade 3 ELA 2007 SS Frequency Distribution, State
SS Frequency Percent Cumulative Frequency
Cumulative Percent
475 498 0.25 498 0.25 523 395 0.20 893 0.45 550 611 0.31 1504 0.75 565 839 0.42 2343 1.17 575 1047 0.52 3390 1.69 583 1166 0.58 4556 2.28 590 1429 0.71 5985 2.99 595 1650 0.82 7635 3.82 600 1950 0.97 9585 4.79 605 2335 1.17 11920 5.96 610 2745 1.37 14665 7.33 614 3202 1.60 17867 8.93 618 3676 1.84 21543 10.77 622 4235 2.12 25778 12.89 626 4754 2.38 30532 15.26 630 5272 2.64 35804 17.90 634 6223 3.11 42027 21.01 638 6893 3.45 48920 24.45 643 7848 3.92 56768 28.38 647 8806 4.40 65574 32.78 652 10012 5.00 75586 37.78 657 11452 5.72 87038 43.51 662 12705 6.35 99743 49.86 668 13905 6.95 113648 56.81 675 15375 7.69 129023 64.49
(Continued on next page)

Copyright © 2007 by the New York State Education Department
140
Table I1. Grade 3 ELA 2007 SS Frequency Distribution, State (cont.)
SS Frequency Percent Cumulative Frequency
Cumulative Percent
684 16755 8.38 145778 72.87 694 17578 8.79 163356 81.66 708 16857 8.43 180213 90.08 732 13234 6.62 193447 96.70 780 6606 3.30 200053 100.00
Table I2. Grade 4 ELA 2007 SS Frequency Distribution, State
SS Frequency Percent Cumulative Frequency
Cumulative Percent
430 478 0.24 478 0.24 511 372 0.19 850 0.43 536 471 0.24 1321 0.66 550 590 0.30 1911 0.96 561 815 0.41 2726 1.37 569 860 0.43 3586 1.80 577 1005 0.50 4591 2.30 583 1163 0.58 5754 2.88 589 1260 0.63 7014 3.51 594 1407 0.70 8421 4.22 599 1508 0.76 9929 4.97 603 1731 0.87 11660 5.84 607 1837 0.92 13497 6.76 611 2105 1.05 15602 7.82 615 2279 1.14 17881 8.96 618 2602 1.30 20483 10.26 621 2934 1.47 23417 11.73 625 3273 1.64 26690 13.37 628 3569 1.79 30259 15.16 631 4100 2.05 34359 17.22 635 4652 2.33 39011 19.55 638 5179 2.59 44190 22.14 641 5804 2.91 49994 25.05
(Continued on next page)

Copyright © 2007 by the New York State Education Department
141
Table I2. Grade 4 ELA 2007 SS Frequency Distribution, State (cont.)
SS Frequency Percent Cumulative Frequency
Cumulative Percent
645 6554 3.28 56548 28.33 649 7265 3.64 63813 31.97 652 7921 3.97 71734 35.94 656 8830 4.42 80564 40.37 660 9796 4.91 90360 45.27 664 10754 5.39 101114 50.66 669 11709 5.87 112823 56.53 674 12209 6.12 125032 62.65 679 12878 6.45 137910 69.10 685 13024 6.53 150934 75.62 692 12475 6.25 163409 81.87 699 10910 5.47 174319 87.34 709 8867 4.44 183186 91.78 721 7220 3.62 190406 95.40 739 6312 3.16 196718 98.56 775 2869 1.44 199587 100.00
Table I3. Grade 5 ELA 2007 SS Frequency Distribution, State
SS Frequency Percent Cumulative Frequency
Cumulative Percent
495 1294 0.64 1294 0.64 547 908 0.45 2202 1.08 572 1191 0.58 3393 1.67 585 1337 0.66 4730 2.32 594 1547 0.76 6277 3.08 601 1754 0.86 8031 3.94 607 2039 1.00 10070 4.94 612 2381 1.17 12451 6.11 617 2909 1.43 15360 7.54 621 3305 1.62 18665 9.17 626 3957 1.94 22622 11.11 630 4634 2.28 27256 13.38
(Continued on next page)

Copyright © 2007 by the New York State Education Department
142
Table I3. Grade 5 ELA 2007 SS Frequency Distribution, State (cont.)
SS Frequency Percent Cumulative Frequency
Cumulative Percent
634 5376 2.64 32632 16.02 638 6361 3.12 38993 19.15 641 7272 3.57 46265 22.72 645 8561 4.20 54826 26.92 649 9879 4.85 64705 31.77 654 11574 5.68 76279 37.46 658 13342 6.55 89621 44.01 663 14874 7.30 104495 51.31 669 16819 8.26 121314 59.57 675 17859 8.77 139173 68.34 683 18399 9.04 157572 77.38 692 17613 8.65 175185 86.03 705 14469 7.11 189654 93.13 727 9911 4.87 199565 98.00 795 4076 2.00 203641 100.00
Table I4. Grade 6 ELA 2007 SS Frequency Distribution, State
SS Frequency Percent Cumulative Frequency
Cumulative Percent
480 202 0.10 202 0.10 529 179 0.09 381 0.19 551 310 0.15 691 0.34 564 487 0.24 1178 0.57 574 700 0.34 1878 0.91 582 852 0.41 2730 1.33 588 1058 0.52 3788 1.84 594 1357 0.66 5145 2.51 599 1582 0.77 6727 3.28 604 1709 0.83 8436 4.11 608 1998 0.97 10434 5.08 611 2183 1.06 12617 6.14 615 2464 1.20 15081 7.34
(Continued on next page)

Copyright © 2007 by the New York State Education Department
143
Table I4. Grade 6 ELA 2007 SS Frequency Distribution, State (cont.)
SS Frequency Percent Cumulative Frequency
Cumulative Percent
618 2818 1.37 17899 8.72 622 3298 1.61 21197 10.32 625 3678 1.79 24875 12.11 628 4221 2.06 29096 14.17 631 4730 2.30 33826 16.47 634 5384 2.62 39210 19.10 637 5890 2.87 45100 21.96 640 6431 3.13 51531 25.10 643 7119 3.47 58650 28.56 646 8135 3.96 66785 32.52 649 8584 4.18 75369 36.70 653 9797 4.77 85166 41.48 656 10653 5.19 95819 46.66 660 11432 5.57 107251 52.23 665 12553 6.11 119804 58.34 669 13358 6.51 133162 64.85 674 13828 6.73 146990 71.58 680 13974 6.81 160964 78.39 687 13348 6.50 174312 84.89 696 11727 5.71 186039 90.60 708 9540 4.65 195579 95.25 726 6585 3.21 202164 98.45 785 3177 1.55 205341 100.00
Table I5. Grade 7 ELA 2007 SS Frequency Distribution, State
SS Frequency Percent Cumulative Frequency
Cumulative Percent
470 1232 0.58 1232 0.58 517 713 0.33 1945 0.91 544 939 0.44 2884 1.35 558 1037 0.49 3921 1.84 568 1146 0.54 5067 2.38
(Continued on next page)

Copyright © 2007 by the New York State Education Department
144
Table I5. Grade 7 ELA 2007 SS Frequency Distribution, State (cont.)
SS Frequency Percent Cumulative Frequency
Cumulative Percent
575 1307 0.61 6374 2.99 582 1337 0.63 7711 3.62 587 1570 0.74 9281 4.35 592 1637 0.77 10918 5.12 596 1813 0.85 12731 5.97 600 2030 0.95 14761 6.92 604 2344 1.10 17105 8.02 608 2491 1.17 19596 9.19 611 2724 1.28 22320 10.47 614 3247 1.52 25567 11.99 618 3539 1.66 29106 13.65 621 3891 1.82 32997 15.47 624 4587 2.15 37584 17.63 628 5050 2.37 42634 19.99 631 5788 2.71 48422 22.71 634 6497 3.05 54919 25.75 638 7339 3.44 62258 29.20 641 8166 3.83 70424 33.03 645 9193 4.31 79617 37.34 649 10213 4.79 89830 42.13 653 11599 5.44 101429 47.57 657 12850 6.03 114279 53.59 662 14014 6.57 128293 60.16 667 15053 7.06 143346 67.22 673 15499 7.27 158845 74.49 680 15569 7.30 174414 81.79 688 14169 6.64 188583 88.44 700 11862 5.56 200445 94.00 716 7925 3.72 208370 97.72 745 3919 1.84 212289 99.55 790 952 0.45 213241 100.00

Copyright © 2007 by the New York State Education Department
145
Table I6. Grade 8 ELA 2007 SS Frequency Distribution, State
SS Frequency Percent Cumulative Frequency
Cumulative Percent
430 212 0.10 212 0.10 486 153 0.07 365 0.17 524 251 0.12 616 0.28 539 329 0.15 945 0.44 548 474 0.22 1419 0.66 556 602 0.28 2021 0.94 563 664 0.31 2685 1.24 569 797 0.37 3482 1.61 574 931 0.43 4413 2.04 579 1109 0.51 5522 2.55 583 1136 0.53 6658 3.08 587 1401 0.65 8059 3.73 591 1572 0.73 9631 4.46 595 1761 0.81 11392 5.27 598 2028 0.94 13420 6.21 602 2264 1.05 15684 7.26 605 2658 1.23 18342 8.49 609 2980 1.38 21322 9.86 612 3325 1.54 24647 11.40 615 3866 1.79 28513 13.19 619 4390 2.03 32903 15.22 622 5148 2.38 38051 17.60 625 5752 2.66 43803 20.27 629 6438 2.98 50241 23.24 632 7194 3.33 57435 26.57 635 7862 3.64 65297 30.21 639 8569 3.96 73866 34.17 643 9112 4.22 82978 38.39 646 9870 4.57 92848 42.96 650 10300 4.77 103148 47.72 654 10749 4.97 113897 52.70 659 11339 5.25 125236 57.94 663 11590 5.36 136826 63.30 668 11794 5.46 148620 68.76
(Continued on next page)

Copyright © 2007 by the New York State Education Department
146
Table I6. Grade 8 ELA 2007 SS Frequency Distribution, State (cont.)
SS N-count Percent Cumulative Frequency
Cumulative Percent
673 11782 5.45 160402 74.21 679 11776 5.45 172178 79.66 686 11198 5.18 183376 84.84 694 10643 4.92 194019 89.77 706 9873 4.57 203892 94.33 726 8231 3.81 212123 98.14 790 4018 1.86 216141 100.00

Copyright © 2007 by the New York State Education Department
147
References American Educational Research Association, American Psychological Association,
and National Council on Measurement in Education. Standards for educational and psychological testing.: American Psychological Association, Inc. Washington, D.C. 1999.
Bock, R. D. 1972. Estimating item parameters and latent ability when responses are scored in two or more nominal categories. Psychometrika 37: 29–51.
Bock, R. D. and M. Aitkin. 1981. Marginal maximum likelihood estimation of item parameters: An application of an EM algorithm. Psychometrika 46: 443–459.
Burket, G. R. 1988. ITEMWIN [Computer program]. Burket, G. R. 2002. PARDUX [Computer program]. Cattell, R.B. 1966. "The Scree Test for the Number of Factors," Multivariate
Behavioral Research 1: 245–276. Cronbach, L. J. 1951. Coefficient alpha and the internal structure of tests.
Psychometrika 16: 297–334. Dorans, N. J., A. P. Schmitt, and C.A. Bleistein.1992. The standardization approach to
assessing comprehensive differential item functioning. Journal of Educational Measurement 29: 309–319.
Fitzpatrick, A. R. 1990. Status report on the results of preliminary analysis of dichotomous and multi-level items using the PARMATE program.
Fitzpatrick, A. R. 1994. Two studies comparing parameter estimates produced by PARDUX and BIGSTEPS.
Fitzpatrick, A. R. and M. W. Julian. 1996. Two studies comparing the parameter estimates produced by PARDUX and PARSCLE. Monterey, CA: CTB/McGraw-Hill.
Fitzpatrick, A. R., V. Link, W. M. Yen, G. Burket, K. Ito, and R. Sykes. 1996. Scaling performance assessments: A comparison between one-parameter and two-parameter partial credit models. Journal of Educational Measurement 33: 291–314.
Green, D. R., W. M. Yen, and G. R. Burket. 1989. Experiences in the application of item response theory in test construction. Applied Measurement in Education 2: 297–312.
Huynh, H. and C. Schneider. 2004. Vertically moderated standards as an alternative to vertical scaling: assumptions, practices, and an odyssey through NAEP. Paper presented at the National Conference on Large-Scale Assessment. Boston, MA, June 21, 2004.
Jensen, A. R. 1980. Bias in mental testing. New York: Free Press. Johnson, N. L. and S. Kotz. 1970. Distributions in statistics: continuous univariate
distributions, Vol. 2. New York: John Wiley. Kim, D. 2004. WLCLASS [Computer program]. Kolen, M. J. and R. L. Brennan. 1995. Test equating. Methods and practices. New York,
NY: Springer-Verlag.
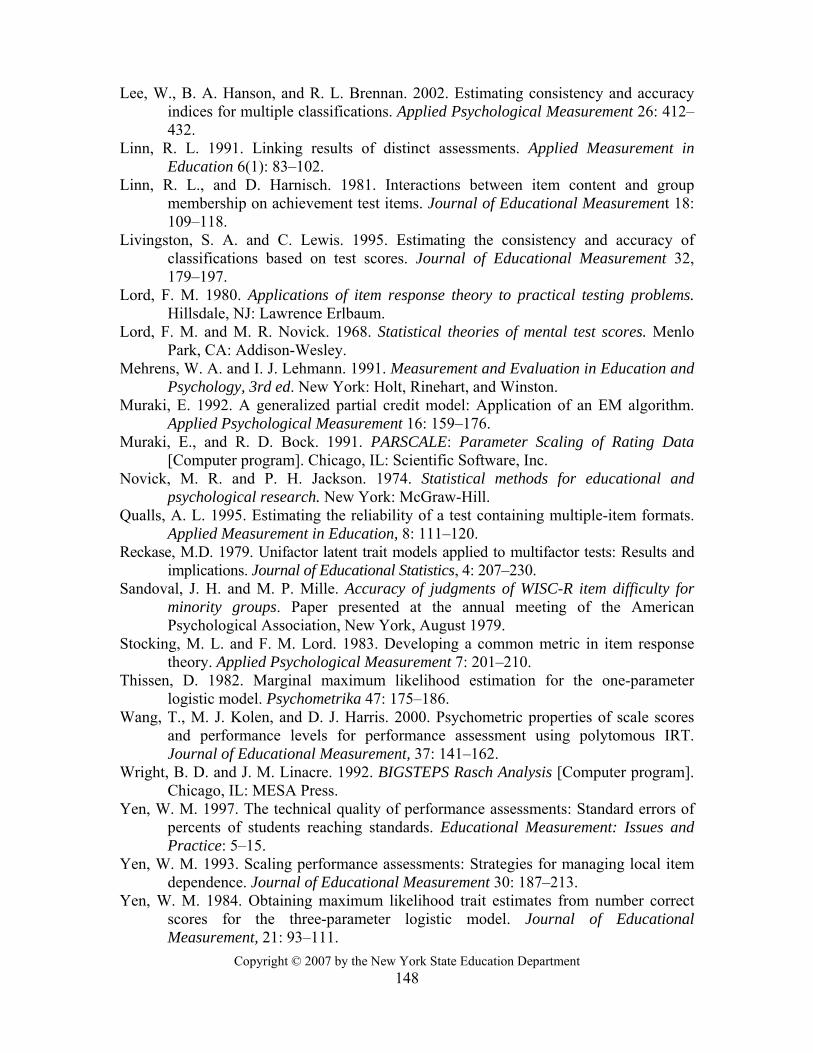
Copyright © 2007 by the New York State Education Department
148
Lee, W., B. A. Hanson, and R. L. Brennan. 2002. Estimating consistency and accuracy indices for multiple classifications. Applied Psychological Measurement 26: 412–432.
Linn, R. L. 1991. Linking results of distinct assessments. Applied Measurement in Education 6(1): 83–102.
Linn, R. L., and D. Harnisch. 1981. Interactions between item content and group membership on achievement test items. Journal of Educational Measurement 18: 109–118.
Livingston, S. A. and C. Lewis. 1995. Estimating the consistency and accuracy of classifications based on test scores. Journal of Educational Measurement 32, 179–197.
Lord, F. M. 1980. Applications of item response theory to practical testing problems. Hillsdale, NJ: Lawrence Erlbaum.
Lord, F. M. and M. R. Novick. 1968. Statistical theories of mental test scores. Menlo Park, CA: Addison-Wesley.
Mehrens, W. A. and I. J. Lehmann. 1991. Measurement and Evaluation in Education and Psychology, 3rd ed. New York: Holt, Rinehart, and Winston.
Muraki, E. 1992. A generalized partial credit model: Application of an EM algorithm. Applied Psychological Measurement 16: 159–176.
Muraki, E., and R. D. Bock. 1991. PARSCALE: Parameter Scaling of Rating Data [Computer program]. Chicago, IL: Scientific Software, Inc.
Novick, M. R. and P. H. Jackson. 1974. Statistical methods for educational and psychological research. New York: McGraw-Hill.
Qualls, A. L. 1995. Estimating the reliability of a test containing multiple-item formats. Applied Measurement in Education, 8: 111–120.
Reckase, M.D. 1979. Unifactor latent trait models applied to multifactor tests: Results and implications. Journal of Educational Statistics, 4: 207–230.
Sandoval, J. H. and M. P. Mille. Accuracy of judgments of WISC-R item difficulty for minority groups. Paper presented at the annual meeting of the American Psychological Association, New York, August 1979.
Stocking, M. L. and F. M. Lord. 1983. Developing a common metric in item response theory. Applied Psychological Measurement 7: 201–210.
Thissen, D. 1982. Marginal maximum likelihood estimation for the one-parameter logistic model. Psychometrika 47: 175–186.
Wang, T., M. J. Kolen, and D. J. Harris. 2000. Psychometric properties of scale scores and performance levels for performance assessment using polytomous IRT. Journal of Educational Measurement, 37: 141–162.
Wright, B. D. and J. M. Linacre. 1992. BIGSTEPS Rasch Analysis [Computer program]. Chicago, IL: MESA Press.
Yen, W. M. 1997. The technical quality of performance assessments: Standard errors of percents of students reaching standards. Educational Measurement: Issues and Practice: 5–15.
Yen, W. M. 1993. Scaling performance assessments: Strategies for managing local item dependence. Journal of Educational Measurement 30: 187–213.
Yen, W. M. 1984. Obtaining maximum likelihood trait estimates from number correct scores for the three-parameter logistic model. Journal of Educational Measurement, 21: 93–111.

Copyright © 2007 by the New York State Education Department
149
Yen, W. M. 1981. Using simulation results to choose a latent trait model. Applied Psychological Measurement 5: 245–262.
Yen, W. M., R. C. Sykes, K. Ito, and M. Julian. A Bayesian/IRT index of objective performance for tests with mixed-item types. Paper presented at the annual meeting of the National Council on Measurement in Education, Chicago, IL, March 1997.
Zwick, R., J. R. Donoghue, and A. Grima. 1993. Assessment of differential item functioning for performance tasks. Journal of Educational Measurement 36: 225–33.