new york state regents examination in algebra i (common
TRANSCRIPT

New York State Regents Examination in Algebra I (Common Core)
Performance Level Descriptions
August 2014

THE STATE EDUCATION DEPARTMENT / THE UNIVERSITY OF THE STATE OF NEW YORK / ALBANY, NY 12234
Algebra I Performance Level Descriptions
Policy‐Level Performance Level Definitions For each subject area, there are students performing along a proficiency continuum with regard to the skills and knowledge necessary to meet the demands of Common Core Learning Standards for Mathematics. There are students who are exceed the expectations of the standards, students meet the expectations, students who partially meet the expectations, and students who do not demonstrate sufficient knowledge or skills required for any performance level. New York State assessments are designed to classify students into one of four proficiency categories; these proficiency categories are defined as:
NYS Level 5 Students performing at this level exceed Common Core expectations.
NYS Level 4 Students performing at this level meet Common Core expectations.
NYS Level 3 Students performing at this level partially meet Common Core expectations (required for current Regents Diploma purposes).
NYS Level 2 (Safety Net) Students performing at this level partially meet Common Core expectations (required for Local Diploma purposes).
NYS Level 1 Students performing at this level do not demonstrate the knowledge and skills required for NYS Level 2.
Performance Level Descriptions Performance Level Descriptions (PLDs) describe the range of knowledge and skills students should demonstrate at a given performance level.
How were the PLDs developed? The New York State Education Department (NYSED) convened the state's English Language Arts (ELA) and Math Content Advisory Panels (CAPs) to develop the initial draft PLDs for Algebra I and English Language Arts. The CAPs are classroom teachers from elementary, middle and high school, school and district administrators, English Language Learner (ELL) and students with disabilities (SWD) specialists, and higher education faculty members from across the state.
The draft PLDs from the CAPs then went through additional rounds of review and edit from a number of NYS‐certified educators, content specialists, and assessment experts under NYSED supervision. In developing PLDs, participants considered policy‐level definitions of the performance levels (see above) and the expectations for each grade level in the Common Core Learning Standards.

THE STATE EDUCATION DEPARTMENT / THE UNIVERSITY OF THE STATE OF NEW YORK / ALBANY, NY 12234
How are the PLDs used in Assessment? PLDs are essential in setting standards for the New York State Regents Examinations. Standard setting panelists use PLDs to determine the threshold expectations for students to demonstrate the knowledge and skills necessary to attain just barely a Level 2, Level 3, Level 4, or Level 5 on the assessment. These discussions then influence the panelists in establishing the cut scores on the assessment. PLDs are also used to inform item development, as each test needs questions that distinguish performance all along the continuum.
How can the PLDs be used in Instruction? PLDs help communicate to students, families, educators and the public the specific knowledge and skills expected of students to demonstrate proficiency and can serve a number of purposes in classroom instruction. They are the foundation of rich discussion around what students need to do to perform at higher levels and to explain the progression of learning within a subject area. We encourage the use of the PLDs for a variety of purposes, such as differentiating instruction to maximize individual student outcomes, creating classroom assessments and rubrics to help in identifying target performance levels for individual or groups of students, and tracking student growth along the proficiency continuum as described by the PLDs. In order to facilitate the use of the PLDs in instruction, the skills differentiating performance levels have been identified using bold text.

Algebra I Performance Level Descriptions
Domain NYS Level 5 NYS Level 4 NYS Level 3 NYS Level 2 NYS Level 1 The Real Generalize and explain Calculate sums and Calculate sums and Distinguish between Identify and order Number when the sums and products of two rational products of two rational rational and irrational rational numbers on a System products are rational or and/or irrational or two irrational numbers. number line. (N-RN) irrational using abstract
representations.
Justify the conjecture using concrete examples.
numbers.
Explain when sums and products are rational and irrational using concrete examples.
numbers.
Determine whether sums and products are rational or irrational.
Quantities (N-Q)
Compare and interpret different representations of the accuracy of a quantity and justify choice of units and quantities.
Recognize and explain how alteration of units would affect solutions.
Choose and interpret units consistently.
Choose and interpret the scale and the origin in graphs and data displays.
Choose a level of accuracy appropriate to context and identify limitations on measurement when reporting quantities.
Select or define appropriate quantities for the purpose of modeling.
Interpret units selectively.
Given a graph or data display, interpret the scale and the origin.
Choose a level of accuracy appropriate to context when reporting quantities.
Choose units for the solutions of problems.
Given a graph or data display, identify the scale and the origin.
Identify the indicated level of accuracy and round to this indicated level of accuracy.
Identify units relevant to a context.
Given a graph or data display, identify the scale or the origin.
4

Algebra I Performance Level Descriptions
Domain NYS Level 5 NYS Level 4 NYS Level 3 NYS Level 2 NYS Level 1 Seeing Structure in Expressions (A-SSE)
Explain different interpretations of expressions.
Find the most appropriate form of a quadratic function to solve real-world or mathematical problems.
Determine the maximum/minimum of a quadratic function with a leading coefficient greater than one by completing the square.
Interpret parts of an expression in terms of its context and rewrite it to reveal information about the context.
Identify algebraic factors of an expression and factor a quadratic expression with a leading integer coefficient greater than one to solve real-world or mathematical problems.
Determine the maximum or minimum of a quadratic function with a leading coefficient of one by completing the square.
Identify the relationship among terms, variables, and factors; describe and classify polynomials; find appropriate equivalent representations.
Distinguish between linear, quadratic, and exponential expressions.
Factor a quadratic expression with a leading coefficient of one to solve real-world or mathematical problems.
Given a quadratic expression, identify an equivalent expression in completed-square form.
Identify terms, variables, and factors of an expression. Identify linear or quadratic equivalent expressions.
Distinguish between linear and quadratic expressions.
Factor an expression using the greatest common factor.
Find the zeros of a factored quadratic function.
Provide evidence that two expressions are equivalent by substituting numerical values for variables.
5

Algebra I Performance Level Descriptions
Domain NYS Level 5 NYS Level 4 NYS Level 3 NYS Level 2 NYS Level 1 Arithmetic Explain and/or show Perform addition, Perform addition, Perform addition and Perform addition with with generally that subtraction, and subtraction, and subtraction with linear linear expressions. Polynomials polynomials are closed multiplication with multiplication on expressions. and Rational under addition, polynomials and polynomials. Expressions subtraction, and demonstrate that (A-APR) multiplication. polynomials are closed
under the three operations.
Determine and use the zeros of any polynomial function to sketch its graph, generate graphs and expressions for multiple functions, given particular zeros, and explain the significance of the zeros.
Identify zeros of quadratic and cubic polynomials and use the zeros to graph the function.
Explain the relationship between a function and its zeros.
Identify zeros of quadratic polynomials and use the zeros to graph the function.
Given a linear polynomial, construct a graph of the function and identify its zero.
Creating Create equations and Create equations and Create linear equations Create linear equations Identify an unknown Equations inequalities in one or two inequalities in one or and linear inequalities in one variable and use quantity from a context. (A-CED) variables and use them to
solve problems (i.e., linear, quadratic, or exponential equations).
Explain how a created equation or inequality models a context.
two variables and use them to solve problems (i.e., linear, quadratic, or exponential equations with integer exponents).
in one variable to solve problems.
them to solve problems.
6

Algebra I Performance Level Descriptions
Domain NYS Level 5 NYS Level 4 NYS Level 3 NYS Level 2 NYS Level 1 (A-CED continued)
Compare different models of the same context and describe limitations of models.
Graph linear, quadratic, and exponential equations and linear inequalities in two variables.
Distinguish between a linear, quadratic, and exponential function, given multiple representations.
Represent constraints (i.e., real world or mathematical) by equations or inequalities.
Graph linear equations and inequalities in two variables to solve problems.
Graph quadratic and exponential equations on coordinate axes with labels and scales.
Graph linear equations on coordinate axes with labels and scales.
Distinguish between a linear, quadratic, and exponential function given the same representation (i.e., algebraic, verbal, graph, table).
Graph integer ordered pairs from a given table of x- and y-values.
Distinguish between a linear and nonlinear function.
Rearrange complex formulas to highlight a quantity of interest.
Rearrange simple formulas to highlight a quantity of interest.
7

Algebra I Performance Level Descriptions
Domain NYS Level 5 NYS Level 4 NYS Level 3 NYS Level 2 NYS Level 1 Reasoning with Equations and Inequalities (A-REI)
Predict, without solving, when a quadratic equation will have no real solutions and explain reasoning with algebraic or graphical evidence.
Solve linear equations and inequalities and construct a viable argument to justify the advantages of one particular method over another.
Solve quadratic equations in one variable and recognize cases in which a quadratic equation has no real solutions.
Solve linear equations and inequalities in one variable, including equations with coefficients represented by letters.
Solve systems of linear equations exactly and approximately (e.g., with graphs), focusing on pairs of linear equations in two variables.
Solve quadratic equations in one variable with real roots using an appropriate method.
Solve linear equations and inequalities in one variable.
Verify that a number is a solution to a quadratic equation.
Solve one- and two-step linear equations in one variable.
Given a system of linear equations in two variables and the solution, verify the solution algebraically.
Select solution strategies.
Verify a solution to one- and two-step linear equations in one variable.
Identify the solution to a system of linear equations from a graph.
8

Algebra I Performance Level Descriptions
Domain NYS Level 5 NYS Level 4 NYS Level 3 NYS Level 2 NYS Level 1 (A-REI Explain why the graph of Explain why the x- Given a system of linear Approximate the Given a graph of y = g(x) continued) an equation in two
variables is the set of all its solutions. Represent coincidental linear equations as multiples of each other.
coordinates of the points where the graphs of the equations y = f(x) and y = g(x) intersect are the solutions of the equation f(x) = g(x). (Functions are limited to linear, polynomial, rational, or absolute value.)
equations with integer coefficients in two variables, solve the system exactly or approximately. Approximate the solution(s) to f(x) = g(x), where f(x) and g(x) are first- and second-degree polynomial functions.
solution(s) to f(x) = g(x), where f(x) and g(x) are linear functions.
and y = f(x) (not limited to linear functions), use integer-valued coordinates to name a point of intersection.
Explain why there are multiple solutions to a system of inequalities.
Graph the solutions to a linear inequality in two variables as a half-plane and graph the solution set to a system of linear inequalities in two variables as the intersection of the corresponding half-planes.
Graph the solutions to a linear inequality in two variables as a half-plane using a graphing calculator.
Given the graph of an inequality (or system of inequalities), generate a point(s) in the solution set.
Given the graph of an inequality (or system of inequalities), identify whether a point is in the solution set.
Interpreting Functions (F-IF)
Identify the domain and range of a function given its context.
Describe a function as a rule that assigns to each element of the domain a unique element of the range and use proper function notation.
Determine from a table of inputs and outputs whether a relation is a function.
Evaluate linear, exponential, and quadratic functions.
Determine from a graph whether a relation is a function.
Use function notation for inputs and outputs.
Generate a graph of a linear function given a table for the input and output.
9

Algebra I Performance Level Descriptions
Domain NYS Level 5 NYS Level 4 NYS Level 3 NYS Level 2 NYS Level 1 (F-IF continued)
Evaluate functions. Identify the domain and range from a graph and interpret statements that use function notation in terms of a context.
Identify the domain from a graph or table of values.
Interpret statements that use function notation.
Identify the domain of a linear function given a table of values.
Explain how and why explicit and recursive formulas define the same sequence and relate these representations to a context.
Identify a recursively defined sequence as a function and determine
thits n term.
Identify an explicitly defined sequence as a function and determine its nth term.
Identify and continue patterns of arithmetic sequences.
10

Algebra I Performance Level Descriptions
Domain NYS Level 5 NYS Level 4 NYS Level 3 NYS Level 2 NYS Level 1 (F-IF Accurately sketch Accurately sketch and Accurately sketch and Graph linear and Identify the properties continued) graphs, showing key
features, given a verbal description of the relationship, including piece-wise defined and step functions.
create graphs using technology and interpret key features of graphs and tables given a verbal description of the relationship, including square root and cube root functions with domains in real numbers.
create graphs using technology and identify key features of graphs, given a verbal description of the relationship, including linear, quadratic, and exponential functions with domains in the integers.
quadratic functions and identify key features visible within the “standard zoom” (-10 to 10 calculator window) by hand or technology.
of linear functions represented algebraically, graphically, or numerically in tables.
Estimate, calculate, and interpret the average rate of change in terms of a context over a specified interval, including linear, quadratic, square root, cube root, piece-wise defined, and exponential functions with domains in the real numbers.
Estimate, calculate, and interpret the average rate of change over a specified interval, including linear, quadratic, square root, cube root, piece-wise defined and exponential functions with domains in the integers.
Calculate the average rate of change over a specified interval from a graph, including linear, quadratic, and exponential functions with domains in the integers.
Calculate the rate of change of a linear function from a graph or table.
Identify the rate of change given the symbolic representation of a linear function.
Distinguish between graphs of increasing and decreasing linear functions.
Use the process of factoring and completing the square in a quadratic function to show zeros, extreme values, and symmetry of the graph and interpret these in terms of a context.
Use the process of factoring to show zeros and symmetry of a graph.
Graph quadratic functions using technology and identify their roots.
Identify x-intercepts of a quadratic function, given its graph.
11

Algebra I Performance Level Descriptions
Domain NYS Level 5 NYS Level 4 NYS Level 3 NYS Level 2 NYS Level 1 (F-IF Compare properties of Compare properties of Compare properties of Compare qualitative continued) two functions with each
represented in a different way (i.e., algebraically, graphically, numerically in tables, or by verbal descriptions), including linear, quadratic, square root, cube root, piecewise-quadratic, and exponential functions with domains in the real numbers.
two functions with each represented in a different way (i.e., algebraically, graphically, numerically in tables, or by verbal descriptions), including linear, quadratic, square root, cube root, piecewise-quadratic, and exponential functions with domains in the integers.
two functions with each represented in a different way (i.e., algebraically, graphically, or numerically in tables), including linear, quadratic, and exponential functions with domains in the integers.
descriptions of two linear functions represented in the same way (i.e., algebraically, graphically, or numerically in tables).
Building Determine a recursive Determine and write Write a linear or Write a qualitative or Identify the descriptive Functions representation for a the appropriate linear, quadratic function that narrative description of characteristics of inputs (F-BF) linear, quadratic, or
exponential function. quadratic, or exponential function that describes a relationship between two quantities.
describes a relationship between two quantities.
a linear function that describes the behavior and/or relationship between two quantities.
Determine a representation, intermediate steps, or calculations for a linear function.
and outputs of a linear function.
12
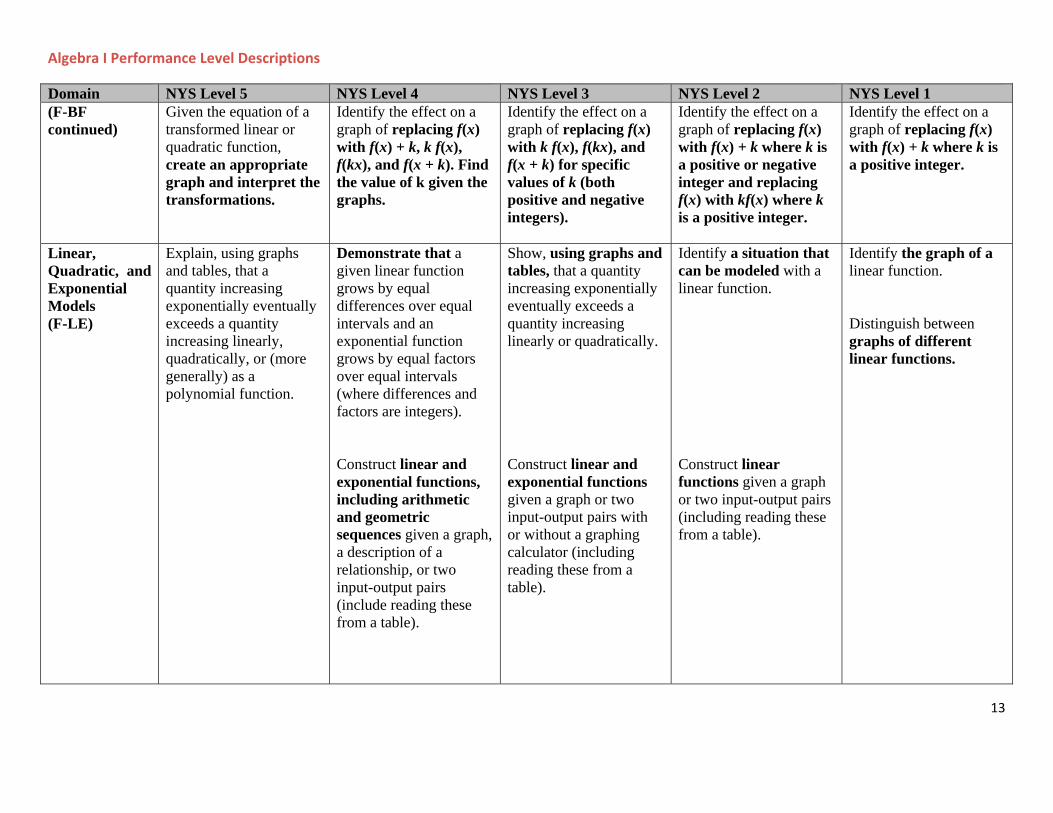
Algebra I Performance Level Descriptions
Domain NYS Level 5 NYS Level 4 NYS Level 3 NYS Level 2 NYS Level 1 (F-BF Given the equation of a Identify the effect on a Identify the effect on a Identify the effect on a Identify the effect on a continued) transformed linear or
quadratic function, create an appropriate graph and interpret the transformations.
graph of replacing f(x) with f(x) + k, k f(x), f(kx), and f(x + k). Find the value of k given the graphs.
graph of replacing f(x) with k f(x), f(kx), and f(x + k) for specific values of k (both positive and negative integers).
graph of replacing f(x) with f(x) + k where k is a positive or negative integer and replacing f(x) with kf(x) where k is a positive integer.
graph of replacing f(x) with f(x) + k where k is a positive integer.
Linear, Explain, using graphs Demonstrate that a Show, using graphs and Identify a situation that Identify the graph of a Quadratic, and and tables, that a given linear function tables, that a quantity can be modeled with a linear function. Exponential quantity increasing grows by equal increasing exponentially linear function. Models exponentially eventually differences over equal eventually exceeds a (F-LE) exceeds a quantity
increasing linearly, quadratically, or (more generally) as a polynomial function.
intervals and an exponential function grows by equal factors over equal intervals (where differences and factors are integers).
quantity increasing linearly or quadratically.
Distinguish between graphs of different linear functions.
Construct linear and exponential functions, including arithmetic and geometric sequences given a graph, a description of a relationship, or two input-output pairs (include reading these from a table).
Construct linear and exponential functions given a graph or two input-output pairs with or without a graphing calculator (including reading these from a table).
Construct linear functions given a graph or two input-output pairs (including reading these from a table).
13
Algebra I Performance Level Descriptions
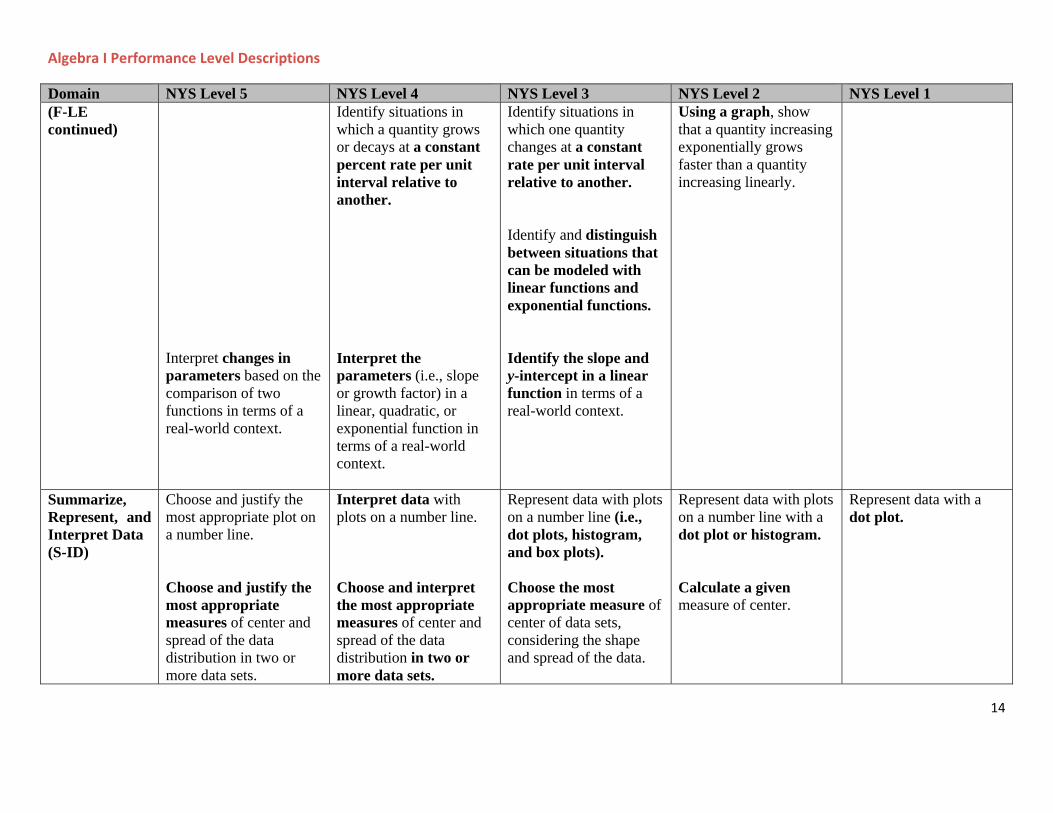
Domain NYS Level 5 NYS Level 4 NYS Level 3 NYS Level 2 NYS Level 1 (F-LE continued)
Identify situations in which a quantity grows or decays at a constant percent rate per unit interval relative to another.
Identify situations in which one quantity changes at a constant rate per unit interval relative to another.
Identify and distinguish between situations that can be modeled with linear functions and exponential functions.
Using a graph, show that a quantity increasing exponentially grows faster than a quantity increasing linearly.
Interpret changes in parameters based on the comparison of two functions in terms of a real-world context.
Interpret the parameters (i.e., slope or growth factor) in a linear, quadratic, or exponential function in terms of a real-world context.
Identify the slope and y-intercept in a linear function in terms of a real-world context.
Summarize, Represent, and Interpret Data (S-ID)
Choose and justify the most appropriate plot on a number line.
Choose and justify the most appropriate measures of center and spread of the data distribution in two or more data sets.
Interpret data with plots on a number line.
Choose and interpret the most appropriate measures of center and spread of the data distribution in two or more data sets.
Represent data with plots on a number line (i.e., dot plots, histogram, and box plots).
Choose the most appropriate measure of center of data sets, considering the shape and spread of the data.
Represent data with plots on a number line with a dot plot or histogram.
Calculate a given measure of center.
Represent data with a dot plot.
14

Algebra I Performance Level Descriptions
Domain NYS Level 5 NYS Level 4 NYS Level 3 NYS Level 2 NYS Level 1 (S-ID Identify and explain Interpret the differences Interpret the differences Identify outliers. continued) errors in inferences made
based on assumptions in shape, center, and spread in the context of
in shape, center, or spread in the context of
about the data. the data, including the the data, including the effects of outliers. effects of outliers.
Provide evidence to List and interpret Summarize categorical Given two-way table, From a two-way table, show possible possible associations data for two categories identify quantitative state relative associations and trends and trends in the data in in two-way frequency differences of frequencies. in the data. a two-way frequency tables. categorical data.
table.
Summarize, represent, Interpret marginal, joint, Interpret marginal and interpret data on two and conditional relative relative frequencies in categorical and frequencies in the the context of the data. quantitative variables. context of the data.
Fit a linear, quadratic, Use residuals to assess Fit a linear function to or exponential function the fit of a linear, real world data. to real-world data and quadratic, or use residuals to assess exponential function. the fit.
15

Algebra I Performance Level Descriptions
Domain NYS Level 5 NYS Level 4 NYS Level 3 NYS Level 2 NYS Level 1 (S-ID continued)
Compare and contrast the strength of the fit for a variety of functions.
Use the graphing calculator to determine the correlation coefficient of a linear model and assess the strength and direction of the fit.
Use the graphing calculator to determine the correlation coefficient and direction of a linear model.
Identify a strong or weak correlation given a correlation coefficient.
Distinguish between scatterplots that show a negative correlation and scatterplots that show a positive correlation.
Interpret the meaning of slope and the y-intercept of a linear model in real-world context.
Interpret the meaning of the y-intercept or slope of a linear model in real-world context.
Identify the slope or y-intercept given a linear model.
Generate and explain examples of relationships that are correlated and causal or correlated but not causal.
Distinguish between correlation and causation.
16