new york state petroleum terminal resiliency assessment · new york state petroleum terminal...
TRANSCRIPT

New York State Petroleum Terminal Resiliency Assessment
NYSERDA Contract 30186
Final Report March 2014
Submitted to:
New York State Energy Research and Development Authority (NYSERDA) 17 Columbia Circle Albany, New York 12203
Submitted by:
ICF International
9300 Lee Highway
Fairfax, Virginia 22031

NYSERDA Terminal Resiliency Assessment |Table of Contents i
Warranties and Representations
Notice
This report was prepared by ICF International in the course of performing work contracted for and sponsored by the New York State Energy Research and Development Authority and the U.S. Department of Energy, under partial funding from the American Reinvestment and Recovery Act (ARRA) (hereafter referred to as “the Sponsors”). The opinions expressed in this report do not necessarily reflect those of the Sponsors or the State of New York, and reference to any specific product, service, process, or method does not constitute an implied or express recommendation or endorsement of it. Furthermore, the Sponsors and the State of New York make no warranties or representations, express or implied, as to the fitness for the particular purpose or merchantability of any product, apparatus, or service, or the usefulness, completeness, or accuracy of any processes, methods, or other information contained, described, disclosed, or referred to in this report. The Sponsors, the State of New York, and the contractor make no representation that the use of any product, apparatus, process, method, or other information will not infringe on privately owned rights and will assume no liability for any loss, injury, or damage resulting from, or occurring in connection with, the use of information contained, described, disclosed, or referred to in this report.
Abstract
This report examines the resiliency of the petroleum terminal system in the State of New York. The report provides information on baseline characteristics of New York terminals, such as storage capacity, throughput, and products supplied; impacts and vulnerabilities to those terminals from recent storms, such as Superstorm Sandy, Hurricane Irene, and Tropical Storm Lee; and hardening and resiliency measures that terminals have put in place to protect their facilities from future storms, including pre-storm activities, flood protection measures, and backup power generation. The report also includes background information on the role that New York terminals play in the state’s fuel supply chain.
Keywords
Transportation Fuels; Petroleum Terminals, Resiliency, Hardening, Power Outages, Superstorm Sandy, Hurricane Irene
NYSERDA Terminal Resiliency Assessment |Table of Contents ii
TABLE OF CONTENTS
Table of Contents ............................................................................................................................... ii
List of Figures .................................................................................................................................... iv
List of Tables ..................................................................................................................................... vi
List of Acronyms and Definitions ...................................................................................................... vii
Executive Summary ......................................................................................................................... viii
Background ......................................................................................................................................... viii
Key Findings ..........................................................................................................................................ix
Introduction ...................................................................................................................................... 1
Background ....................................................................................................................................... 2
Components of Petroleum Terminals ....................................................................................................... 3
Tank Farms ............................................................................................................................................ 3
Marine Docks and Related Infrastructure ............................................................................................ 4
Pipeline Interconnection ....................................................................................................................... 5
Rail Infrastructure ................................................................................................................................. 6
Truck Loading Racks .............................................................................................................................. 6
Electrical Systems.................................................................................................................................. 7
Other Facilities ...................................................................................................................................... 8
Terminal Staff ............................................................................................................................................ 8
Terminal Managers ............................................................................................................................... 9
Technicians ........................................................................................................................................... 9
Administrative, Business, and Security Personnel ................................................................................ 9
Truck Drivers ......................................................................................................................................... 9
Overview of New York State Petroleum Supply and Infrastructure ....................................................... 10

NYSERDA Terminal Resiliency Assessment |Table of Contents iii
Survey Results ................................................................................................................................. 12
Terminal Characteristics.......................................................................................................................... 13
Terminals By Storage Capacity ............................................................................................................ 13
Terminals by Throughput .................................................................................................................... 14
Products Supplied ............................................................................................................................... 17
Modes of Receipt and Disbursement ................................................................................................. 18
Ownership ........................................................................................................................................... 19
Storm Effects ........................................................................................................................................... 21
Terminals Affected .............................................................................................................................. 21
Terminal Interruptions by Cause ........................................................................................................ 22
Supply Disruptions to Terminals by Mode .......................................................................................... 24
Power Outages .................................................................................................................................... 25
Effects by Terminal Component and Damage Type ........................................................................... 27
Personnel Availability Issues ............................................................................................................... 29
Other Weather Events ........................................................................................................................ 30
Hardening and Resiliency ........................................................................................................................ 32
Pre-Storm Activities ............................................................................................................................ 32
Flood Protection Measures ................................................................................................................. 35
Backup Power Systems ....................................................................................................................... 38
Fixed Versus Mobile Backup Generators ........................................................................................ 38
Backup Generators by Load Capability ........................................................................................... 40
Backup Generator Duration of Operation with Available Fuel ....................................................... 40
Backup Generators by Location and Connection Time ................................................................... 41
Backup Generators by Terminal Throughput ................................................................................. 42
Backup Generators by Area ............................................................................................................ 43

NYSERDA Terminal Resiliency Assessment |List of Figures iv
Other Power Resiliency Measures .................................................................................................. 45
Emergency Preparedness ........................................................................................................................ 46
Emergency Communications .............................................................................................................. 46
Emergency Plans ................................................................................................................................. 47
Emergency Drills ................................................................................................................................. 49
Summary ......................................................................................................................................... 51
LIST OF FIGURES
Figure 1. Terminal’s Position in the Petroleum Supply Chain ....................................................................... 2
Figure 2. Tank Farm with Ringwalls Around Tanks ....................................................................................... 3
Figure 3. Gasoline Barge Unloading at a Terminal Dock ............................................................................... 4
Figure 4. Pipeline Interconnection ................................................................................................................ 5
Figure 5. Truck Loading Rack......................................................................................................................... 6
Figure 6. Electrical Transformers .................................................................................................................. 7
Figure 7. Motor Control Center .................................................................................................................... 8
Figure 8. NYS Petroleum Infrastructure Map.............................................................................................. 11
Figure 9. Number of Terminals and Combined Throughput by Throughput Category .............................. 15
Figure 10. Number and Combined Throughput of Terminals by DEC Region (with Crude Volume Highlighted) ........................................................................................................... 16
Figure 11. Number of Terminals and Estimated Fuel Throughput by Liquid Fuel Type ............................. 17
Figure 12. Number of Terminals Receiving/Distributing Fuel and Estimated Fuel Receipts/Disbursements by Transportation Mode ............................................................ 18
Figure 13. Number of Terminals and Combined Throughput by Ownership Type ..................................... 20
Figure 14. Percentage of Terminals and Throughput Disrupted by Superstorm Sandy and Hurricane Irene by Area ..................................................................................................... 22
Figure 15. Cause of Interruptions to Terminal Out-Loading by Storm ....................................................... 23
NYSERDA Terminal Resiliency Assessment |List of Figures v
Figure 16. Percentage of Terminals Receiving Fuel by Supply Mode and Percentage of Terminals Experiencing Storm-Related Supply Disruptions by Supply Mode: Total State, Upstate, and Downstate ................................................................................. 24
Figure 17. Percentage of Terminals that Lost Power and Percentage of Terminal Throughput Lost by Storm and Area ...................................................................................................... 26
Figure 18. Average Duration of Power Outages by Storm and Area .......................................................... 27
Figure 19. Percentage of Terminals Reporting Storm Effects by Terminal Component ............................. 28
Figure 20. Percentage of Terminals Reporting Lack of Access to Personnel Due to Recent Weather Events .................................................................................................................. 30
Figure 21. Other Weather Events Affecting Terminal Operations .............................................................. 31
Figure 22. Terminals May Protect Pumps and Motors Located Close to the Water Prior to a Storm .................................................................................................................................. 33
Figure 23. Percentage of Terminals Conducting Pre-Storm Activities ........................................................ 33
Figure 24. Tanks Are Filled with Product or Water to Prevent Tank Movement During Flooding ............. 34
Figure 25. A Wall of Concrete Blocks Are Installed to Protect Onshore Facilities from Flooding .............. 36
Figure 26. Flood Protection Measures as a Share of Terminals Along Bodies of Water ............................ 36
Figure 27. Motor Control Center Hardened Against Flooding .................................................................... 37
Figure 28. Electric Wiring Runs Along Elevated Conduit ............................................................................ 37
Figure 29. Terminals that Have or Obtain Backup Generators ................................................................... 38
Figure 30. Fixed Diesel Backup Generator .................................................................................................. 39
Figure 31. Mobile, Trailer-Mounted Diesel Backup Generator .................................................................. 39
Figure 32. Backup Generators by Load Capability ...................................................................................... 40
Figure 33. Backup Generators Capable of Powering Throughput Operations by Duration of Operation with Available Fuel ............................................................................................ 41
Figure 34. Terminals with Backup Generators Capable of Powering Throughput Operations by Connection Speed and Location ......................................................................................... 42
Figure 35. Backup Generators by Terminal Throughput and Load Capability ............................................ 43

NYSERDA Terminal Resiliency Assessment |List of Tables vi
Figure 36. Terminals with Backup Generators Capable of Powering Throughput Operations by Area .................................................................................................................................... 44
Figure 37. Terminal Communication Channels During Emergencies .......................................................... 46
Figure 38. Percentage of Terminals that Include Information in the Emergency Plan by Information Type ................................................................................................................ 48
Figure 39. Emergency Plan Updates After Superstorm Sandy .................................................................... 48
Figure 40. Emergency Preparedness: Drills and Exercises .......................................................................... 49
Figure 41. Frequency of Incident Scenarios ................................................................................................ 50
LIST OF TABLES
Table 1. Number of NYS Terminals and Total NYS Storage Capacity Compared with the Number of Surveyed Terminals and Surveyed Storage Capacity ..................................................... 13
NYSERDA Terminal Resiliency Assessment |List of Acronyms and Definitions vii
LIST OF ACRONYMS AND DEFINITIONS
b/d barrels per day
bbl barrel (equivalent to 42 gallons)
DEC New York State Department of Environmental Conservation
Mbbl one thousand barrels
MVRU marine vapor recovery unit
NYH New York Harbor area, which represents a conglomeration of water-access distribution terminals primarily in northern New Jersey, pipeline distribution hubs in northern New Jersey, and local terminals in New York City and Long Island
NYS New York State
NYSERDA New York State Energy Research and Development Authority
RBOB reformulated blendstock for oxygenate blending
RFO residual fuel oil
VOC volatile organic compound

NYSERDA Terminal Resiliency Assessment |Executive Summary viii
EXECUTIVE SUMMARY
Recent severe weather events have caused disruptions in New York State’s (NYS) petroleum fuels supply chain, affecting regional refineries, major distribution hubs and delivery terminals, marine and pipeline operations, and service station supply. In addition to affecting consumers and businesses needing fuel for transportation and debris cleanup, the disruptions affected utility, local, State, and Federal efforts to protect citizens, and restore power and basic services.
In response to these events, NYS and the New York State Energy Research and Development Authority (NYSERDA) have initiated a number of actions and studies focused on improving the “hardening” and “resiliency” of the petroleum supply chain. Hardening refers to investments to make petroleum assets less vulnerable to the effects of storms, and resiliency refers to actions or investments that improve the ability of the assets to recover from the effects of events.
BACKGROUND
One specific area that NYSERDA is assessing is the petroleum terminal system. Petroleum terminals receive, store, and distribute petroleum products such as gasoline, diesel fuel, and heating oil; renewable fuels such as ethanol and biodiesel; and, in some cases, crude oil. These terminals are vital to the sustained supply of fuel to consumers and businesses in NYS. New York has approximately 200 petroleum terminals of various sizes, which together have the capacity to store more than 52 million barrels of petroleum. Many of these terminals are “secondary” terminals that are owned by heating oil distributors, utilities, or local businesses to hold product that is specific to their business needs. These terminals tend to be smaller and, with the exception of heating oil distributors, are not directly involved in supplying the general public.
NYSERDA has identified 74 terminals in NYS as “primary” supply terminals. These terminals include several distribution hubs, which receive and distribute bulk products by pipeline, barge, or rail, and a large number of delivery terminals, which receive products via bulk modes and distribute them by truck to local service stations, commercial businesses, and State and municipal fleets. NYS primary terminals have the capacity to store approximately 33 million barrels of petroleum products and are critical to the State’s overall fuel supply system.
In the summer of 2013, NYSERDA launched an assessment with ICF International that focused on the petroleum terminal system in NYS. As part of this assessment, NYSERDA initiated two surveys of NYS terminals to learn more about their baseline operational characteristics; how they were affected by recent weather events such as Superstorm Sandy, Hurricane Irene, and Tropical Storm Lee; and how they have hardened facilities and enhanced resiliency for future storm events. Hardening and resiliency measures include undertaking storm preparation activities to secure terminal equipment prior to a storm event; flood protection measures such as installing floodwalls or elevating critical electrical equipment; power resiliency measures such as installing or pre-wiring for onsite backup power
NYSERDA Terminal Resiliency Assessment |Executive Summary ix
generation; and other emergency preparedness activities such as updating emergency plans, conducting storm drills and tabletop exercises, and improving the lines of communication to utility, local, State, and Federal partners.
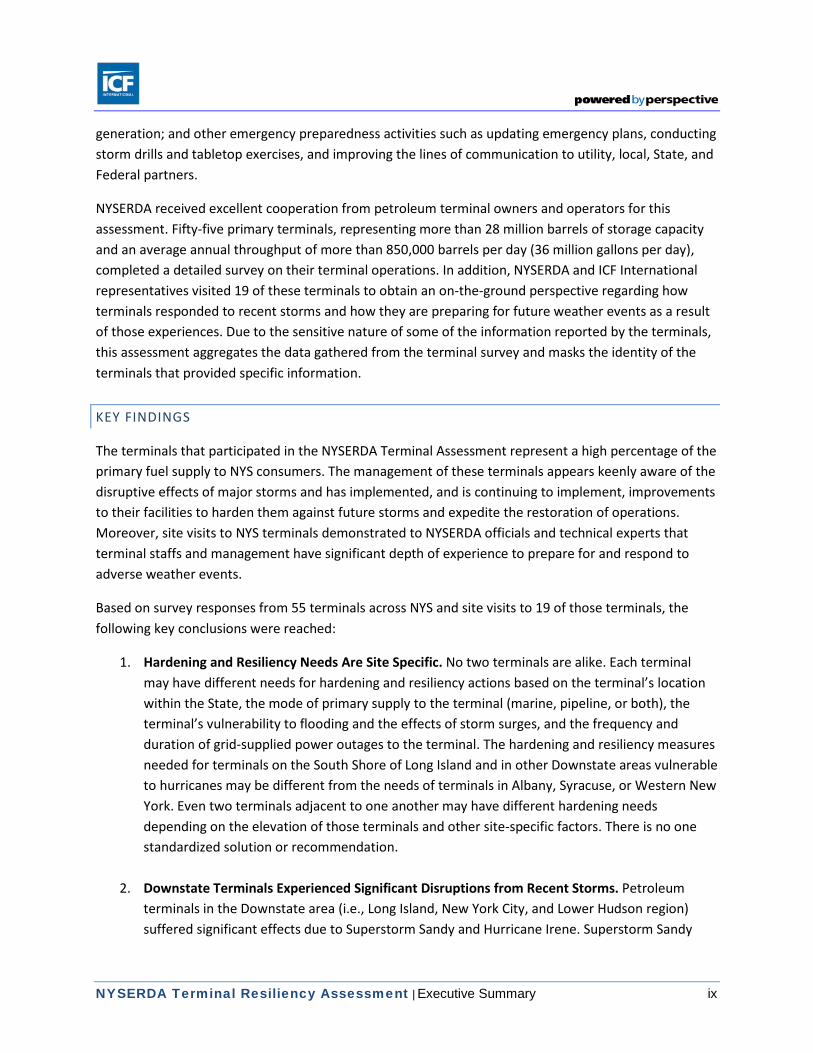
NYSERDA received excellent cooperation from petroleum terminal owners and operators for this assessment. Fifty-five primary terminals, representing more than 28 million barrels of storage capacity and an average annual throughput of more than 850,000 barrels per day (36 million gallons per day), completed a detailed survey on their terminal operations. In addition, NYSERDA and ICF International representatives visited 19 of these terminals to obtain an on-the-ground perspective regarding how terminals responded to recent storms and how they are preparing for future weather events as a result of those experiences. Due to the sensitive nature of some of the information reported by the terminals, this assessment aggregates the data gathered from the terminal survey and masks the identity of the terminals that provided specific information.
KEY FINDINGS
The terminals that participated in the NYSERDA Terminal Assessment represent a high percentage of the primary fuel supply to NYS consumers. The management of these terminals appears keenly aware of the disruptive effects of major storms and has implemented, and is continuing to implement, improvements to their facilities to harden them against future storms and expedite the restoration of operations. Moreover, site visits to NYS terminals demonstrated to NYSERDA officials and technical experts that terminal staffs and management have significant depth of experience to prepare for and respond to adverse weather events.
Based on survey responses from 55 terminals across NYS and site visits to 19 of those terminals, the following key conclusions were reached:
1. Hardening and Resiliency Needs Are Site Specific. No two terminals are alike. Each terminal may have different needs for hardening and resiliency actions based on the terminal’s location within the State, the mode of primary supply to the terminal (marine, pipeline, or both), the terminal’s vulnerability to flooding and the effects of storm surges, and the frequency and duration of grid-supplied power outages to the terminal. The hardening and resiliency measures needed for terminals on the South Shore of Long Island and in other Downstate areas vulnerable to hurricanes may be different from the needs of terminals in Albany, Syracuse, or Western New York. Even two terminals adjacent to one another may have different hardening needs depending on the elevation of those terminals and other site-specific factors. There is no one standardized solution or recommendation.
2. Downstate Terminals Experienced Significant Disruptions from Recent Storms. Petroleum terminals in the Downstate area (i.e., Long Island, New York City, and Lower Hudson region) suffered significant effects due to Superstorm Sandy and Hurricane Irene. Superstorm Sandy
NYSERDA Terminal Resiliency Assessment |Executive Summary x
disrupted supply at 60 percent of the Downstate terminals, affecting 75 percent of Downstate throughput. Hurricane Irene disrupted 29 percent of the Downstate terminals, affecting 35 percent of Downstate throughput.
3. Recent Storms Affected Terminals in Multiple Ways. Superstorm Sandy and Hurricane Irene affected terminal operations in multiple ways. Thirty-six percent of the terminals statewide reported that Superstorm Sandy disrupted the supply to their facilities by pipeline and/or marine shipments, leaving the terminals unable to re-supply after the inventory in their tanks had been out-loaded to retail locations and other end-users; 31 percent reported that terminal operations suffered onsite damage to terminal equipment (e.g., product pumps, electrical equipment), disrupting the terminal’s ability to receive and/or disburse fuel; and 20 percent reported that terminal out-loading was interrupted due to disruptions to their customers’ ability to receive fuel. Many retail fuel stations were without power and could not pump fuel for many days following Superstorm Sandy.
4. Power Outages Were a Major Problem During Recent Storms. Superstorm Sandy and Hurricane Irene caused extensive damage to the power grid in Downstate New York. Forty-three percent of the Downstate terminals reported losing power during Sandy and 20 percent reported losing power during Irene. Power outages at those terminals averaged 88 hours after Sandy and 48 hours after Irene. Power outages were caused by the loss of grid-supplied power, as well as storm surge damage to onsite electrical equipment at the terminals. Having backup generators installed onsite or pre-staged at a nearby facility could mitigate the effect of power outages at terminals where grid-supplied power was an issue. Elevating electrical equipment and installing other flood protection measures could mitigate outages at terminals where storm surge damage was the problem.
5. Terminals Secure Facilities Prior to Severe Storms. In preparation for severe storms for which there is lead time (e.g., hurricanes), NYS terminals undertake pre-storm activities designed to protect vulnerable parts of their facilities and expedite the terminal’s ability to restore operations after the storm has passed. The terminals surveyed by NYSERDA reported taking a variety of protection and preparedness measures prior to major hurricanes and tropical storms, including wrapping or protecting pumps and motors against potential flood damage; filling or pumping water or product between tanks to ensure adequate weight in each tank to prevent floating; closing isolation valves at tanks to prevent unintended product releases; checking roof drain valves for storm water; adjusting valve configurations for storm water drains; obtaining or pre-positioning backup generators if permanent generators are not already in place; coordinating with utilities for priority power restoration; and reviewing/confirming emergency plans. These activities are consistently implemented at terminals that are at a high risk of experiencing storm damage.

NYSERDA Terminal Resiliency Assessment |Executive Summary xi
6. Flood Protection Is a Priority at Vulnerable Sites. Terminals located in low-lying areas in close proximity to large bodies of water have taken measures to protect their facilities against flooding, including elevating electrical systems; protecting cabling; and installing berms, levees, or floodwalls to protect their facilities. All of the terminals that reported taking these measures were located in Downstate New York, where storm and flood risk is highest. Some terminals made these investments years ago, while others have made investments as a direct result of their experiences with Superstorm Sandy. For terminals at vulnerable sites, these measures are essential because flooding can cause the most severe damage to terminal facilities. If saltwater inundates electrical equipment, that equipment must be removed and cleaned before it can become operational again. In many cases, electrical equipment that comes in contact with saltwater must be replaced entirely.
7. High-Volume Terminals Are More Likely to Have Backup Generation. Statewide, nearly one-fourth of the terminals reported having installed backup power generators that are capable of fully powering throughput operations either onsite or pre-staged at nearby locations. More important however, high-volume terminals—those with throughput volumes greater than 25,000 barrels per day (1.05 million gallons per day)—were more likely to have backup generation than smaller facilities. Half of all high-volume terminals reported having backup generators that are capable of powering throughput operations. Overall, terminals representing 41 percent of statewide terminal throughput reported having backup generation.
8. Transfer Switches Speed Up Generator Connection Time. Terminals that store generators onsite and have transfer switches installed at their facilities reported connection times for their generators of 1 hour or less. Terminals with transfer switches that store their generators at offsite facilities reported connection times of 1 to2 hours. Terminals that have onsite generators but no transfer switch reported hook-up times in the 3 to 4-hour range. These terminals that do not have transfer switches require an electrician to tie the generator into the terminal’s electrical system.
9. Communication Is Essential During Emergencies. Terminal operators indicated that they stay in close contact with their utility providers, petroleum suppliers (marine and pipeline contacts), the U.S. Coast Guard and New York Port Authority, and local government officials during emergencies. Terminal owners communicate with State and Federal authorities, conveying issues such as reporting status and damage, and coordinating waivers or priority for electrical restoration efforts.
10. Emergency Plans Were Sufficient During Superstorm Sandy. Nearly all NYS terminals surveyed reported having emergency plans. Most terminals reported that their emergency plans were sufficient to cover the types of issues experienced during Superstorm Sandy. More than half of all terminals surveyed reported that they updated their emergency plans as a result of
NYSERDA Terminal Resiliency Assessment |Executive Summary xii
Superstorm Sandy. The terminals that updated their plans made changes related to contact lists, the roles and responsibilities of terminal staff, risk and hazard assessments of terminal facilities, procedures for minimizing property damage, and procedures for dealing with power loss situations.
This assessment represents a starting point in the development of an even more collaborative approach between State officials and the operators of NYS petroleum terminals. This assessment will allow NYSERDA and other State officials to better understand the terminal system and its role in the NYS fuel supply chain and recognize the most effective actions the State can take to assist the industry during emergencies.

NYSERDA Terminal Resiliency Assessment |Introduction 1
INTRODUCTION
In the aftermath of Superstorm Sandy, regional authorities sought to more fully understand the operation of petroleum assets in the U.S. Northeast. The role that petroleum terminals play in the supply chain and their vulnerabilities to extreme weather conditions clearly affected consumers in New York. Electric power and operational outages at these facilities perpetuated down the region’s supply chain and resulted in significant delays in delivering gasoline, diesel, and other petroleum fuels to consumers.
To gain a better understanding of the facilities within New York State (NYS), the New York State Energy Research and Development Authority (NYSERDA) initiated two statewide surveys of petroleum terminals to gather information on their normal operations; how they were affected by Superstorm Sandy and other recent weather events; how they have hardened facilities and how they prepare for storms; and how they communicate with local, State, and Federal government agencies during emergencies. The petroleum terminal owners and operators were supportive in this effort. In addition to the two surveys, NYSERDA visited a number of the State’s key terminals to gather additional information, including observing hardening measures firsthand.
NYSERDA’s objective for this assessment is to characterize the state of the petroleum terminal system in NYS, including actions taken or underway to harden the terminals against future natural disasters and to improve their resiliency to restore operations in the aftermath of these events.

NYSERDA Terminal Resiliency Assessment | Background 2
BACKGROUND
Petroleum distribution terminals provide a vital role in the petroleum supply chain. Terminals are located at the nexus of one or more modes of transportation on the supply chain, and provide intermediate storage capacity as fuels are transferred from bulk transportation modes to local distribution to the end point of sale, usually by truck. Terminals serve as the final connection point between the wholesale petroleum industry and retail fuel outlets. Widespread disruptions of operations and sustained loss of power at distribution terminals, as occurred following Superstorm Sandy, can have consequences that cascade through the supply chain, affecting both upstream bulk transportation systems (e.g., pipelines, marine tankers and barges) that feed the terminal and downstream end-use fuel customers.
Figure 1. Terminal’s Position in the Petroleum Supply Chain
Source: American Petroleum Institute
Petroleum distribution terminals are typically classified as either primary or secondary terminals, depending on their function and their place in the supply chain. Primary terminals serve as redistribution hubs for movement onto other intra- and inter-State transportation systems, or act as delivery terminals for local marketing and distribution. Primary terminals typically bring in fuel via bulk transportations systems, such as pipelines or barges, and send out fuel to customers via tanker trucks. Secondary terminals, in contrast, serve as onsite storage depots for large end-use consumers, such as airports or electric generating facilities. This report will focus on primary fuel terminals. However, it is important to understand the role that secondary terminals play in the supply chain as their capacities can be substantial, particularly at major consumer sites such as airports, and their functions can be critical.

NYSERDA Terminal Resiliency Assessment | Background 3
COMPONENTS OF PETROLEUM TERMINALS
Petroleum terminals have a number of components. In general, all terminals will have a tank farm, receiving and loading facilities, and electrical and fire safety systems. Other major components of petroleum terminals will vary, depending on the terminal’s modes of receipt and distribution (i.e., pipeline, marine, rail, and truck), as well as the types of products handled at the terminal. Major components described below include tank farms, docks and related marine infrastructure, pipeline interconnections, rail infrastructure, truck loading racks, and electrical switchgear and motor control centers.
TANK FARMS
All petroleum terminals have at least one storage tank, as well as required containment systems. Tanks are typically made of steel and located above ground. Each tank holds a single product, although tanks can be changed over to different products, depending on local and seasonal demands. Each tank is required to have containment to prevent the product from escaping the terminal facility in the event that a tank breach causes the tank’s contents to be released. Containment is usually provided by constructing steel ring walls or concrete or gravel dykes around each tank. Containment is designed to contain a release of the full tank’s volume. Although containment is intended as a safety precaution against product releases, it can also protect tanks from the effects of flooding or storm surge.
Figure 2. Tank Farm with Ringwalls Around Tanks
Source: ICF International

NYSERDA Terminal Resiliency Assessment | Background 4
Tanks holding gasoline are also typically equipped with floating roofs that limit evaporative product losses and reduce the emission of volatile organic compounds (VOCs) into the atmosphere. In New York City, fire code regulations limit storage tanks to holding no more than 500,000 gallons (11,900 barrels) of gasoline. The height of a gasoline tank is also limited to 40 feet. Distillate fuel tanks in New York City can hold higher volumes of product. Tanks holding liquid asphalt, No. 6 fuel oil, or biodiesel (B100) must be heated to prevent the product from solidifying. In addition, pipelines throughout the terminal facility that handle these products must be heated and/or insulated. Terminals that handle these products have boiler rooms to produce steam to heat tanks and pipelines.
Terminal tanks are filled from pipelines and pumps originating from the terminal’s marine docks, from the terminal’s pipeline interconnection and manifold, from rail unloading facilities, and from transport trucks. This infrastructure will be discussed in more detail in the following sections. Product from the storage tanks is usually pumped to the terminal’s truck loading rack or marine dock for further out-loading. The product pumps that move fuel from the tanks to the distribution facilities are typically located outside the tank’s containment area; however, some tanks utilize in-tank pumps.
MARINE DOCKS AND RELATED INFRASTRUCTURE
Terminals that load or unload liquid fuels to/from marine vessels have docks to receive tankers and/or barges. These docks have mooring equipment to keep the vessels from moving during loading or unloading operations and may have metering equipment and lighting to facilitate night operations. Barges typically load or unload through flexible hoses that connect to pipelines running from the terminal’s dock to the terminal’s tank farm, while larger tankers sometimes load/unload via fixed loading/unloading arms with higher capacity flow rates.
Figure 3. Gasoline Barge Unloading at a Terminal Dock
Source: ICF International

NYSERDA Terminal Resiliency Assessment | Background 5
Typically, product unloading is facilitated using the marine vessel’s onboard pumps; however, in some cases, external dockside pumps may be utilized where the marine dock is located a significant distance from the tank farm, or where there is a significant increase in elevation between the dock and the tank farm. Docks that out-load gasoline or other volatile products are required to have marine vapor recovery units (MVRUs) to reduce emissions of VOCs.
PIPELINE INTERCONNECTION
Terminals that receive or send out fuel via pipeline require a pipeline interconnection that ties the terminal’s internal product lines into the third-party pipeline system. The pipeline interconnection is typically owned and operated by the pipeline company and is often tied into the terminal via a single pipe. The terminal receives products from this interconnection via single-product batches, which are directed to the appropriate storage tanks via a pipeline manifold (a series of product pumps), which is owned and operated by the terminal. Metering typically takes place on both sides of the interconnection. Some terminals that receive product via pipeline lease tankage to the pipeline company to store “transmix” (a mixture of two different fuels that occurs between batches when transporting fuel by pipeline).
Figure 4. Pipeline Interconnection
Source: ICF International
NYSERDA Terminal Resiliency Assessment | Background 6
RAIL INFRASTRUCTURE
Terminals that receive or send out liquid fuels by rail must have certain equipment and infrastructure, including track space to efficiently handle train deliveries. “Loop” tracks are used as a holding place for trains waiting to either load or unload, and can be a couple of miles in circumference. Liquid fuel is most often transported on “unit” trains that are dedicated to transporting a single product, as opposed to “manifest” trains that transport a variety of different goods.
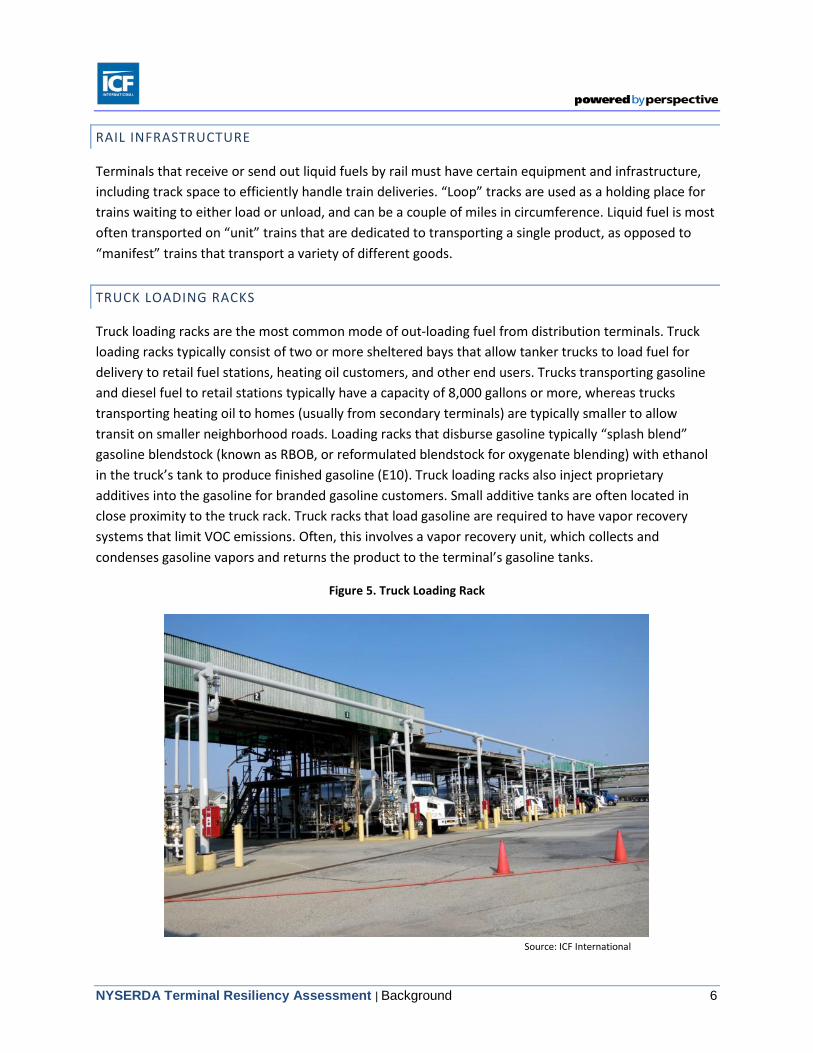
TRUCK LOADING RACKS
Truck loading racks are the most common mode of out-loading fuel from distribution terminals. Truck loading racks typically consist of two or more sheltered bays that allow tanker trucks to load fuel for delivery to retail fuel stations, heating oil customers, and other end users. Trucks transporting gasoline and diesel fuel to retail stations typically have a capacity of 8,000 gallons or more, whereas trucks transporting heating oil to homes (usually from secondary terminals) are typically smaller to allow transit on smaller neighborhood roads. Loading racks that disburse gasoline typically “splash blend” gasoline blendstock (known as RBOB, or reformulated blendstock for oxygenate blending) with ethanol in the truck’s tank to produce finished gasoline (E10). Truck loading racks also inject proprietary additives into the gasoline for branded gasoline customers. Small additive tanks are often located in close proximity to the truck rack. Truck racks that load gasoline are required to have vapor recovery systems that limit VOC emissions. Often, this involves a vapor recovery unit, which collects and condenses gasoline vapors and returns the product to the terminal’s gasoline tanks.
Figure 5. Truck Loading Rack
Source: ICF International
NYSERDA Terminal Resiliency Assessment | Background 7
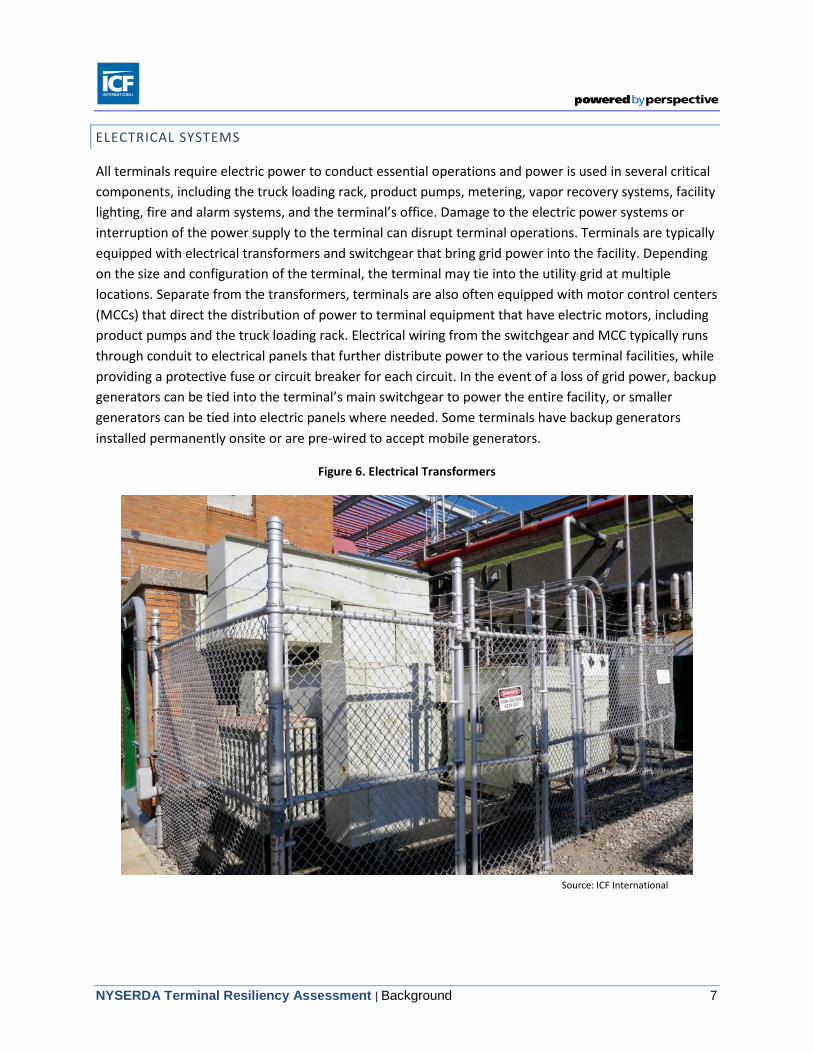
ELECTRICAL SYSTEMS
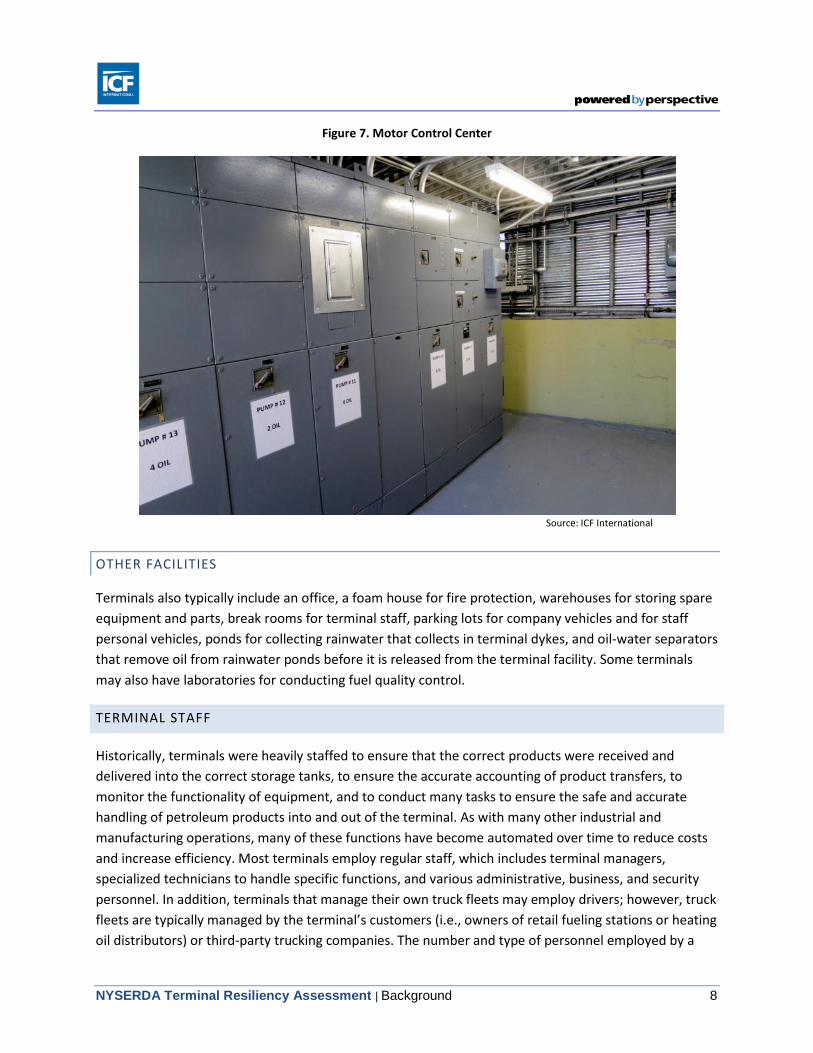
All terminals require electric power to conduct essential operations and power is used in several critical components, including the truck loading rack, product pumps, metering, vapor recovery systems, facility lighting, fire and alarm systems, and the terminal’s office. Damage to the electric power systems or interruption of the power supply to the terminal can disrupt terminal operations. Terminals are typically equipped with electrical transformers and switchgear that bring grid power into the facility. Depending on the size and configuration of the terminal, the terminal may tie into the utility grid at multiple locations. Separate from the transformers, terminals are also often equipped with motor control centers (MCCs) that direct the distribution of power to terminal equipment that have electric motors, including product pumps and the truck loading rack. Electrical wiring from the switchgear and MCC typically runs through conduit to electrical panels that further distribute power to the various terminal facilities, while providing a protective fuse or circuit breaker for each circuit. In the event of a loss of grid power, backup generators can be tied into the terminal’s main switchgear to power the entire facility, or smaller generators can be tied into electric panels where needed. Some terminals have backup generators installed permanently onsite or are pre-wired to accept mobile generators.
Figure 6. Electrical Transformers
Source: ICF International
NYSERDA Terminal Resiliency Assessment | Background 8
Figure 7. Motor Control Center
Source: ICF International
OTHER FACILITIES
Terminals also typically include an office, a foam house for fire protection, warehouses for storing spare equipment and parts, break rooms for terminal staff, parking lots for company vehicles and for staff personal vehicles, ponds for collecting rainwater that collects in terminal dykes, and oil-water separators that remove oil from rainwater ponds before it is released from the terminal facility. Some terminals may also have laboratories for conducting fuel quality control.
TERMINAL STAFF
Historically, terminals were heavily staffed to ensure that the correct products were received and delivered into the correct storage tanks, to ensure the accurate accounting of product transfers, to monitor the functionality of equipment, and to conduct many tasks to ensure the safe and accurate handling of petroleum products into and out of the terminal. As with many other industrial and manufacturing operations, many of these functions have become automated over time to reduce costs and increase efficiency. Most terminals employ regular staff, which includes terminal managers, specialized technicians to handle specific functions, and various administrative, business, and security personnel. In addition, terminals that manage their own truck fleets may employ drivers; however, truck fleets are typically managed by the terminal’s customers (i.e., owners of retail fueling stations or heating oil distributors) or third-party trucking companies. The number and type of personnel employed by a

NYSERDA Terminal Resiliency Assessment | Background 9
terminal will vary, depending on the size of the terminal and the types of business operations that occur at the terminal.
TERMINAL MANAGERS
Terminal operations are typically overseen by one or more terminal managers. Terminal managers supervise the day-to-day operations of the facility and, in some cases, oversee operations at multiple facilities. If the terminal is under corporate ownership, the terminal managers communicate regularly with regional managers and/or corporate personnel to update the company regarding the terminal’s operations.
TECHNICIANS
Terminals employ technicians to carry out terminal operations, and to monitor and maintain the various assets at the terminal. Terminal technicians may have a variety of specializations, including roles that focus on and safety operations. Mechanical technicians turn product valves at pipeline manifolds, attach mooring and transfer hoses to marine vessels loading and offloading at the terminal’s docks, and maintain pumps and other equipment onsite. Chemical engineers may be tasked with analyzing the laboratory results of the product being shipped and the equipment used in handling the products or byproducts, such as vapor recovery units. Electrical engineers typically are employed to oversee the instrumentation and electrical components of the facility and/or the use of backup generators. The extent and use of technicians depends on educational and professional training, along with the ability to contract local personnel to fulfill these roles. In addition, some companies may share technicians among terminal assets in the same region. For instance, technicians for dock operations may move to the company’s terminals based on the terminal’s loading/unloading schedule.
ADMINISTRATIVE, BUSINESS, AND SECURITY PERSONNEL
Like many other businesses, terminals often employ a variety of staff to help with accounting, administrative work, contracting, IT, security, or other functions not directly related to the movement of product through the terminal. Some of this staff may be located remotely, while others may be located onsite. The location of personnel depends on the company and the terminal. Larger companies often conduct administrative and business-related tasks at corporate offices.
TRUCK DRIVERS
Terminals may or may not directly employ tanker truck drivers, depending on the structure of the terminal’s business. Often, truck drivers are employed or contracted by the terminal’s customers to transport fuel from the terminal to the customer’s site. However, in some cases, the terminals may maintain their own tanker truck fleet and employ their own drivers.

NYSERDA Terminal Resiliency Assessment | Background 10
Based on the 19 terminals that were visited by NYSERDA representatives, the knowledge and experience level of the terminal management and employees is very strong. Most locations have employees with many years of experience and considerable knowledge of the operations, procedures, and risks inherent in the supply of petroleum fuels. They also provided the assessment team with perceptive observations and comments beyond the survey results which contributed to this assessment.
OVERVIEW OF NEW YORK STATE PETROLEUM SUPPLY AND INFRASTRUCTURE
NYS terminals rely on out-of-state supply and foreign imports to meet the State’s demand for liquid fuels. A large portion of this supply arrives at bulk petroleum terminals located in the New York Harbor (NYH) area, primarily in northern New Jersey. From NYH receipt terminals, the supply is redistributed via barges and pipelines to NYS distribution terminals, as well as to terminals in other Northeast markets.
The bulk of the petroleum supply to the region originates at major distribution hubs located along the Arthur Kill and Kill van Kull waterways in Northern New Jersey. The reliability and timely fuel flows from these terminals is critical to NYS consumers. This assessment, however, focuses on the terminals that are physically located in NYS, and that directly supply consumers and businesses in NYS.
The NYS petroleum terminals receive petroleum products through diverse modes of transportation. Pipelines bring in product from Mid-Atlantic and U.S. Gulf Coast refineries and distribute these fuels to markets throughout the State. Marine shipments bring in fuel from the U.S. Gulf Coast and from foreign sources. Barges also transport petroleum products (including ethanol) along the Hudson River between NYH, Newburgh, and Albany. Product also enters the State (and moves within it) along railways and interstate highway networks. The primary systems involved in transporting liquid fuels into and within NYS are as follows:
• The Colonial Pipeline transports petroleum products from refining hubs on the U.S. Gulf Coast to the NYH area.
• The Buckeye Pipeline receives volume from the Colonial Pipeline, the Phillips 66 refinery, and marine terminals into its Linden, New Jersey, hub and redistributes product into NYS via its pipeline network. From Linden, Buckeye supplies Upstate New York through pipelines running west through Pennsylvania, and it supplies New York City, Long Island, and JFK and LaGuardia airports through pipelines stemming east across Staten Island.
• Sunoco Logistics’ pipelines carry product from Philadelphia area refineries to Upstate New York and the NYH area.
• The Phillips 66 Bayway Refinery in Linden, New Jersey, supplies product to NYS via barge, truck, and through Buckeye’s pipeline system.
• The United Refinery in Warren, Pennsylvania, trucks product into western NYS. • Foreign and domestic marine shipments are delivered by tanker and barge to terminals in the
NYH area from various sources, including the Philadelphia refining hub.
NYSERDA Terminal Resiliency Assessment | Background 11
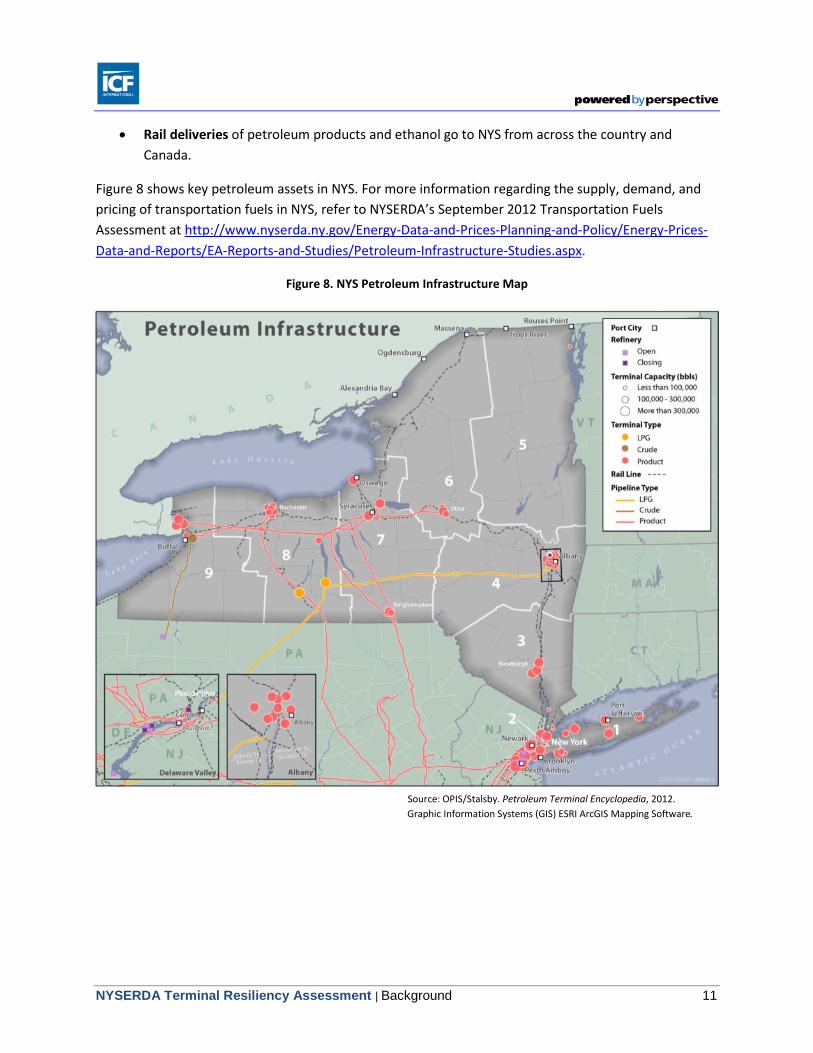
• Rail deliveries of petroleum products and ethanol go to NYS from across the country and Canada.
Figure 8 shows key petroleum assets in NYS. For more information regarding the supply, demand, and pricing of transportation fuels in NYS, refer to NYSERDA’s September 2012 Transportation Fuels Assessment at http://www.nyserda.ny.gov/Energy-Data-and-Prices-Planning-and-Policy/Energy-Prices-Data-and-Reports/EA-Reports-and-Studies/Petroleum-Infrastructure-Studies.aspx.
Figure 8. NYS Petroleum Infrastructure Map
Source: OPIS/Stalsby. Petroleum Terminal Encyclopedia, 2012.
Graphic Information Systems (GIS) ESRI ArcGIS Mapping Software.

NYSERDA Terminal Resiliency Assessment | Survey Results 12
SURVEY RESULTS
NYSERDA sent surveys to 74 petroleum terminals in NYS in the summer of 2013. Of these terminals, 55 responded to the survey, representing a 74 percent response rate (these 55 terminals are hereafter referred to as the “survey group”). The survey group was asked questions related to four main topic areas:
• Terminal Characteristics - questions about throughput, products supplied, markets served, and modes of receipt and distribution;
• Storm Effects from Superstorm Sandy, Hurricane Irene, and other major weather events: questions on whether terminal operations were disrupted, the duration of those disruptions, the causes of those disruptions, the effect and duration of power outages on terminal facilities, the effect of storm damage (e.g., wind, storm surge) on specific terminal components, and personnel availability issues;
• Hardening and Resiliency - questions about storm preparation activities, flood protection measures, and backup generation and other power resiliency measures; and
• Emergency Preparedness - questions related to emergency communications, emergency plans, and emergency drills.
The sections that follow summarize the results of the Terminal Survey. This assessment aggregates data gathered from the terminal survey and does not disclose terminal specific information. Where appropriate, distinctions have been made between Downstate terminals (those located in the Long Island, New York City, and Lower Hudson regions) and Upstate terminals (those located anywhere else in the State).
In addition to the Terminal Survey, NYSERDA made site visits to 19 terminals throughout the State. Information gathered during these site visits is used to supplement the survey data and provide an on-the-ground perspective of the efforts made by NYS terminals to enhance the hardening and resiliency of their facilities against future storm events. Where appropriate, photos from these site visits have been included.
The purpose of this assessment is to provide insight to stakeholders on the different actions that NYS terminals have taken to prepare and strengthen their facilities against future storms. Hurricanes and other major weather events affect terminals in different ways, depending on a number of site-specific factors, and there is no specific level of hardening that applies to every terminal. Terminal operators tailor their hardening and storm preparation measures to the specific threats and vulnerabilities that apply to their facilities.
NYSERDA Terminal Resiliency Assessment | Terminal Characteristics 13
TERMINAL CHARACTERISTICS
NYS terminals vary according to a number of factors, including storage capacity, throughput, region, markets served, products supplied, modes of receipt, and modes of distribution. The breakdown of terminals in the survey group along these factors is summarized in the sections below.
TERMINALS BY STORAGE CAPACITY
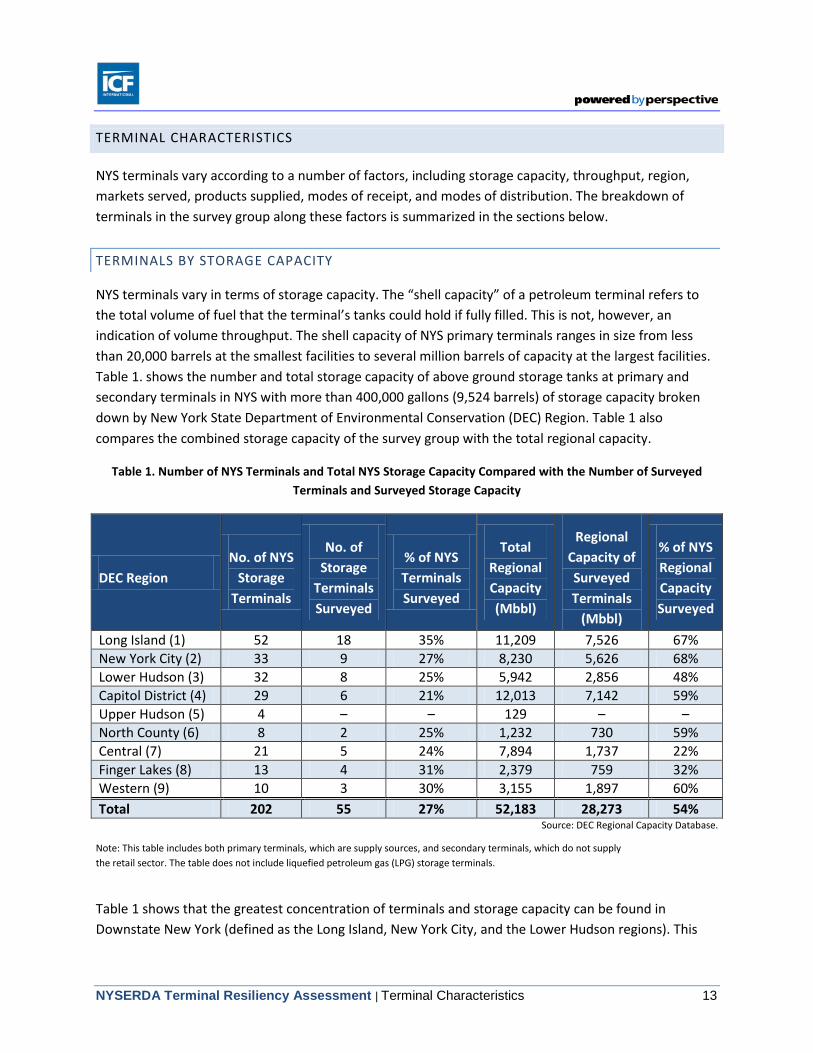
NYS terminals vary in terms of storage capacity. The “shell capacity” of a petroleum terminal refers to the total volume of fuel that the terminal’s tanks could hold if fully filled. This is not, however, an indication of volume throughput. The shell capacity of NYS primary terminals ranges in size from less than 20,000 barrels at the smallest facilities to several million barrels of capacity at the largest facilities. Table 1. shows the number and total storage capacity of above ground storage tanks at primary and secondary terminals in NYS with more than 400,000 gallons (9,524 barrels) of storage capacity broken down by New York State Department of Environmental Conservation (DEC) Region. Table 1 also compares the combined storage capacity of the survey group with the total regional capacity.
Table 1. Number of NYS Terminals and Total NYS Storage Capacity Compared with the Number of Surveyed Terminals and Surveyed Storage Capacity
DEC Region No. of NYS
Storage Terminals
No. of Storage
Terminals Surveyed
% of NYS Terminals Surveyed
Total Regional Capacity (Mbbl)
Regional Capacity of Surveyed Terminals
(Mbbl)
% of NYS Regional Capacity Surveyed
Long Island (1) 52 18 35% 11,209 7,526 67% New York City (2) 33 9 27% 8,230 5,626 68% Lower Hudson (3) 32 8 25% 5,942 2,856 48% Capitol District (4) 29 6 21% 12,013 7,142 59% Upper Hudson (5) 4 – – 129 – – North County (6) 8 2 25% 1,232 730 59% Central (7) 21 5 24% 7,894 1,737 22% Finger Lakes (8) 13 4 31% 2,379 759 32% Western (9) 10 3 30% 3,155 1,897 60% Total 202 55 27% 52,183 28,273 54%
Source: DEC Regional Capacity Database.
Note: This table includes both primary terminals, which are supply sources, and secondary terminals, which do not supply the retail sector. The table does not include liquefied petroleum gas (LPG) storage terminals.
Table 1 shows that the greatest concentration of terminals and storage capacity can be found in Downstate New York (defined as the Long Island, New York City, and the Lower Hudson regions). This

NYSERDA Terminal Resiliency Assessment | Terminal Characteristics 14
area has 117 terminals, or 58 percent of the terminals in NYS, and more than 25 million barrels of storage capacity, equating to 49 percent of the State’s total. The concentration of terminals and storage capacity in this area is driven by the high demand for fuels by the large population. It is important to note, however, that storage capacity does not necessarily correlate with terminal throughput, the volume of fuel that actually flows through the terminal to end-user customers on a daily basis. Storage capacity and throughput can vary for a number of reasons. Terminals that receive or send out large, infrequent deliveries of products on marine barges and vessels typically have higher storage capacities in order to fully fill or accept the vessel’s cargo during product loading and unloading. Terminals that send out or receive more frequent deliveries by pipeline often require less storage, although this is dependent on the cycle of pipeline deliveries. The throughput of the survey group terminals will be discussed in detail in the next section.
The data in Table 1 also compares the total number of terminals in NYS with the number of terminals surveyed by NYSERDA for this assessment. It is important to note that the total number and capacity of NYS terminals in Table 1 includes secondary terminals, which do not supply fuel to the retail sector (see Background for a discussion of the differences between primary and secondary terminals). Overall, NYSERDA received responses from 55 terminals, accounting for more than one-fourth of all the terminals in the State. These terminals were mostly larger, primary terminals with a combined storage capacity of more than 28 million barrels, or more than half of the total storage capacity in NYS. NYSERDA surveyed between 21 percent and 35 percent of each DEC Region’s terminals and those terminals represented 22 percent to 68 percent of each Region’s storage capacity. In the Downstate area, NYSERDA surveyed 35 terminals, representing 29 percent of the total number of the area’s terminals, but nearly two-thirds of the area’s storage capacity. In the Upstate area (defined as all regions of New York not defined as Downstate); NYSERDA surveyed 20 terminals, representing 35 percent of the area’s terminals and 46 percent of the area’s capacity.
TERMINALS BY THROUGHPUT
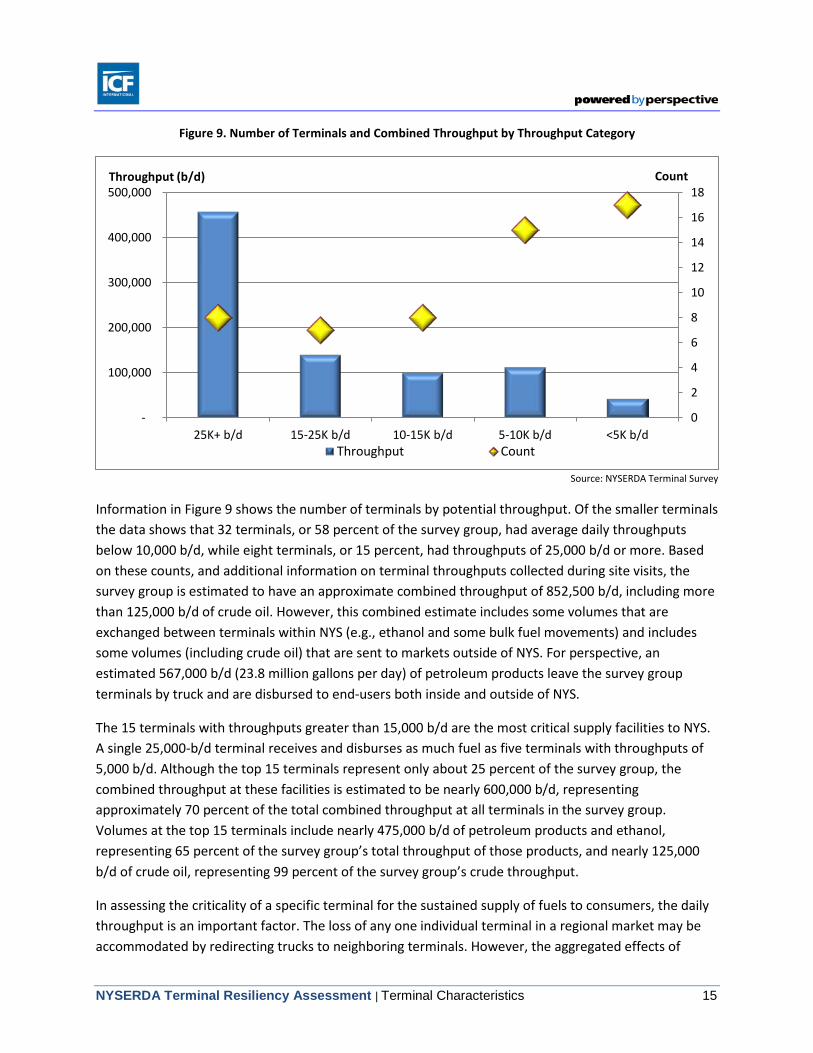
The average daily throughput of a terminal is the volume of liquid fuel that moves through the terminal each day and is typically measured in barrels per day (b/d). In general, high-throughput terminals are either major distribution hubs, and/or tend to be located in high-population areas where high demand for petroleum products requires constant turnover of inventory. A terminal’s throughput is not always constant; many terminals have higher throughput of certain products on a seasonal basis (e.g., heating oil during the winter months). Figure 9 below breaks down the survey group across five nonlinear throughput categories: less than 5,000 b/d, 5,000–9,999 b/d, 10,000–14,999 b/d, 15,000–24,999 b/d, and 25,000 b/d or more. For perspective, 25,000 b/d represents 1.05 million gallons per day of deliveries.
NYSERDA Terminal Resiliency Assessment | Terminal Characteristics 15
Figure 9. Number of Terminals and Combined Throughput by Throughput Category
0
2
4
6
8
10
12
14
16
18
-
100,000
200,000
300,000
400,000
500,000
25K+ b/d 15-25K b/d 10-15K b/d 5-10K b/d <5K b/d
Count Throughput (b/d)
Throughput Count
Source: NYSERDA Terminal Survey
Information in Figure 9 shows the number of terminals by potential throughput. Of the smaller terminals the data shows that 32 terminals, or 58 percent of the survey group, had average daily throughputs below 10,000 b/d, while eight terminals, or 15 percent, had throughputs of 25,000 b/d or more. Based on these counts, and additional information on terminal throughputs collected during site visits, the survey group is estimated to have an approximate combined throughput of 852,500 b/d, including more than 125,000 b/d of crude oil. However, this combined estimate includes some volumes that are exchanged between terminals within NYS (e.g., ethanol and some bulk fuel movements) and includes some volumes (including crude oil) that are sent to markets outside of NYS. For perspective, an estimated 567,000 b/d (23.8 million gallons per day) of petroleum products leave the survey group terminals by truck and are disbursed to end-users both inside and outside of NYS.
The 15 terminals with throughputs greater than 15,000 b/d are the most critical supply facilities to NYS. A single 25,000-b/d terminal receives and disburses as much fuel as five terminals with throughputs of 5,000 b/d. Although the top 15 terminals represent only about 25 percent of the survey group, the combined throughput at these facilities is estimated to be nearly 600,000 b/d, representing approximately 70 percent of the total combined throughput at all terminals in the survey group. Volumes at the top 15 terminals include nearly 475,000 b/d of petroleum products and ethanol, representing 65 percent of the survey group’s total throughput of those products, and nearly 125,000 b/d of crude oil, representing 99 percent of the survey group’s crude throughput.
In assessing the criticality of a specific terminal for the sustained supply of fuels to consumers, the daily throughput is an important factor. The loss of any one individual terminal in a regional market may be accommodated by redirecting trucks to neighboring terminals. However, the aggregated effects of
NYSERDA Terminal Resiliency Assessment | Terminal Characteristics 16
multiple terminal outages during a hurricane, or a severe and extended winter storm, can result in significant disruption in supply to consumers, and also affect fuel needs for storm recovery. The survey indicated that the top 15 terminals by throughput are more likely to have implemented facility hardening and power resiliency measures than lower-throughput terminals. Twelve of the 15 terminals with throughputs of 15,000 b/d or higher reported either having backup generators at their facilities capable of fully powering throughput operations or had the ability to rapidly obtain generators with such capabilities during emergencies. Backup generation capability at high-throughput terminals will be discussed in greater detail in the Backup Power Systems subsection of the Hardening and Resiliency section in this report.
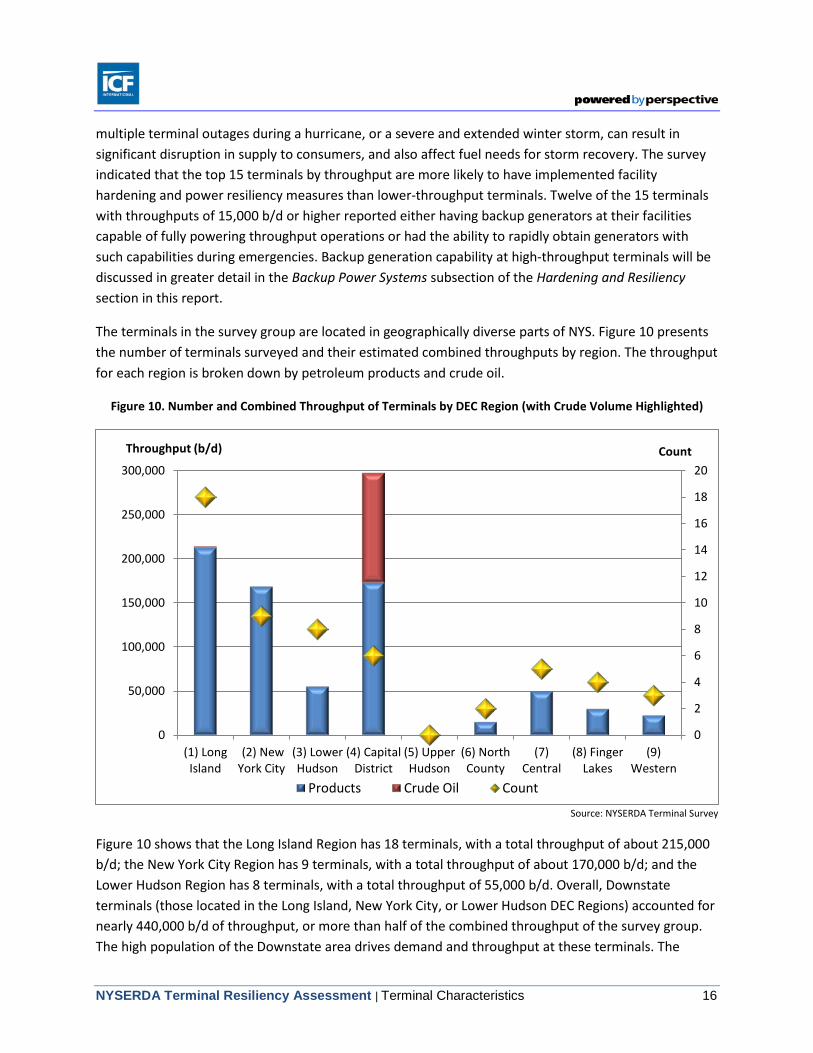
The terminals in the survey group are located in geographically diverse parts of NYS. Figure 10 presents the number of terminals surveyed and their estimated combined throughputs by region. The throughput for each region is broken down by petroleum products and crude oil.
Figure 10. Number and Combined Throughput of Terminals by DEC Region (with Crude Volume Highlighted)
0
2
4
6
8
10
12
14
16
18
20
0
50,000
100,000
150,000
200,000
250,000
300,000
(1) Long Island
(2) New York City
(3) Lower Hudson
(4) Capital District
(5) Upper Hudson
(6) North County
(7) Central
(8) Finger Lakes
(9) Western
Count Throughput (b/d)
Products Crude Oil Count
Source: NYSERDA Terminal Survey
Figure 10 shows that the Long Island Region has 18 terminals, with a total throughput of about 215,000 b/d; the New York City Region has 9 terminals, with a total throughput of about 170,000 b/d; and the Lower Hudson Region has 8 terminals, with a total throughput of 55,000 b/d. Overall, Downstate terminals (those located in the Long Island, New York City, or Lower Hudson DEC Regions) accounted for nearly 440,000 b/d of throughput, or more than half of the combined throughput of the survey group. The high population of the Downstate area drives demand and throughput at these terminals. The

NYSERDA Terminal Resiliency Assessment | Terminal Characteristics 17
combined throughput of the Capital District terminals (nearly 300,000 b/d) accounts for 36 percent of the total combined throughput of the survey group, making it the highest-throughput DEC Region in the State. The terminals in the Capital District serve as northern termini for products shipped up the Hudson River from NYH for local consumption and for further redistribution to North County and other inland destinations. Throughput at terminals in the Capital District also includes volumes of crude oil, which are sent by rail into Albany from North Dakota and loaded onto barges for distribution to refineries outside of NYS, and ethanol, which is sent by rail from the Midwest and shipped by barge to Downstate terminals for blending with gasoline. The crude and ethanol movements are significant contributors to the high throughput in this region.
PRODUCTS SUPPLIED
NYS terminals distribute a variety of liquid fuels, including gasoline/E-10, heating oil, diesel fuel, residual fuel oil (RFO), ethanol, kerosene, jet fuel, and crude oil. Figure 11 presents the number of terminals where each fuel is available, as well as the estimated combined throughput of each fuel at those terminals. Although heating oil and diesel were the fuels most widely available at the survey group’s terminals, available at 43 and 46 terminals, respectively, gasoline/E-10 made up the largest share of the survey group’s total throughput, with 28 terminals delivering nearly 330,000 b/d, or 44 percent of all liquid fuels supplied. Heating oil and diesel fuel represent approximately 23 percent and 14 percent of total throughput, respectively, with RFO, ethanol, kerosene, and jet fuel making up 11 percent. Crude oil, which is transshipped at NYS terminals to markets outside the State, made up 6 percent of the throughput at survey group terminals. The remaining 2 percent is the volume of other products, primarily liquid asphalt.
Figure 11. Number of Terminals and Estimated Fuel Throughput by Liquid Fuel Type
0
5
10
15
20
25
30
35
40
45
50
-
50,000
100,000
150,000
200,000
250,000
300,000
350,000
Gas/E-10 Heating Oil
Diesel RFO Ethanol Kerosene Jet Fuel Crude Other
Count Throughput (b/d)
Throughput Count Source: NYSERDA Terminal Survey

NYSERDA Terminal Resiliency Assessment | Terminal Characteristics 18
MODES OF RECEIPT AND DISBURSEMENT
NYS terminals receive and distribute liquid fuel by pipeline, marine tanker and barge, rail, and truck. Figure 12 presents modes of receipt and distribution at NYS terminals by number of terminals and throughput. The left side, Receipts, of Figure 12 shows the number of terminals in the survey group that reported receiving fuel from each transportation mode, as well as the estimated combined volumes received by the survey group from each transportation mode. The right side, Disbursements, of Figure 12 shows the number of terminals in the survey group that reported distributing fuel by each transportation mode and the estimated volume of disbursements by each.
Figure 12. Number of Terminals Receiving/Distributing Fuel and Estimated Fuel Receipts/Disbursements by Transportation Mode
0
10
20
30
40
50
60
-
100,000
200,000
300,000
400,000
500,000
600,000
Marine Pipeline Rail Truck Marine Pipeline Rail Truck
Count Throughput (b/d)
Throughput Count
Receipts Disbursements
Source: NYSERDA Terminal Survey
Figure 12 shows that although nearly two-thirds of the survey group reported receiving at least some fuel by truck, estimated volumes of fuel received by truck represent only 5 percent of the survey group’s total receipts. Terminals that receive fuel by truck are typically smaller facilities, particularly those serving local heating oil distribution companies. This fuel is often immediately loaded onto local distribution trucks for delivery to end-users. Even many larger terminals that are equipped to receive product through higher-volume modes occasionally receive deliveries by truck to augment their supply. Many of the Upstate distribution terminals receive ethanol supplies by truck, because it cannot be shipped by pipeline, to blend into gasoline for final delivery to retail outlets. The terminals with marine access typically receive ethanol by barge.
By volume, marine tankers and barges were the most prevalent mode of receipt, bringing in more than 360,000 b/d of fuel, or more than 40 percent of the survey group’s total receipts. The terminals in the

NYSERDA Terminal Resiliency Assessment | Terminal Characteristics 19
Lower Hudson, Capital District, and much of the north shore of Long Island are supplied 100 percent by marine movements. The terminals in New York City and the south shore of Long Island can be supplied by marine or pipeline, or both, depending on the location.
Pipeline delivery is the next most prevalent mode of receipt at NYS terminals, delivering nearly 290,000 b/d to NYS terminals, or more than 33 percent of the survey group’s total volume. The terminals in the Long Island and New York City regions receive product from northern New Jersey via the Buckeye Pipeline. Upstate markets, including Binghamton, Buffalo, Rochester, Syracuse, and Utica are served by the Buckeye system, as well as two Sunoco Logistics pipelines from the Philadelphia area. See the Overview of New York State Petroleum Supply and Infrastructure subsection in the Background section for more details on the pipeline systems serving NYS.
Rail deliveries to NYS terminals represent nearly one-fifth of all receipts reported by the survey group. Liquid fuels moving on rail to NYS typically originate in the Midwest, and include crude oil, ethanol, and finished petroleum products. These deliveries are then transshipped to destination terminals by barge or truck (ethanol) or barge and ship (crude oil).
Overwhelmingly, truck was the survey group’s most prevalent mode of distribution in terms of both the number of terminals using trucks for distribution and the total estimated volume of fuel distributed by truck. Of the survey group, 53 terminals, or 96 percent, used trucks to distribute more than 567,000 b/d of fuel, or more than two-thirds of all volume distributed. Marine was the next most popular mode of distribution, representing 28 percent of all distribution volumes (much of this from the Albany crude and ethanol hubs), followed by pipeline and rail with 4 percent each.
OWNERSHIP
NYS terminals are owned and operated by a range of companies that vary in terms of their size, their ownership (public versus private), the geography of their operations, and the degree of their involvement at different levels of the petroleum supply chain. British Petroleum and Shell (through its joint-venture Motiva) are the only “supermajors” that own and operate NYS terminals. As integrated firms, these companies have operations throughout the supply chain, from upstream exploration and production to petroleum refining to wholesale and retail distribution, as well as business operations around the world. Other large companies operating in NYS focus exclusively on the “midstream” portion of the supply chain, which involves the transportation (by pipeline, marine, rail, or truck), storage, and wholesale marketing of petroleum products. These companies range in size from small, local, family-owned businesses that operate one or two terminals in NYS, to large, publicly traded distribution companies with nationwide operations.
The terminals in the survey group were placed into two categories: national or multinational companies, which are large companies that have operations throughout the United States or around the world, and regional or local companies, which operate exclusively in the Northeast or Mid-Atlantic. The national or multinational companies do not fit a specific profile because some are fully integrated businesses, while

NYSERDA Terminal Resiliency Assessment | Terminal Characteristics 20
others are midstream focused. Figure 13 compares the total number of terminals and the combined throughput by ownership type.
Figure 13. Number of Terminals and Combined Throughput by Ownership Type
By Number
By Throughput
28 51%
27 49%
National orMultinationalCompany
Regional or LocalCompany
582,500 68%
270,000 32%
Source: NYSERDA Terminal Survey
Figure 13 shows that of the 55 terminals in the survey group, there was an almost even ownership split between the two ownership types. It should be noted that in addition to large, primary petroleum terminals, there are many companies that operate terminals that are considered secondary terminals (explained further in the Background section). These secondary terminals may be in conjunction with large end-users (e.g., airports, power generation facilities) or they may be small facilities that store smaller quantities of product for local distribution (e.g. heating oil depots).
Also identified in Figure 13 is the total estimated throughput of the survey group by ownership type. Although the two ownership types are almost identical in count, national and multinational companies tend to have larger facilities with higher throughput rates. The average throughput rate of a terminal owned by a national or multinational company was estimated at more than 20,000 b/d, in comparison to regional or local companies that have a throughput of roughly 10,000 b/d.

NYSERDA Terminal Resiliency Assessment | Storm Effects 21
STORM EFFECTS
The NYS petroleum supply chain was severely disrupted by Superstorm Sandy in 2012 and to a lesser extent by Hurricane Irene in 2011. Although not all NYS terminals experienced facility damage or power outages from Superstorm Sandy, nearly all terminals in the State were affected to some degree by the shutdown of shipping in NYH, as well as the loss of pipeline throughput. In the Downstate market the loss of fuel flow on the Buckeye pipeline from Linden into Brooklyn, Long Island, and Queens was critical. And in the Upstate market, the reduction in flow volumes on the two Buckeye pipelines moving west from Linden to Macungie, Pennsylvania and north into New York impacted those markets. Both of these Buckeye Pipeline system components are essential for the movement of fuel to the Downstate and Upstate petroleum markets (see Overview of New York State Petroleum Supply and Infrastructure for more information on key infrastructure supplying NYS).
The following sections will summarize the effects of recent weather events on NYS petroleum terminals by quantifying the number of terminals and aggregate throughput affected by region; the causes of terminal disruptions; the types of supply disruptions to terminals; the effects of power outages on terminal operations; the specific effects on terminal components; and the effects on personnel availability.
TERMINALS AFFECTED
The continuous operations and fuel flows to terminals throughout NYS were affected by Superstorm Sandy and Hurricane Irene. Figure 14 shows the percentage of terminals surveyed that reported interruptions to terminal out-loading as a result of the two storms. The results are shown for Downstate terminals (those in the Long Island, New York City, or Lower Hudson regions), Upstate terminals (those in all other regions), and for the survey group as a whole. These interruptions had one or more causes, including disruption of supply by barge or pipeline to the terminal; disruption to terminal operations caused by storm damage or power outages; and disruption of customer’s ability to receive fuel.

NYSERDA Terminal Resiliency Assessment | Storm Effects 22
Figure 14. Percentage of Terminals and Throughput Disrupted by Superstorm Sandy and Hurricane Irene by Area
60%
25%
47%
75%
16%
47%
29%
10%
22%
35%
5%
21%
0%
10%
20%
30%
40%
50%
60%
70%
80%
Downstate Upstate Total State Downstate Upstate Total State Sandy Irene
% of Terminals % of Throughput
Source: NYSERDA Terminal Survey
Of the 55 terminals in the survey group, 47 percent reported interruptions to terminal out-loading as a result of Superstorm Sandy, while 21 percent reported interruptions due to Hurricane Irene. Downstate terminals were the most widely affected by both storms, with 60 percent and 29 percent reporting interruptions due to Superstorm Sandy and Hurricane Irene, respectively, compared to 25 percent and 10 percent, respectively, reported by Upstate terminals. When measured by terminal throughput, the Downstate terminals reported disruptions of 75 percent and 35 percent from Sandy and Irene, respectively, compared to throughput interruptions of 16 percent and 5 percent, respectively, for Upstate terminals. Of the terminals that reported interruptions to operations due to Superstorm Sandy, the average duration was 9 days, although this average includes one terminal that was out for 90 days and another terminal that was out for 50 days. In comparison, the average interruption due to Hurricane Irene lasted just 2 days.
In addition to the effects from Sandy and Irene, one terminal located in the Central region of New York reported being disrupted due to Tropical Storm Lee in 2011, one terminal on Long Island reported being disrupted by the 1993 Nor’easter, and one Finger Lakes terminal reported being disrupted by a major ice storm in 1991. Other terminals mentioned occasional interruptions due to other weather events, including thunderstorms and blizzards.
TERMINAL INTERRUPTIONS BY CAUSE
Terminals in NYS were affected by Superstorm Sandy and Hurricane Irene in numerous ways. In some cases, fuel supply to terminals by pipeline and/or marine shipments was disrupted, leaving the terminals unable to re-supply after inventory in their tanks had been out-loaded to retail locations and other end-users. Even if they had electric grid system power or backup generators they had no fuel to distribute. In

NYSERDA Terminal Resiliency Assessment | Storm Effects 23
other cases, terminal operations suffered onsite damage to terminal equipment (e.g., pumps, electrical equipment) that disrupted the terminal’s ability to receive and/or disburse fuel. In still other cases, the terminal’s out-loading was interrupted due to disruptions to the customers’ ability to receive fuel (e.g., many retail fuel stations were without power and could not pump fuel for many days following Superstorm Sandy). Figure 15 shows the percentage of the survey group that reported disruptions to terminal out-loading by cause and storm. In many cases, the terminals cited more than one cause.
Figure 15. Cause of Interruptions to Terminal Out-Loading by Storm
47%
36%
31%
20%
22%
16%
18%
11%
0% 10% 20% 30% 40% 50%
Total Reporting Interruptions
Supply to Terminal
Terminal Operations
Customers' Ability to Receive Fuel
Sandy Irene
Reporting Disruptions to:
Source: NYSERDA Terminal Survey
Survey responses shown in Figure 15 indicates that disruptions to terminal supply, terminal operations, and customers’ ability to receive fuel were all widely cited for causing terminal fuel flow interruptions after Superstorm Sandy and Hurricane Irene. For Superstorm Sandy, terminal fuel supply interruptions were the most cited cause of terminal operational disruptions, affecting 36 percent of the survey group, with more than three-fourths of those terminals reporting impacts from that specific storm. This result is driven by the shutdown of pipeline supply from the Buckeye Pipeline system and the disruption to Barge shipping in NYH. A breakdown of the specific modes of supply affected by recent weather events follows in Figure 16. For Superstorm Sandy, 31 percent of the survey group reported disruptions to terminal operations at the facility site and 20 percent of terminal customers having problems receiving fuel. A breakdown of the specific terminal components affected by recent weather events and the specific causes of these disruptions are described later in this section.

NYSERDA Terminal Resiliency Assessment | Storm Effects 24
SUPPLY DISRUPTIONS TO TERMINALS BY MODE
As noted in the previous section, a significant share of NYS terminals surveyed reported experiencing supply disruptions as a result of Superstorm Sandy and Hurricane Irene. Supply disruptions are situations in which supply infrastructure operated by third parties, such as pipelines, ports and waterways, railways, or roadways have been disrupted, thus interrupting or slowing supply from reaching the terminal. Supply disruptions can affect a terminal even if the terminal is located far from the area affected by the storm. Figure 16 compares the percentage of terminals that reported receiving supply from a particular mode of transportation (i.e., marine, pipeline, rail, or truck) with the percentage of terminals that reported experiencing supply disruptions due to storm-related problems with those modes. In some cases, the percentage of terminals reporting disruptions by a particular mode exceeds the percentage of terminals that reported receiving supply via this mode. This is because some terminals reported being affected by shipping or pipeline outages further up the supply chain. For example, one terminal that receives product entirely by truck reported being affected by marine disruptions at a large primary terminal from which those supply trucks originated. This is an example of how disruptions at one terminal can cascade throughout the terminal network.
Figure 16. Percentage of Terminals Receiving Fuel by Supply Mode and Percentage of Terminals Experiencing Storm-Related Supply Disruptions by Supply Mode: Total State, Upstate, and Downstate
42%
53%
67%
11%
23%
66%
74%
3%
75%
30%
55%
25%
36%
56%
31%
4%
29%
69%
37%
3%
50%
35%
20%
5%
0% 10% 20% 30% 40% 50% 60% 70% 80%
Pipeline
Marine
Truck
Rail
Pipeline
Marine
Truck
Rail
Pipeline
Marine
Truck
Rail
Tota
l Sta
te
Dow
nsta
te
Ups
tate
Recieves Fuel via Disrupted During Recent Storms
Source: NYSERDA Terminal Survey
NYSERDA Terminal Resiliency Assessment | Storm Effects 25
Total statewide data in Figure 16 indicates that for marine shipments, 56 percent of all terminals reported experiencing supply disruptions in recent years due to storm-related effects along ports and waterways, primarily due to the shutdown of shipping in NYH for several days during Superstorm Sandy and Hurricane Irene. This is higher than the 53 percent of terminals that report receiving fuel supply via marine shipments because three terminals that receive supply via truck reported that marine supply had been disrupted to upstream source terminals where those trucks originate. Marine shipping disruptions heavily affected the Downstate market where 69 percent of terminals reported experiencing disruptions to marine supply. Nearly all of the terminals that receive fuel by pipeline reported being affected by storm-related disruptions to pipeline infrastructure, due in large part to the shutdown of the two Buckeye pipelines serving Long Island and the reduction in fuel flow on the two pipelines serving Upstate following Superstorm Sandy. Pipeline disruptions were most heavily felt in Upstate markets, where 75 percent of all terminals receive fuel by pipeline. Less than half of those terminals that receive fuel by rail or truck reported experiencing disruptions to those modes as a result of recent storms. This may be because rail and road infrastructures are more resilient and have greater redundancies than pipeline and marine pathways.
POWER OUTAGES
Terminals in NYS experienced two types of power outages following Superstorm Sandy and Hurricane Irene: power outages due to loss of grid power and outages due to damage to terminal electrical equipment. The most common type of outage was the loss of grid power. Many terminals that lost grid power either had power restored quickly or were able to obtain and install backup generators to run facility equipment within a few days of the storm (backup generators will be covered in Hardening and Resiliency). In some of the areas hardest hit by Superstorm Sandy, grid power remained unstable for weeks after the storm had passed, and terminals choose continued to run on generators even after grid power was initially restored to ensure steady operations and avoid power supply fluctuations.
The more severe type of power outage reported by terminals involved damage to onsite electrical equipment, including electrical switchgear, motor control centers, and wiring. This damage was primarily caused by saltwater inundation of underground or ground-level electrical equipment in low-lying areas within the terminal facility. Electrical equipment that is exposed to saltwater and other floodwater contaminants presents a serious fire hazard and these facilities would not be able to accept power even if it were available from the grid or a backup generator. Terminals that experienced flooding of electrical equipment typically reported longer power outages because flooded equipment needed to be removed, dried out, cleaned up, and re-installed by outside contractors before power could be restored, or replaced entirely at significant cost and time lag.
The chart on the left in Figure 17 presents the percentage of Downstate, Upstate, and Total State surveyed terminals that reported losing power as a result of the two storms. The chart on the right in Figure 17 presents the percentage of terminal throughput that was affected by these outages.

NYSERDA Terminal Resiliency Assessment | Storm Effects 26
Figure 17. Percentage of Terminals that Lost Power and Percentage of Terminal Throughput Lost by Storm and Area
43%
5%
29%
60%
3%
32%
20%
10%
16%
27%
5%
16%
0%
10%
20%
30%
40%
50%
60%
70%
Downstate Upstate Total State Downstate Upstate Total State
Sandy Irene
% of Terminals % of Throughput
Source: NYSERDA Terminal Survey
Figure 17 shows that a larger share of Downstate terminals lost power during Superstorm Sandy than during Hurricane Irene, but a larger share of Upstate terminals lost power during Hurricane Irene than Superstorm Sandy. Power outages were reported by 43 percent of Downstate terminals during Sandy, accounting for 60 percent of the area’s throughput. During Hurricane Irene, 20 percent of Downstate terminals reported losing power; accounting for 27 percent of Downstate throughput. The data also illustrates how limited an impact power outages by either storm had on the Upstate region.
Figure 18 shows the average duration of the power outages experienced by those terminals that reported power outages during Superstorm Sandy and Hurricane Irene.

NYSERDA Terminal Resiliency Assessment | Storm Effects 27
Figure 18. Average Duration of Power Outages by Storm and Area
88
2
82
48
28
43
0 10 20 30 40 50 60 70 80 90 100
Downstate
Upstate
Total State
Hours Sandy Irene
Source: NYSERDA Terminal Survey
As shown in Figure 18, the average duration of power outages for the Total State lasted almost twice as long after Superstorm Sandy (82 hours) than Hurricane Irene (43 hours). This result is driven, in large part, by two terminals in the Downstate area that reported being without power for a week or longer after Sandy. Both of these terminals reported flood damage to electrical equipment within the terminal facility that needed to be dried out or replaced. While Sandy caused longer-lasting power outages for Downstate terminals (88 hours) than Hurricane Irene (48 hours), the opposite was true for Upstate terminals. The average duration of power outages for Upstate terminals after Sandy was only 2 hours, compared to 28 hours after Irene. Overall, both storms caused longer-lasting power outages for Downstate terminals due to the paths of the storms and the fact that wind damage and storm surge were most intense in coastal Downstate areas.
EFFECTS BY TERMINAL COMPONENT AND DAMAGE TYPE
Superstorm Sandy and Hurricane Irene directly affected terminal facilities in NYS in a number of ways: Storm surge waters inundated key equipment, wind and airborne debris slammed into facility structures, and power outages shut down power-dependent operations. These effects were felt across the various components that make up the terminal, including pipeline interconnections, marine docks, tank farms, truck loading racks, control systems, and communications systems. Figure 19 shows the percentage of the terminals that reported experiencing damage to each terminal component by the type of damage. Although the effects reported in Figure 19 are not broken down by area, the survey data and discussions with terminal managers indicates that direct effects on terminal facilities from wind and storm surge were almost exclusively reported by Downstate New York terminals that experienced the brunt of Superstorm Sandy and Hurricane Irene.

NYSERDA Terminal Resiliency Assessment | Storm Effects 28
Figure 19. Percentage of Terminals Reporting Storm Effects by Terminal Component
42%
53%
100%
96%
100%
100%
33%
16%
13%
44%
31%
35%
13%
44%
5%
13%
15%
7%
2%
5%
5%
5%
4%
4%
0% 20% 40% 60% 80% 100% 120%
Pipeline Interconnect
Marine Dock
Tanks
Loading Racks
Control System
Communications
Have Component Power Outage Storm Surge Wind Damage
Source: NYSERDA Terminal Survey
The information presented in Figure 19 shows that power outages had the most widely felt effect on five of the six terminal components identified, including truck loading racks (44 percent), pipeline interconnections (33 percent), tank farms (13 percent), control systems (31 percent), and communications (35 percent). The majority of terminals with pipeline interconnections reported losing power to these facilities: of the 23 terminals (representing 42 percent of all terminals) that have pipeline interconnections, 18 terminals (representing 33 percent of all terminals) reported that their interconnections lost power as a result of recent storms. Nearly all terminals that have docks reported being impacted by storm surge: 29 terminals (representing 51 percent of all terminals) have marine docks and 24 of these terminals (representing 44 of all terminals) reported experiencing storm surge effects at their docks. In addition, 13 percent of all terminals reported storm surge effects at their
NYSERDA Terminal Resiliency Assessment | Storm Effects 29
pipeline interconnection facilities and loading racks. Control systems and communications systems were affected by storm surge at 15 percent and 7 percent of terminals, respectively. As mentioned in the previous section, terminals that experienced the longest outages experienced saltwater damage to the electrical systems and motor control centers. Only 5 percent of the terminals reported storm surge damage to product tanks. One of these terminals reported that floodwater carved out the ground beneath one of its tanks, but the tank itself did not shift. Damage from wind was the least reported storm effect, affecting 5 percent or less of each terminal component type.
PERSONNEL AVAILABILITY ISSUES
Petroleum terminal operations require a variety of full- and part-time staff and contractors for operations and maintenance of critical mechanical and electrical systems. Trained facility personnel are needed to turn valves, operate equipment, and facilitate loading and unloading operations at the terminal. Terminals also need service personnel for inspection and upkeep of specialized equipment, and truck drivers (although often employed by the terminal’s customers) are needed to deliver fuel out of the terminal (see the Terminal Staff subsection in the Background section). Superstorm Sandy caused significant damage to homes and vehicles in the Downstate area, making it difficult for some terminal staff to make it to the facility site. In addition, flooded and debris-filled roadways, and power outages to traffic lights often made transit to terminal facilities dangerous or, in some cases, impossible. Furthermore, in addition to the regular staff needed for day-to-day operations and maintenance, terminals often need specialized contractors to help get the terminal up and running following a major storm. In the aftermath of Superstorm Sandy, terminals reported needing outside contractors to inspect and/or replace electrical equipment and pump motors that had been inundated by floodwater, and some terminals needed electricians to install backup generators. In the aftermath of Sandy, demand for electricians and other licensed technicians was high due to the widespread damage that the storm caused.
Figure 20 shows the percentage of terminals that reported having issues related to personnel availability after Superstorm Sandy and Hurricane Irene. The results are broken down by personnel type (i.e., facility personnel, service personnel, truck drivers, and outside personnel), as well as by area (i.e., total, Downstate, and Upstate).
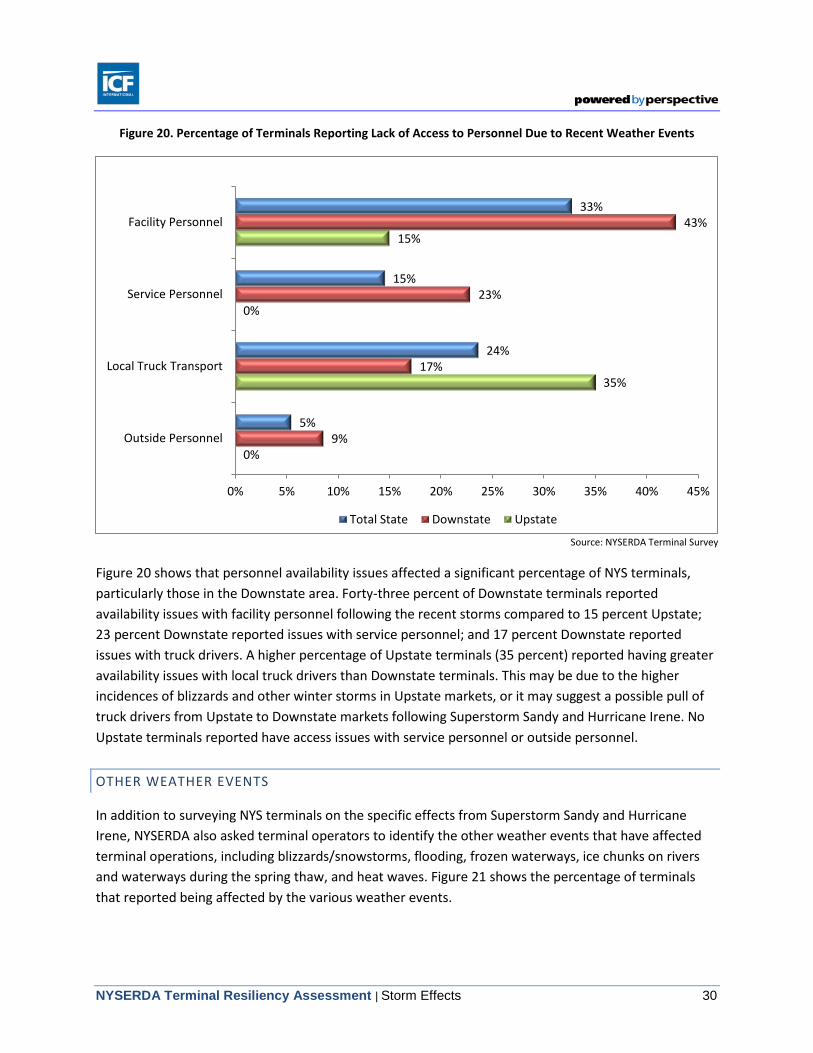
NYSERDA Terminal Resiliency Assessment | Storm Effects 30
Figure 20. Percentage of Terminals Reporting Lack of Access to Personnel Due to Recent Weather Events
33%
15%
24%
5%
43%
23%
17%
9%
15%
0%
35%
0%
0% 5% 10% 15% 20% 25% 30% 35% 40% 45%
Facility Personnel
Service Personnel
Local Truck Transport
Outside Personnel
Total State Downstate Upstate
Source: NYSERDA Terminal Survey
Figure 20 shows that personnel availability issues affected a significant percentage of NYS terminals, particularly those in the Downstate area. Forty-three percent of Downstate terminals reported availability issues with facility personnel following the recent storms compared to 15 percent Upstate; 23 percent Downstate reported issues with service personnel; and 17 percent Downstate reported issues with truck drivers. A higher percentage of Upstate terminals (35 percent) reported having greater availability issues with local truck drivers than Downstate terminals. This may be due to the higher incidences of blizzards and other winter storms in Upstate markets, or it may suggest a possible pull of truck drivers from Upstate to Downstate markets following Superstorm Sandy and Hurricane Irene. No Upstate terminals reported have access issues with service personnel or outside personnel.
OTHER WEATHER EVENTS
In addition to surveying NYS terminals on the specific effects from Superstorm Sandy and Hurricane Irene, NYSERDA also asked terminal operators to identify the other weather events that have affected terminal operations, including blizzards/snowstorms, flooding, frozen waterways, ice chunks on rivers and waterways during the spring thaw, and heat waves. Figure 21 shows the percentage of terminals that reported being affected by the various weather events.

NYSERDA Terminal Resiliency Assessment | Storm Effects 31
Figure 21. Other Weather Events Affecting Terminal Operations
49%
22%
9%
5%
4%
0% 10% 20% 30% 40% 50% 60%
Blizzard/Snow Storm
Flooding
Frozen Waterways
Ice Chunks on River
Heat Wave
Source: NYSERDA Terminal Survey
As presented in Figure 21, nearly half of all terminals reported that blizzards/snowstorms disrupted terminal operations in recent years. Significant snow events with heavy accumulations occur every few years across much of NYS. These events restrict and slow transit of roadways, preventing tanker trucks from accessing terminals and delivering fuel in an efficient manner. While terminal operators note that they can clear and maintain access to their own truck rack loading facilities, deterioration of road conditions may make it difficult for terminal employees to get to work. Icy roadways can also be dangerous for tanker trucks, and one terminal noted that accidents on roadways leading to the terminal facility had blocked access to the terminal on occasion. Generally, however, disruptions to terminal operations from blizzards and snowstorms are offset by lower demand for transportation fuels as the driving public reduces its activity. Demand for heating oil, however, continues during snowstorm events and heating oil distributors often struggle to deliver fuel during major snowstorms.
Flooding was cited as affecting terminal operations by 22 percent of the terminals. Terminal operators noted that flooding affected terminal operations in various ways, including disrupting marine deliveries to the terminal, submerging marine unloading docks, causing electrical damage and power outages, and disrupting other components of terminal infrastructure. Frozen waterways were cited by 9 percent of the terminals as delaying or preventing marine access to the terminal facility. Ice chunks on waterways during the spring thaw were cited by 5 percent of the respondents as having blocked or slowed marine traffic to the terminal. Heat waves were also cited as affecting 4 percent of the terminals in recent years. The two terminals that reported effects from heat waves noted that a railroad drawbridge over the waterway leading to the terminal locations could not open due to the extreme heat, thus preventing marine access to their facilities until repairs could be made.

NYSERDA Terminal Resiliency Assessment | Hardening and Resiliency 32
HARDENING AND RESILIENCY
Petroleum terminals in NYS continuously assess and improve hardening and resiliency measures to protect against or mitigate the effects of hurricanes, tropical storms, and other major weather events. This includes establishing place best practices to secure facilities prior to a storm making landfall, flood protection measures to keep critical equipment dry, and power resiliency measures to ensure that the power supply remains available during major outage events. Many of these practices and measures have been in place for years, while others have been initiated recently as a response to experiences learned during Superstorm Sandy and Hurricane Irene.
It is important to note that hardening and resiliency investments are fundamentally business decisions; operators weigh the monetary benefits of protecting equipment and expediting restoration of operations against the monetary costs of specific hardening and resiliency measures. There is no specific level of hardening that applies to all terminals. Decisions to undertake hardening and resiliency investments will depend on site-specific assessments of threats and vulnerabilities at each facility. For instance, terminals that have critical equipment (e.g., electrical switchgear, motor control centers, product pumps) located in low-lying coastal areas, or within river and stream floodplains, will find greater benefits for investing in flood protection measures than terminals located on higher ground.
A little more than half (28) of the 55 terminals in the NYS terminal survey group are located along bodies of water; however, not all of these terminals may be located in a floodplain and not all may be at high risk of flooding. For example, two Downstate terminals located less than a mile from each other along the same waterway experienced vastly different flood effects from Superstorm Sandy due to differences in the two terminals’ elevations and the hydrology of the storm surge along the waterway.
PRE-STORM ACTIVITIES
In preparation for major storms, NYS terminals undertake pre-storm activities designed to protect vulnerable parts of their facilities and to expedite the terminal’s ability to restore operations after the storm has passed. The terminals surveyed by NYSERDA reported taking a variety of protection and preparedness measures prior to major hurricanes and tropical storms, including wrapping/protecting pumps and motors against potential flood damage; filling or pumping water or product between tanks to ensure adequate weight in each tank to prevent floating; closing isolation valves at tanks to prevent unintended product releases; checking roof drain valves for storm water; adjusting valve configurations for storm water drains; obtaining or pre-positioning backup generators if permanent generators are not already in place; coordinating with utilities for priority power restoration; and reviewing/confirming emergency plans.

NYSERDA Terminal Resiliency Assessment | Hardening and Resiliency 33
Figure 22. Terminals May Protect Pumps and Motors Located Close to the Water Prior to a Storm
Source: ICF International
Figure 23 shows the percentage of terminals surveyed by NYSERDA that reported undertaking each of these pre-storm activities. These actions were reported by both Downstate and Upstate terminals.
Figure 23. Percentage of Terminals Conducting Pre-Storm Activities
11%
49%
27%
42%
15%
53%
35%
25%
73%
9%
0% 10% 20% 30% 40% 50% 60% 70% 80%
Wrap/Protect Pumps and Motors
Fill Tanks with Product or Water
Pump Product Between Tanks
Close Isolation Valves at Tanks
Check Roof Drain Valves
Adjust Dyke Drainage Valves
Obtain Backup Generators
Coordinate with Utilities
Review/Confirm Emergency Plans
Other
Source: NYSERDA Terminal Survey

NYSERDA Terminal Resiliency Assessment | Hardening and Resiliency 34
All terminals have emergency plans that are updated and exercised on a regular basis. The most common activity that terminals take prior to an event—reported by 73 percent of the survey group—is to review these emergency plans to ensure that terminal staff and other personnel are prepared to safely and effectively manage the storm’s potential effects on the terminal facility. Additional details on emergency preparedness plans can be found in the Emergency Preparedness section.
The next most popular measure, reported by 53 percent of the survey group, is to adjust the valve configuration of the terminal’s drainage network. The containment dykes surrounding a terminal’s tanks are designed to contain product in the event of a tank breach. However, these dykes can also collect rainwater or floodwater during a major storm. Prior to an event, terminal personnel may adjust these valves to direct water to a storm water drain. Alternatively, if they fear that the storm may cause a tank breach, they may close the storm water valves to contain any potential release of product.
Figure 24. Tanks Are Filled with Product or Water to Prevent Tank Movement During Flooding
Source: ICF International
Nearly half, 49 percent, of the survey group reported filling their tanks with product or water, and 27 percent reported pumping product between tanks prior to major storm events. Ensuring that tanks have adequate volume helps protect the structural integrity of the tanks and can help stabilize them. An empty tank that encounters external pressure from floodwater could be shifted or could be lifted from its base and float away with the floodwater. This could lead to significant damage to the tank and/or

NYSERDA Terminal Resiliency Assessment | Hardening and Resiliency 35
nearby assets, and could result in a release of product. No NYS terminals reported experiencing any tank movement during Superstorm Sandy and Hurricane Irene.
Wrapping or protecting motors to protect against floodwater was practiced by 11 percent of the terminals surveyed. Through interviews with terminal operations, NYSERDA learned that one terminal adjacent to a waterway reported that it hired contractors to be on standby to remove, repair, and replace pumps and motors in the event that floodwater inundated its equipment. Another terminal located along a waterway reported it considered having contractors remove pumps and motors prior to a storm event, and replace them after the storm had passed but choose not to do so because it would be so time consuming it would have curtail critical fuel deliveries to end users just prior to storm impact.
Many of the survey group terminals reported having permanent backup generator capacity in place. Of those terminals that do not, 33 percent reported regularly obtaining backup generators prior to an anticipated event. Backup generators will be discussed in greater detail later in this section.
Looking at the results on a regional basis, the New York City and Capital District DEC Regions were more likely to report undertaking the pre-storm activities listed in Figure 23. Higher-volume terminals were also more likely to undertake pre-storm measures than lower-volume facilities. This makes sense because terminals located in New York City and the Capital District, or high-volume facilities located on Long Island, are typically located in close proximity to large bodies of water and are thus more vulnerable to flooding and other storm effects. Many of the smaller terminals included in the survey are located further inland and thus are at much less risk of the flooding or storm surge impacts common with hurricane events.
FLOOD PROTECTION MEASURES
Flooding is a serious threat for terminals located in low-lying areas along navigable waterways. Rising waters can put immense pressure on docks, tanks, and other terminal structures, and even short-term exposure to water can cause severe damage to pumps, motors, and electrical systems. As mentioned in the Power Outages of the Storm Effects section, terminals that had saltwater damage to their electrical systems experienced power outages and disruptions to terminal operations.
A little more than half (28) of the 55 terminals in the survey group are located along bodies of water; however, not all of these terminals may be located in a floodplain and not all may be at high risk of flooding. Of these 28 terminals, only 2 reported installing enhanced berms, levees, or floodwalls along their waterfronts to protect onshore equipment following recent events. The two terminals that reported making these investments reported having critical equipment located very close to their waterfronts.

NYSERDA Terminal Resiliency Assessment | Hardening and Resiliency 36
Figure 25. A Wall of Concrete Blocks Are Installed to Protect Onshore Facilities from Flooding
Source: ICF International
While floodwalls are rare at NYS terminals, other, more targeted flood protection investments are more common. Following Superstorm Sandy and Hurricane Irene, several terminals adjacent to bodies of water reported undertaking actions to elevate transformers and protect cables by running them above ground or placing them in watertight conduit or cable trays. Figure 26 shows the share of NYS terminals that are adjacent to bodies of water that have elevated electrical systems; protected cabling; or installed berms, levees, or floodwalls to protect their facilities from flood damage. Only Downstate terminals reported making investments in flood protection measures; however, this may be because Downstate terminals were at greater risk of flooding. Some terminals made these investments years ago and so were able to withstand the recent storms, while others have made investments as a direct result of their experiences with Superstorm Sandy.
Figure 26. Flood Protection Measures as a Share of Terminals Along Bodies of Water
21%
18%
7%
0% 5% 10% 15% 20% 25%
Elevated Transformers
Protected Cabling
Installed Floodwalls
Source: NYSERDA Terminal Survey
NYSERDA Terminal Resiliency Assessment | Hardening and Resiliency 37
In addition to the measures listed in Figure 26, one terminal reported that it had elevated its motor control center, hardened it with concrete walls, and installed a seal-tight door to protect it from floodwater.
Figure 27. Motor Control Center Hardened Against Flooding
Source: ICF International
Figure 28. Electric Wiring Runs Along Elevated Conduit
Source: ICF International

NYSERDA Terminal Resiliency Assessment | Hardening and Resiliency 38
BACKUP POWER SYSTEMS
Following Superstorm Sandy, Hurricane Irene, and Tropical Storm Lee, several NYS terminals that did not already have backup generator capacity reported undertaking measures to obtain backup power equipment to ensure power supply availability to run terminal operations in the event of an extended loss of grid-supplied power. The need for backup generation varies, depending on the frequency and duration of grid power outage events that a terminal experiences. Local utilities understand the critical nature of petroleum terminal operations and place these facilities on priority restoration lists. Even if power cannot be restored quickly, priority terminals may receive emergency resources from Federal, State, and local government agencies. For instance, one important Downstate gasoline terminal received multiple generators from the Federal Emergency Management Agency, and the local power utility in the aftermath of Superstorm Sandy.
Figure 29. Terminals that Have or Obtain Backup Generators
18 33%
9 16%
28 51%
Have Generator
Obtain Generator During Emergency
Neither
Source: NYSERDA Terminal Survey
Figure 29 presents the number and share of NYS terminals statewide that reported having backup power generators or obtaining them during emergency events. The figure illustrates that 18 terminals in NYS, representing 33 percent of the survey group, reported having backup generators. An additional 9 terminals, 16 percent of the survey group, reported that they regularly obtain backup generators during emergency events. Twenty-eight of the 55 terminals in the survey group (51 percent) neither have generators located onsite nor obtain generators during emergencies.
FIXED VERSUS MOBILE BACKUP GENERATORS
Some terminals that have backup generation own and operate fixed generators that cannot be removed from the facility, while others have mobile generators that act as a shared resource and can be moved among facilities throughout a defined region or state as needed. While many of the terminals surveyed for this assessment reported having generators in place prior to Superstorm Sandy, others reported purchasing of renting generators so that they could restore operations in Sandy’s aftermath. One terminal reported having difficulty finding a generator for sale in the local market after Sandy and ended up purchasing a large, trailer-mounted generator from a company in the upper Mid-West region. The majority of terminals reported having the capacity to hook up generators either immediately or within

NYSERDA Terminal Resiliency Assessment | Hardening and Resiliency 39
several hours. Figure 30 and Figure 31 show fixed and mobile backup generators, respectively, at NYS terminal facilities.
Figure 30. Fixed Diesel Backup Generator
Source: ICF International
Figure 31. Mobile, Trailer-Mounted Diesel Backup Generator
Source: ICF International

NYSERDA Terminal Resiliency Assessment | Hardening and Resiliency 40
BACKUP GENERATORS BY LOAD CAPABILITY
Backup power generators vary in size and capability. Some terminals have large generators capable of supplying the terminal’s full power load, allowing the terminal to power 100 percent of throughput operations, including product loading and unloading, heating of viscous products, and running emergency alarm and fire suppression systems. Other facilities have generators that are only capable of powering throughput operations at a reduced rate. Still other terminals have generators that are only capable of powering office and/or emergency systems, and are not capable of running any fuel throughput operations. Figure 32 shows the number and percentage of the survey group that reported having backup power generators by load capability. The figure does not include data from the 9 terminals that reported that they only obtain generators during emergency situations because the capacities of these rented units were not captured in the survey.
Figure 32. Backup Generators by Load Capability
13 72%
1 6%
4 22%
Capable of Powering 100% of Throughput Operations
Capable of Powering 50% of Throughput Operatios
Not Capable of Powering Throughput Operations
Source: NYSERDA Terminal Survey
Figure 32 shows that 13 terminals, or 72 percent, of the 18 terminals in the survey group that stated they had backup generators, were capable of fully powering throughput operations; one terminal was capable of powering 50 percent of terminal operations with its generator; and four terminals were not capable of powering any fuel throughput operations and only used generators for emergency monitoring and lighting applications. All terminals with backup generators that could fully or partially power throughput operations at their facilities reported using diesel generators. Of the four terminals with backup generators not capable of powering throughput operations, three use propane and one uses gasoline. All terminals with generators capable of powering throughput operations reported having staff onsite who are trained to operate the generators.
BACKUP GENERATOR DURATION OF OPERATION WITH AVAILABLE FUEL
Most NYS terminals that have backup generators have enough fuel immediately on hand in a dedicated tank at their terminal facilities to operate backup generators for at least 1 day. Figure 33 shows the percentage of terminals with generators capable of fully or partially powering throughput operations by the duration they can operate with available fuel. Figure 33 shows that four terminals, representing 29
NYSERDA Terminal Resiliency Assessment | Hardening and Resiliency 41
percent of the terminals with backup generators capable of powering throughput operations, reported having enough fuel at their facilities to run generators for 1 week or more; one terminal can run backup generators for 5 days with available fuel; and seven terminals, 50 percent, can run generators for 1 day with available fuel in dedicated storage. Two terminals did not report how long they could fuel generators with fuel stored onsite in dedicated tanks. All reported the ability to secure additional fuel volumes on an immediate basis for continuous generator operations. The figure does not include data from the 9 terminals that reported that they only obtain generators during emergency situations because the fuel demands of these rented units were not captured in the survey.
Figure 33. Backup Generators Capable of Powering Throughput Operations by Duration of Operation with Available Fuel
7 50%
1 7%
4 29%
2 14% 1 day
5 days 1 week+ Didn't Report
Source: NYSERDA Terminal Survey
BACKUP GENERATORS BY LOCATION AND CONNECTION TIME
Most NYS terminals with backup generation capable of powering throughput operations reported that they own their generators and store them onsite at their terminal facilities. However, two Downstate terminals reported pre-staging generators at shared company facilities, and one Downstate terminal reported having a contract for an emergency generator stored at a third-party facility. The two terminals that pre-staged generators are owned by larger companies with significant operations in the region and use the generators to cover all facilities within the defined region. The terminals that stored their generators offsite reported that storing the generators away from their facilities was advantageous because it prevented the generators from being damaged during a storm event.
Most of the generators at NYS terminals can be connected relatively quickly. Figure 34 shows the percentage of terminals with generators that can connect generators in 1 hour or less, 2 hours, 3–4 hours, and 1 day or more. Figure 34 also breaks these results down by the location of the generator.
NYSERDA Terminal Resiliency Assessment | Hardening and Resiliency 42
Figure 34. Terminals with Backup Generators Capable of Powering Throughput Operations by Connection Speed and Location
57%
14%
7%
7%
7%
7%
57%
14%
14%
14%
0% 10% 20% 30% 40% 50% 60% 70%
0-1 hour
2 hours
3-4 hours
1 day or more
Own Generator Onsite Own Generator Offsite at Shared Company Facility Contract Generator Offsite at 3rd-Party Facility
Note: stacked bars may not sum to the total due to independent rounding. Source: NYSERDA Terminal Survey
Data in Figure 34 shows that eight terminals, representing 57 percent of all terminals with generators, could connect those generators in 1 hour or less. These terminals stored generators onsite and had transfer switches installed at their facilities to allow for a quick connection to the terminal’s electrical system. Two terminals, which represent 14 percent of the terminals with generators, reported being able to hook up generators in 2 hours. These terminals store their generators at offsite facilities, but have transfer switches that allow quick connection. Two other terminals could hook up generators in 3–4 hours. These terminals stored their generators onsite, but do not have transfer switches, and therefore require an electrician to tie the generator into the terminal’s electrical system. Finally, two terminals reported needing 24 hours or more to hook up generators at their facilities.
All terminals that have backup generators located onsite reported that they test their generators on a regular basis to ensure that they are working appropriately. Two terminals that have backup generators located offsite reported that they do not test their generators, but other company staff at the offsite location have that responsibility. Of the terminals that do test their generators, all reported that their backup generators start when tested. The generators are typically tested regularly, with most being tested either once per week or once per month.
BACKUP GENERATORS BY TERMINAL THROUGHPUT
Higher-throughput, multiple fuel type distribution terminals are more likely to have backup generators than smaller, single fuel type terminals. This is likely the case because higher-throughput multi-fuel terminals are providing storage and fuel supply service to numerous companies operating large

NYSERDA Terminal Resiliency Assessment | Hardening and Resiliency 43
wholesale and retail fueling operations. This level of fuel demand requires that fuel supply must be available to retail distributors on a continuous basis.
Figure 35. Backup Generators by Terminal Throughput and Load Capability
50%
29%
13%
27%
12%
7%
14%
18%
38%
43%
13%
12%
88%
86%
25%
33%
41%
0% 20% 40% 60% 80% 100%
25,000+ b/d
15,000-24,999 b/d
10,000-14,999 b/d
5,000-9,999 b/d
<5,000 b/d
Have Generators Capable of Powering 100% of Throughput Operations Have Generators Capable of Powering 50% of Throughput Operatios Have Generators Not Capable of Powering Throughput Operations Obtain Generators During Emergencies
Note: stacked bars may not sum to the total due to independent rounding. Source: NYSERDA Terminal Survey
Figure 35 shows the percentage of terminals with backup generators by throughput category and load capability. The figure also indicates terminals that reported that they do not have backup generation onsite but obtain backup generators during emergencies. The figure shows that terminals in the highest-throughput categories, 15,000-25,000 b/d and 25,000+ b/d, are more than twice as likely to have backup generators onsite or to obtain them during emergencies than terminals in the lower throughput categories. Higher throughput terminals are also more likely to have generators capable of fully powering throughput operations. Fifty percent of the terminals with throughputs higher than 25,000 b/d reported having generators capable of fully powering throughput operations and an additional 38 percent reported obtaining generators during emergencies. The one 25,000+ b/d terminal that reported neither having generation capable of powering throughput operations nor obtaining generators during emergencies reported that it had not been affected by power outages during recent storms.
BACKUP GENERATORS BY AREA

NYSERDA Terminal Resiliency Assessment | Hardening and Resiliency 44
A greater share of Downstate terminals are equipped with backup generation than Upstate terminals, both in terms of the number of terminals with generators and the volume of throughput powered by those generators. Downstate terminals are also more likely to obtain backup generators during outage events, which are more frequent in the Downstate area. Figure 36 shows both the percentage of terminals that have backup generators capable of fully or partially powering throughput operations and the percentage of estimated aggregate throughput that can be powered by those generators by area. The figure also shows the percentage of terminals that reported they obtain backup generators during emergencies and their share of total State throughput.
Figure 36. Terminals with Backup Generators Capable of Powering Throughput Operations by Area
25%
41%
34%
43%
10%
38%
16%
29%
17%
32%
15%
25%
41%
70%
51%
75%
25%
63%
0% 10% 20% 30% 40% 50% 60% 70% 80%
% of Terminals
% of Throughput
% of Terminals
% of Throughput
% of Terminals
% of Throughput
Tota
l Sta
te
Dow
nsta
te
Ups
tate
Have Generators Capable of Powering Throughput (Partially or Fully) Obtain Generators During Emergencies
Note: stacked bars may not sum to the total due to independent rounding. Source: NYSERDA Terminal Survey
As shown in Figure 36, on a statewide basis, 25 percent of the terminals have backup generators capable of fully or partially powering throughput operations and an additional 16 percent obtain generators during emergencies. Together, 41 percent of terminals statewide either have generators capable of powering throughput or obtain such generators during emergencies. However, backup power resiliency at New York terminals is more robust when measured on a fuel throughput basis. Based on each terminal’s throughput and the reported level of throughput that can be carried out with backup power generators, it is estimated that 350,000 b/d of terminal throughput can be carried out with backup

NYSERDA Terminal Resiliency Assessment | Hardening and Resiliency 45
power generators statewide, representing 41 percent of the total throughput at NYS terminals. An additional 245,000 b/d of approximate throughput, representing 29 percent of state throughput, could be carried out with generators obtained during emergencies. Overall, approximately 595,000 b/d, or approximately 70 percent of statewide throughput, can be carried out with onsite backup generators or generators obtained during emergencies.
Figure 36 also shows that a larger share of Downstate terminals are equipped with backup generators capable of fully or partially powering throughput operations and these generators power a larger share of throughput than Upstate terminals. Thirty four percent of Downstate terminals have backup generators capable of fully or partially powering throughput operations. Throughput at these terminals is estimated to be more than 190,000 b/d, representing 43 percent of total Downstate throughput. Upstate terminals, in contrast, had backup generators at just 10 percent of the terminals, but these are high-volume facilities representing 38 percent of Upstate throughput.
Downstate terminals were also more likely to obtain backup generators during emergencies: 17 percent of Downstate terminals representing 32 percent of Downstate throughput reported obtaining backup generators during emergencies compared with 15 percent of Upstate terminals with 25 percent of Upstate throughput. The greater prevalence of backup generation at Downstate terminals is due, in part, to their higher throughput, and the importance companies utilizing the services of these terminals place on maintaining uninterrupted supply to their customers. Additionally, the Downstate market is subject to more frequent disruptions and intense ocean storms than the Upstate area.
OTHER POWER RESILIENCY MEASURES
In addition to utilizing backup generators, some terminals have the ability to run some terminal operations without electric power. In particular, several terminals in NYS reported the ability to “gravity feed” trucks in the event of a power disruption and one terminal reported it can gravity feed barges. Gravity feeding occurs when the force of gravity is used to load products into trucks, in comparison to pumping systems that rely on electric power. Of the 52 terminals in the survey group that reported having a truck loading rack, 10 reported having the ability to gravity feed trucks. Loading trucks by gravity feed only is not as efficient as using electric pumps. When terminals gravity feed trucks, they typically face a reduction in loading rates on the order of 85–90 percent.
NYSERDA Terminal Resiliency Assessment | Emergency Preparedness 46
EMERGENCY PREPAREDNESS
NYS terminals continuously undertake actions to improve communications, update emergency plans, and conduct emergency drills. Many of the terminals surveyed reported taking these and other steps prior to Superstorm Sandy. The terminals noted that lessons learned from any event, whether large hurricanes or small localized events, are incorporated into emergency plans in the normal course of preparedness procedures.
EMERGENCY COMMUNICATIONS
Communications is one of the most important components of emergency planning. During an emergency, terminal companies are in contact with a variety of industry participants and fuel suppliers and Federal, State, and local authorities. Terminal companies can communicate with these partners through their terminal operators or through their corporate offices. In many cases, both the terminal operator and the corporate office are in contact with the relevant government agencies. Figure 37 identifies these communication channels.
Figure 37. Terminal Communication Channels During Emergencies
69%
50%
2%
58%
54%
37%
35%
31%
42%
38%
27%
40%
48%
46%
0% 10% 20% 30% 40% 50% 60% 70% 80%
Terminal Operator Corporate Office
Source: NYSERDA Terminal Survey

NYSERDA Terminal Resiliency Assessment | Emergency Preparedness 47
Figure 37 indicates that both terminal operators and terminal company corporate offices are responsible for communicating with various parties during emergencies. Whether the terminal operator or the corporate office is responsible for communicating with the entities varies by terminal. Among the survey group respondents, in general, terminal operators were more likely to communicate with local entities, such as electric service providers, pipeline or shipping companies, the U.S. Coast Guard and Port Authority, and local or municipal governments; whereas corporate offices were more likely to communicate with higher-level entities, such as refining companies, NYS government agencies, and Federal agencies. For example, 69 percent of terminal operators contacted local electric providers directly compared to 31 percent of corporate offices. Conversely, 48 percent of corporate offices engaged NYS agencies directly compared to 37 percent of terminal operators.
Terminal operators, 54 percent, are more likely to be in contact with local entities because ground-level information from these entities directly affects terminal operations. For example, terminal operators must be aware of plans for supply replenishment, which is often dependent on both the restoration of power for pipeline supply and the reopening of key ports and waterways by the U.S. Coast Guard for marine supply.
EMERGENCY PLANS
Emergency plans are documents that lay out the practices and procedures that terminal staff take to prepare for and respond to emergency situations. Federal, State, and local laws often require that petroleum terminals have emergency plans in place regarding explosions, fires, or releases of hazardous materials into waterways and the atmosphere. Out of the 55 terminals that responded to the survey, 53 reported having emergency plans, and the 2 terminals that did not have emergency plans (both small, low-volume terminals) indicated that they intend to develop them.
Emergency response plans can contain a variety of information, including links to regional, divisional, or corporate response plans for terminals owned by large corporations; links to business recovery action plans, which lay out how a company or facility will return to normal business operations in the wake of a major disaster; information on the roles and responsibilities of local, municipal, and State actors involved in emergency response; and contact information for essential government agencies and contacts. Figure 38 below provides a breakdown of the type of information contained in the emergency plans based on the survey results.

NYSERDA Terminal Resiliency Assessment | Emergency Preparedness 48
Figure 38. Percentage of Terminals that Include Information in the Emergency Plan by Information Type
73%
25%
36%
80%
0% 10% 20% 30% 40% 50% 60% 70% 80% 90%
Linked to Other Plans
Business Recovery Action Plan
Includes Gov't Responsibilities
Includes Gov't Contact
Source: NYSERDA Terminal Survey
Data in Figure 38 indicates that 73 percent of the survey group’s emergency plans were linked to regional, divisional, and corporate emergency response plans, but only 25 percent included a specific business recovery action plan. It is assumed that the business recovery aspect would be included in higher level corporate plans. Government contact information was also included in most plans with 80 percent of the responders reporting they include State and county government contact information in their plans. The terminal operators noted they tried to update this information on at least an annual basis.
NYS terminals have made a number of changes to their emergency plans as a result of Superstorm Sandy, including creating new plans or updating existing plans related to the roles and responsibilities of staff during emergency events; emergency contact lists; facility risk and hazard assessments, particularly related to storm surge and power outages; procedures for minimizing damage to terminal property or surrounding property from storm effects; procedures for continuing operations during loss of power events; and procedures related to the storage and deployment of new equipment at the terminal. Figure 39 below summarizes the updates that terminals have made to their plans since Superstorm Sandy.
Figure 39. Emergency Plan Updates After Superstorm Sandy
8%
29%
15%
17%
12%
2%
0% 5% 10% 15% 20% 25% 30% 35%
Roles & Responsibilities
Contact Lists
Risk Assessment
Property Damage Procedures
Loss of Power Procedures
New Equipment Procedures
Source: NYSERDA Terminal Survey

NYSERDA Terminal Resiliency Assessment | Emergency Preparedness 49
Several terminals reported that their emergency plans prior to Superstorm Sandy were sufficient for dealing with the effects of the storm and thus did not need to be updated. Overall, 50 percent of terminals updated their emergency plans in one way or another following Superstorm Sandy. The information in Figure 39 breaks out the types of updates that terminal operators have undertaken and the percentage of terminals that have undertaken them. No one update was undertaken by a large share of terminals. Only 29 percent needed to update their contact lists as several noted their facilities regularly meets with county and State officials in the normal course of operations. Only 8 percent of the terminals reported a need to update the roles and responsibilities of their staff. The survey also showed between 12 percent and 17 percent of the terminals have updated their procedures related to risk and hazard assessments, procedures to minimize property damage, and contingencies to continue operations during power loss events. One company reported that it had enhanced its procedures in its emergency response plan to respond to natural disasters of the magnitude of Superstorm Sandy. In addition, one high-volume Upstate terminal, well inland from ocean impact areas, reported developing a hurricane plan in response to Superstorm Sandy.
EMERGENCY DRILLS
Terminals in NYS hold emergency drills to practice and prepare for emergency events. These drills are typically held at least once per year and can be held in the form of tabletop or field exercises. In cases where the terminal is under corporate ownership, the terminal may invite representatives from their regional, divisional, or corporate offices to attend. In some cases, NYS, county, or local emergency responders are invited to attend or participate in these drills. Figure 40 indicates the percentage of terminals that reported holding emergency drills, tabletop exercises, and field exercises, and whether outside parties regularly attend.
Figure 40. Emergency Preparedness: Drills and Exercises
91%
91%
91%
62%
56%
0% 20% 40% 60% 80% 100%
Hold Emergency Drills
Hold Table Top Exercises
Hold Field Exercises
Regional, Divisional, or Corporate Attend
State, County, Emergency Gov't Attend
Source: NYSERDA Terminal Survey

NYSERDA Terminal Resiliency Assessment | Emergency Preparedness 50
Figure 40 shows that 91 percent of NYS terminals surveyed conduct emergency drills, and all of these terminals reported holding both tabletop and field exercises. The average frequency of the drills that are conducted is four times per year, ranging from just once per year to 12 times per year. Figure 40 also shows that 62 percent of the terminals reported that regional, divisional, or corporate representatives attend emergency drills, and 56 percent of the terminals conduct drills and exercises in which government and emergency response personnel attend. It is noted that not all drills are designed to be inclusive of corporate of government agency attendance.
The emergency drills carried out by NYS terminals cover a variety of scenarios, including fires and explosions, oil spills or loss of containment from the terminal’s tanks, marine vessel or vehicle accidents, storms and/or flooding within the terminal facility, power failures, and terrorist attacks or sabotage targeting the terminal. Figure 41 shows the percentage of terminals that reported holding drills or exercises related to these scenarios.
Figure 41. Frequency of Incident Scenarios
62%
87%
56%
31%
31%
53%
0% 10% 20% 30% 40% 50% 60% 70% 80% 90% 100%
Fire and/or explosion
Spill or loss of containment
Vessel or vehicle accident
Storm and/or flooding
Power failure
Terrorist attack/sabotage
Source: NYSERDA Terminal Survey
Figure 41 shows that most terminals reported holding drills and exercises related to spills or loss of containment (87 percent), fires and/or explosions (62 percent), vessel or vehicle accidents (56 percent), or terrorist attacks/sabotage (53 percent). These scenarios are likely emphasized because terminals are required to hold these types of drills as part of Federal, State, or local regulations. Less than one-third, 31 percent, of the terminals conduct drills and exercises that relate to storm scenarios that include simultaneous wind, flooding, and power outage effects at the terminal facility.

NYSERDA Terminal Resiliency Assessment | Summary 51
SUMMARY
NYSERDA’s objective in this assessment has been to characterize the state of the petroleum terminal system in NYS, assess storm and other weather-related vulnerabilities to that system, and identify efforts by terminal operators to improve the hardening and resiliency of that system against future events. The importance of terminals to the NYS fuel supply chain was made apparent in the aftermath of Superstorm Sandy when shipping and pipeline supply issues, power outages, and storm surge damage at petroleum terminals disrupted the supply of petroleum products to end-use consumers in NYS. Nearly half the terminals surveyed by NYSERDA statewide and 60 percent of the terminals surveyed in the Downstate area reported that out-loading from their terminals was disrupted following Superstorm Sandy.
Power outages were the most widely cited cause of disruptions to terminal operations, with 44 percent of terminals statewide reporting power outages to terminal equipment from recent storms Hurricane Irene and Superstorm Sandy. While most terminals experienced power outages due to the loss of grid-supplied power, several Downstate terminals reported that the storm surge from Superstorm Sandy caused extensive damage to critical electrical equipment onsite at their facilities. Terminals with onsite electrical damage reported that power supply and terminal operations remained disrupted for weeks after Sandy had passed.
NYS terminals have undertaken a number of hardening and resiliency measures to protect their facilities from futures storms and to expedite restoration in the aftermath of those storms. NYS terminals take preparatory actions at their terminals prior to a storm, such as confirming emergency plans, wrapping product pumps and motors to protect them from water damage, and filling tanks to prevent them from floating away in the storm surge. NYS terminals have also made flood protection investments, such as building floodwalls, elevating transformers and other electrical equipment, and raising or otherwise protecting electrical wiring throughout their facilities. Finally, terminals have installed or pre-wired their facilities for backup generators so that they can continue to operate during an extended loss of grid power. More than one-third of NYS terminals reported having backup generators and nearly half reported either having generators or obtaining them during emergencies.
Overall, the NYS terminal system is strong and resilient. The experience of Superstorm Sandy identified new vulnerabilities to this system because widespread power outages and historic storm surge levels affected terminal operations and disrupted fuel supply to end-use customers. NYS terminals have responded by putting in place new hardening and resiliency measures to protect their facilities from future storms and to expedite restoration after those storms have passed.