new york investor meetings - xcel...
TRANSCRIPT

1
New York Investor
Meetings
May 13-15, 2013
Attractive Total Return

2
Safe Harbor This material contains forward-looking statements that are subject to certain risks, uncertainties and assumptions. Such forward-looking statements, including the 2013 EPS guidance and assumptions are intended to be identified in this document by the words “anticipate,” “believe,” “estimate,” “expect,” “intend,” “may,” “objective,” “outlook,” “plan,” “project,” “possible,” “potential,” “should” and similar expressions. Actual results may vary materially. Forward-looking statements speak only as of the date they are made, and we do not undertake any obligation to update them to reflect changes that occur after that date. Factors that could cause actual results to differ materially include, but are not limited to: general economic conditions, including inflation rates, monetary fluctuations and their impact on capital expenditures and the ability of Xcel Energy Inc. and its subsidiaries to obtain financing on favorable terms; business conditions in the energy industry, including the risk of a slow down in the U.S. economy or delay in growth recovery; trade, fiscal, taxation and environmental policies in areas where Xcel Energy has a financial interest; customer business conditions; actions of credit rating agencies; competitive factors, including the extent and timing of the entry of additional competition in the markets served by Xcel Energy Inc. and its subsidiaries; unusual weather; effects of geopolitical events, including war and acts of terrorism; state, federal and foreign legislative and regulatory initiatives that affect cost and investment recovery, have an impact on rates or have an impact on asset operation or ownership or impose environmental compliance conditions; structures that affect the speed and degree to which competition enters the electric and natural gas markets; costs and other effects of legal and administrative proceedings, settlements, investigations and claims; actions by regulatory bodies impacting our nuclear operations, including those affecting costs, operations or the approval of requests pending before the NRC; financial or regulatory accounting policies imposed by regulatory bodies; availability or cost of capital; employee work force factors; the items described under Factors Affecting Results of Continuing Operations; and the other risk factors listed from time to time by Xcel Energy in reports filed with the SEC, including “Risk Factors” in Item 1A of Xcel Energy Inc.’s Form 10-K for the year ended Dec. 31, 2012, and Item 1A and Exhibit 99.01 to the Quarterly Report on Form 10-Q.

3
Investment Merits
Fully regulated natural gas and electric utility
Robust capital investment pipeline
Constructive regulation
Track record of delivering EPS & dividend growth
EPS growth of 5-7%
Dividend growth of 2-4%

4
Diversified & Fully Regulated Utility
NSP-Wisconsin (NSPW) 5-10% of earnings
NSP-Minnesota (NSPM) 35-45% of earnings
Southwestern Public Service (SPS)
5-15% of earnings
Public Service Co. of Colorado (PSCo) 45-55% of earnings
Operate in 8 States
Combination Utility 90% electric
10% natural gas
Customers 3.4 million electric
1.9 million natural gas 2012 DPS (Annualized) = $1.08 2013 EPS Guidance = $1.85 - $1.95

5
Capital Investment 2013-2017
Natural Gas 13%
Distribution 20%
Generation 26%
Transmission 30%
Nuclear Fuel 5% Other
6%
$13 Billion Cap Ex Plan Drives 6-7% rate base growth through 2014
Drives 5% rate base growth through 2017

6
Attractive Total Return Opportunity Base Case $13 billion capital forecast drives rate base growth
EPS growth rate could moderate beyond 2014
Stronger cash flows and lower financing needs would allow for higher dividend growth as cap ex winds down
Potential Earnings Growth
Moderation
Attractive Total
Return Opportunity
Increased Dividend Payout
+ =

7
Attractive Total Return Opportunity Potential Case
Base capital forecast doesn’t include several potentially large projects
Additional projects would increase rate base growth
Could extend current EPS and dividend growth rates
Continued 5-7% EPS Growth
Through 2017
Attractive Total
Return Opportunity
Maintain 2-4%
Dividend Growth
+ =

8
NSP-Minnesota Resource Plan NSP-Minnesota issued two RFP’s, which included options for purchase
power agreements, self-build or a build-ownership transfer
NSP-Minnesota issued an RPF to add 500 MW of natural gas-generation between 2017 and 2019
Bids received in April 2013 and included PPA’s and ownership options
NSP-Minnesota submitted a bid to add up to three 215-MW combustion turbine in service in 2017, 2018 and 2019
ALJ bid evaluation and advocacy – April-October 2013
ALJ recommendation to the MPUC – October 2013
MPUC final ruling – November 2013
NSP-Minnesota issued an RFP for 200 MW megawatts of wind generation
Bids received in April 2013 and included PPA’s and ownership options
Project review, selection and negotiation – April-June 2013
Application and regulatory approval – July-September 2013
Potential ownership options are not included in current capital forecast

9
Colorado Resource Plan
In March 2013, PSCo issued an All-Source RFP for 250 MW by 2018
Proposals may be for purchase power agreements, self-build or contracts with a build-ownership transfer option
Deadline for All-Source generation bids – May 2013
PSCo will submit a self-build option
All-Source evaluation assessment report to CPUC – September 2013
Evaluation and regulatory approval – December 2013
PSCo also issued a separate wind generation RFP for PPA’s only
Bid proposals in response to the wind RFP were received in April 2013
Wind evaluation assessment report to CPUC – May 2013
Evaluation and regulatory approval – October 2013
Potential ownership options are not included in current capital forecast

10
$12,995
$10,150
$400$1,793$2,045
$400
Financing Plan 2013-2017
* Cash from operations, net of dividend and pension funding ** Issued $500 million of FMB at PSCo in March 2013 and $450 million of senior notes at Xcel Energy in May 2013 *** Issued of 7.7 million shares (net proceeds of $223 million) in March 2013
Cap Ex
CFO * New Debt**
DRIP Equity***
Funding capital expenditures
Refinanced Debt**
Dollars in millions

11
Financing Plan Debt Financing 2013
Issued $450 million, 3-year senior notes at 0.75% in May 2014
Issued first mortgage bonds at PSCO in March 2013
$250 million, 10-year FMB at 2.50%
$250 million, 30-year FMB at 3.95%
Planned NSP-M FMB of $400 million
Planned SPS FMB of $100 million
Equity Financing 2013-2017
Announced “at-the market” equity issuance of up to $400 million
Issued 7.7 million shares (net proceeds $223 million) in March 2013
Announced call of $400 million of 7.60% junior subordinated notes
Financing plans are subject to change, depending on capital expenditures, internal cash generation, market conditions and other factors

12
Summary of Pending Rate Cases
Rate Case
Requested Rates
Anticipated
to be Effective
Rate Increase
(millions)
ROE Equity
Ratio
Minnesota Electric $215* 10.60% 52.56% Interim 2013 Q1
Colorado Gas $64.7** 10.30% 56.00% 2013 Q3
New Mexico Electric $45.9 10.65% 53.89% 2014 Q1
North Dakota Electric $16.9 10.60% 52.56% Interim 2013 Q1
* Reflects revised request. Original request was $285 million. ** Request reflects revised multi-year request. In addition, we are requesting an extension of the PSIA rider to recover the costs of accelerated pipeline integrity efforts.
13
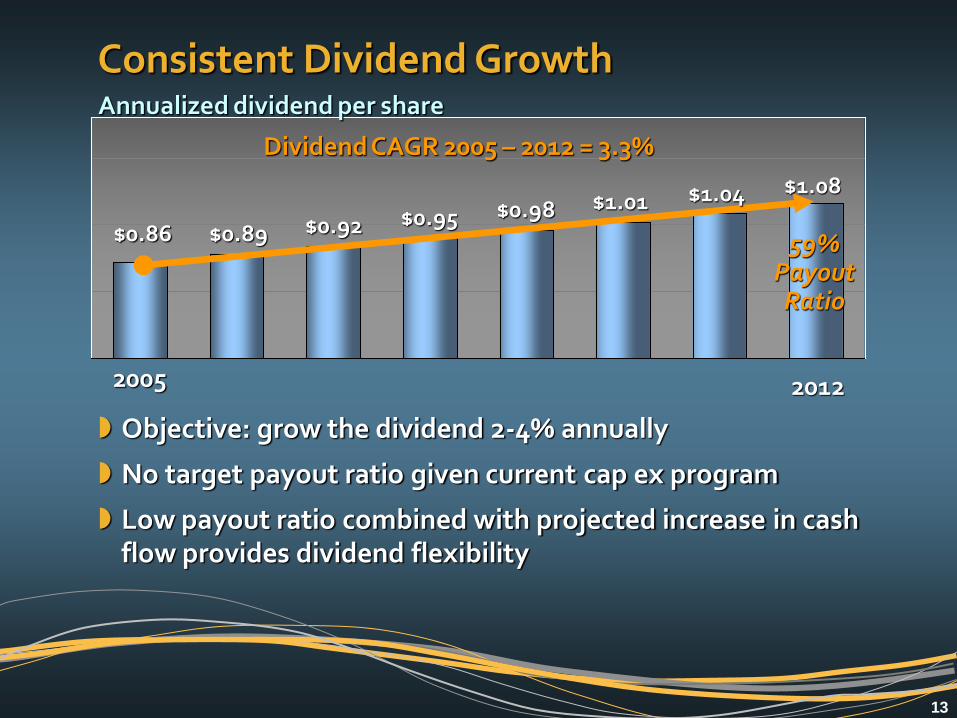
Consistent Dividend Growth
$0.86
2005
2012
Dividend CAGR 2005 – 2012 = 3.3%
Annualized dividend per share
$0.89 $0.92 $0.95 $0.98 $1.01 $1.04 $1.08
59% Payout Ratio
Objective: grow the dividend 2-4% annually
No target payout ratio given current cap ex program
Low payout ratio combined with projected increase in cash flow provides dividend flexibility
14
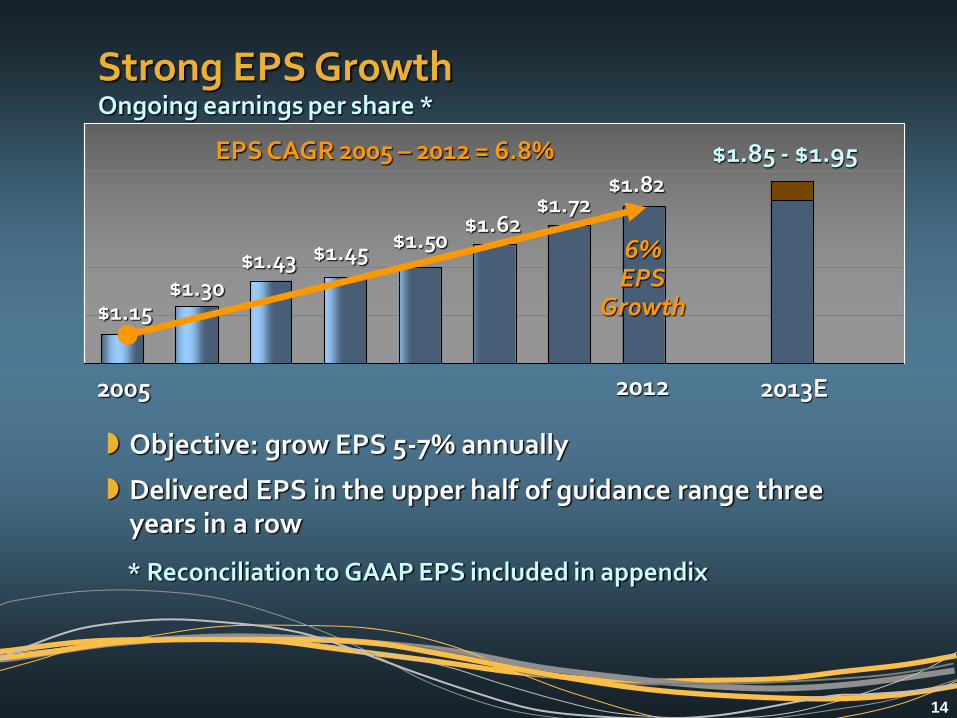
Strong EPS Growth
2012
* Reconciliation to GAAP EPS included in appendix
2005
EPS CAGR 2005 – 2012 = 6.8%
Ongoing earnings per share *
$1.15 $1.30
$1.43 $1.45 $1.50
$1.62 $1.72
$1.82
6% EPS
Growth
2013E
$1.85 - $1.95
Objective: grow EPS 5-7% annually
Delivered EPS in the upper half of guidance range three years in a row

15
Attractive Total Return
Robust capital investment plan
Constructive regulation
Track record of delivering on financial objectives
EPS growth of 5-7%
Dividend growth of 2-4%

16
Appendix

17
Reconciliation – Ongoing EPS to GAAP
2005 2006 2007 2008 2009 2010 2011 2012
Ongoing EPS $1.15 $1.30 $1.43 $1.45 $1.50 $1.62 $1.72 $1.82
PSRI-COLI/ Prescript. Drug Tax Benefit $0.05 $0.05 $(0.08) $0.01 $(0.01) $(0.01) $0.00 $0.03
Cont. Ops $1.20 $1.35 $1.35 $1.46 $1.49 $1.61 $1.72 $1.85
Disc. Ops $0.03 $0.01 $0.00 $0.00 $(0.01) $0.01 $0.00 $0.00
GAAP EPS $1.23 $1.36 $1.35 $1.46 $1.48 $1.62 $1.72 $1.85
Xcel Energy’s management believes that ongoing earnings provide a meaningful comparison of earnings results and is representative of Xcel Energy’s fundamental core earnings power. Xcel Energy’s management uses ongoing earnings internally for financial planning and analysis, for reporting of results to the Board of Directors, and when communicating its earnings outlook to analysts and investors.

18
2013 Earnings Guidance & Assumptions Xcel Energy’s earnings guidance is $1.85-$1.95 per share
Key assumptions:
Constructive outcomes in all rate case and regulatory proceedings
Normal weather patterns are experienced for the year
W/A retail electric sales projected to grow ≈ 0.5%
W/A retail firm natural gas sales projected to decline ≈ 1%
O&M expenses are projected to increase ≈ 4-5%
Depreciation expense is projected to increase $75-$85 million
Property taxes are projected to increase ≈ $35-$40 million
Interest expense projected to decrease $30-$35 million
AFUDC-equity is projected to increase ≈ $15-$20 million
The effective tax rate is projected to be ≈ 34-36%
CSE projected to be ≈ 497 million shares
19
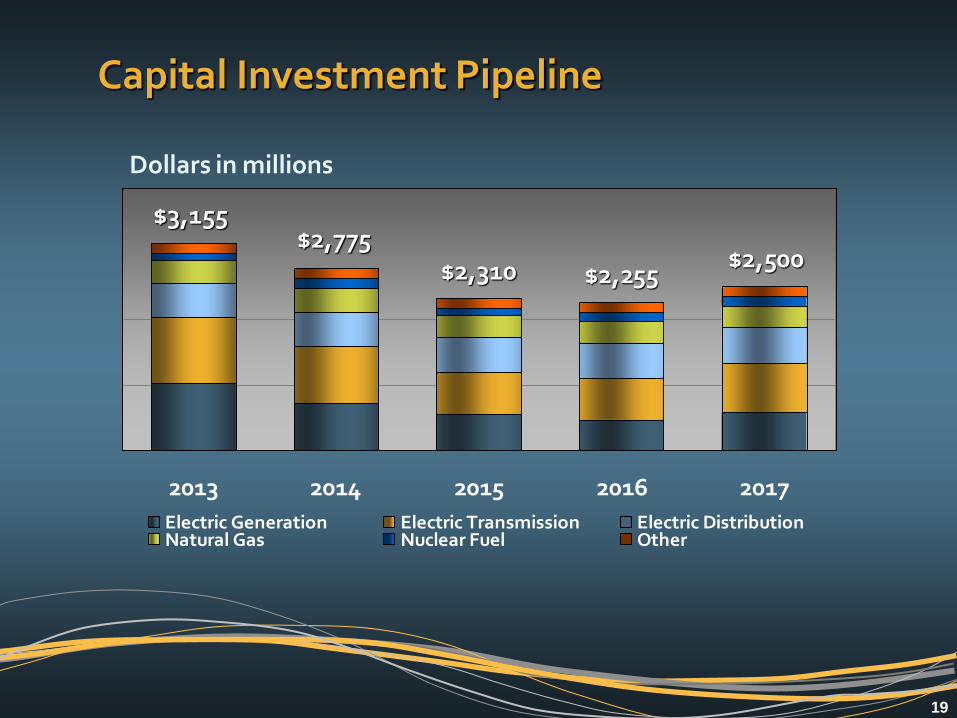
2013 2014 2015 2016 2017
Electric Generation Electric Transmission Electric DistributionNatural Gas Nuclear Fuel Other
Capital Investment Pipeline
Dollars in millions
$2,500 $2,775
$2,310 $2,255
$3,155

20
Capital Expenditures by Function
Transmission $1,010 $870 $650 $635 $770
Generation 1,025 710 550 465 570
Distribution 515 525 525 535 545
Natural Gas 355 365 335 325 320
Nuclear Fuel 95 155 100 140 145
Other 155 150 150 155 150
Total $3,155 $2,775 $2,310 $2,255 $2,500
Dollars in millions
2013 2014 2015 2016 2017

21
Capital Expenditures by Major Project
2013 2014 2015 2016 2017 Other Cap Ex $1,710 $1,610 $1,555 $1,600 $1,755
CapX2020 350 295 140 0 0
Clean Air Clean Jobs Act 345 235 90 15 0
Life Ext and Monti EPU 270 50 60 50 50
Other Major Transmission 245 260 175 320 415
Gas Pipeline Replacements 140 170 190 130 135
Nuclear Fuel 95 155 100 140 145
Total $3,155 $2,775 $2,310 $2,255 $2,500
Dollars in millions

22
Capital Expenditures by Company
NSPM $1,395 $1,135 $910 $925 $1,080
PSCo 1,075 1,000 850 800 840
SPS 490 400 305 300 345
NSPW 180 240 245 230 235
WYCO 15 0 0 0 0
Total $3,155 $2,775 $2,310 $2,255 $2,500
2013 2014 2015 2016 2017
Dollars in millions

23
0
400
800
1,200
1,600
2013 2014 2015 2016 2017 2018 2019 2020
Hold Co NSPM NSPW
PSCo SPS
Manageable Debt Maturities Dollars in millions

24
Financial Strength
45% equity ratio as of March 31, 2013 $2.45 billion credit line, maturity extended to July 2017
Hold Co. –/–/– BBB+/Baa1/BBB+
NSPM A+/A1/A A/A3/A-
NSPW A+/A1/A A/A3/A-
PSCo A/A2/A A-/Baa1/A-
SPS A-/A3/A- BBB+/Baa2/A-
Secured Unsecured Fitch/Moody’s/S&P Fitch/Moody’s/S&P

25
Natural Gas 24%
Nuclear 12%
Balanced Energy Mix
Wind 12%
Coal 47%
Hydro 3%
Other 2%
2012 Owned &
Purchased Generation

26
Authorized Returns - 2011
Rate Base Authorized ROE W/A Earned ROE Rate Cases
MN Elec. $5,770 10.37% 9.08% 2013
MN Gas 429 10.09 10.08
ND Elec. 323 10.40 9.05 2013
ND Gas 42 10.75 13.58
SD Elec. 355 Blackbox 3.90 2012, 2013
CO Elec. 5,391 10.50 8.75 * 2012 MYP
CO Gas 1,144 10.10 8.78 2013
WI Elec. 672 10.40 10.32 2012, 2013
WI Gas 83 10.40 5.95 2012, 2013
TX Elec. 1,060 Blackbox 9.25 * 2012, 2013
NM Elec. 349 Blackbox 9.35 * 2012, 2014
Wholesale 1,251 N/A N/A
* ROE’s are actual earned, not weather normalized

27
Minnesota Electric Rate Case Original request: electric rate increase of $285 million (10.7%)
Revised request: electric rate increase of $215 million
2013 forecast test year
ROE of 10.6%
Equity ratio of 52.56%
Electric rate base of $6.3 billion
Interim rates of $251 million implemented Jan. 1, 2013
Anticipate decision in third quarter 2013
Primary drivers include:
Capital investment ($170 million)
Increased property taxes ($40 million)
Lower forecasted sales ($75 million)
Upcoming Key Dates: Initial Briefs 5/15/13 ALJ Report 7/3/13

28
Minnesota DOC Testimony In February 2013, DOC recommended an increase of $93.6 million, based on an
equity ratio of 52.56% and ROE of 10.24%
In April 2013, DOC recommended a rate increase of $89.6 million, based on an equity ratio of 52.56%, a 9.83% ROE and rate base of $6.1 billion
At April hearings, DOC revised its recommended rate increase to $98.6 million
(Millions of Dollars)
Direct Testimony February 2013
Surrebuttal April 2013
NSP-M’s original request $285 $285 ROE (20) (44) Sherco Unit 3 (39) (44) Reduced recovery for nuclear plants (9) (5) Elimination of incentive compensation (25) (20)
Increase to the sales forecast (24) (26) Reduced recovery of pension (25) (25) Employee benefits (11) (6) Other, net (38) (25) DOC recommendation $94 $90

29
Minnesota Rebuttal Testimony
In March 2013, NSP-Minnesota revised requested rate increase to approximately $220 million (8.2%) based on ROE of 10.6%, rate base of $6.3 billion and an equity ratio of 52.56%
Deferral of Sherco Unit 3 depreciation and property taxes ($35 million)
Removal of Monticello license costs and deferral of 2013 depreciation expense for the Monticello LCM / EPU ($8.3 million)
Removal of Prairie Island EPU project costs ($2.7 million)
Adjustments to compensation and benefits recovery ($8.0 million)
Pension adjustment ($8.7 million)
Revision to amortization period for Black Dog costs ($5.4 million)
Updated forecast for property taxes ($7.4 million increase)
Updated sales forecast for actual data and assumptions ($0.9 million)
Correction to the original filing and other adjustments ($4.3 million)
NSP-Minnesota modified its request to $215 million at April 2013 hearings
30
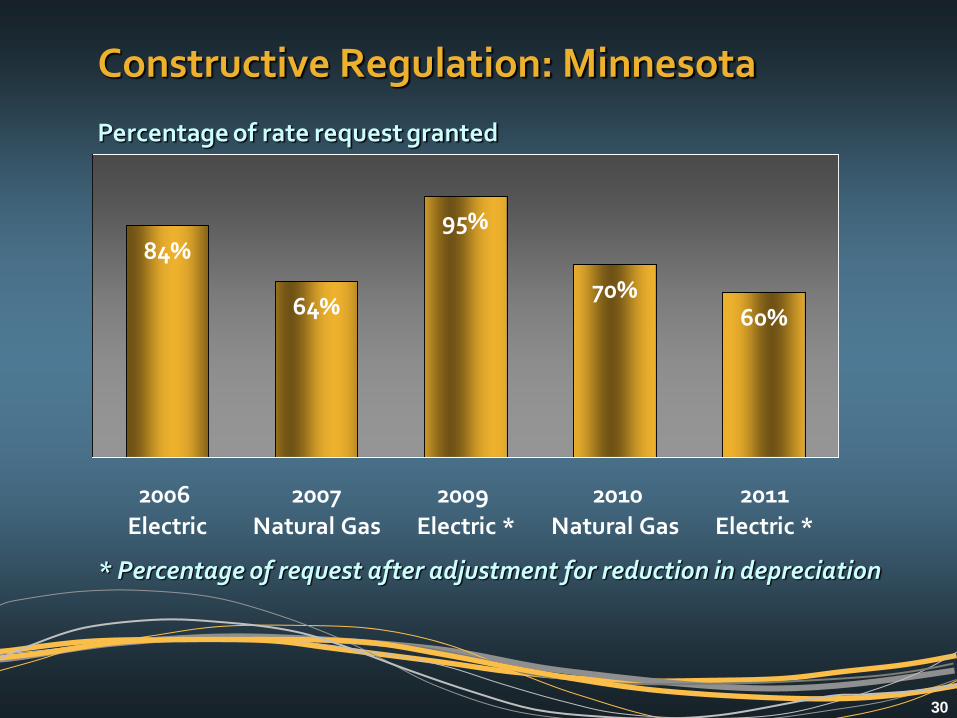
Constructive Regulation: Minnesota
84%
64%
95%
70%60%
2006
Electric
2007
Natural Gas
2009
Electric *
2010
Natural Gas
2011
Electric *
Percentage of rate request granted
* Percentage of request after adjustment for reduction in depreciation

31
Colorado Natural Gas Rate Case
Pursuing multi-year plan based on:
ROE of 10.3%
Equity ratio of 56%
Rate base of $1.3 billion
2013 forecast test year
Requesting natural gas rate increases of:
$44.8 million in 2013;
$9.0 million in 2014; and
$10.9 million in 2015
Requesting extension of PSIA rider
Increase of $26.8 million in 2014
Increase of $24.7 million in 2015
Upcoming Key Dates: Hearings begin 5/20/13 Rates effective 8/10/13

32
Colorado Intervenor Testimony
(Millions of Dollars)
CPUC Staff April 2013
OCC April 2013
PSCo’s deficiency (HTY) $28.3 $28.3 ROE and cap. Structure (20.8) (20.0) Move to 13-mo. avg rate base (5.7) (3.2)
Remove pension asset (5.9) - Remove incentive comp. (3.5) (0.2) Challenge known & measureable - (9.0) Eliminate depreciation annualization - (1.8)
Revenue adjustments (4.1) (1.4)
Resulting tax impacts 1.5 4.7
Other adjustments (4.2) 3.1
Recommendation $(14.4) $0.5
CPUC staff recommended a rate reduction of $14.4 million, based on a HTY, ROE of 9% and equity ratio of 52%
The OCC recommended a rate increase of $0.5 million based on a HTY, ROE of 9% and equity ratio of 51%

33
Constructive Regulation: Colorado
64%73%
82%70% 71%
62%
80%
2006
Natural
Gas
2007
Electric
2007
Natural
Gas
2009
Electric
2010
Electric
2011
Natural
Gas *
2012
Electric *
Percentage of rate request granted
* Does not reflect adjustment for reduction in depreciation

34
North Dakota Rate Case
Seeking 2013 electric rate increase of $16.9 million (9.25%)
Based on a 2013 forecast test year
ROE of 10.6%
Electric rate base of $377.6 million
Equity ratio of 52.56%
Interim rate increase of $14.7 million, subject to refund, effective on Feb. 16, 2013
A final decision on the case is anticipated in 2013 Q3
Upcoming Key Date: Staff/Intervenor Testimony 7/12/13

35
New Mexico Rate Case
Seeking 2014 electric rate increase of $45.9 million (14.4%), including $21.8 million to be recovered through renewable energy rider.
Based on a 2014 forecast test year
ROE of 10.65%
Equity ratio of 53.89%
Electric rate base of $479.8 million
Implementation of final rates anticipated 2014
Upcoming Key Date: Settlement Meeting 6/28/13

36
Constructive Regulation: SPS
49%
76%
61% 58%
74%68%
2007 TX
Electric
2008 NM
Electric
2009 TX
Electric *
2009 NM
Electric *
2010 TX
Electric
2011 NM
Electric
Percentage of rate request granted
* Does not reflect adjustment for reduction in depreciation

37
Texas Rate Case
Requested 2013 electric rate increase of $85.2 million (11.3%) Historic test year adjusted for known and measurable changes
ROE of 10.65%
Equity ratio of 52%
Electric rate base of $1.15 billion
In April 2013, SPS and parties filed a settlement agreement:
Increase base electric rates by $37 million, effective May 1, 2013 (on an interim basis pending PUCT’s approval)
Additional rate increase of $13.8 million on Sept. 1, 2013
Allows SPS to file a transmission rider in the fourth quarter of 2013 with rates effective on an interim basis in January 2014
SPS cannot file another base rate case in 2013
PUCT is expected to act on the settlement during 2013 Q2

38
South Dakota Rate Case
Requested 2013 electric rate increase of $19.4 million (11.5%)
2011 historic test year adjusted for known and measureable changes
ROE of 10.65% and equity ratio of 52.89%
Average electric rate base of $367.5 million
Interim rate increase of $19.4 million effective January 1, 2013
In April 2013 the SD Commission approved settlement
2013 rate increase of $11.6 million
Plus rider of $3.7 million
Rider projected to provide incremental revenue of $2.6 million in 2014

39
Steady Improvement Ongoing ROE
9.10%9.78%
10.10%9.67% 9.69% 9.84%
10.16% 10.24%
2005 2006 2007 2008 2009 2010 2011 2012

40