new tools for interpreting foliar nutrient status fertilization working group february 8, 2012
TRANSCRIPT

New Tools for Interpreting Foliar Nutrient Status
Fertilization Working Group February 8, 2012

Operational fertilization decision-making
Forest level considerations
Stand level considerations operational factors biological factors
species stand structure crown conditions insect/disease nutrient status

Foliar analysis as a planning tool
Foliar analysis can be used to: confirm N deficiency

Foliar analysis as a planning tool
Foliar analysis can be used to: confirm N deficiency identify secondary nutrient deficiencies (e.g., S, B)

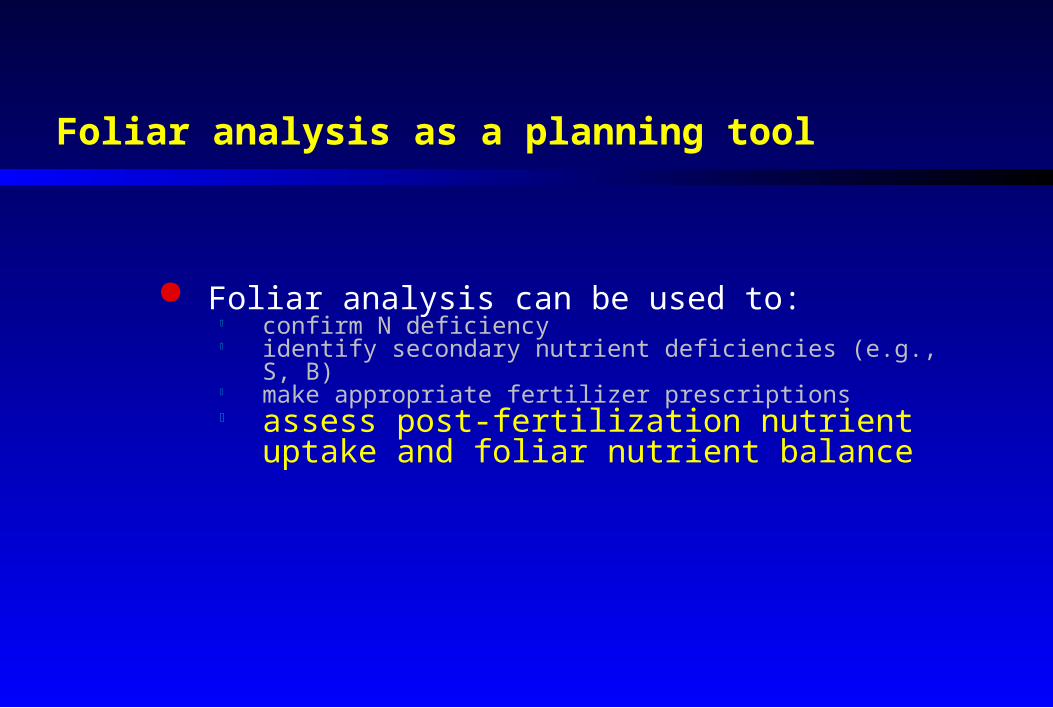
Foliar analysis as a planning tool
Foliar analysis can be used to: confirm N deficiency identify secondary nutrient deficiencies (e.g., S, B) make appropriate fertilizer prescriptions
Foliar analysis as a planning tool
Foliar analysis can be used to: confirm N deficiency identify secondary nutrient deficiencies (e.g., S, B) make appropriate fertilizer prescriptions assess post-fertilization nutrient uptake and foliar
nutrient balance

Foliar Sampling Protocol

Foliar Sampling Protocol
Sample during the dormant season

Seasonal change in foliar %N in Douglas-fir foliage
0.6
0.8
1
1.2
1.4
1.6
1.8
Fo
liar
N (
%)
May June July Aug Sept Oct Nov Dec
Moderate deficiency
Month

Seasonal change in foliar %N in Douglas-fir foliage
0.6
0.8
1
1.2
1.4
1.6
1.8
Fo
liar
N (
%)
May June July Aug Sept Oct Nov Dec
Moderate deficiency
Month

Foliar Sampling Protocol
Sample during the dormant season
Sample current year’s foliage

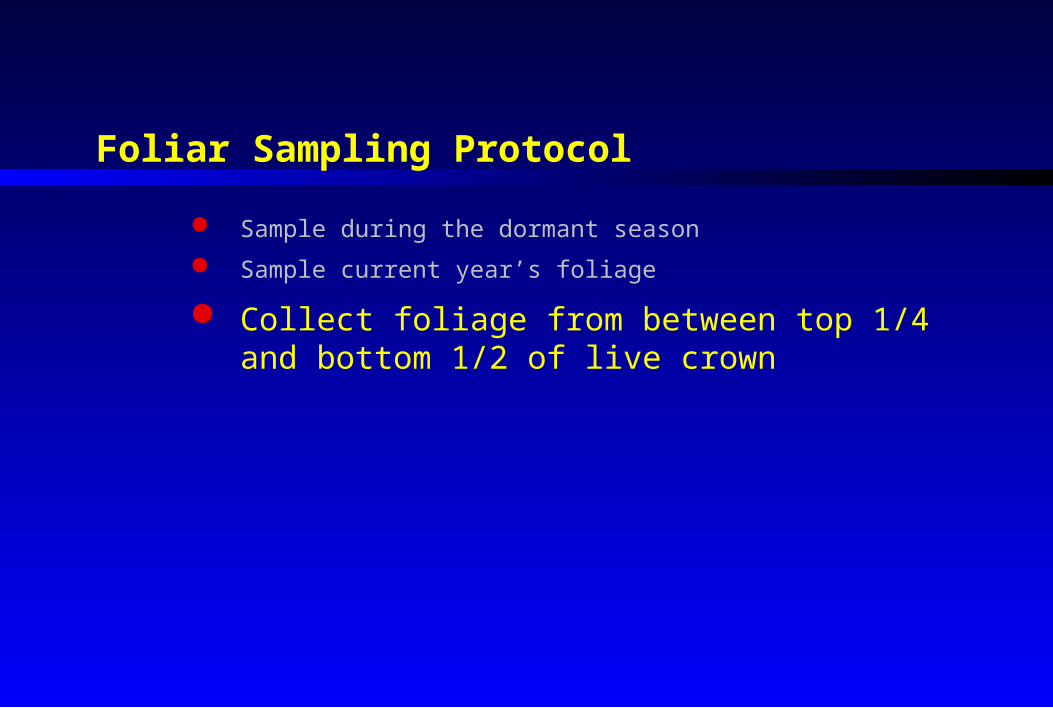
Foliar Sampling Protocol
Sample during the dormant season
Sample current year’s foliage
Collect foliage from between top 1/4 and bottom 1/2 of live crown


Foliar Sampling Protocol
Sample during the dormant season
Sample current year’s foliage
Collect foliage from between top 1/4 and bottom 1/2 of live crown
Collect foliage from healthy, representative trees


Foliar Sampling Protocol
Sample during the dormant season
Sample current year’s foliage
Collect foliage from between top 1/4 and bottom 1/2 of live crown
Collect foliage from representative trees
Collect foliage from at least 20 trees per stand or stratum

Foliar sampling layout
x
x
x
x
x
x
xx
xx
xx
xx
xx
xx
xx
RoadL
ine
1
Line 2
/02
/01
Foliar Sampling Protocol
Sample during the dormant season
Sample current year’s foliage
Collect foliage from between top 1/4 and bottom 1/2 of live crown
Collect foliage from representative trees
Collect foliage from at least 20 trees per stand or stratum
For routine diagnoses, combine equal amounts of foliage from individual trees into one composite sample per stratum
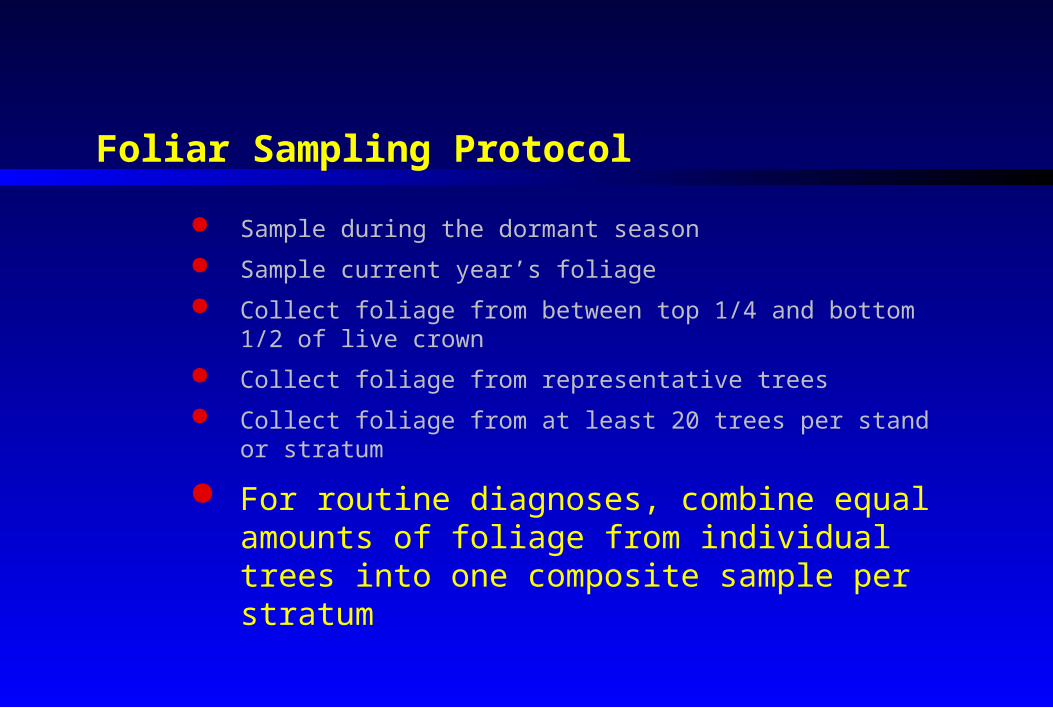
Keep samples cool until foliage is dried

Factors affecting interpretation of foliar nutrient data

Factors affecting interpretation of foliar nutrient data
Foliar sampling protocol

Factors affecting interpretation of foliar nutrient data
Foliar sampling protocol
Site ecological characteristics

from DeLong (2003)

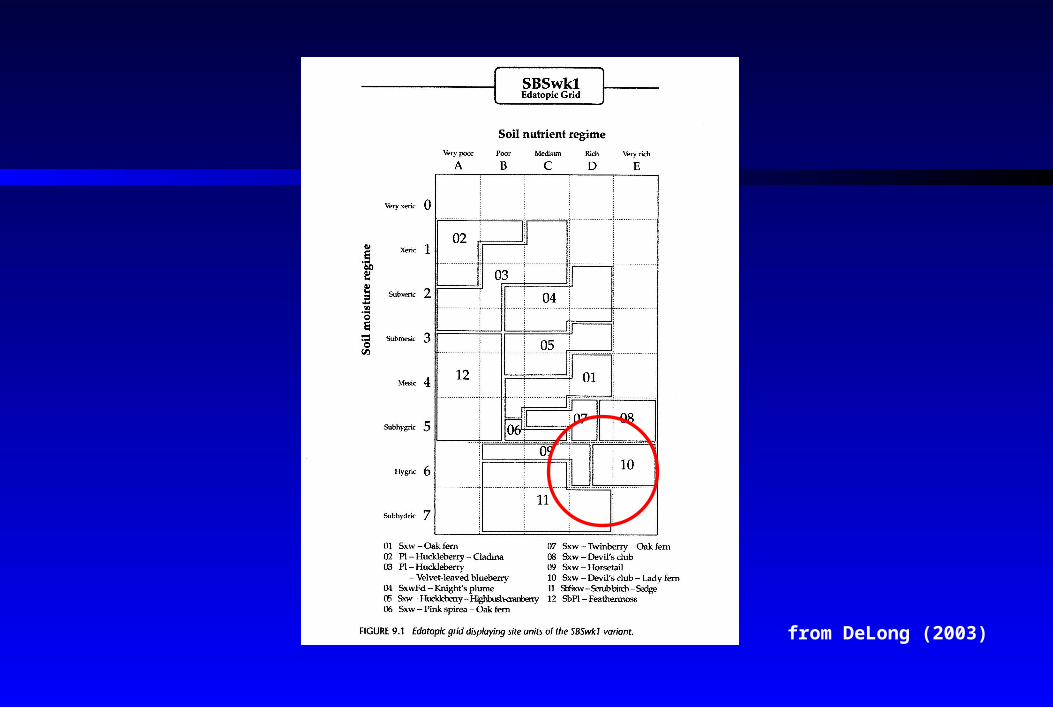
from DeLong (2003)


Factors affecting interpretation of foliar nutrient data
Foliar sampling protocol
Site ecological characteristics
Laboratory analytical methodology

Relationship between foliar N analytical methodologiesdry combustion vs. wet digestion
0.9 1.0 1.1 1.2 1.3 1.4 1.50.8
0.9
1.0
1.1
1.2
1.3
1.4
% N (dry combustion)
% N
(w
et
dig
es
tio
n)

Relationship between foliar S analytical methodologies dry combustion vs. wet digestion
0.06 0.07 0.08 0.09 0.100.05
0.06
0.07
0.08
0.09
% S (dry combustion)
% S
(w
et
dig
es
tio
n)

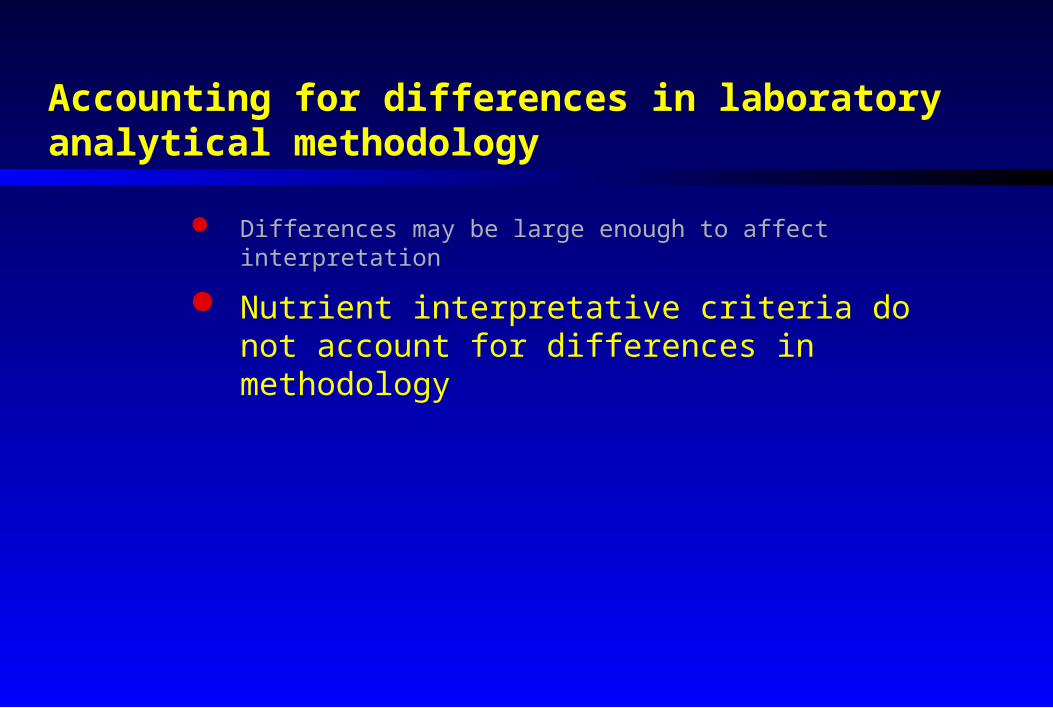
Accounting for differences in laboratory analytical methodology
Differences may be large enough to affect interpretation
Accounting for differences in laboratory analytical methodology
Differences may be large enough to affect interpretation
Nutrient interpretative criteria do not account for differences in methodology

Accounting for differences in laboratory analytical methodology
Differences may be large enough to affect interpretation
Nutrient interpretative criteria do not account for differences in methodology
Known differences in laboratory analytical results can be used to “normalize” foliar data prior to interpretation
“Normalization” requires inter-laboratory comparisons
The “normalization” process does not make inferences about the quality of foliar nutrient data

Inter-laboratory comparisonPacific Soil Analysis vs. Ministry of Environment

Inter-laboratory comparisonPacific Soil Analysis vs. Ministry of Environment
48 previously collected Pl foliage samples were selected

Inter-laboratory comparisonPacific Soil Analysis vs. Ministry of Environment
48 previously analyzed Pl foliage samples were used
Samples were selected to cover a broad range of foliar nutrient levels

Inter-laboratory comparisonPacific Soil Analysis vs. Ministry of Environment
48 previously analyzed Pl foliage samples were used
Samples were selected to cover a broad range of foliar nutrient levels
Each sample was thoroughly mixed and split into two sub-samples

Inter-laboratory comparisonPacific Soil Analysis vs. Ministry of Environment
48 previously analyzed Pl foliage samples were used
Samples were selected to cover a broad range of foliar nutrient levels
Each sample was thoroughly mixed and split into two sub-samples
One sub-sample was shipped to each lab in December 2011
For each nutrient, laboratory results were reviewed and subjected to regression analysis
Based on previous research, equations were selected to “normalize” foliar nutrient data
An Excel spreadsheet was developed to facilitate “normalization” for practitioners

Laboratory foliar N comparison PSAI vs. MoE
0.9 1.0 1.1 1.2 1.3 1.4 1.50.8
0.9
1.0
1.1
1.2
1.3
1.4
% Nitrogen (MoE)
% N
itro
ge
n (
PS
AI)
y = 0.786x + 0.1336R2 = 0.775

Laboratory foliar S comparison PSAI vs. MoE
0.05 0.06 0.07 0.08 0.090.06
0.07
0.08
0.09
0.10
% Sulphur (MoE)
% S
ulp
hu
r (P
SA
I)
y = 1.005x + 0.0064R2 = 0.762
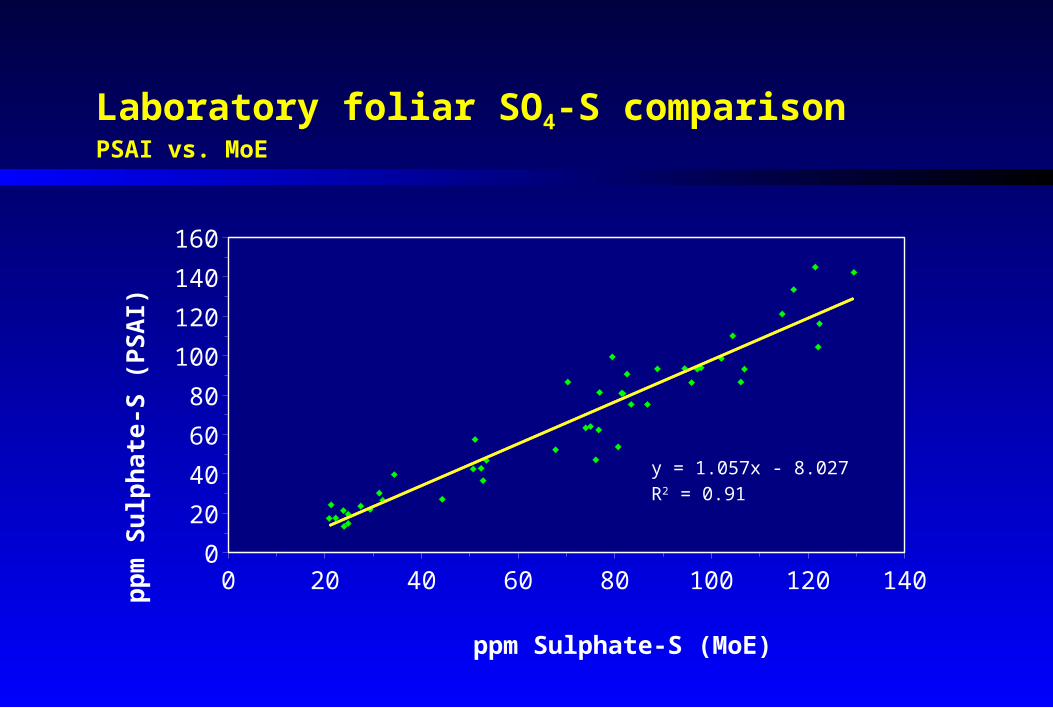
Laboratory foliar SO4-S comparison PSAI vs. MoE
0 20 40 60 80 100 120 1400
20
40
60
80
100
120
140
160
ppm Sulphate-S (MoE)
pp
m S
ulp
ha
te-S
(P
SA
I)
y = 1.057x - 8.027R2 = 0.91
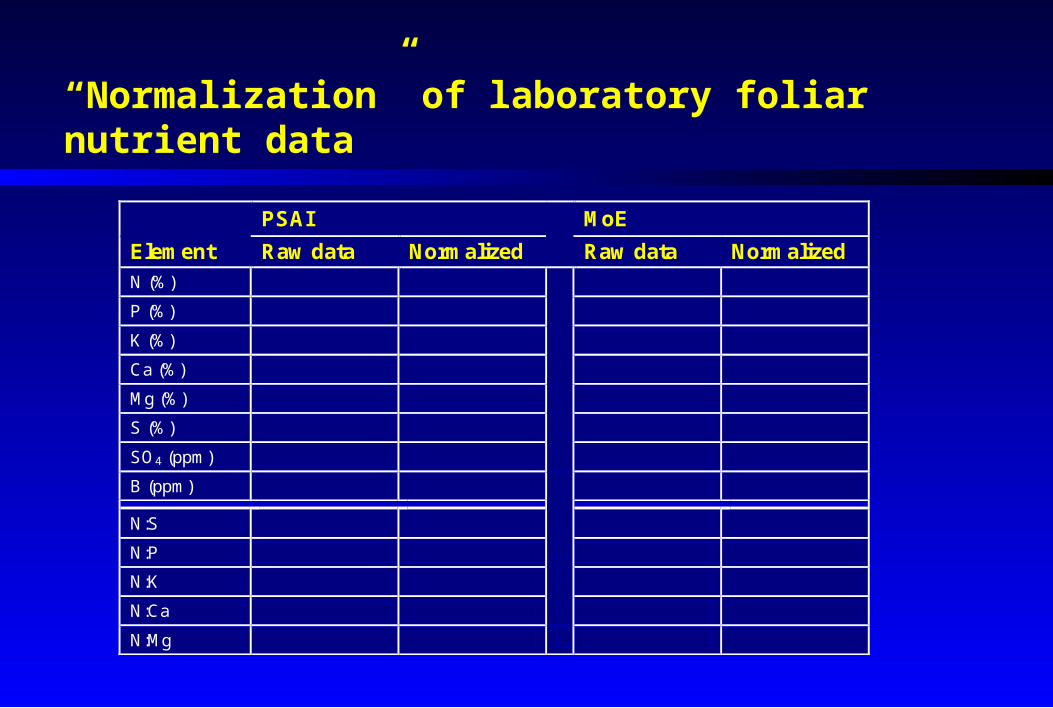
“Normalization” of laboratory foliar nutrient data
PSAI MoE
Element Raw data Normalized Raw data Normalized N (%)
P (%)
K (%)
Ca (%)
Mg (%)
S (%)
SO4 (ppm)
B (ppm)
N:S
N:P
N:K
N:Ca
N:Mg

“Normalization” of laboratory foliar nutrient data
PSAI MoE
Element Raw data Normalized Raw data Normalized N (%) 1.200
P (%) 0.145
K (%) 0.450
Ca (%) 0.185
Mg (%) 0.110
S (%) 0.091
SO4 (ppm) 75.0
B (ppm) 15.0
N:S
N:P
N:K
N:Ca
N:Mg

“Normalization” of laboratory foliar nutrient data
PSAI MoE
Element Raw data Normalized Raw data Normalized N (%) 1.200
P (%) 0.145
K (%) 0.450
Ca (%) 0.185
Mg (%) 0.110
S (%) 0.091
SO4 (ppm) 75.0
B (ppm) 15.0
N:S 13.2
N:P 8.3
N:K 2.7
N:Ca 6.5
N:Mg 10.9

“Normalization” of laboratory foliar nutrient data
PSAI MoE
Element Raw data Normalized Raw data Normalized N (%) 1.200 1.200
P (%) 0.145 0.133
K (%) 0.450 0.415
Ca (%) 0.185 0.144
Mg (%) 0.110 0.105
S (%) 0.091 0.091
SO4 (ppm) 75.0 75.0
B (ppm) 15.0 15.0
N:S 13.2 13.2
N:P 8.3 9.0
N:K 2.7 2.9
N:Ca 6.5 8.3
N:Mg 10.9 11.5

“Normalization” of laboratory foliar nutrient data
PSAI MoE
Element Raw data Normalized Raw data Normalized N (%) 1.200 1.200
P (%) 0.145 0.133
K (%) 0.450 0.450
Ca (%) 0.185 0.144
Mg (%) 0.110 0.105
S (%) 0.091 0.091
SO4 (ppm) 75.0 75.0
B (ppm) 15.0 15.0
N:S 13.2 13.2
N:P 8.3 9.0
N:K 2.7 2.7
N:Ca 6.5 8.3
N:Mg 10.9 11.5
= 0.561x + 0.052
= 0.677x + 0.019
= 0.720x + 0.026
= 0.840x + 0.036

Normalization of laboratory foliar nutrient data
PSAI MoE
Element Raw Normalized Raw Normalized N (%) 1.200 1.200
P (%) 0.145 0.133
K (%) 0.450 0.450
Ca (%) 0.185 0.144
Mg (%) 0.110 0.105
S (%) 0.091 0.091
SO4 (ppm) 75.0 75.0
B (ppm) 15.0 15.0
N:S 13.2 13.2
N:P 8.3 9.0
N:K 2.7 2.9
N:Ca 6.5 8.3
N:Mg 10.9 11.5

“Normalization” of laboratory foliar nutrient data
PSAI MoE
Element Raw data Normalized Raw data Normalized N (%) 1.200
P (%) 0.145
K (%) 0.450
Ca (%) 0.185
Mg (%) 0.110
S (%) 0.091
SO4 (ppm) 75.0
B (ppm) 15.0
N:S
N:P
N:K
N:Ca
N:Mg

“Normalization” of laboratory foliar nutrient data
PSAI MoE
Element Raw data Normalized Raw data Normalized N (%) 1.200
P (%) 0.145
K (%) 0.450
Ca (%) 0.185
Mg (%) 0.110
S (%) 0.091
SO4 (ppm) 75.0
B (ppm) 15.0
N:S 13.2
N:P 8.3
N:K 2.7
N:Ca 6.5
N:Mg 10.9
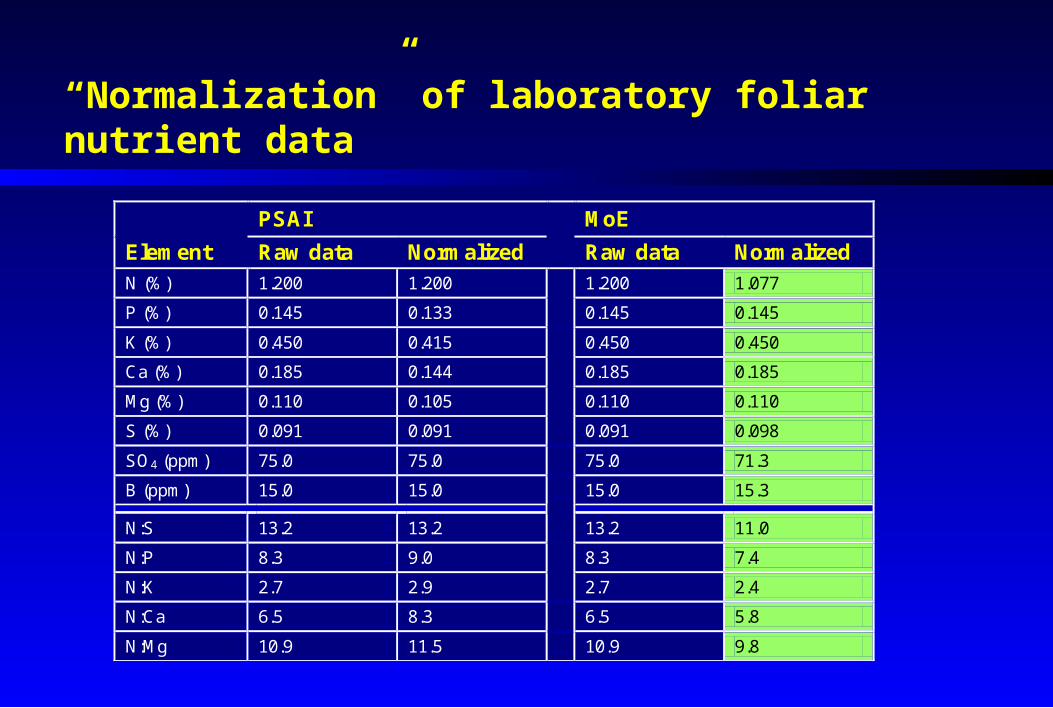
“Normalization” of laboratory foliar nutrient data
PSAI MoE
Element Raw data Normalized Raw data Normalized N (%) 1.200 1.200 1.200 1.077
P (%) 0.145 0.133 0.145 0.145
K (%) 0.450 0.415 0.450 0.450
Ca (%) 0.185 0.144 0.185 0.185
Mg (%) 0.110 0.105 0.110 0.110
S (%) 0.091 0.091 0.091 0.098
SO4 (ppm) 75.0 75.0 75.0 71.3
B (ppm) 15.0 15.0 15.0 15.3
N:S 13.2 13.2 13.2 11.0
N:P 8.3 9.0 8.3 7.4
N:K 2.7 2.9 2.7 2.4
N:Ca 6.5 8.3 6.5 5.8
N:Mg 10.9 11.5 10.9 9.8
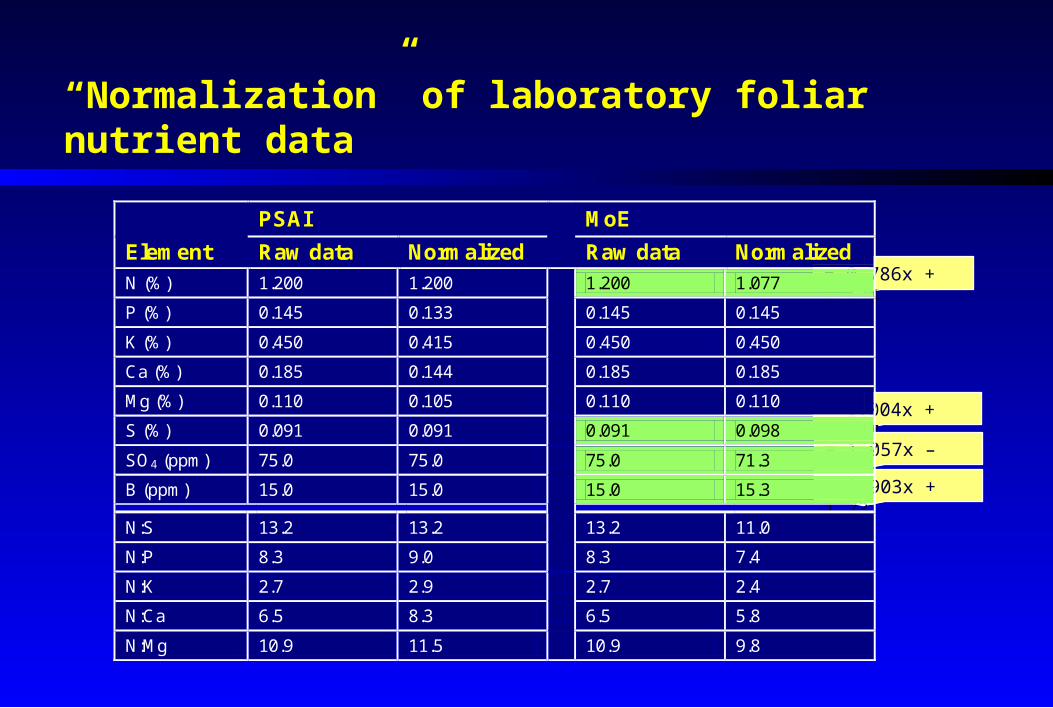
= 0.786x + 0.134
= 1.004x + 0.007
= 1.057x – 8.03
= 0.903x + 1.73

“Normalization” of laboratory foliar nutrient data
PSAI MoE
Element Raw data Normalized Raw data Normalized N (%) 1.200 1.200 1.200 1.077
P (%) 0.145 0.133 0.145 0.145
K (%) 0.450 0.415 0.450 0.450
Ca (%) 0.185 0.144 0.185 0.185
Mg (%) 0.110 0.105 0.110 0.110
S (%) 0.091 0.091 0.091 0.098
SO4 (ppm) 75.0 75.0 75.0 71.2
B (ppm) 15.0 15.0 15.0 15.3
N:S 13.2 13.2 13.2 11.0
N:P 8.3 9.0 8.3 7.4
N:K 2.7 2.9 2.7 2.4
N:Ca 6.5 8.3 6.5 5.8
N:Mg 10.9 11.5 10.9 9.8

“Normalization” of laboratory foliar nutrient data
PSAI MoE
Element Raw data Normalized Raw data Normalized N (%) 1.200 1.200
P (%) 0.145 0.145
K (%) 0.450 0.450
Ca (%) 0.185 0.185
Mg (%) 0.110 0.110
S (%) 0.091 0.091
SO4 (ppm) 75.0 75.0
B (ppm) 15.0 15.0
N:S 13.2 13.2
N:P 8.3 8.3
N:K 2.7 2.7
N:Ca 6.5 6.5
N:Mg 10.9 10.9

“Normalization” of laboratory foliar nutrient data
PSAI MoE
Element Raw data Normalized Raw data Normalized N (%) 1.200 1.200 1.200 1.077
P (%) 0.145 0.133 0.145 0.145
K (%) 0.450 0.415 0.450 0.450
Ca (%) 0.185 0.144 0.185 0.185
Mg (%) 0.110 0.105 0.110 0.110
S (%) 0.091 0.091 0.091 0.098
SO4 (ppm) 75.0 75.0 75.0 71.2
B (ppm) 15.0 15.0 15.0 15.3
N:S 13.2 13.2 13.2 11.0
N:P 8.3 9.0 8.3 7.4
N:K 2.7 2.9 2.7 2.4
N:Ca 6.5 8.3 6.5 5.8
N:Mg 10.9 11.5 10.9 9.8

“Normalization” of laboratory foliar nutrient data
PSAI MoE
Element Raw data Normalized Raw data Normalized N (%) 1.200 1.200 1.200 1.077
P (%) 0.145 0.133 0.145 0.145
K (%) 0.450 0.415 0.450 0.450
Ca (%) 0.185 0.144 0.185 0.185
Mg (%) 0.110 0.105 0.110 0.110
S (%) 0.091 0.091 0.091 0.098
SO4 (ppm) 75.0 75.0 75.0 71.2
B (ppm) 15.0 15.0 15.0 15.3
N:S 13.2 13.2 13.2 11.0
N:P 8.3 9.0 8.3 7.4
N:K 2.7 2.9 2.7 2.4
N:Ca 6.5 8.3 6.5 5.8
N:Mg 10.9 11.5 10.9 9.8

Factors affecting interpretation of foliar nutrient data
Foliar sampling protocol
Site ecological characteristics
Laboratory analytical methodology
Availability of reliable foliar nutrient interpretative criteria

from Carter (1992)

from Brockley (2001)

Revised foliar nutrient interpretative criteria

Revised foliar nutrient interpretative criteria
Information sources: Previously published interpretative criteria

Revised foliar nutrient interpretative criteria
Information sources: Previously published interpretative criteria
Published foliar nutrient and growth response data from Pinus, Picea and Pseudotsuga fertilization studies

Revised foliar nutrient interpretative criteria
Information sources: Previously published interpretative criteria
Published foliar nutrient and growth response data from Pinus, Picea and Pseudotsuga fertilization studies
Unpublished foliar nutrient and growth response data from BC fertilization studies
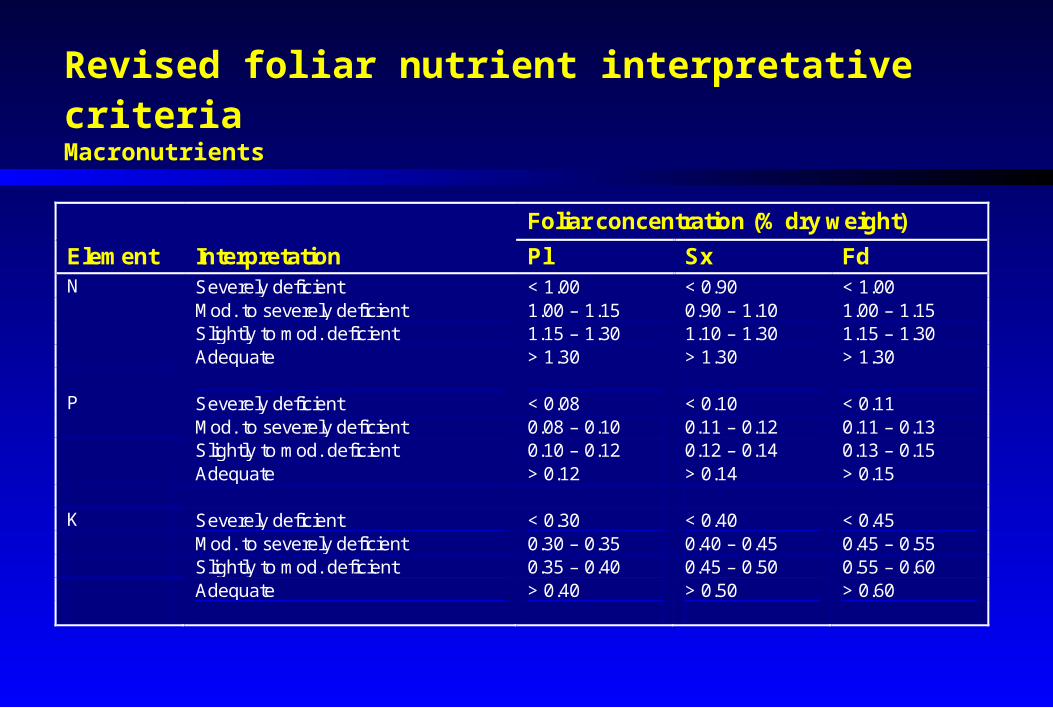
Revised foliar nutrient interpretative criteria Macronutrients
Foliar concentration (% dry weight)
Element Interpretation Pl Sx Fd N Severely deficient < 1.00 < 0.90 < 1.00 Mod. to severely deficient 1.00 – 1.15 0.90 – 1.10 1.00 – 1.15 Slightly to mod. deficient 1.15 – 1.30 1.10 – 1.30 1.15 – 1.30 Adequate > 1.30 > 1.30 > 1.30 P Severely deficient < 0.08 < 0.10 < 0.11 Mod. to severely deficient 0.08 – 0.10 0.11 – 0.12 0.11 – 0.13 Slightly to mod. deficient 0.10 – 0.12 0.12 – 0.14 0.13 – 0.15 Adequate > 0.12 > 0.14 > 0.15 K Severely deficient < 0.30 < 0.40 < 0.45 Mod. to severely deficient 0.30 – 0.35 0.40 – 0.45 0.45 – 0.55 Slightly to mod. deficient 0.35 – 0.40 0.45 – 0.50 0.55 – 0.60 Adequate > 0.40 > 0.50 > 0.60

Revised foliar nutrient interpretative criteria Macronutrients cont’d
Foliar concentration (% dry weight)
Element Interpretation Pl Sx Fd Ca Severely deficient < 0.06 < 0.10 < 0.10 Mod. to severely deficient 0.06 – 0.08 0.10 – 0.15 0.10 – 0.15 Slightly to mod. deficient 0.08 – 0.10 0.15 – 0.20 0.15 – 0.20 Adequate > 0.10 > 0.20 > 0.20 Mg Severely deficient < 0.04 < 0.04 < 0.06 Mod. to severely deficient 0.04 – 0.06 0.04 – 0.06 0.06 – 0.08 Slightly to mod. deficient 0.06 – 0.08 0.06 – 0.08 0.08 – 0.10 Adequate > 0.08 > 0.08 > 0.10 S Severely deficient < 0.06 < 0.06 < 0.06 Mod. to severely deficient 0.06 – 0.08 0.06 – 0.08 0.06 – 0.08 Slightly to mod. deficient 0.08 – 0.10 0.08 – 0.10 0.08 – 0.10 Adequate > 0.10 > 0.10 > 0.10

Revised foliar nutrient interpretative criteria Sulphate-S and Boron
Foliar concentration (ppm dry weight)
Element Interpretation Pl Sx Fd SO4-S Severely deficient < 40 < 60 < 100 Mod. to severely deficient 40 – 60 60 – 80 100 – 150 Slightly to mod. deficient 60 – 80 80 – 100 150 – 200 Adequate > 80 > 100 > 200 B Severely deficient < 3 < 3 < 3 Probable deficiency 3 – 6 3 – 6 3 – 6 Possible deficiency 6 – 12 6 – 12 6 – 12 No deficiency > 12 > 12 > 12
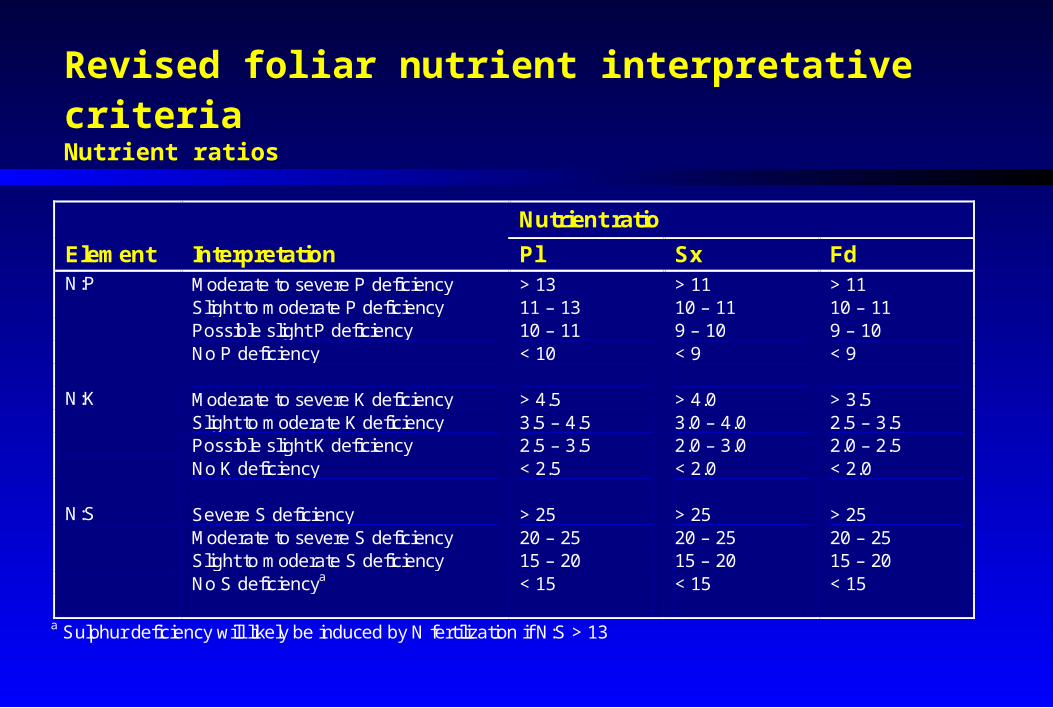
Revised foliar nutrient interpretative criteria Nutrient ratios
Nutrient ratio
Element Interpretation Pl Sx Fd N:P Moderate to severe P deficiency > 13 > 11 > 11 Slight to moderate P deficiency 11 – 13 10 – 11 10 – 11 Possible slight P deficiency 10 – 11 9 – 10 9 – 10 No P deficiency < 10 < 9 < 9 N:K Moderate to severe K deficiency > 4.5 > 4.0 > 3.5 Slight to moderate K deficiency 3.5 – 4.5 3.0 – 4.0 2.5 – 3.5 Possible slight K deficiency 2.5 – 3.5 2.0 – 3.0 2.0 – 2.5 No K deficiency < 2.5 < 2.0 < 2.0 N:S Severe S deficiency > 25 > 25 > 25 Moderate to severe S deficiency 20 – 25 20 – 25 20 – 25 Slight to moderate S deficiency 15 – 20 15 – 20 15 – 20 No S deficiencya < 15 < 15 < 15
a Sulphur deficiency will likely be induced by N fertilization if N:S > 13
Some basic interpretative rules

Some basic interpretative rules
Confirm that standardized foliar sampling protocol was used
Some basic interpretative rules
Confirm that standardized foliar sampling protocol was used
Assess foliar nutrient status within the context of site ecological characteristics

Some basic interpretative rules
Confirm that standardized foliar sampling protocol was used
Assess foliar nutrient status within the context of site ecological characteristics
Confirm that N deficiency exists before assessing other nutrients

Some basic interpretative rules
Confirm that standardized foliar sampling protocol was used
Assess foliar nutrient status within the context of site ecological characteristics
Confirm that N deficiency exists before assessing other nutrients
Assess S status in the following order of importance:
SO4 > N:S > S

Some basic interpretative rules
Confirm that standardized foliar sampling protocol was used
Assess foliar nutrient status within the context of site ecological characteristics
Confirm that N deficiency exists before assessing other nutrients
Assess S status in the following order of importance:SO4 > N:S > S
N:P, N:K, and N:Mg ratios are more important than absolute levels of P, K, or Mg
Don’t be too concerned if possible deficiency is indicated for Cu, Zn, or Fe
Ask for help if uncertain