new technique for validation of uf membrane processes
TRANSCRIPT
New technique for validation of UF
membrane processes
Alice Antony and Greg Leslie

Overview
• Background
• Project outline
• Results
• Nanoparticles development
• UF challenge tests
• Conclusions & Future Work
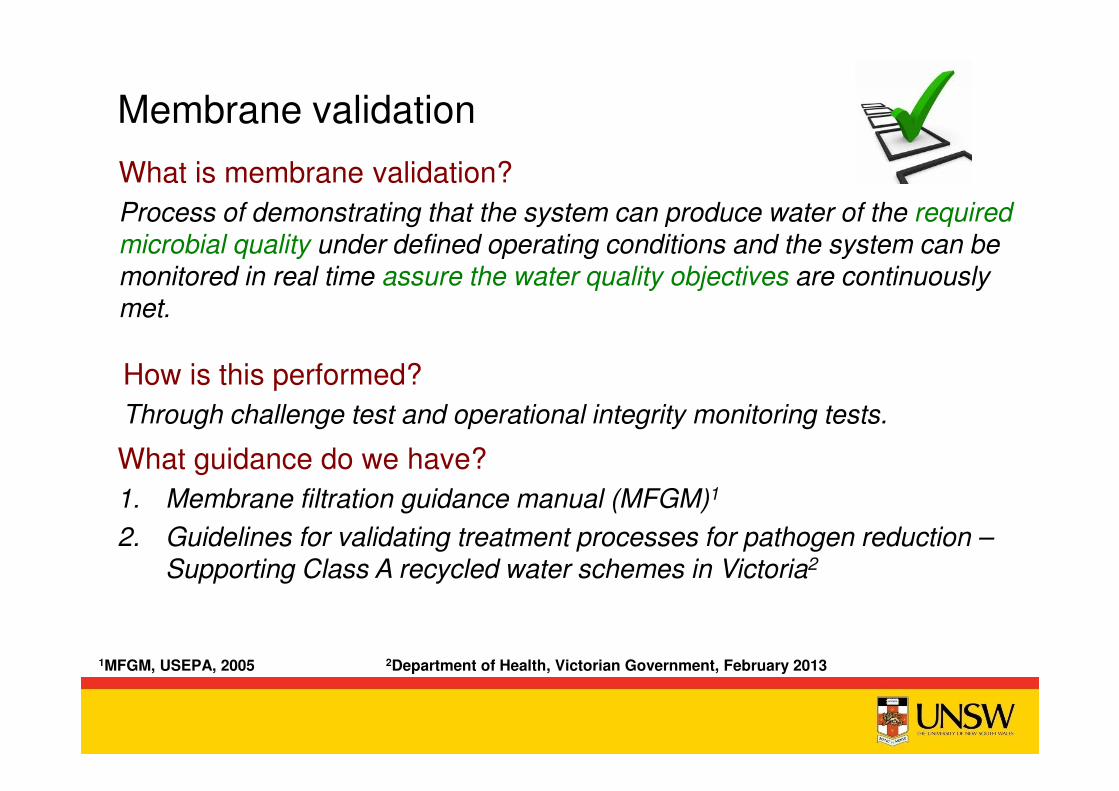
Membrane validation
What is membrane validation?
Process of demonstrating that the system can produce water of the required microbial quality under defined operating conditions and the system can be monitored in real time assure the water quality objectives are continuously met.
How is this performed?
Through challenge test and operational integrity monitoring tests.
What guidance do we have?
1. Membrane filtration guidance manual (MFGM)1
2. Guidelines for validating treatment processes for pathogen reduction –Supporting Class A recycled water schemes in Victoria2
1MFGM, USEPA, 2005 2Department of Health, Victorian Government, February 2013

New techniques for real time monitoring of membrane
integrity for virus removal - Project outline
Phase 1 - Review of literature, identification of
knowledge gaps and recommendation of novel
integrity tests (completed in 2009)Critical Reviews in Environmental Science and Technology 42(9), 2012, 891-933.
Phase 2 – Development and testing of novel
integrity test (Completed in 2013)Journal of Membrane Science 454, 2014, 193-199
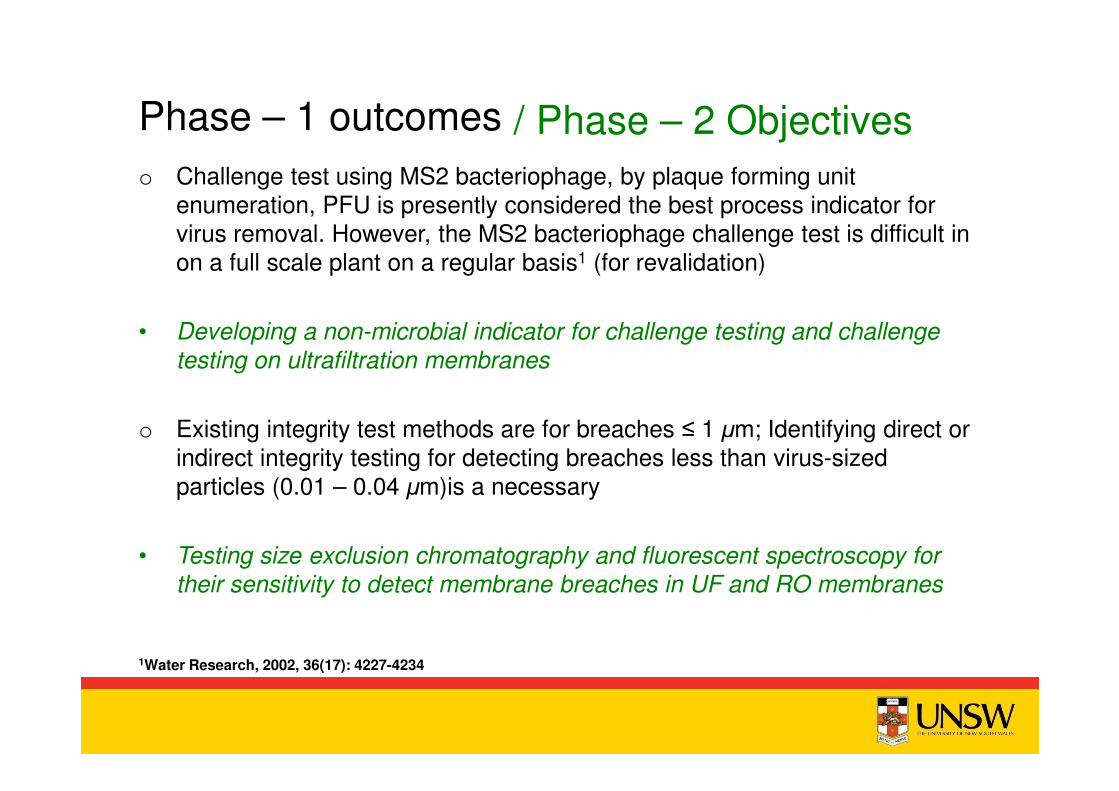
Phase – 1 outcomes
o Challenge test using MS2 bacteriophage, by plaque forming unit enumeration, PFU is presently considered the best process indicator for virus removal. However, the MS2 bacteriophage challenge test is difficult in on a full scale plant on a regular basis1 (for revalidation)
• Developing a non-microbial indicator for challenge testing and challenge
testing on ultrafiltration membranes
o Existing integrity test methods are for breaches ≤ 1 µm; Identifying direct or indirect integrity testing for detecting breaches less than virus-sized particles (0.01 – 0.04 µm)is a necessary
• Testing size exclusion chromatography and fluorescent spectroscopy for
their sensitivity to detect membrane breaches in UF and RO membranes
1Water Research, 2002, 36(17): 4227-4234
/ Phase – 2 Objectives

MS2 challenge testing
Ro
tavir
us
No
rwalk
H
ep
A
P
oli
ovir
us
Testing with native Viruses (NV)• Low conc. in real scenario• Assay of NV is complex, time consuming, definite analysis
methodology is not available in some cases• Issue of possible contamination
MS2 as a surrogate1,2,3 – Why and Why not?
• Ablity to cultivate in high concentration• sensitivity as high as 6LRV
• Impractical in full scale – high cost and effort
• Long turnover time, 24 h
• Physicochemical retention vs. inadvertent biological inactivationParticle aggregation may enhance the filtration capacity
• PFU does not provide tools to control denaturation and aggregation
1Journal of Applied Microbiology , 2007, 103(5): 1632-1638, 2Journal of Membrane Science, 2009, 326(1): 111-1163Critical Reviews in Environmental Science and Technology, 2012, 42,891-933.

Non-microbial alternative
MS2 Phage
Diameter – 24 nm
Icosahedral
Isoelectricpoint (pI) - 3.5-3.9, net negative change above pH 3.9
Non-microbial substitute
Citrate stabilized silver (zerovalent)
nanoparticle
Virus sizedSpherically shapedNegatively charged at pH 7Stable during filtration
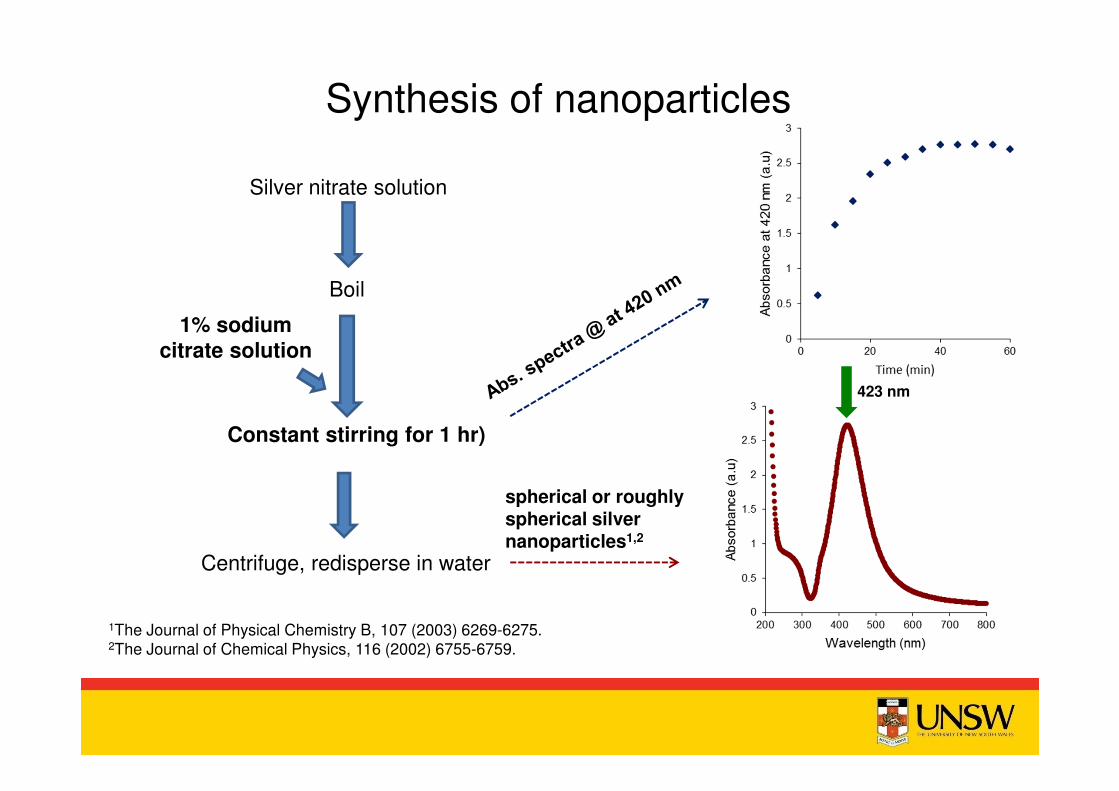
Synthesis of nanoparticles
Centrifuge, redisperse in water
1% sodium
citrate solution
Boil
Silver nitrate solution
Constant stirring for 1 hr)
spherical or roughly spherical silver nanoparticles1,2
1The Journal of Physical Chemistry B, 107 (2003) 6269-6275.2The Journal of Chemical Physics, 116 (2002) 6755-6759.
423 nm

Characterisation of Nanoparticles concentration, size, charge & stability
Concentration of the finished nanoparticles – Inductively coupled plasma – Optical emission spectroscopy
Size - as average hydrodynamic size & charge by a dynamic light scattering, Brookhaven 90 Plus particle sizer
Eff. diameter (hydrated) : 50 nm Charge: -25 mV (negatively charged)
Particle properties stable over 3 days
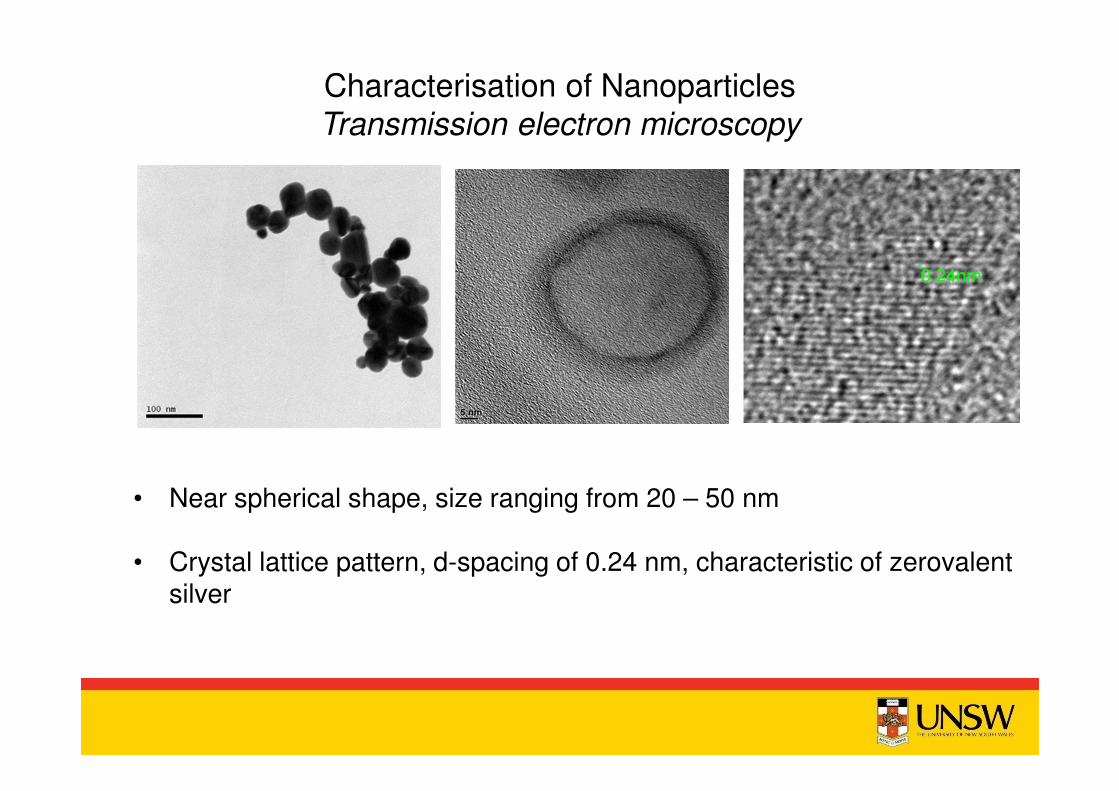
• Near spherical shape, size ranging from 20 – 50 nm
• Crystal lattice pattern, d-spacing of 0.24 nm, characteristic of zerovalentsilver
Characterisation of Nanoparticles Transmission electron microscopy

Challenge testing
• Membrane - PVDF, UF membranes, average pore size - 0.04 µm
• Effective membrane area - 0.025 m2
• Flux - 30 or 50 L m-2 h-1
• Feed solution – Clean water with 5, 10 & 20 mg L-1 of silver
nanoparticles
• Parameters measured and/or compared – Clean water flux, TMP
• Change in TMP as a function of time, due t fouling of nanoparticles

Challenging compromised membranes with nanoparticles
• Physical compromise through punctures and cuts
• Chemical damage
o Exposure to hypochlorite solutions (Ct) of 2,500, 5,000, 10,000, 15,000 and 20,000 mg L-1.h
o Equivalent to a total exposure of 3.5, 6.9, 13.9, 20.8 and 27.8 months at 1mg/L concentration over multiple uses
SEM images of the punctures made with a 100 µm diameter needle

Challenge testing contd.,
LRV and TMP change during the testing of intact UF membrane
Flux,
(L m2 h
-1)
Nanoparticle
concentration,
(mg L-1
of Ag)
LRV
30 5 2.34±0.09 -0.3
30 10 2.61±0.10 0.5
30 20 2.94±0.09 0.5
50 5 2.31±0.10 0.0
50 10 2.61±0.10 0.5
50 20 2.83±0.10 0.3
• LRV ranging from 2.3 to 2.9 was demonstrated without any impact on the operating flux
• Slightly high LRV could be established with high nanoparticle concentration

Challenge testing contd.,
• One puncture, compromise ratio was 0.00003% and the LRV decreased from 2.8 to 1.5
• Four successive holes, the LRVs reduced to 1.1, 0.6, 0.5 and 0.3, respectively
• After three cuts, rejection was 7.1 % and LRV <0.1

Challenge testing contd.,
• Realistic representation of the impairment taking place in an operational plant with routine use of chemicals
• At 2500 and 5000 mg L-1.h, the membrane resistance (Rm)decreased to 19 and 38%, but the rejection capacity was almost unaffected
• Exposure to high concentrations seem to affect both the resistance and rejection
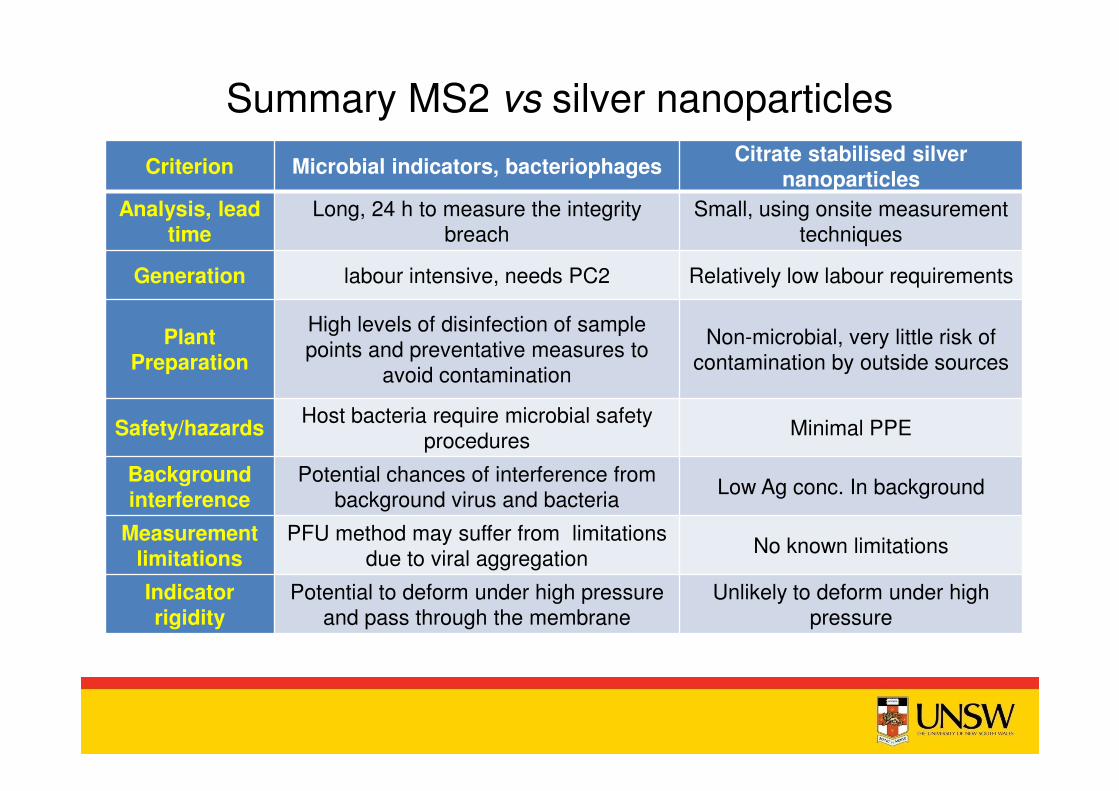
Summary MS2 vs silver nanoparticles
Criterion Microbial indicators, bacteriophagesCitrate stabilised silver
nanoparticles
Analysis, lead time
Long, 24 h to measure the integrity breach
Small, using onsite measurement techniques
Generation labour intensive, needs PC2 Relatively low labour requirements
Plant Preparation
High levels of disinfection of sample
points and preventative measures to avoid contamination
Non-microbial, very little risk of contamination by outside sources
Safety/hazardsHost bacteria require microbial safety
proceduresMinimal PPE
Background interference
Potential chances of interference from background virus and bacteria
Low Ag conc. In background
Measurement limitations
PFU method may suffer from limitations due to viral aggregation
No known limitations
Indicator rigidity
Potential to deform under high pressure and pass through the membrane
Unlikely to deform under high pressure

4 Key Conclusions
• Demonstrated the suitability of new
citrate stabilised silver nanoparticles as
virus surrogates in terms of shape, size,
rigidity, charge and ease of detection
• Demonstrated close to 3 LRV of virus
removal for intact UF membranes
• Demonstrated the sensitivity of the
system to differentiate intact membrane
fibres from those with a low number of
physical breaches or chemical
degradation
• Demonstrated the potential for the
validation of UF membranes in recycled
water applications

Project is complete…..however..
Would like to work
• with a water utility to use these particles in the field
• on the recovery of silver nanoparticles

Acknowledgements