new spreading technologies for improved accuracy...
TRANSCRIPT
1
NEW SPREADING TECHNOLOGIES FOR IMPROVED ACCURACY
AND ENVIRONMENTAL COMPLIANCE
Yule I.J.
1 and Grafton M.C.E.
2
1New Zealand Centre for Precision Agriculture, Institute of Natural Resources,
Massey University, Palmerston North, New Zealand.
2Ravensdown Fertiliser Co-operative Ltd., Christchurch, New Zealand,
Abstract.
There has been considerable focus on the need for accurate spreading and attempts have been
made to quantify the factors responsible for creating inaccuracy. Further technological
improvements in Geographical Information Systems (GIS) have made it possible to measure
and model what happens in the field. The term “Field CV” was used and it was clear that
factors which were not previously considered had an important impact of spreading accuracy.
Developments in spreader testing facilities have allowed some manufacturers to identify
many of these factors and rapidly test equipment. This had led to an acceleration of technical
development, affording farmers greater choice with the potential to improve accuracy of
spread and achieve better utilisation of fertiliser.
The factors affecting spreading accuracy are identified, explained and quantified in order to
give a realistic perspective of what is presently being achieved. These factors are described
within three groups: Machine factors and design, there are differences and refinements in
design that do make a difference to the spreaders ability to spread accurately in the field.
Materials being spread and their effect on spread pattern, (blended materials for example).
Environmental and field factors, field shape and slope.
The impact of new technologies such as boundary spreading; are investigated and a range of
new machine developments and improvements are described. The competing demands for
large machine capacity for higher work rate and achieving environmental compliance
especially in the dairy sector where smaller paddock size leads to increased Field CV is also
discussed.
Key words: Precision Agriculture, coefficient of variation of spread, CV, centrifugal disc
spreaders, border spreading, headland spreading, fertiliser spreading accuracy, variable rate
spreading.
Introduction.
The economic impact of poor fertiliser spreading accuracy on farm performance has been a
topic for research for around 50 years, in the early sixties there was a flurry of research
activity which attempted to identify the impact of uneven spreading. Jensen and Pesek,
(1962a, 1962b) are examples of such work. A short review of this type of research is included
in Virk et al, (2011). In this fifty year period we have also witnessed the development of test
methods designed to measure the spread pattern from centrifugal spreaders usually with the
2
purpose of determining an acceptable bout spreading width to spread with a predetermined
coefficient of variation of spread. This is almost universally been accepted as being 15% for
products containing nitrogen and 25% for other products. The test used in New Zealand
comes under the Spreadmark scheme and it is similar to other schemes around the world. A
review of test methods used around the world is presented in Lawrence et al, (2007).
In 1994 Søgaard and Kierkegaard concluded that a spatial coefficient of variation less than
20% was necessary to prevent loss of profit in agronomic crops. This will always be a
function of the nutrient used and a plants response to it, the economic relationship between
plant growth and fertiliser input as well as costs involved in applying the fertiliser. The early
work of the sixties spawned more research activity with the objective of gaining a better
understanding of the factors determining fertiliser spread patterns from spinning disc
spreaders.
Theoretical models were developed by such authors as Patterson and Reece (1962) and Inns
and Reece (1962), fairly crude assumption were made about the way fertiliser flowed down
the vanes on a spreading disc. A number of authors contributed to the effort of understanding
how machine design features influenced spreading patterns. More complex models were
developed that took account of bounce off the disc for example, Olieslagers et al, (1996).
Verifying the models has always been difficult. Grift and Hofstee (2002) developed
laboratory optical measurement systems to attempt to measure what was happening from the
spreading disc. More complex modelling approaches such as Discrete Element Modelling
(DEM) an example being, Tijskens (2006) have been undertaken. Testing halls were also
developed in Europe to allow testing of spreader in situations which were away from the
influence of weather and wind. These tended to be set up so that the spreader would drive
over a perpendicular (or transverse) row of trays which would collect the fertiliser. Automatic
weighing was added later, but essentially these tests gave the same information as the
standard test methods used out in the field.
Lawrence et al, (2006) was really the first to consider the “on the ground” or “in field’
pattern. He did this by considering a two dimensional spreader footprint rather than a single
row of trays to catch fertiliser as in most testing methods. Using RTKDGPS it was possible to
accurately track the machines position and heading. The footprint could then be
superimposed on the ground and subsequent overlaps taken into account. That work really
exploded the myth that we were spreading with “CV’s” of 15 and 25%. In his field
experiments an “in-field” CV of 42% was estimated for spreading over a number of farms. It
is clear that there are a number of further factors which diminish the accuracy of spread at
work. These were not previously accounted for. That work was verified to a very large extent
by Piron et al(2010). The facilities used by Lawrence were very basic and testing was
extremely time consuming, the latter more comprehensive work by Piron et al, (2010) was
carried out in a purpose built testing facility. Commissioning this advanced testing facility at
CEMAGREF is one of the most significant advances over this fifty year period. The
equipment and software system (CEMAGERF CEMIB) used allows a comprehensive profile
of the spread footprint to be developed within seconds of testing. This highly automated
facility requires less floor space than conventional testing halls and really gives machinery
manufacturers the ability to rapidly test all aspects of design. Descriptions of how the system
operates have been published by Piron et al, (2010). This improvement in testing facilities is
the main reason we have observed a new generation of spreaders emerge from Europe in
recent years. Although this testing system is highly significant more information on particle
size distribution from spreading equipment would be useful.
3
Method
The research completed can be divided in three categories: considering, 1) the machine
design, 2) the materials spread and 3) the environment within which the materials are spread.
For the purposes of this paper machine design and materials spread are considered.
Machine design.
Machine design factors have previously been reviewed at this workshop Yule (2009).
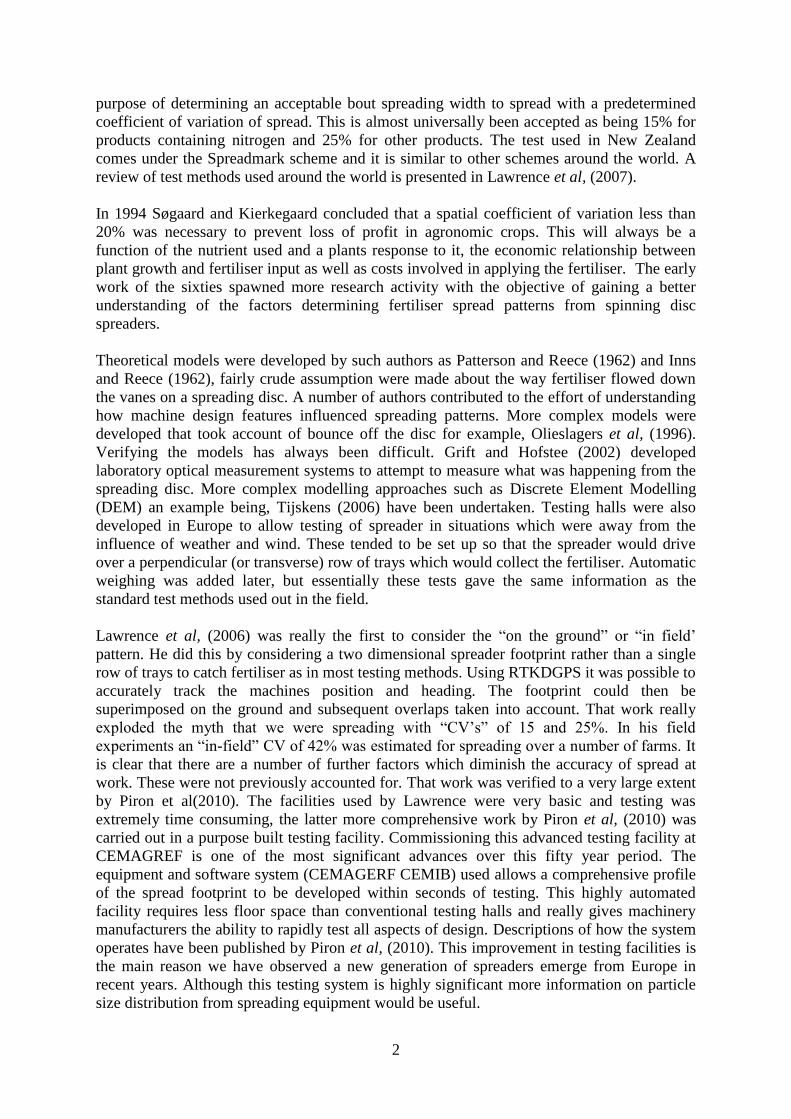
However the importance of one, the “drop on point”, to the disc has received much more
attention in recent years. The drop on point is important for a number of reasons. It does
determine the spread pattern, if it changes, then so does the spread pattern. Many spreaders
have poor stability between rates, as demonstrated in figure ,this is important in terms of
testing spread patterns and also in relation to variable rate applications where significant on-
the-go changes in application may be required.
Figure 1. The spread pattern has gone from a slight “M” pattern at an application rate of 56 (kg/ha) to a
“W” pattern at 168 (kg/ha). From Fulton et al (2001)
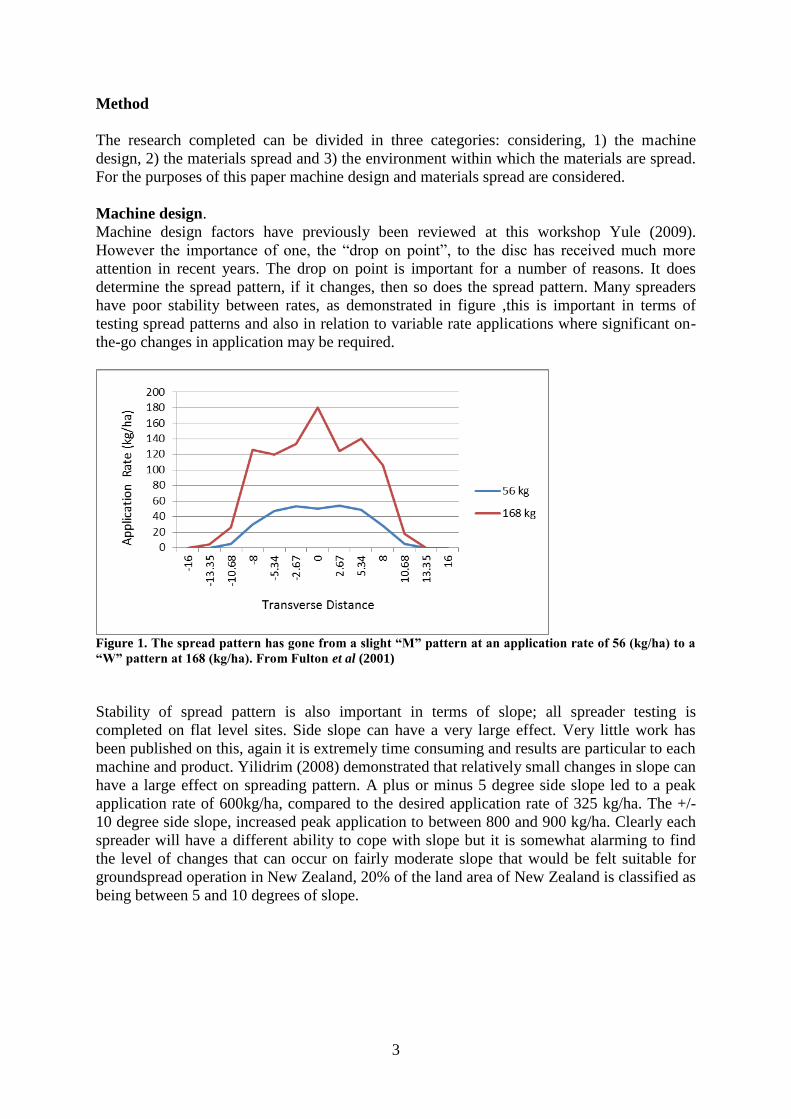
Stability of spread pattern is also important in terms of slope; all spreader testing is
completed on flat level sites. Side slope can have a very large effect. Very little work has
been published on this, again it is extremely time consuming and results are particular to each
machine and product. Yilidrim (2008) demonstrated that relatively small changes in slope can
have a large effect on spreading pattern. A plus or minus 5 degree side slope led to a peak
application rate of 600kg/ha, compared to the desired application rate of 325 kg/ha. The +/-
10 degree side slope, increased peak application to between 800 and 900 kg/ha. Clearly each
spreader will have a different ability to cope with slope but it is somewhat alarming to find
the level of changes that can occur on fairly moderate slope that would be felt suitable for
groundspread operation in New Zealand, 20% of the land area of New Zealand is classified as
being between 5 and 10 degrees of slope.
4
Figure 2 Adapted from Yilidrim (2008) a) indicate spreader performance (kg Spread per ha) on level
surface. b and c), 5 and -5 degree of slope.d and e) 10 and -10 degrees of slope.
Product Characteristics.
At the most basic level we understand that very small particles will not be thrown far off the
centreline of a spreader, whereas larger, spherical, denser particles will fly much further.
However how a machine responses to changes in product is very dependent upon individual
machine design elements. The main characteristics of interest are particle density, particle
size (mean and distribution) and particle shape. Based on field experiments using one
particular spreader Yule (2011) calculated that as long as material less than 0.5mm in
diameter comprised no more than 15% of material by mass, a situation which occurs on most
occasions aside from, a handful of occasions per year, the effect on CV is less than 5%.
The means of propelling the fertiliser from the disc and the distance it has to travel will also
be affected by the ballistic qualities of the material. Some general purpose spreaders which
are required to spread a wider range of products over a narrower bout width create the
momentum for spreading through impact of the vanes on the fertiliser rather than fertiliser
running down the vanes and being slung off the vane. A high speed video of this will be
a)
b) c)
d) e)
5
demonstrated within the presentation. The required exit speed of a particle off the disc
required to travel 30 to 40m, is clearly greater than a particle which is required to travel 0 to
5m.
There has not been a lot of significant research into looking at the particle size distribution off
spinning discs and analysing where particles of different size end up, most work has simply
concentrated on overall spread pattern. This is again due to the time consuming nature and
therefore expense of the work when trying to separate out the different sized particles.
Recently one of two European spreader manufacturers has published user information which
indicates the effect of changes of size guide number (SGN) on operating width. More
independent research work has been completed on identifying when blended products will
segregate. Some work has been completed in New Zealand, Yule and Pemberton (2009), in
Europe Miserique has been a major contributor to the research effort, Miserique and Pirard
(2004), Miserique et al, (2008) and in the USA, Virk et al (2011) have recently completed
work which investigates the product separation and stability of spread within a variable rate
application environment.
Ground-spread manufacturers have made improvements to machine design in order to
address a number of issues around field performance. This has been completed in a
hierarchical sequence to decrease field CV. Some of these improvements have been made
possible by automated recording and measuring systems which allow for rapid evaluation of
spreading systems and self-calibration.
It is likely that computer based modelling and decision support system software used in
agriculture to provide fertiliser delivery advice and recording that assumes a perfect spread
contributes to the lack of awareness of the issue and impetus to address the problem.
Identifying Elements of “Field CV”
Lawrence (2007), Lawrence and Yule (2007a and b) identified a means of measuring field
CV from ground-spread vehicles and identified the major factors contributing to the variation
in spread. Grafton et al, (2011) and Yule (2011) quantified the contributing factors to field
CV on near flat paddocks. Lawrence and Yule (2007a) established that the use of differential
global positioning (DGPS) systems could improve the CV of a ground-spread vehicle by at
least 13% as it improves driving accuracy significantly over that of a GPS without a
differential corrections system. Grafton et al (2011) using the same techniques estimated the
effects of using automatic shut off to prevent multiple applications on the same area and
variable rate control, which adjusts the rate applied to compensate changes in vehicle speed,
these are summarised in Table 2.

6
Table 2 Sources of variability and mitigation strategies for in-field CV, Grafton et al (2011)
Sou Source of Variability Mitigation available Effect of the
Technology on
reducing the field
CV
Track spacing being inaccurate
driven
Guide the spreader with GPS
(+- 8 meters)
Nil
Track spacing being inaccurate
driven
Guide the spreader with GPS
corrected signal (+-0.2 meters)
9 – 17%
Variability in application rate
when the spreader speed varies
Flow value control linked to
spreader speed.
10%
Inaccurate vehicle repositioning
post the vehicle stopping and
recommencing
Vehicle repositioning GPS with
corrected signal
10%
Small irregular shaped paddocks Remove fences to form large
regular shaped paddocks
8%
Variability in fertiliser particles
(provided the variability does not
exceed >15% <0.5 mm and the
product is stored properly
Increase the cost of domestically
manufactured fertiliser
significantly to enable the
product to be dried and cooled
5%
Application rates outside the
certified 30% tolerance
Certify spreaders at a range of
application rates as per the
Australian test methods
Unknown
Financial Implications
The effect of adoption of the spreading technologies has been to reduce the CV on flat dairy
and arable situations from around 50% Lawrence (2006) to levels as low as 20%. Lawrence
and Yule (2007a) established that as the relationship between CV and cost was exponential,
that losses when applying urea were significant at levels of CV greater than 30%.
The financial impact of the improvement in CV whilst sowing urea, using these technologies
is summarised in Table 3.
Table 3: Economic loss and improvement with change in CV, Grafton et al (2011)
CV% Economic loss
($)ha-1
Economic Improvement
($)ha-1
2005 -2010
37 21.06 -
28 8.51 12.55
23 4.60 16.46
20 3.04 18.02
The situation with ground-spread is similar to aerial application in that the costs of inaccurate
spread are greater than the application cost, however by introducing new technologies as
described the economic improvement can also be greater than the application cost.
The value of improved CV to the New Zealand dairy industry is based on the exponential equation developed by Lawrence and Yule (2007a), to express economic loss as CV
increases, see equation 1.This equation was based on a dry matter value of $0.20Kg-1
from
Horrell et al, (1999) and is based on N response from Ball and Field (1982) using urea (46% N) applied at 80Kgha
-1 on optimal fertility dairy farms. (x is the CV expressed as a decimal
rather than a percent, eg.( x = 0.3 means CV 30%)
xxxY 4683.5374.4978.286 23 (1)

7
Current valuation based upon dairy farm conversion ratios value a kilogram of dry matter at
NZ$0.40 based on a pay out of $6.08Kg-1
of milk solids dairy pay out and a conversion ratio
of 15 - 1 (CR), the same as that assumed by Lawrence and Yule (2007a) which allows the
loss to be calculated at current prices. This conversion ratio is well within the range of 7.7 –
25 kg dry matter per kilogram of milk solids found on New Zealand dairy farms (Anon,
2010). There are 4.82 million cows and heifers in New Zealand, farmed on about 1.66 million
hectares (Anon, 2012). The estimated sales mix of fertilisers for all dairy farms in New
Zealand (Pers Comm., Dr. Miles Grafton, Ravensdown, 2013) is shown in Table 4. Although
estimated the results are in line with MPI statistics, Anon (2011).
Table 4 Sales mix of fertiliser sales in New Zealand by tones, value, hectare and cow
Fertiliser Tonnes
(000)
Value NZ($)
(million)
Value Cow-1
($)
Value Ha-1
($)
Superphosphate products 603 223 46.31 134.29
Potassium products 106 69 14.35 41.62
Ammonium phosphate (s) 138 124 25.70 74.52
Urea 604 449 93.21 270.30
Magnesium 9 6 1.16 3.35
Total 1,460 871 180.72 524.08
The amount spent on urea represents applications of urea which total 360Kgha-1
. This would
need to be applied in several applications and for the purposes of this paper is represented as
4 applications at 90Kgha-1
. This is not unreasonable and is close enough to 80kgha-1
to allow
for the equation developed by Lawrence and Yule (2007a) to be valid. Spreadmark testing
has found that the swath pattern of a truck does not change markedly
30% of the tested rate.
Urea is the only product which has been tested for CV economic cost analysis and using this
product. The economic benefit of CV improvement in moving from a CV of 40% to 20% is
shown in Table 5.
Table 5 Value to NZ Dairy farmers in improving CV of urea spread from 40% to 20%. Dairy pay Out
($)
Economic Loss
CV 40% ($)
Economic Loss
CV 20% ($)
Improvement
($)
Total Benefit
4 Applications
Total Benefit
Over 1.66 million ha
Million ($)
5.50 23.18 2.59 20.59 82.34 137
6.00 25.28 2.83 22.46 89.83 149
6.50 27.39 3.06 24.33 97.31 162
7.00 29.50 3.30 26.20 104.8 174
Results
Further Improvements in Spreading Technologies
Traditionally most research was geared towards finding better explanations of what was
happening on the spreading disc in order to explain spread patterns. Now the research focus
has changed and many of the improvements being made are to do with the spatial pattern in
the field and as a result there is a need to produce a variable but controlled pattern from the
disc.
8
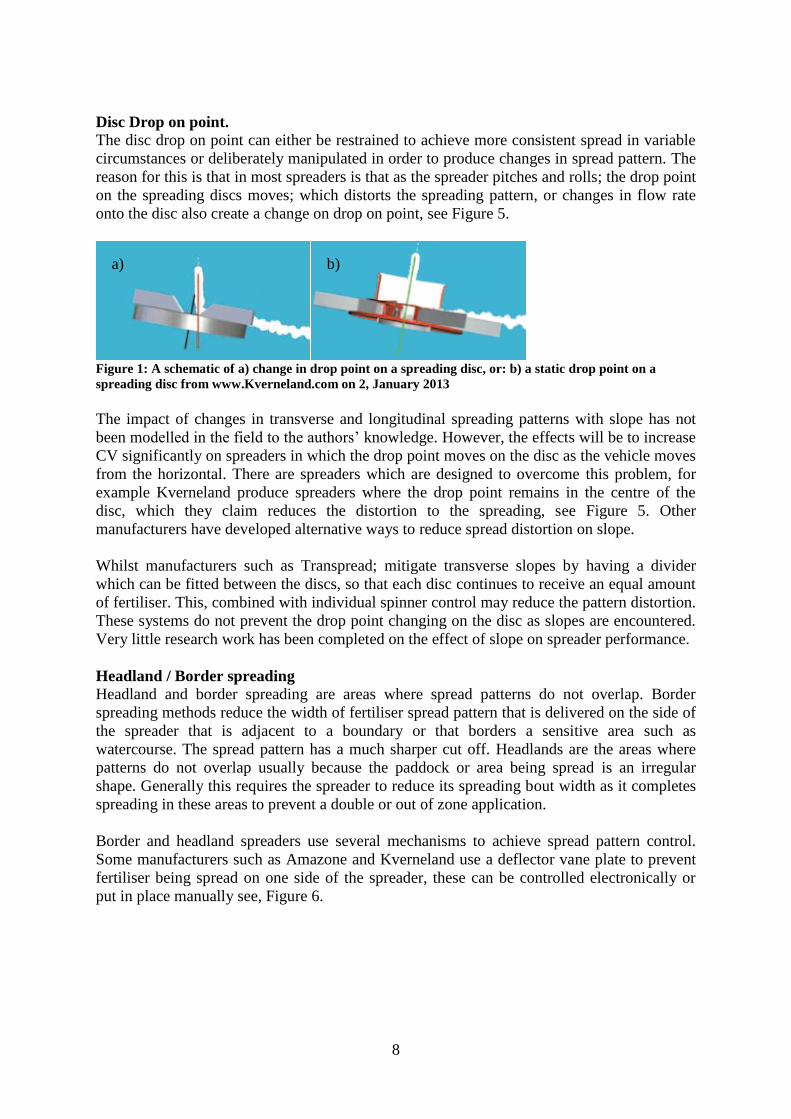
Disc Drop on point.
The disc drop on point can either be restrained to achieve more consistent spread in variable
circumstances or deliberately manipulated in order to produce changes in spread pattern. The
reason for this is that in most spreaders is that as the spreader pitches and rolls; the drop point
on the spreading discs moves; which distorts the spreading pattern, or changes in flow rate
onto the disc also create a change on drop on point, see Figure 5.
Figure 1: A schematic of a) change in drop point on a spreading disc, or: b) a static drop point on a
spreading disc from www.Kverneland.com on 2, January 2013
The impact of changes in transverse and longitudinal spreading patterns with slope has not
been modelled in the field to the authors’ knowledge. However, the effects will be to increase
CV significantly on spreaders in which the drop point moves on the disc as the vehicle moves
from the horizontal. There are spreaders which are designed to overcome this problem, for
example Kverneland produce spreaders where the drop point remains in the centre of the
disc, which they claim reduces the distortion to the spreading, see Figure 5. Other
manufacturers have developed alternative ways to reduce spread distortion on slope.
Whilst manufacturers such as Transpread; mitigate transverse slopes by having a divider
which can be fitted between the discs, so that each disc continues to receive an equal amount
of fertiliser. This, combined with individual spinner control may reduce the pattern distortion.
These systems do not prevent the drop point changing on the disc as slopes are encountered.
Very little research work has been completed on the effect of slope on spreader performance.
Headland / Border spreading
Headland and border spreading are areas where spread patterns do not overlap. Border
spreading methods reduce the width of fertiliser spread pattern that is delivered on the side of
the spreader that is adjacent to a boundary or that borders a sensitive area such as
watercourse. The spread pattern has a much sharper cut off. Headlands are the areas where
patterns do not overlap usually because the paddock or area being spread is an irregular
shape. Generally this requires the spreader to reduce its spreading bout width as it completes
spreading in these areas to prevent a double or out of zone application.
Border and headland spreaders use several mechanisms to achieve spread pattern control.
Some manufacturers such as Amazone and Kverneland use a deflector vane plate to prevent
fertiliser being spread on one side of the spreader, these can be controlled electronically or
put in place manually see, Figure 6.
a) b)

9
Figure 6: Kveneland spreading system showing deflector vanes for border spreading, downloaded from
www.Kveneland.com on 2, January 2013
Bredal and Transpread use individual spinner control to stop or slow one spinner to reduce
the spread bout width on one or both discs to achieve a border or headland spread, see Figure
7.
Figure 7: Bredal overlapping spread pattern in normal and headland operation, downloaded from:
www.Bredal.co.nz on 4, January 2013
Manufacturers such as Sulky use different length spreading vanes to vary the spread from
each disc. Long vanes are used to spread further and shorter vanes for reduced spread.
Electronic and mechanical vein deflectors may be added to these systems for border
spreading, as illustrated in figure 8.
Figure 8: Shows Sulky Triboid border spreading vane. Downloaded from www.Sulky-Burel.com 3,
January 2013

10
In New Zealand assessing the impact these various systems have on border and headland
spreading is extremely time consuming, as the country is reliant on transverse spreading over
collectors and weighing the contents to establish fertiliser distribution.
Whereas, in Europe facilities with automatic testing, of fertiliser delivery and computerised
measuring of spreading devices exist which; produce a spread pattern within a few seconds.
Facilities such as these are able to pattern test spreaders in a wide range of conditions so that
comparisons can be made between them, see Figure 9.
Figures 9, The CEMAGREF CEMIB device (left). Figure 11, (right), diagram illustrating the general
principle of operation. Reproduced from Piron et al (2010).
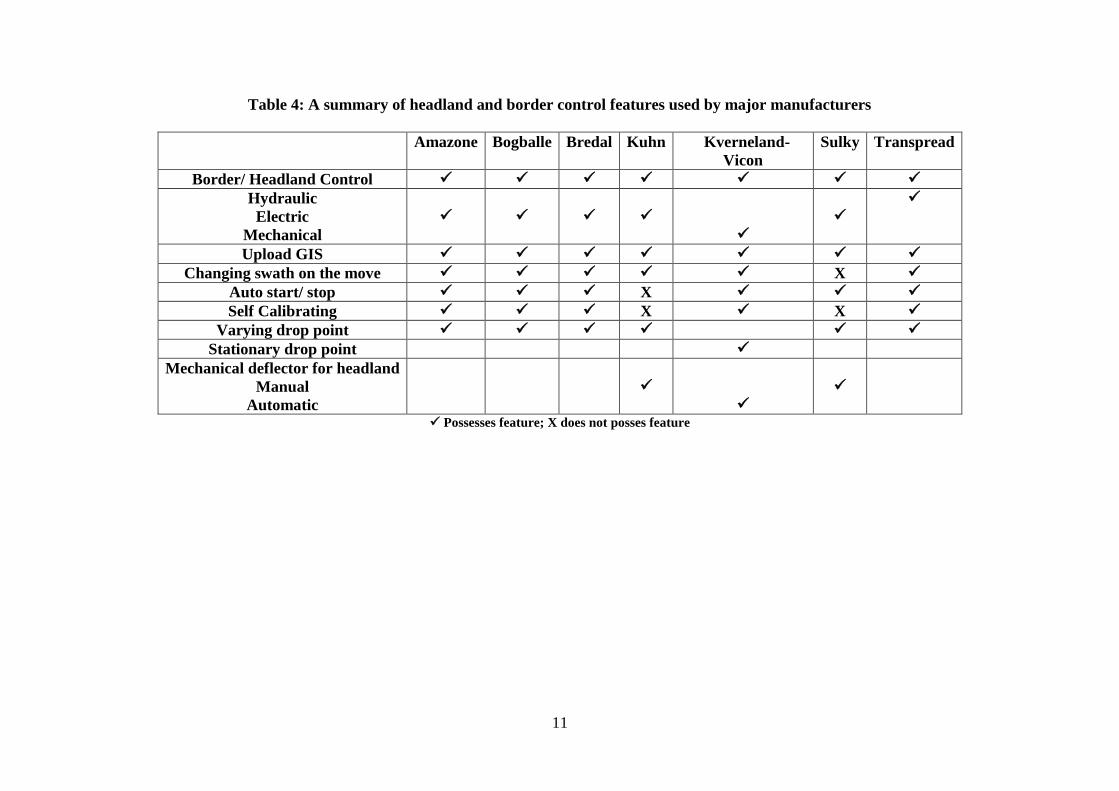
The facilities such as the Cemagref Cemib are also able to produce spread patterns in a wide
range of configurations as in Figure 10. A summary of features available in major European
spreaders may be compared in Table 4.
Figure 10: Shows a spreader test in main and border mode using the CEMAGREF CEMIB device.Piron
et al (2010)
Automated devices such as the Cemagref Cemib will be required in New Zealand if spreaders
are to be thoroughly tested and compared and the best suited used for the range of conditions
found.
11
Table 4: A summary of headland and border control features used by major manufacturers
Amazone Bogballe Bredal Kuhn Kverneland-
Vicon
Sulky Transpread
Border/ Headland Control
Hydraulic
Electric
Mechanical
Upload GIS
Changing swath on the move X
Auto start/ stop X
Self Calibrating X X
Varying drop point
Stationary drop point
Mechanical deflector for headland
Manual
Automatic
Possesses feature; X does not posses feature

12
Conclusion
Over the last twenty years there has been a great deal of work undertaken in improving
ground-spreading technology. Technolgies such as GPS have allowed the field performance
of spreading to be analysed and the true level of performance identified. This has occurred in
conjunction with improvements in GIS measurement and modelling.
It is now possible to measure the effects of spread patterns on field CV. Ground-spreader
manufacturers have improved their technology in a hierarchical manner to address the
sources of in-field CV in order of their contributing importance and this has led to
considerable improvements in spreading accuracy. These improvements have a direct
economic benefit to farmers.
References:
Anon., (2010), Facts and Figures For New Zealand Dairy Farmers, Dairy NZ, Downloaded
from www.dairynz.co.nz , 26 September 2010. Pp 31-33.
Anon, (2011), Dairy Farm Monitoring Report, Ministry of Primary Industries, Downloaded
from www.MPI.govt.nz , 3 February 2013
Anon, (2012), Situation and outlook for Primary Industries, Ministry of Primary Industries,
Downloaded from www.MPI.govt.nz, 2 February 2013.
Ball, P.B., Field, T.R.O., (1982), Response to nitrogen as effected by pasture characteristics,
season and growth management. In: Lynch PB ed. Nitrogen fertilisers in New Zealand
agriculture. Auckland, Ray Richards Publisher. Pp. 45-64.
Fulton, JP, Shearer, SA, Chabra, G, Higgins, SF. 2001, Performance Assessment and Model
Development of a Variable-rate Spinner- Disc Fertiliser Applicator. Trans. ASABE, Vol.
44(5):1071- 1081.
Grafton, MCE, Yule, IJ, Rendle, BW, 2011, A Review of Technologies for Improved
Fertiliser Application Accuracy, In: Adding to the Knowledge Base for the Nutrient
Manager. (Eds L.D. Currie and C.L. Christensen). Occasional Report No. 24. Fertilizer
and Lime Research Centre, Massey University, Palmerston North, New Zealand: ISSN
0112-9902, 7 Pages.
Grift, T.E. and J.W. Hofstee. 2002. Testing an online spread pattern determination sensor on
a broadcast fertilizer spreader. Trans. ASAE 45(3): 561-567..
Horrell, R., Metherell, A.K., Ford, S., Doscher, C., (1999). Fertiliser evenness - losses and
costs: a study on the economic benefits of uniform applications of fertiliser. Proceedings
of the New Zealand Grassland Association 61: 215–220.
Inns, F.M., Reece, A.R., 1962. The theory of the centrifugal distributor II. Motion on the the
disc, off-centre feed. Journal of Agricultural Engineering Research. 7(4):345 – 353.
Jensen, D. and J. Pesek. 1962a. Inefficiency of fertilizer use resulting from nonuniform
spatial distribution. II. Yield losses under selected distribution patterns. Soil Sci. Soc. Am.
Proc. 26(1962): 174-178.
Jensen, D. and J. Pesek. 1962b. Inefficiency of fertilizer use resulting from nonuniform
spatial distribution. III. Fractional segregation in fertilizer materials. Soil Sci. Soc. Am.
Proc. Vol. 26(1962): 178-182.
Lawrence, HG., Yule, IJ., Murray, RI., 2006, Calculating Field CV’s for Centrifugal
Spreaders. G1 – G5. 2nd
International Symposium on Centrifugal Fertiliser Spreading,

13
From Academic to Applied Research. Oct 24 – 25, Cemagref – Pole Epandage
Environment, 03150 , Montoldre, France.
Lawrence, HG, 2007, Adoption of precision agriculture technologies for fertiliser placement
in New Zealand, Unpublished thesis, Massey University.
Lawrence, HG, Yule, IJ, 2007a, Estimation of the In-field variation in Fertiliser Application,
N.Z. Journal of Agriculture Research, Vol. 50: Pp 25-32
Lawrence, HG, Yule, IJ, 2007b, Application Modelling of Ground Based Spreading Vehicles,
(Eds L.D. Currie and L.J. Yates). Occasional Report No. 20. Fertilizer and Lime Research
Centre, Massey University, Palmerston North, New Zealand: ISSN 0112-9902, pp 306 –
311.
Miserque, O. and E. Pirard. 2004. Segregation of the bulk blend fertilizers. Chemometrics
and Intelligent Laboratory Systems. 74(2004): 215-224.
Miserque, O., E. Pirard, Y. Schenkel, O. Mostade, and B. Huyghebaert. 2008. Spreading
segregation of blended fertilizers: Influence of the particle properties. Applied Eng.
inAgric. 24(2): 137-144.
Olieslagers, R., H. Ramon, and J. De Baerdemaeker. 1997. Performance of a continuously
controlled spinning disc spreader for precision application of fertilizer. Precision
Agriculture (Stafford J V, ed), pp 661-668.
Patterson, D. E., & Reece, A. R. 1962. The theory of the centrifugal distributor. I: Motion on
the disc, near-centre feed. Journal of Agricultural Engineering Research, 7(3), 232-240.
Piron, E., Miclet, D., Villette, S., 2010 CEMIB: an innovative bench for spreader eco-design,
Proceedings International Conference on Agricultural Engineering, AgEng2010,
Clermont-Ferrand, France, 6 - 8 September.
Søgaard, HT, Kierkegaard, P, 1994, Yield Reduction Resulting From Uneven Fertilizer
Distribution, Trans. of ASAE, Vol. 37(6), Pp 1749 – 1752.
Tijskens, E.2006. Modelling particle shape in DEM simulations. B1 – B3. 2nd
International
Symposium on Centrifugal Fertiliser Spreading, From Academic to Applied Research. Oct
24 – 25, Cemagref – Pole Epandage Environment, 03150 , Montoldre, France.
Virk, SS., Hall, JB., Mullenix, DK., Sharda, A., Wood,CW., Pate, GL
Fulton, JP., Fasina, OO., McDonald, JP., (2011) Mass and Nutrient Distribution Uniformity
of a Blended Fertilizer Using a Spinner-Spreader Equipped with VRT. ASABE Paper No
1111149. Presented at the ASABE Annual International Meeting, Lousiville, Kentucky,
Aug 7 to 10, 2011.
Yildirim, Y. (2008) Effect of side to side spreader angle on pattern uniformity in single and
twin-disc rotary fertilizer spreaders. Applied Eng. in Agric. Vol 24(2):173-179. .
Yule,I., Pemberton, J. (2009) Spreading Blended Fertilisers. 22nd
Annual FLRC Workshop
In: Nutrient Management in A rapidly changing world. Eds L.D. Currie and C.L.
Christensen). Occasional Report No. 22. Fertiliser and Lime Research Centre, Massey
University, Palmerston North, New Zealand. Pp. 243 – 249.
Yule, IJ, 2011, The Effect of Fertiliser Particle Size on Spread Distribution. In: Adding to the
Knowledge Base for the Nutrient Manager. (Eds L.D. Currie and C.L. Christensen).
Occasional Report No. 24. Fertilizer and Lime Research Centre, Massey University,
Palmerston North, New Zealand: ISSN 0112-9902, 10 pages.