new sensors and unmanned aerial systems for mapping and
TRANSCRIPT

New Sensors and Unmanned Aerial Systems for Mapping and Exploration
Alaska Surveying and Mapping Conference Wednesday, March 26, 2014
ACUASI
ACUASI: Alaska Center for Unmanned Aerial Systems Integration
Anupma Prakash, Jordi Cristobal (hyperspectral sensors) Mike Hatfield, Keith Cunningham, Eyal Saiet, Mike Cook (UAS & sensors)
HyLab: University of Alaska Fairbanks Hyperspectral Imaging Laboratory

Time Plan (1.30-5.30pm) Time Activity
1.30 – 1.45 pm Introductions and organization
1.45 - 2.15 pm Anupma Prakash: Hyperspectral Imaging
2.15 – 2.30 pm Hyperspectral Imaging: Questions and Answers (Q&A)
2.30 – 3.00 pm Mike Hatfield: Unmanned Aerial Systems and Applications
3.00 – 3.30 pm PM Coffee Break
3.30 – 4.50 pm Hands-on activities at 4 stalls (25minutes each)
(1) Mike Cook: Demo of UAS platforms
(2) Jordi Cristobal: Spectral measurements
(3) Eyal Saiet: Elevation information from HighRes data
4.50 – 5.10 pm Keith Cunningham: UAS policies
5.10-5.30 pm Discussions and Question and Answers (Q&A)
At 5.30 pm (optional)
Mike Cook: Tethered UAS flight demo outside
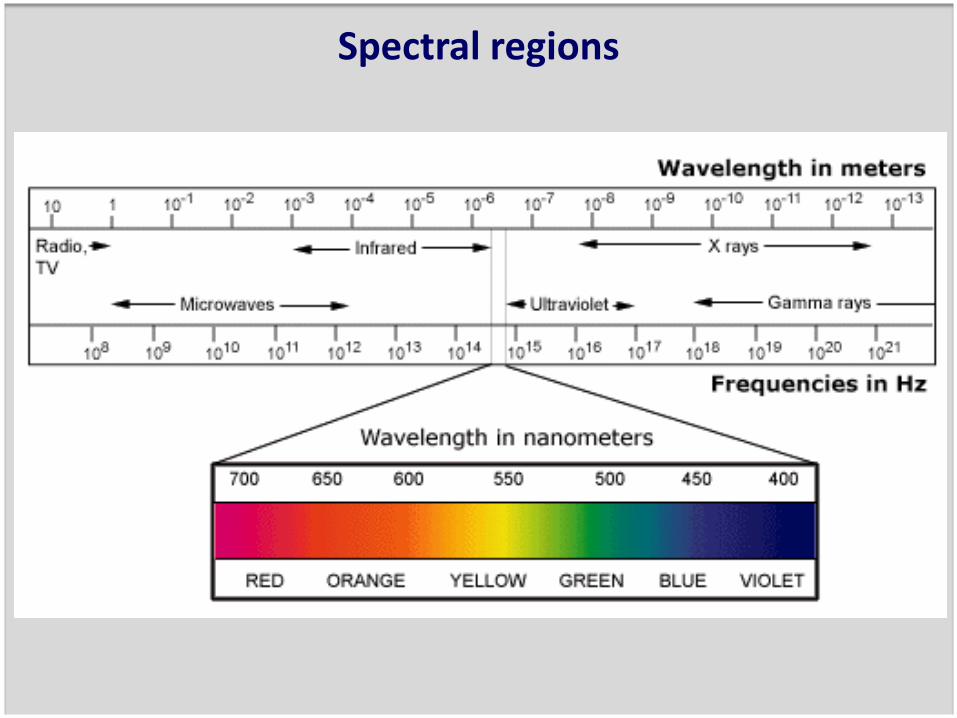
Spectral regions
• We use images acquired in 100s of narrow spectral regions (visible, infrared, thermal portion of the spectrum) to figure out in which parts of the spectrum the target is absorbing energy and where it is reflecting. Source: Green et al., 1998
Source: CALTECH
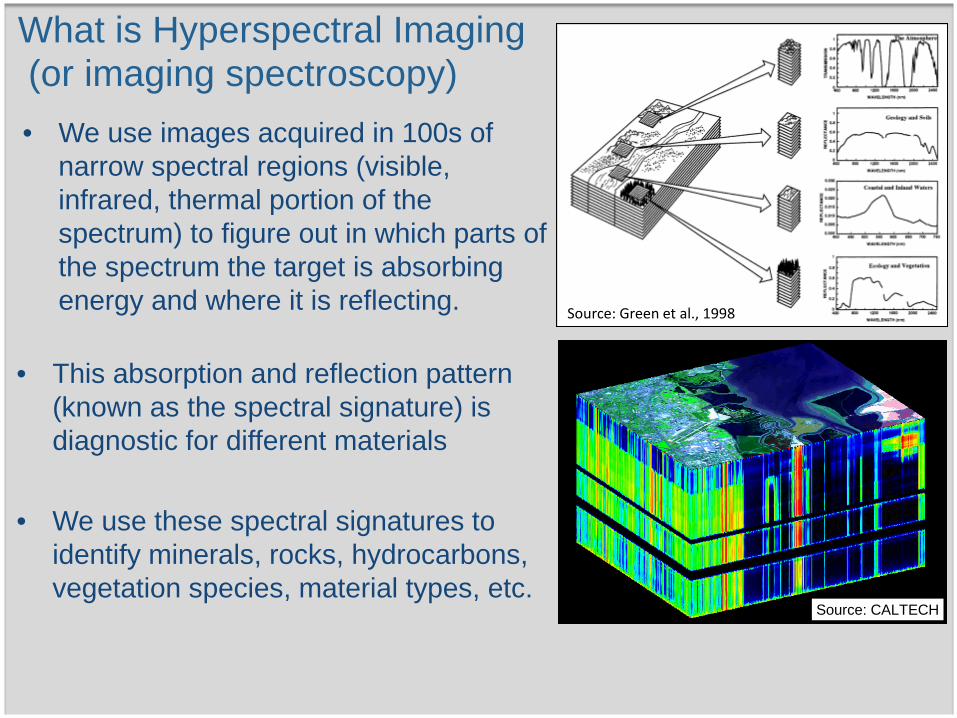
What is Hyperspectral Imaging (or imaging spectroscopy)
• This absorption and reflection pattern
(known as the spectral signature) is diagnostic for different materials
• We use these spectral signatures to identify minerals, rocks, hydrocarbons, vegetation species, material types, etc.

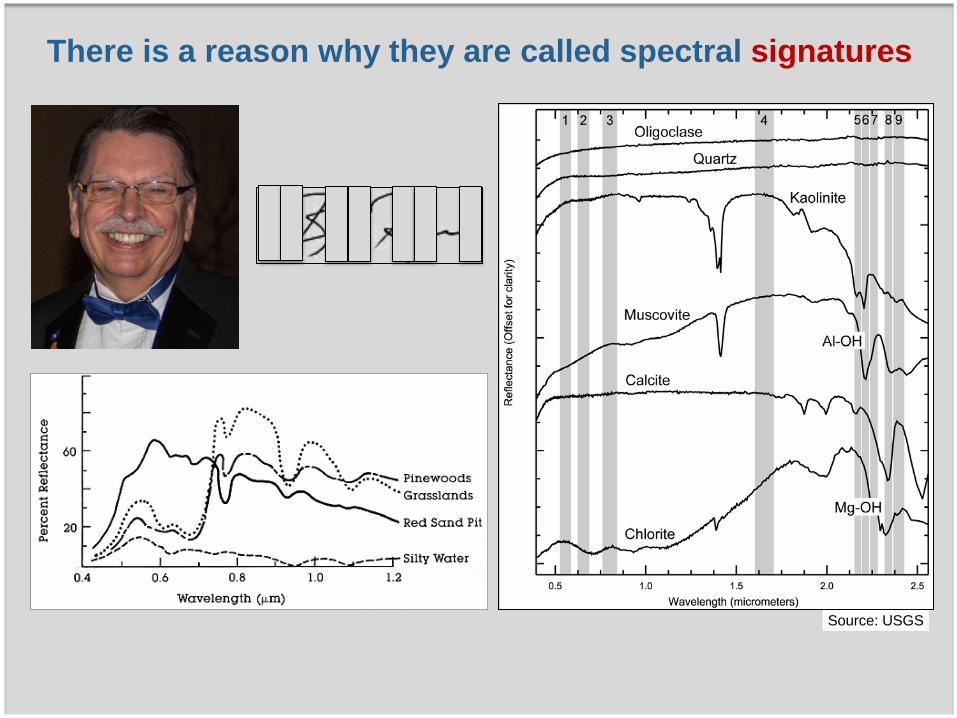
There is a reason why they are called spectral signatures
Source: USGS
There is a reason why they are called spectral signatures
Source: USGS

There is a reason why they are called spectral signatures
Source: USGS
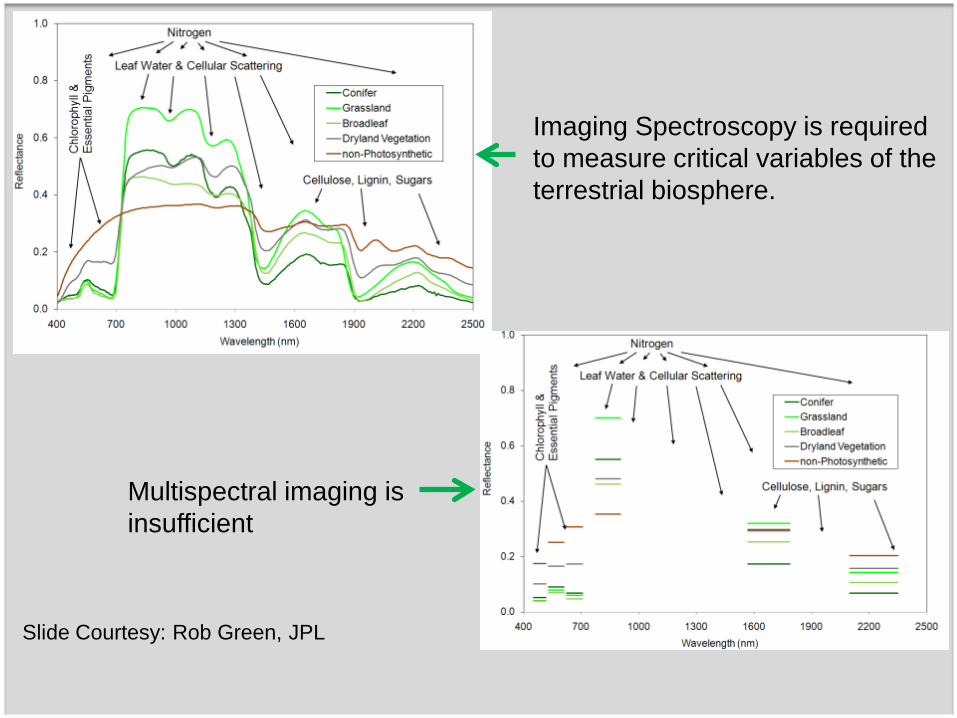
Imaging Spectroscopy is required to measure critical variables of the terrestrial biosphere.
Multispectral imaging is insufficient
Slide Courtesy: Rob Green, JPL

Plant Species Distribution Map
Santa Barbara Front Range: (AVIRIS 07/06/2004; Dar Roberts)
chamise, sagebrush, manzanita, mustard, bigpod ceanothus, redheart ceanothus, grass, coast live oak, scrub oak, California bay, yucca, soil, urban, unclassified
Annual grass, annual herb, Evergreen broadleaf shrub, evergreen broadleaf tree, evergreen needleleaf shrub, evergreen succulent, soil, urban,
Plant Functional Type
Distribution Map

Generalization of hydrocarbon seepage (Yang, 1999)
Source: Google Maps Source: USGS Spectroscopy Lab
Google Maps AVIRIS mineral map

NSF Major Research Instrumentation (MRI) Award
2015 onwards: we will be ready for deployments supporting collaborative research across a range of application areas
hyperspectral.alaska.edu or
hylab.alaska.edu

HySpex System Manufacturer NEO / HySpex Model VNIR-1600 SWIR-384
Spectral range (nm) 400 - 1000 930 - 2500
No of bands 160 288
Radiometric resolution 12 bit 14 bit
Spectral sampling (nm) 3.7 6
Spatial pixels 1600 384
SNR (peak) 250:1 500:1
Dimensions (lwh in cm) 29 x 14 x 36
Approx weight for system (kg) 20
Power consumption (W) 160
Source: Virtual Outcrop Geology group at CIPR
Source: NEO


Calibration
• Full calibration (to NIST standards) performed prior to each flying season at external facilities
• In-house calibration facilities will be used to monitor instrument stability (GI Optical Lab)
• Field calibrations • Support from NEON, JPL,
DLR
Source: NERC

Data Processing
Pre-processing chain used by the DLR OpAiRS facility to convert raw HySpex data to Level 2 georegistered and atmospherically corrected surface radiance and reflectance products (from Bachmann et al., 2012)
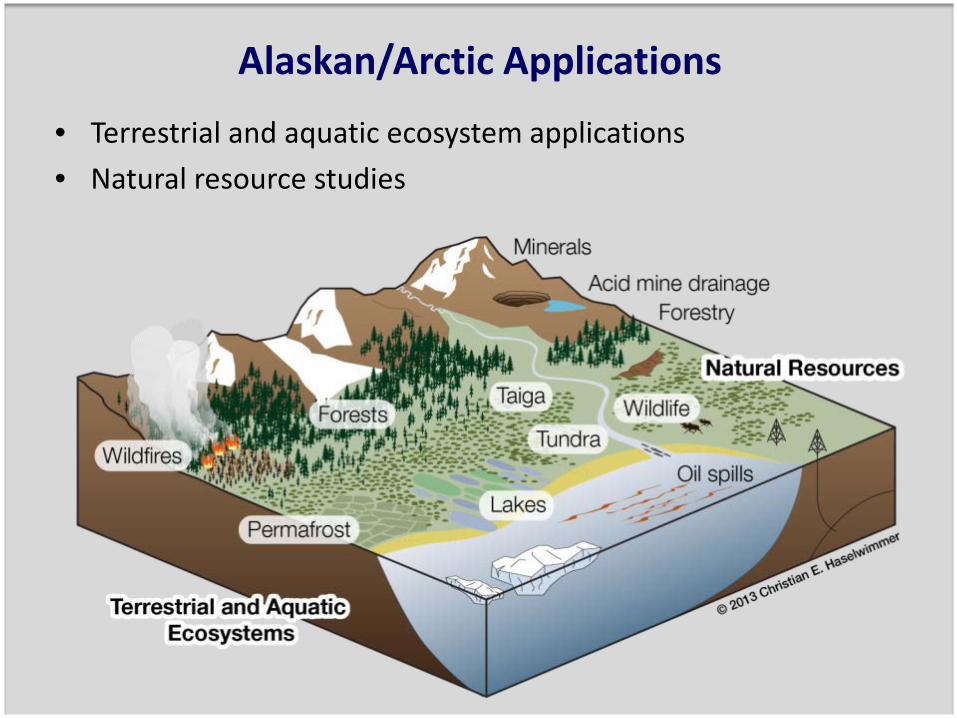
Alaskan/Arctic Applications
• Terrestrial and aquatic ecosystem applications • Natural resource studies

Ecology: Arctic/Boreal Vegetation Change
• Left: Relation between summer temp increase; sea ice decline, and greening of the Arctic. Right: The Toolik Lake region of Alaska, showing greening trends from 1985 to 2007 based on time series of Landsat TM data. Strong greening trends are associated with younger more recently glaciated landscapes. HS data could help unravel some of the causes of the greening patterns. (Credits: Skip Walker and team, UAF).
(Credits: Uma Bhatt and team, UAF).

Source: Panda et al., 2012, Application of multi-source RS and field data to mapping permafrost distribution in Interior Alaska, GIScience and Remote Sensing, 49(3), 346-363.
There is a documented correlation between
surface vegetation and presence / absence of near-
surface permafrost!
Ecology: Permafrost

Evolution of water track to gully to stable incised channel. Water tracks are saturated curvilinear features where flow is confined by the permafrost table
Thermokarst (feature and process) is caused due to thawing of ice-rich ground and is a classic indicator of climate change in permafrost rich areas.
Ecology: Permafrost (Thermokarst / Watertracks)
• In parts of the Arctic (e.g. Imnavait Basin in Alaska), soil temperatures have been warming at a rate of 0.17 °C per year since 1993 [Hinzman et al., 2008].
• Thermokarst features, such as water tracks, are widely prevalent. They are characterized by rough textures, high moisture content, and shrubby vegetation.
• Improved mapping of moist Betula nana, facilitated by HS data, will help map watertracks and thermokarst prone areas. [Trochim et al. 2010]

Ecology: Investigating Arctic/sub-Arctic lakes
• Lakes are a critical component of the northern carbon cycle: thermokarst lake development, carbon sinks, CH4
• Retrieve lake properties, e.g. DOM, Chl, lake depth, substrate
AVIRIS Chl-a retrieval (from Lunetta et al., 2009)
Lakes on the North Slope, Alaska (from Hinkel et al., 2012)

Ecology: Evapotranspiration Mapping
• ET mapping requires scaling from plot to satellite scales. Models require image based LST, LAI (or a proxy), and LC dependent clumping factor.
• Airborne HS data will allow upscaling, providing intermediate scale between field and MODIS scale. It will aid characterizing vegetation (especially differentiating the contribution of canopy and underlying mosses – huge issue in ET retrieval in high latitudes!)
Imnavait Creek
Flux in W/m2
700
600
500
400
300
200
100
0
www.et.alaska.edu

Ecology: Evapotranspiration Mapping
Image credits: Jordi Cristóbal
Two flux towers covering the most important sub-Arctic habitats in Alaska: black spruce (University of Alaska Fairbanks, UAF) and paper birch (Caribou Poker Creek Research Watershed, CPCRW)

A = Net radiation, 4 comp (Hukseflux) B = 3D Sonic anemometer (Campbell) C = Ultrasonic anemometer (RM Young) D = Gas analyzer (Campbell) E = Air temperature sensors (Campbell) F = EC processing unit (Campbell) G = Solar panel - 130W H = Data logger (Campbell) I = Barometric pressure (Vaisala) J = Air temperature and RH (Vaisala)
Image credits: Jordi Cristóbal
A
B
C
D
E
F
G
H
N
I
C
24 m
12 m
3 m
J
J
E
Soil temperature sensor
Soil moisture sensor
Soil heat flux plate
13-16 cm
10 cm
1 m
Organic layer
Soil layer
~40 cm
2cm
6cm
2cm
2cm
6cm
2cm
~40 cm
4 cm
4 cm

7-17-04, 21:42 UTC, Boundary fire; Credits: Chris Waigl, UAF
MO
DIS
band
22
(3.9
6 μm
)
MO
DIS
band
31
(11.
03 μ
m)
Ecology: Boreal Forest Fires
• Boreal forest fires are extensive and can have flaming fronts with temperatures over 1000K, providing opportunities for temperature retrievals from Hyspex SWIR channels.

Arctic oil spills • UAF building Arctic Center
for Oil-Spill Research and Education (A-CORE)
• Investigate potential of HS remote sensing for oil spill mapping in Arctic environments
AVIRIS oil spill mapping results from
Gulf oil spill (from Clark et al., 2010)
Manifestations of oil spills in ice-covered waters
Experimental oil spills at CRREL facility

Habitat mapping / Future sensor
Image Source: National Park Service: Award No. H991080028: “Assessing Tide Water Glacial Ice Availability for Harbor Seals in Glacier Bay National Park and Preserve, Alaska”. (NPS PI: Jamie Womble; UAF PI: Anupma Prakash). August, 2013. All rights reserved.

Questions ?