new route forecasting process alex heiteraviation.itu.edu.tr/img/aviation/datafiles/lecture...
TRANSCRIPT
New Route Forecasting Process Alex Heiter
Network, Fleet and Schedule
Strategic Planning
Module 21: 4 April 2015
Istanbul Technical University
Air Transportation Management
M.Sc. Program
2
Lecture Outline
How does Boeing select & forecast new markets?
Boeing data & tools
Methodology & Process
Examples
3
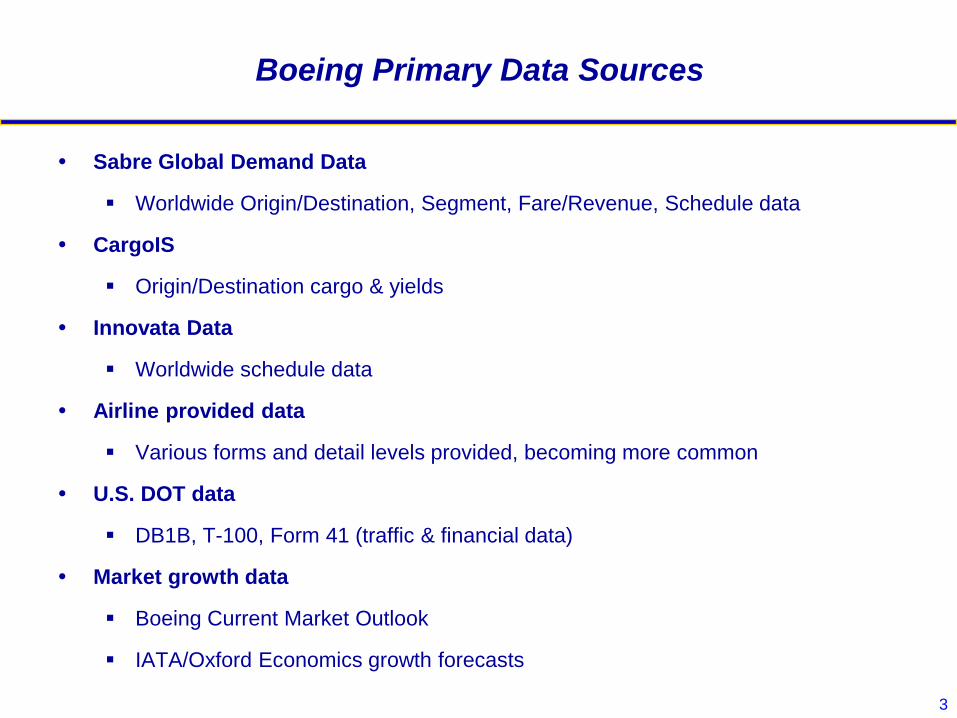
Boeing Primary Data Sources
Sabre Global Demand Data
Worldwide Origin/Destination, Segment, Fare/Revenue, Schedule data
CargoIS
Origin/Destination cargo & yields
Innovata Data
Worldwide schedule data
Airline provided data
Various forms and detail levels provided, becoming more common
U.S. DOT data
DB1B, T-100, Form 41 (traffic & financial data)
Market growth data
Boeing Current Market Outlook
IATA/Oxford Economics growth forecasts
4
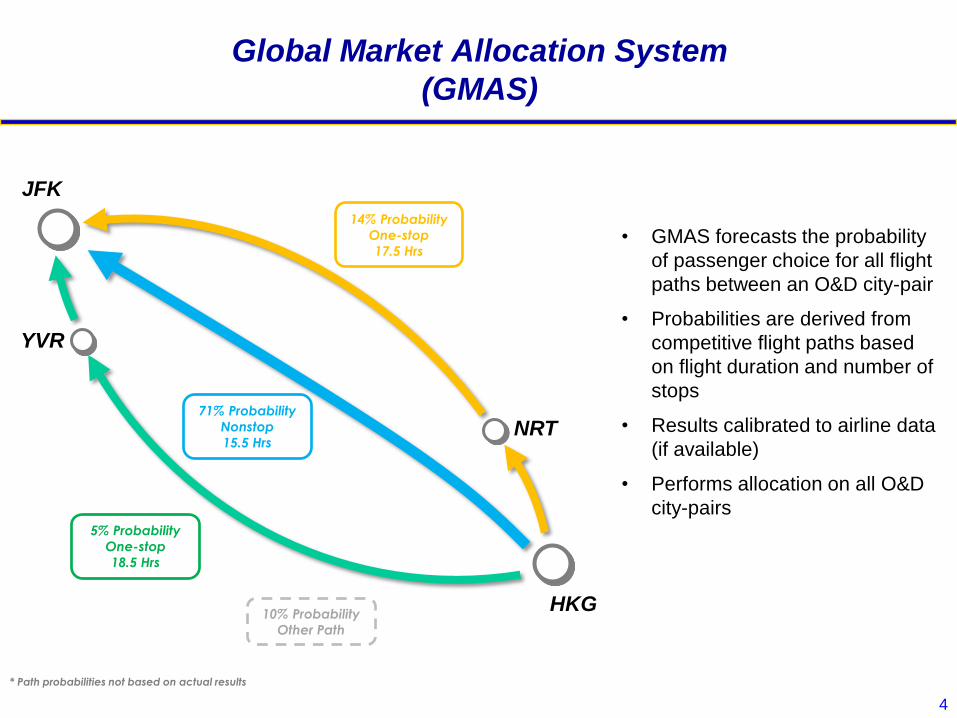
Global Market Allocation System
(GMAS)
HKG
JFK
NRT
YVR
71% Probability
Nonstop
15.5 Hrs
14% Probability
One-stop
17.5 Hrs
5% Probability
One-stop
18.5 Hrs
• GMAS forecasts the probability
of passenger choice for all flight
paths between an O&D city-pair
• Probabilities are derived from
competitive flight paths based
on flight duration and number of
stops
• Results calibrated to airline data
(if available)
• Performs allocation on all O&D
city-pairs
10% Probability
Other Path
* Path probabilities not based on actual results
5
Boeing Primary Data Sources
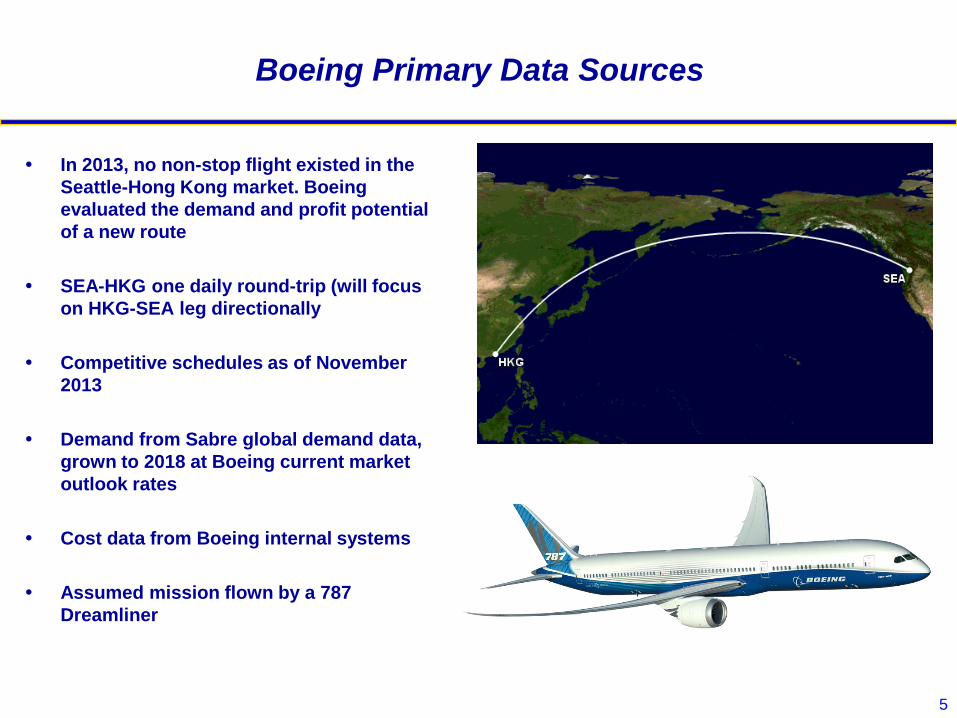
In 2013, no non-stop flight existed in the
Seattle-Hong Kong market. Boeing
evaluated the demand and profit potential
of a new route
SEA-HKG one daily round-trip (will focus
on HKG-SEA leg directionally
Competitive schedules as of November
2013
Demand from Sabre global demand data,
grown to 2018 at Boeing current market
outlook rates
Cost data from Boeing internal systems
Assumed mission flown by a 787
Dreamliner

6
New market forecasting steps
Step #1: Determining flight schedules to evaluate in the choice model
Step #2: Evaluating choice model results and selecting best flight schedule scenario
Step #3: Apply stimulation and other demand adjustments based on real world knowledge
Step #4: Utilize spill modeling to apply unconstrained demand to a constrained flight
Step #5: Evaluate and refine revenue results by cabin and for cargo
Step #6: Allocate fixed and variable costs to both the airplane operation and passengers
Step #7: Calculate flight profitability and adjust as necessary to refine analysis
7
Step 1: Flight Scheduling
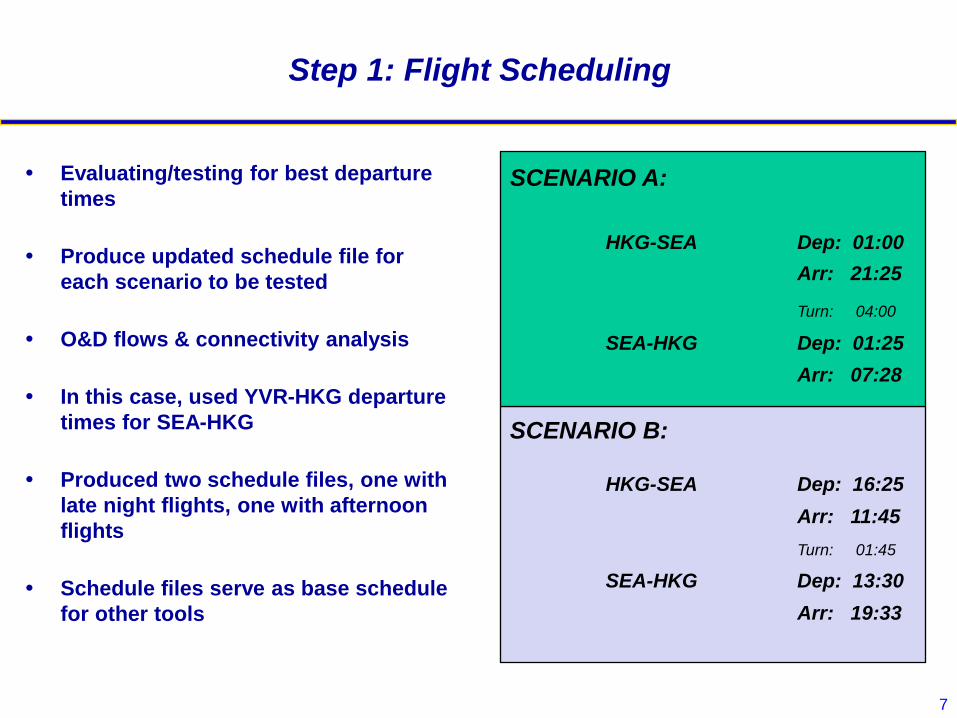
Evaluating/testing for best departure
times
Produce updated schedule file for
each scenario to be tested
O&D flows & connectivity analysis
In this case, used YVR-HKG departure
times for SEA-HKG
Produced two schedule files, one with
late night flights, one with afternoon
flights
Schedule files serve as base schedule
for other tools
SCENARIO A:
HKG-SEA Dep: 01:00
Arr: 21:25
Turn: 04:00
SEA-HKG Dep: 01:25
Arr: 07:28
SCENARIO B:
HKG-SEA Dep: 16:25
Arr: 11:45
Turn: 01:45
SEA-HKG Dep: 13:30
Arr: 19:33
8
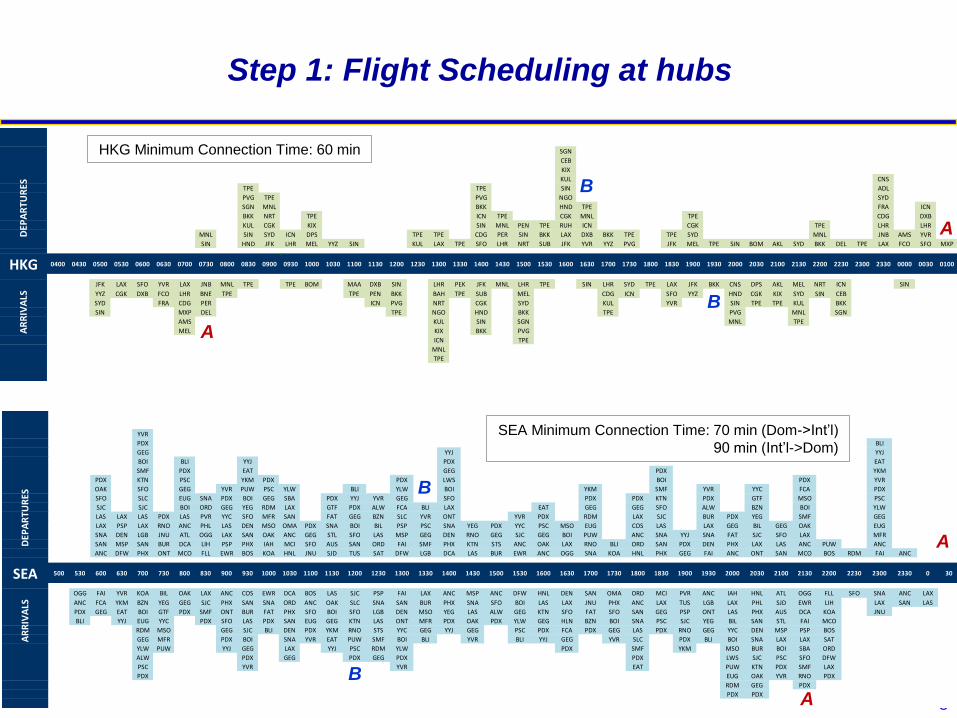
Step 1: Flight Scheduling at hubs
SGN
CEB
KIX
KUL CNS
TPE TPE SIN ADL
PVG TPE PVG NGO SYD
SGN MNL BKK HND TPE FRA ICN
BKK NRT TPE ICN TPE CGK MNL TPE CDG DXB
KUL CGK KIX SIN MNL PEN TPE RUH ICN CGK TPE LHR LHR
MNL SIN SYD ICN DPS TPE TPE CDG PER SIN BKK LAX DXB BKK TPE TPE SYD MNL JNB AMS YVR
SIN HND JFK LHR MEL YYZ SIN KUL LAX TPE SFO LHR NRT SUB JFK YVR YYZ PVG JFK MEL TPE SIN BOM AKL SYD BKK DEL TPE LAX FCO SFO MXP
HKG 0400 0430 0500 0530 0600 0630 0700 0730 0800 0830 0900 0930 1000 1030 1100 1130 1200 1230 1300 1330 1400 1430 1500 1530 1600 1630 1700 1730 1800 1830 1900 1930 2000 2030 2100 2130 2200 2230 2300 2330 0000 0030 0100
JFK LAX SFO YVR LAX JNB MNL TPE TPE BOM MAA DXB SIN LHR PEK JFK MNL LHR TPE SIN LHR SYD TPE LAX JFK BKK CNS DPS AKL MEL NRT ICN SIN
YYZ CGK DXB FCO LHR BNE TPE TPE PEN BKK BAH TPE SUB MEL CDG ICN SFO YYZ HND CGK KIX SYD SIN CEB
SYD FRA CDG PER ICN PVG NRT CGK SYD KUL YVR SIN TPE TPE KUL BKK
SIN MXP DEL TPE NGO HND BKK TPE PVG MNL SGN
AMS KUL SIN SGN MNL TPE
MEL KIX BKK PVG
ICN TPE
MNL
TPE
DEP
AR
TUR
ESA
RR
IVA
LS
A
A
B
B
YVR
PDX BLI
GEG YYJ YYJ
BOI BLI YYJ PDX EAT
SMF PDX EAT GEG PDX YKM
PDX KTN PSC YKM PDX PDX LWS BOI PDX YVR
OAK SFO GEG YVR PUW PSC YLW BLI YLW BOI YKM SMF YVR YYC FCA PDX
SFO SLC EUG SNA PDX BOI GEG SBA PDX YYJ YVR GEG SFO PDX PDX KTN PDX GTF MSO PSC
SJC SJC BOI ORD GEG YEG RDM LAX GTF PDX ALW FCA BLI LAX EAT GEG GEG SFO ALW BZN BOI YLW
LAS LAX LAS PDX LAS PVR YYC SFO MFR SAN FAT GEG BZN SLC YVR ONT YVR PDX RDM LAX SJC BUR PDX YEG SMF GEG
LAX PSP LAX RNO ANC PHL LAS DEN MSO OMA PDX SNA BOI BIL PSP PSC SNA YEG PDX YYC PSC MSO EUG COS LAS LAX GEG BIL GEG OAK EUG
SNA DEN LGB JNU ATL OGG LAX SAN OAK ANC GEG STL SFO LAS MSP GEG DEN RNO GEG SJC GEG BOI PUW ANC SNA YYJ SNA FAT SJC SFO LAX MFR
SAN MSP SAN BUR DCA LIH PSP PHX IAH MCI SFO AUS SAN ORD FAI SMF PHX KTN STS ANC OAK LAX RNO BLI ORD SAN PDX DEN PHX LAX LAS ANC PUW ANC
ANC DFW PHX ONT MCO FLL EWR BOS KOA HNL JNU SJD TUS SAT DFW LGB DCA LAS BUR EWR ANC OGG SNA KOA HNL PHX GEG FAI ANC ONT SAN MCO BOS RDM FAI ANC
SEA 500 530 600 630 700 730 800 830 900 930 1000 1030 1100 1130 1200 1230 1300 1330 1400 1430 1500 1530 1600 1630 1700 1730 1800 1830 1900 1930 2000 2030 2100 2130 2200 2230 2300 2330 0 30
OGG FAI YVR KOA BIL OAK LAX ANC COS EWR DCA BOS LAS SJC PSP FAI LAX ANC MSP ANC DFW HNL DEN SAN OMA ORD MCI PVR ANC IAH HNL ATL OGG FLL SFO SNA ANC LAX
ANC FCA YKM BZN YEG GEG SJC PHX SAN SNA ORD ANC OAK SLC SNA SAN BUR PHX SNA SFO BOI LAS LAX JNU PHX ANC LAX TUS LGB LAX PHL SJD EWR LIH LAX SAN LAS
PDX GEG EAT BOI GTF PDX SMF ONT BUR FAT PHX SFO BOI SFO LGB DEN MSO YEG LAS ALW GEG KTN SFO FAT SFO SAN GEG PSP ONT LAS PHX AUS DCA KOA JNU
BLI YYJ EUG YYC PDX SFO LAS PDX SAN EUG GEG KTN LAS ONT MFR PDX OAK PDX YLW GEG HLN BZN BOI SNA PSC SJC YEG BIL SAN STL FAI MCO
RDM MSO GEG SJC BLI DEN PDX YKM RNO STS YYC GEG YYJ GEG PSC PDX FCA PDX GEG LAS PDX RNO GEG YYC DEN MSP PSP BOS
GEG MFR PDX BOI SNA YVR EAT PUW SMF BOI BLI YVR BLI YYJ GEG YVR SLC PDX BLI BOI SNA LAX LAX SAT
YLW PUW YYJ GEG LAX YYJ PSC RDM YLW PDX SMF YKM MSO BUR BOI SBA ORD
ALW PDX GEG PDX GEG PDX PDX LWS SJC PSC SFO DFW
PSC YVR YVR EAT PUW KTN PDX SMF LAX
PDX EUG OAK YVR RNO PDX
RDM GEG PDX
PDX PDX
DEP
AR
TUR
ESA
RR
IVA
LS
A
A
B
B
HKG Minimum Connection Time: 60 min
SEA Minimum Connection Time: 70 min (Dom->Int’l)
90 min (Int’l->Dom)

9
Step 2: Choice Modeling
GMAS (Logit based) is Boeing choice model
Growth rates determined in each O & D by Boeing Current Market Outlook (airline provided growth rates can also be used)
Path probability calculated, then unconstrained demand for all flights worldwide apportioned
Case: SEAHKG_Afternoon_Growth
(Report 1) UnConstrained Leg Flight Summary Leg AL Flt # EQ Seats DOW Dept Arrl GCM Dmd Loc Dmd Flow Dmd Leg Rev Loc Rev Flow Rev Leg Rev Online Rev Network Rev Offline Fare Loc Fare Flow Fare Leg LF % Spill
HKGSEA XX 2701 787 276 1 1625 1251 6484 62.2 310 372.3 79,254 269,573 348,828 58,029 406,857 29,344 1,273.38 869.49 937.02 134.90% 96
HKGSEA XX 2701 787 276 2 1625 1251 6484 62.7 210.2 272.9 79,580 171,152 250,732 27,866 278,598 20,266 1,270.06 814.24 918.91 98.90% 0
HKGSEA XX 2701 787 276 3 1625 1251 6484 60.2 184 244.2 77,697 157,497 235,193 32,862 268,056 15,222 1,289.89 856.07 963.07 88.50% 0
HKGSEA XX 2701 787 276 4 1625 1251 6484 62.6 283 345.5 79,677 237,291 316,968 42,669 359,637 26,293 1,273.37 838.55 917.28 125.20% 70
HKGSEA XX 2701 787 276 5 1625 1251 6484 62.4 188.8 251.2 79,393 176,354 255,746 45,141 300,888 16,870 1,271.96 933.96 1,017.93 91.00% 0
HKGSEA XX 2701 787 276 6 1625 1251 6484 60.2 229.8 290 77,697 179,080 256,776 32,777 289,553 21,067 1,289.89 779.4 885.43 105.10% 14
HKGSEA XX 2701 787 276 7 1625 1251 6484 60.2 196.3 256.6 77,697 178,316 256,013 48,654 304,667 17,538 1,289.89 908.19 997.8 93.00% 0
SEAHKG XX 2702 787 276 1 1330 1933 6484 54.2 208.3 262.6 68,084 179,368 247,452 10,126 257,578 28,442 1,255.75 860.9 942.44 95.10% 0
SEAHKG XX 2702 787 276 2 1330 1933 6484 56.5 255.9 312.4 69,979 218,417 288,396 17,807 306,203 30,049 1,239.54 853.36 923.15 113.20% 36
SEAHKG XX 2702 787 276 3 1330 1933 6484 54.2 206.9 261.1 68,084 183,102 251,186 16,826 268,012 26,228 1,255.75 885.01 961.99 94.60% 0
SEAHKG XX 2702 787 276 4 1330 1933 6484 54.2 221.2 275.4 68,084 188,388 256,472 15,383 271,855 26,951 1,255.75 851.62 931.17 99.80% 0
SEAHKG XX 2702 787 276 5 1330 1933 6484 56.5 251.2 307.6 69,979 225,940 295,920 23,533 319,452 31,865 1,239.54 899.51 961.91 111.50% 32
SEAHKG XX 2702 787 276 6 1330 1933 6484 54.3 232.7 287 68,149 208,539 276,689 24,226 300,914 32,333 1,254.95 896.36 964.22 104.00% 11
SEAHKG XX 2702 787 276 7 1330 1933 6484 54.2 199.8 254 68,084 172,258 240,342 11,028 251,370 25,404 1,255.75 862.17 946.18 92.00% 0
Path probability is function of multiple factors (betas) including time of day preference, business/leisure, price sensitivity, etc.
Connections determined by shortest total travel time
Test schedules imported to GMAS from ODSE, competitive schedules from OAG

10
Step 2: Choice Modeling
Origin & Destination (O&D) traffic can be evaluated in the choice
model to better understand connectivity and competitiveness
Case: SEAHKG_Afternoon_Growth
(Report 2) UnConstrained Leg Flight Allocation By OD Leg AL Flt # EQ Seats DOW Dept Arrl GCM Dmd Loc Dmd Leg Rev Loc Rev Leg Rev Network Leg RPM Yld True OD Type OD Dmd Leg OD Rev Leg OD RPM Yld OD NetRev OD Offline
HKGSEA XX 2701 787 276 1 1625 1251 6484 62.2 372.3 79,254 348,828 406,857 14.45 HKGSEA LOCAL 62.24 79,254 19.64 79,254 0
SGNSEA BEFORE 39.39 25,499 9.98 29,265 1,710
MNLSEA BEFORE 22.95 13,330 8.96 15,608 150
CGKSEA BEFORE 20.83 23,869 17.67 30,870 2,159
TPESEA BEFORE 18.97 17,479 14.21 19,649 437
PNHSEA BEFORE 14.87 8,185 8.49 8,185 1,646
HYDSEA BEFORE 14.63 13,830 14.58 19,391 0
BKKSEA BEFORE 14 10,029 11.05 12,038 206
HKGPDX BEYOND 8.2 10,614 19.97 10,614 681
MAASEA BEFORE 8.01 6,467 12.45 9,197 0
KULSEA BEFORE 7.35 9,251 19.42 11,777 428
BKKYEG FLOW 6.96 5,187 11.5 6,328 730
SGNPDX FLOW 6.04 3,421 8.74 4,155 219
HKGYEG BEYOND 5.86 6,489 17.07 6,489 913
DELSEA BEFORE 5.84 2,763 7.3 3,496 432
HKGLAX BEYOND 5.82 3,709 9.83 3,709 790
BLRSEA BEFORE 5.75 5,580 14.96 5,580 2,468
CCUSEA BEFORE 5.46 4,783 13.52 4,783 1,475
BOMSEA BEFORE 4.87 4,700 14.89 6,652 0
SINSEA BEFORE 4.47 4,102 14.14 5,400 0
HANSEA BEFORE 4.45 3,971 13.75 3,971 586
KTMSEA BEFORE 4.29 4,028 14.49 4,028 1,377
SGNYEG FLOW 4.12 3,514 13.16 4,268 495
MELSEA BEFORE 3.7 5,647 23.56 9,924 0
PERSEA BEFORE 2.84 5,558 30.19 9,023 0
HKGYVR BEYOND 2.71 1,657 9.43 1,657 111
11
Step 2: Choice Modeling
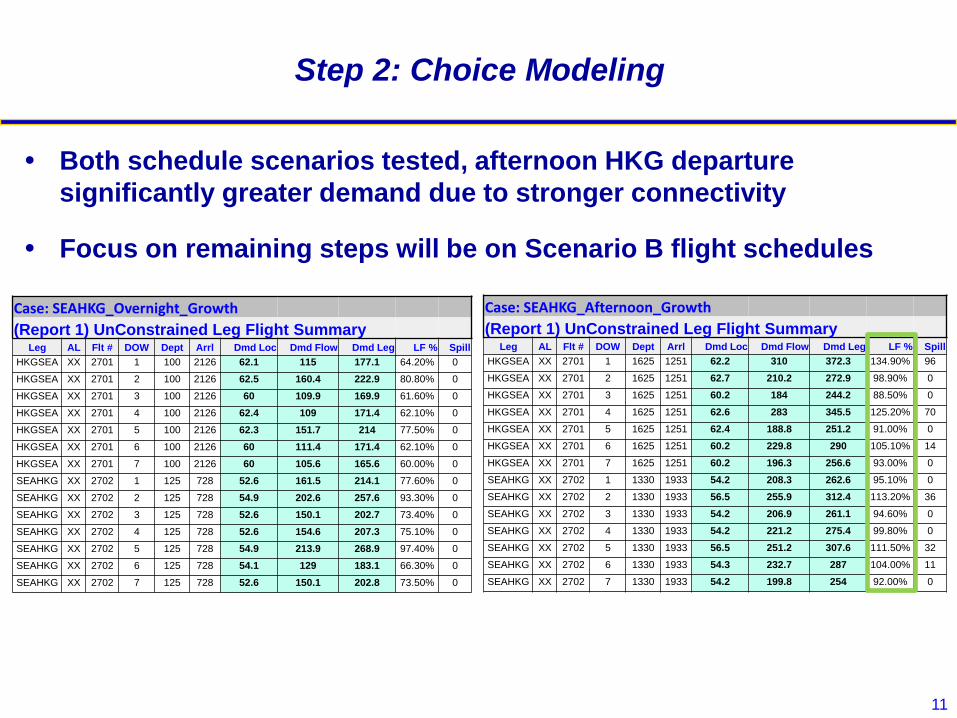
Both schedule scenarios tested, afternoon HKG departure
significantly greater demand due to stronger connectivity
Focus on remaining steps will be on Scenario B flight schedules
Case: SEAHKG_Overnight_Growth
(Report 1) UnConstrained Leg Flight Summary Leg AL Flt # DOW Dept Arrl Dmd Loc Dmd Flow Dmd Leg LF % Spill
HKGSEA XX 2701 1 100 2126 62.1 115 177.1 64.20% 0
HKGSEA XX 2701 2 100 2126 62.5 160.4 222.9 80.80% 0
HKGSEA XX 2701 3 100 2126 60 109.9 169.9 61.60% 0
HKGSEA XX 2701 4 100 2126 62.4 109 171.4 62.10% 0
HKGSEA XX 2701 5 100 2126 62.3 151.7 214 77.50% 0
HKGSEA XX 2701 6 100 2126 60 111.4 171.4 62.10% 0
HKGSEA XX 2701 7 100 2126 60 105.6 165.6 60.00% 0
SEAHKG XX 2702 1 125 728 52.6 161.5 214.1 77.60% 0
SEAHKG XX 2702 2 125 728 54.9 202.6 257.6 93.30% 0
SEAHKG XX 2702 3 125 728 52.6 150.1 202.7 73.40% 0
SEAHKG XX 2702 4 125 728 52.6 154.6 207.3 75.10% 0
SEAHKG XX 2702 5 125 728 54.9 213.9 268.9 97.40% 0
SEAHKG XX 2702 6 125 728 54.1 129 183.1 66.30% 0
SEAHKG XX 2702 7 125 728 52.6 150.1 202.8 73.50% 0
Case: SEAHKG_Afternoon_Growth
(Report 1) UnConstrained Leg Flight Summary Leg AL Flt # DOW Dept Arrl Dmd Loc Dmd Flow Dmd Leg LF % Spill
HKGSEA XX 2701 1 1625 1251 62.2 310 372.3 134.90% 96
HKGSEA XX 2701 2 1625 1251 62.7 210.2 272.9 98.90% 0
HKGSEA XX 2701 3 1625 1251 60.2 184 244.2 88.50% 0
HKGSEA XX 2701 4 1625 1251 62.6 283 345.5 125.20% 70
HKGSEA XX 2701 5 1625 1251 62.4 188.8 251.2 91.00% 0
HKGSEA XX 2701 6 1625 1251 60.2 229.8 290 105.10% 14
HKGSEA XX 2701 7 1625 1251 60.2 196.3 256.6 93.00% 0
SEAHKG XX 2702 1 1330 1933 54.2 208.3 262.6 95.10% 0
SEAHKG XX 2702 2 1330 1933 56.5 255.9 312.4 113.20% 36
SEAHKG XX 2702 3 1330 1933 54.2 206.9 261.1 94.60% 0
SEAHKG XX 2702 4 1330 1933 54.2 221.2 275.4 99.80% 0
SEAHKG XX 2702 5 1330 1933 56.5 251.2 307.6 111.50% 32
SEAHKG XX 2702 6 1330 1933 54.3 232.7 287 104.00% 11
SEAHKG XX 2702 7 1330 1933 54.2 199.8 254 92.00% 0

12
Step 3: Stimulation & adjustment
Stimulation of local O&D for new
nonstop service
Proxy markets and/or stimulation
curves used as a guide
Sanity check connectivity
(remove unreasonable or
circuitous connections)
Other adjustments based upon
market specific or airline specific
knowledge
In this case, no stimulation
assumed due to extensive
existing Asia service from SEA
and to create more conservative
forecast

13
Step 4: Spill model (by class)
Use of Boeing spill model to
determine on-board loads (by
class)
Spill by class to account for
different variability in each class
of service (higher k-cyclic in
premium classes)
Spill can be done on an individual
flight, or a set of flights
Studies based on airline data
shows economy k-cyclic between
.28 and .32, business k-cyclic
between .35 and .40
Capacity used for spill typically
adjusted for performance
(payload range, blocked seats)
Unconstrained Demand
Day First Business Economy Total
1 4 53 313 370
2 3 38 233 274
3 2 34 212 248
4 3 48 291 342
5 2 35 215 252
6 3 39 248 290
7 2 36 223 261
787 Seats 0 40 236 276
Constrained Demand
Day First Business Economy Total
1 0 36 223 259
2 0 32 205 237
3 0 31 195 226
4 0 35 220 255
5 0 31 197 228
6 0 33 210 243
7 0 32 200 232
Spill Results by Class:
HKG-SEA Afternoon flight, Bus K-Cyclic: 0.35, Econ K-Cyclic: 0.30

14
Step 5: Revenue (by class)
Revenue can come from multiple
sources:
GMAS (straight mileage proration,
equal fares for all carriers)
Sabre (proxy market)
GMAS uses actual on-board O&D
determined in path probability to
determine average fares
“Real world” fares via Sabre may be
applied to account for competitive,
fare mix and stimulation effects
Cargo revenue determined based on
available payload after pax,
multiplied by yield provided by
airline or external sources (not
considered in this analysis)
Average Fares
Day First Business Economy Total
1 $4,860 $2,608 $607 $887
2 $4,798 $2,575 $612 $880
3 $5,082 $2,727 $635 $919
4 $4,780 $2,565 $603 $875
5 $5,292 $2,839 $664 $961
6 $4,666 $2,504 $592 $851
7 $5,222 $2,802 $655 $947
Revenue
Day First Business Economy Total
1 $0 $94,473 $135,296 $229,770
2 $0 $83,582 $125,145 $208,728
3 $0 $83,390 $123,756 $207,147
4 $0 $90,759 $132,549 $223,308
5 $0 $88,302 $130,447 $218,749
6 $0 $82,267 $124,244 $206,511
7 $0 $88,496 $131,233 $219,729
Revenue Results by Class:
HKG-SEA Afternoon flight, Bus K-Cyclic: 0.35, Econ K-Cyclic: 0.30
15
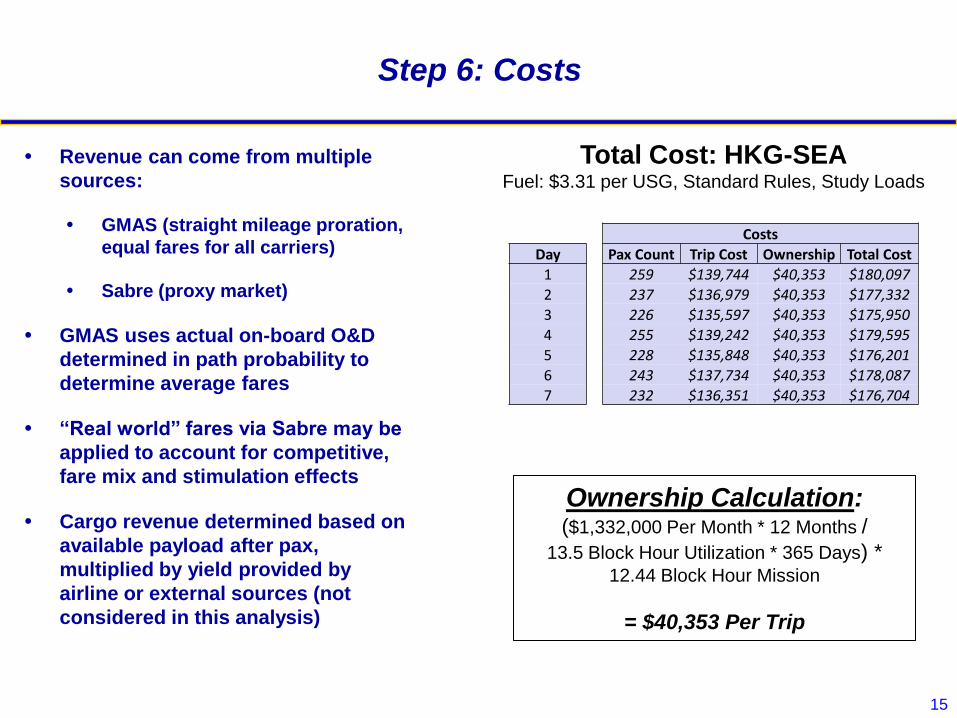
Step 6: Costs
Revenue can come from multiple
sources:
GMAS (straight mileage proration,
equal fares for all carriers)
Sabre (proxy market)
GMAS uses actual on-board O&D
determined in path probability to
determine average fares
“Real world” fares via Sabre may be
applied to account for competitive,
fare mix and stimulation effects
Cargo revenue determined based on
available payload after pax,
multiplied by yield provided by
airline or external sources (not
considered in this analysis)
Total Cost: HKG-SEA Fuel: $3.31 per USG, Standard Rules, Study Loads
Costs
Day Pax Count Trip Cost Ownership Total Cost
1 259 $139,744 $40,353 $180,097
2 237 $136,979 $40,353 $177,332
3 226 $135,597 $40,353 $175,950
4 255 $139,242 $40,353 $179,595
5 228 $135,848 $40,353 $176,201
6 243 $137,734 $40,353 $178,087
7 232 $136,351 $40,353 $176,704
Ownership Calculation: ($1,332,000 Per Month * 12 Months /
13.5 Block Hour Utilization * 365 Days) * 12.44 Block Hour Mission
= $40,353 Per Trip
16
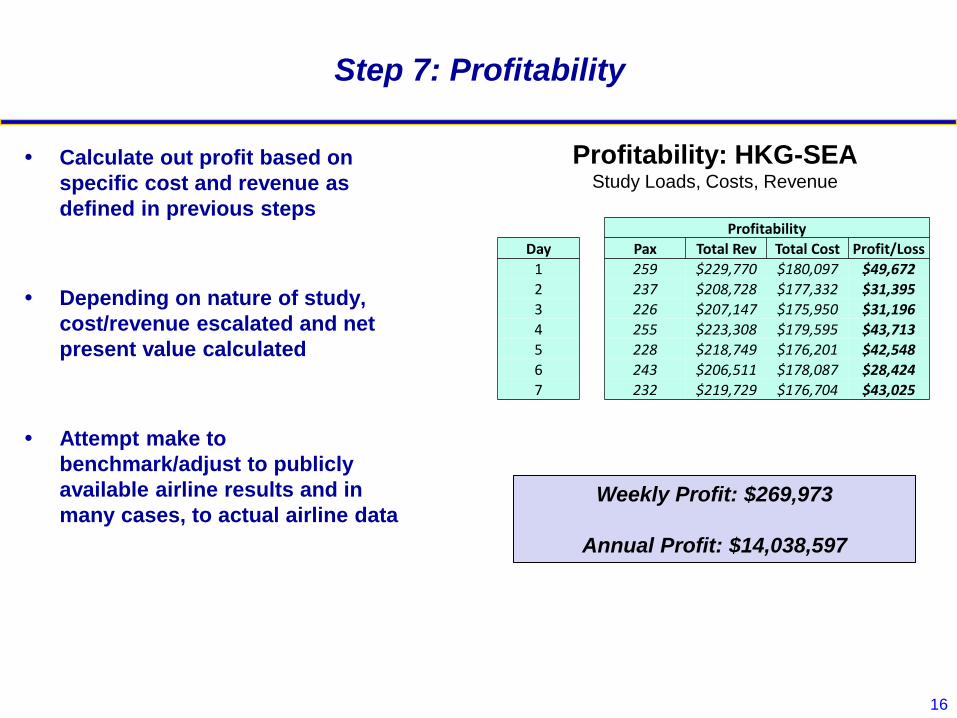
Step 7: Profitability
Calculate out profit based on
specific cost and revenue as
defined in previous steps
Depending on nature of study,
cost/revenue escalated and net
present value calculated
Attempt make to
benchmark/adjust to publicly
available airline results and in
many cases, to actual airline data
Profitability: HKG-SEA Study Loads, Costs, Revenue
Profitability
Day Pax Total Rev Total Cost Profit/Loss
1 259 $229,770 $180,097 $49,672
2 237 $208,728 $177,332 $31,395
3 226 $207,147 $175,950 $31,196
4 255 $223,308 $179,595 $43,713
5 228 $218,749 $176,201 $42,548
6 243 $206,511 $178,087 $28,424
7 232 $219,729 $176,704 $43,025
Weekly Profit: $269,973
Annual Profit: $14,038,597

17
Step 7: Profitability
Calculate out profit based on
specific cost and revenue as
defined in previous steps
Depending on nature of study,
cost/revenue escalated and net
present value calculated
Attempt make to
benchmark/adjust to publicly
available airline results and in
many cases, to actual airline data
Profitability: HKG-SEA Study Loads, Costs, Revenue
Profitability
Day Pax Total Rev Total Cost Profit/Loss
1 259 $229,770 $180,097 $49,672
2 237 $208,728 $177,332 $31,395
3 226 $207,147 $175,950 $31,196
4 255 $223,308 $179,595 $43,713
5 228 $218,749 $176,201 $42,548
6 243 $206,511 $178,087 $28,424
7 232 $219,729 $176,704 $43,025
Weekly Profit: $269,973
Annual Profit: $14,038,597
18
Variations & Refinements
Depending on nature of study, cost/revenue escalated and net
present value calculated
Attempt made to benchmark/adjust to publicly available airline
results and in many cases, to actual airline data
Unconstrained demand grown over time (typically at rate agreed
upon by airline)
Comparison of potential solutions is common use of forecasting
(i.e. 787 v. A350 in given market)
Introductory costs can be estimated and included in profitability
for a given solution
Sensitivity analysis is common (demand, fuel price, escalation,
fares)
19
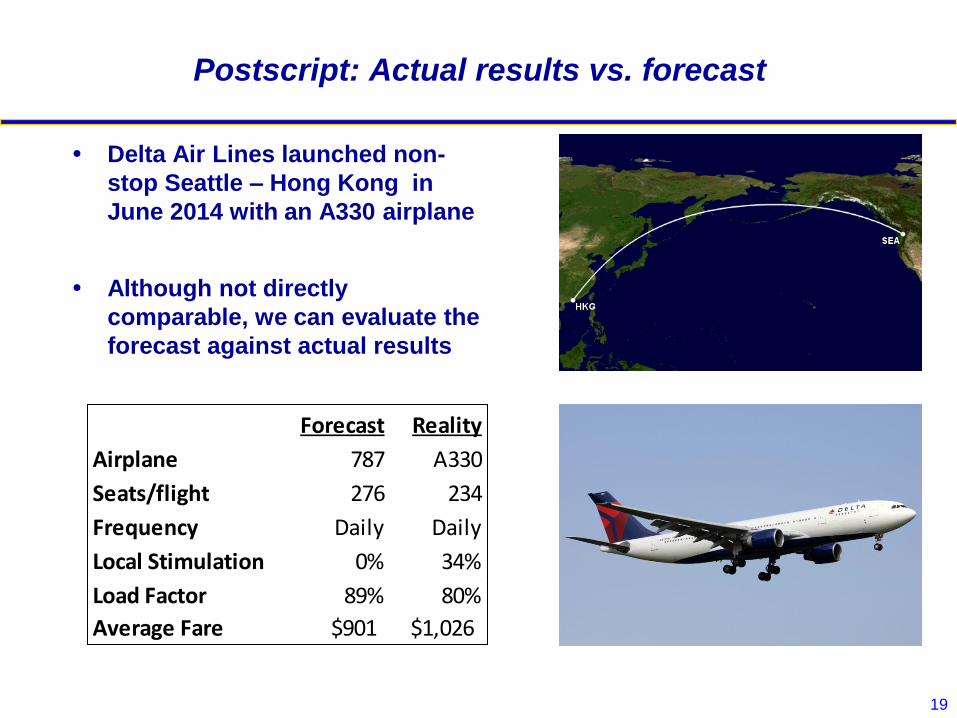
Postscript: Actual results vs. forecast
Delta Air Lines launched non-
stop Seattle – Hong Kong in
June 2014 with an A330 airplane
Although not directly
comparable, we can evaluate the
forecast against actual results
Forecast Reality
Airplane 787 A330
Seats/flight 276 234
Frequency Daily Daily
Local Stimulation 0% 34%
Load Factor 89% 80%
Average Fare $901 $1,026