new release - continuous wave recording for ecg, emg ...€¦ · new release - continuous wave...
TRANSCRIPT

New Release - Continuous Wave Recording for ECG, EMG, Airflow and Snore Sensors (02/2017)In February 2017 we have released new Firmware, Apps and Cloud versions that allow to record continuous waves and send them to the Cloud (in Server Mode). You can record up to 30 seconds of the data measured in detail mode of ECG, EMG, Snore and Airflow.
You can use this new function in Server Mode using detail mode. Use the Record button in order to start a new record.
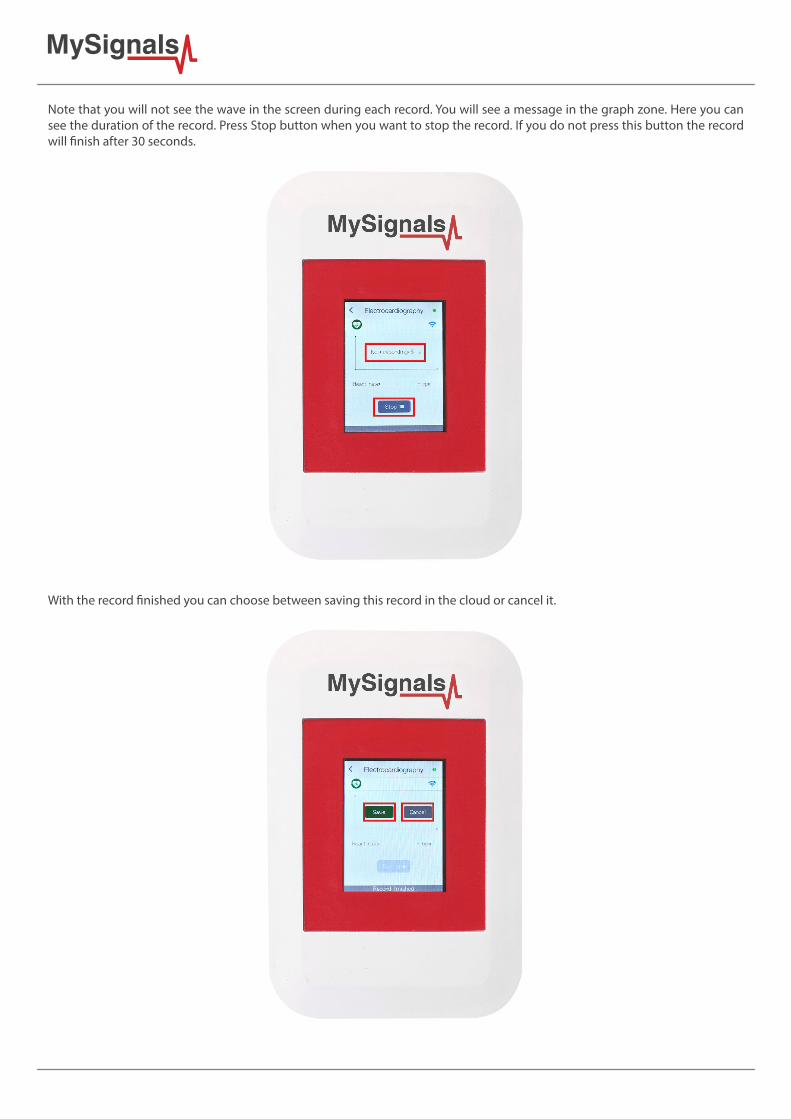
Note that you will not see the wave in the screen during each record. You will see a message in the graph zone. Here you can see the duration of the record. Press Stop button when you want to stop the record. If you do not press this button the record will finish after 30 seconds.
With the record finished you can choose between saving this record in the cloud or cancel it.

You will see all the information about the upload to the cloud at the bottom of the screen (text message zone).
After a correct upload you will see the date of the file saved. Then you can see this new raw data file in the Web Server or in the Mobile APP.
MySignals Mobile APP
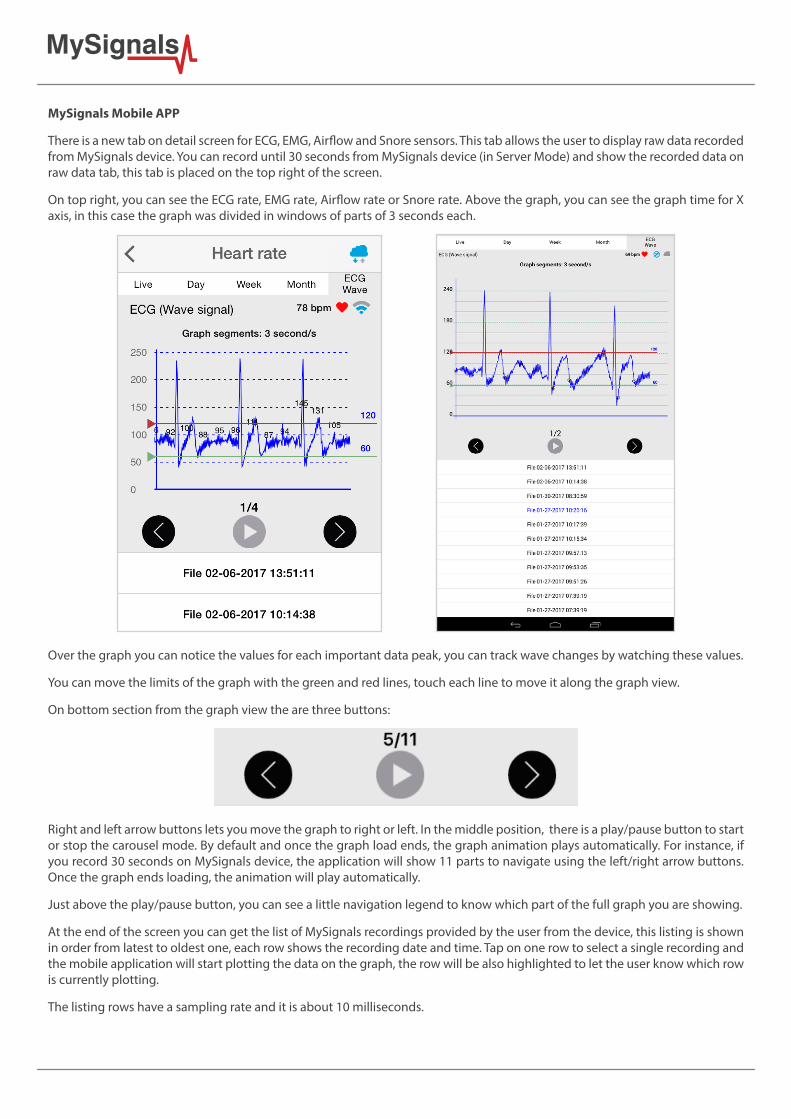
There is a new tab on detail screen for ECG, EMG, Airflow and Snore sensors. This tab allows the user to display raw data recorded from MySignals device. You can record until 30 seconds from MySignals device (in Server Mode) and show the recorded data on raw data tab, this tab is placed on the top right of the screen.
On top right, you can see the ECG rate, EMG rate, Airflow rate or Snore rate. Above the graph, you can see the graph time for X axis, in this case the graph was divided in windows of parts of 3 seconds each.
Over the graph you can notice the values for each important data peak, you can track wave changes by watching these values.
You can move the limits of the graph with the green and red lines, touch each line to move it along the graph view.
On bottom section from the graph view the are three buttons:
Right and left arrow buttons lets you move the graph to right or left. In the middle position, there is a play/pause button to start or stop the carousel mode. By default and once the graph load ends, the graph animation plays automatically. For instance, if you record 30 seconds on MySignals device, the application will show 11 parts to navigate using the left/right arrow buttons. Once the graph ends loading, the animation will play automatically.
Just above the play/pause button, you can see a little navigation legend to know which part of the full graph you are showing.
At the end of the screen you can get the list of MySignals recordings provided by the user from the device, this listing is shown in order from latest to oldest one, each row shows the recording date and time. Tap on one row to select a single recording and the mobile application will start plotting the data on the graph, the row will be also highlighted to let the user know which row is currently plotting.
The listing rows have a sampling rate and it is about 10 milliseconds.
MySignals Cloud Application
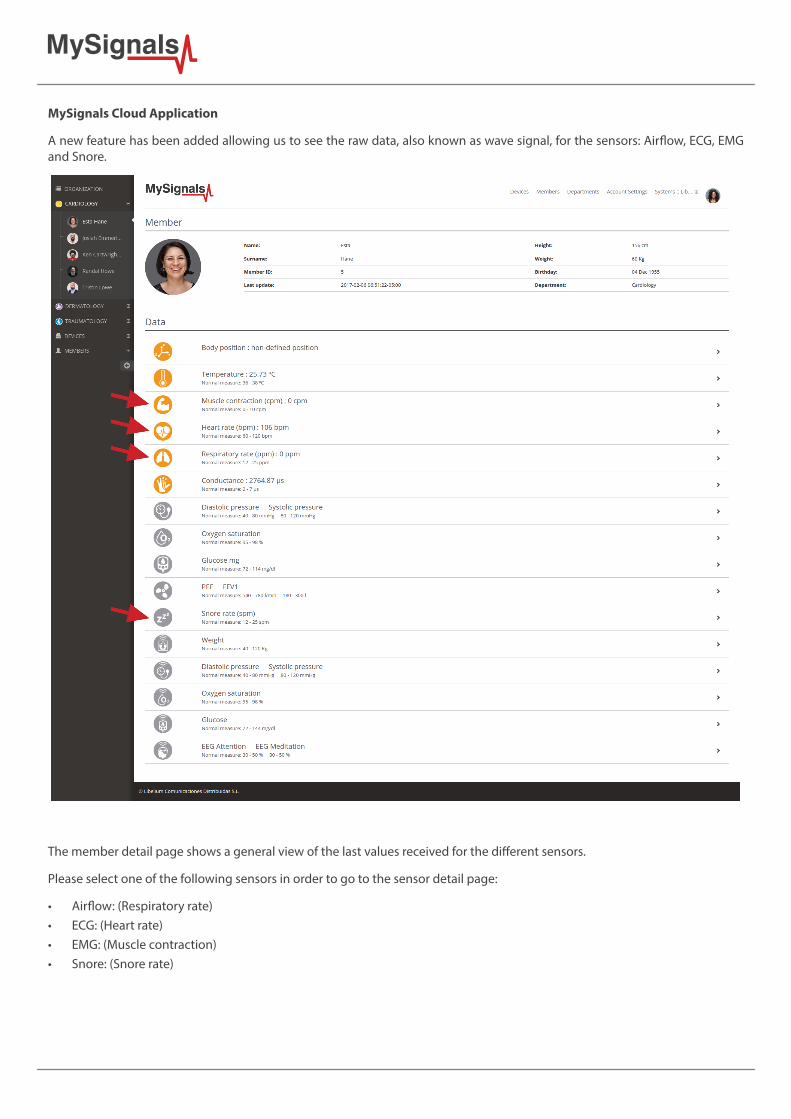
A new feature has been added allowing us to see the raw data, also known as wave signal, for the sensors: Airflow, ECG, EMG and Snore.
The member detail page shows a general view of the last values received for the different sensors.
Please select one of the following sensors in order to go to the sensor detail page:
• Airflow: (Respiratory rate) • ECG: (Heart rate) • EMG: (Muscle contraction) • Snore: (Snore rate)
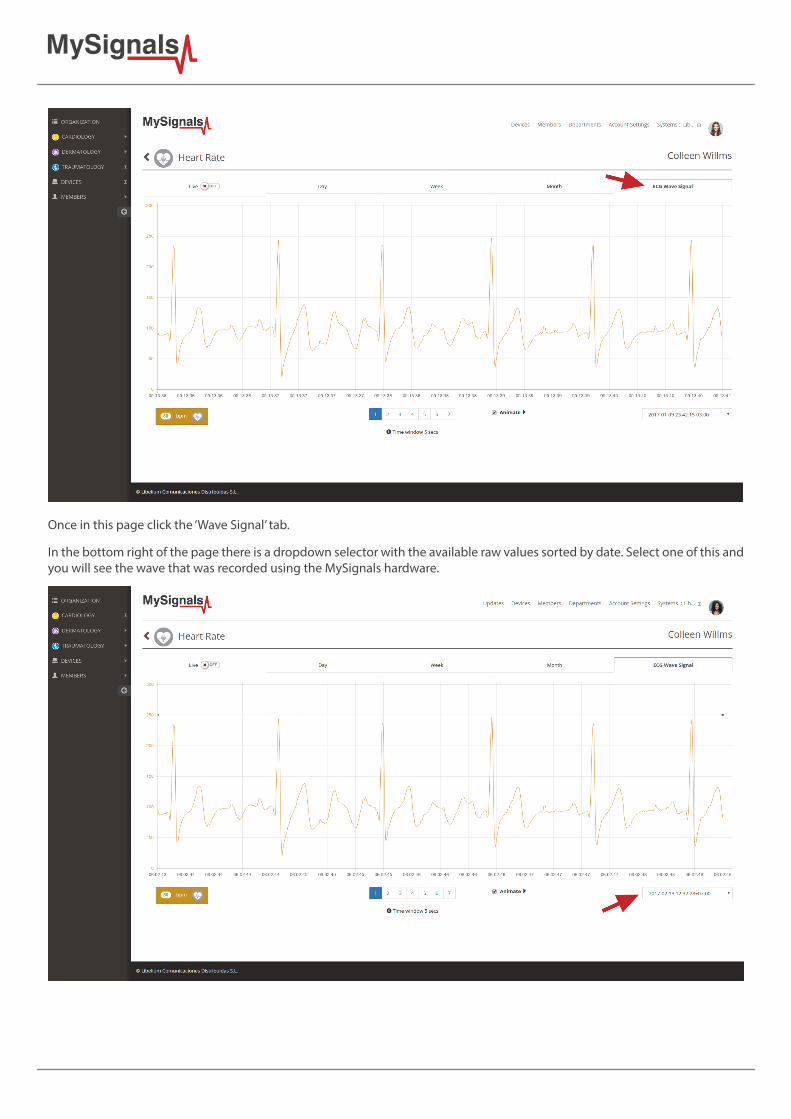
Once in this page click the ‘Wave Signal’ tab.
In the bottom right of the page there is a dropdown selector with the available raw values sorted by date. Select one of this and you will see the wave that was recorded using the MySignals hardware.
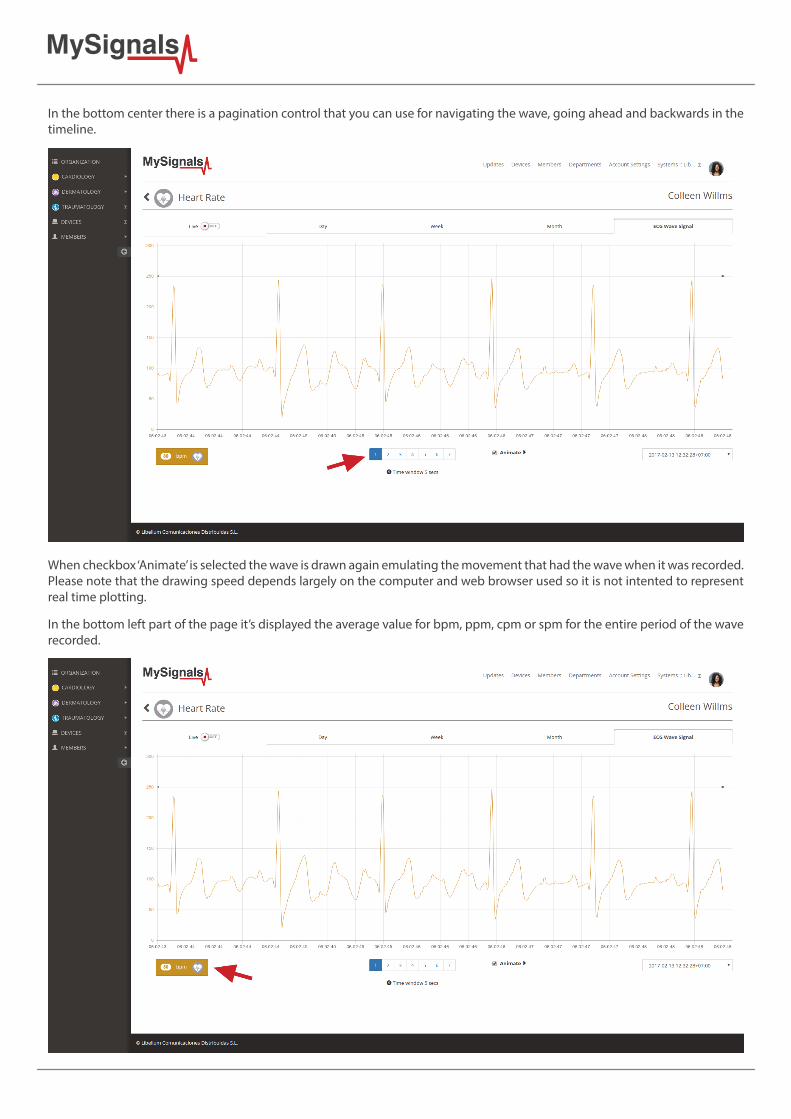
In the bottom center there is a pagination control that you can use for navigating the wave, going ahead and backwards in the timeline.
When checkbox ‘Animate’ is selected the wave is drawn again emulating the movement that had the wave when it was recorded. Please note that the drawing speed depends largely on the computer and web browser used so it is not intented to represent real time plotting.
In the bottom left part of the page it’s displayed the average value for bpm, ppm, cpm or spm for the entire period of the wave recorded.

Updating FirmwareTo start enjoying this new feature you just need to Update the MySignals Firmware and Apps (Android / iOS).
Update MySignals FirmwareLibelium Smart Devices App allows users install new firmware versions and program the configuration of new Libelium products in a few clicks. Download the Java application at:
LINUX:http://downloads.libelium.com/smart_device_app/SmartDeviceApp_linux64.zip
MAC:http://downloads.libelium.com/smart_device_app/SmartDeviceApp_macosx64.zip
WINDOWS:http://downloads.libelium.com/smart_device_app/SmartDeviceApp_windows32.zip
Figure : Libelium Smart Devices App
• Step 1: Open the USB connector Remove the protection cap of the USB connector.
Figure : USB protection cap
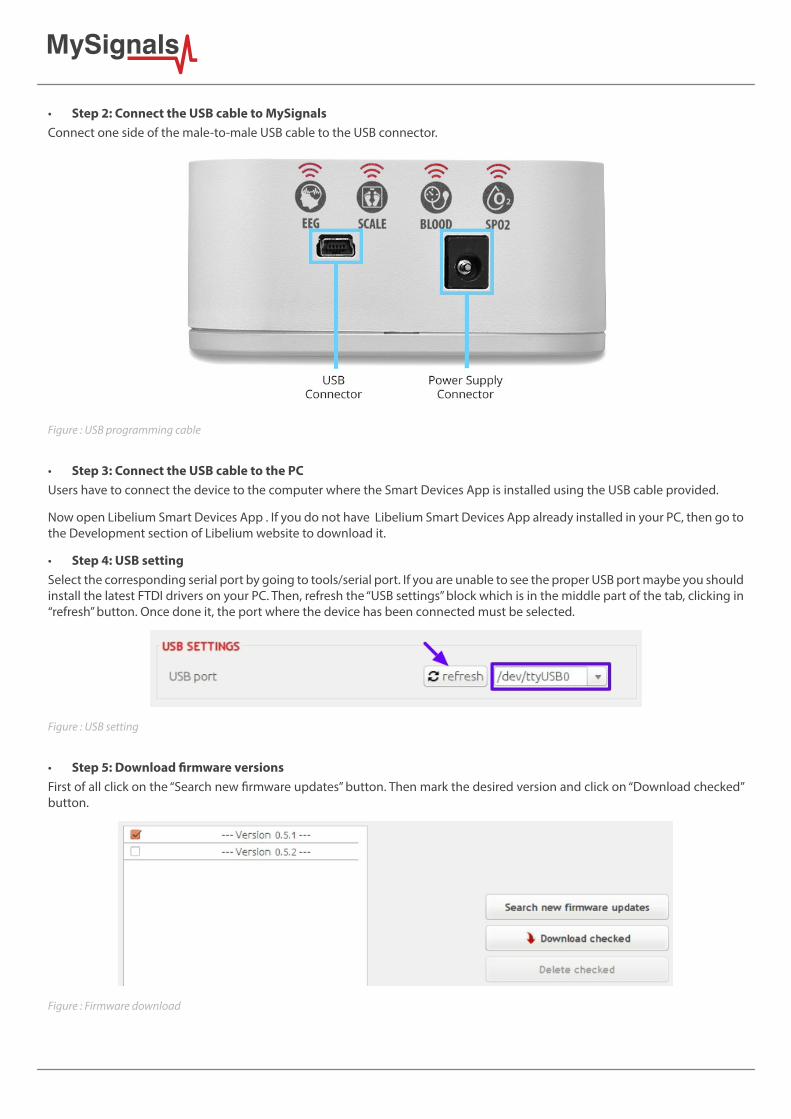
• Step 2: Connect the USB cable to MySignals Connect one side of the male-to-male USB cable to the USB connector.
Figure : USB programming cable
• Step 3: Connect the USB cable to the PC Users have to connect the device to the computer where the Smart Devices App is installed using the USB cable provided.
Now open Libelium Smart Devices App . If you do not have Libelium Smart Devices App already installed in your PC, then go to the Development section of Libelium website to download it.
• Step 4: USB settingSelect the corresponding serial port by going to tools/serial port. If you are unable to see the proper USB port maybe you should install the latest FTDI drivers on your PC. Then, refresh the “USB settings” block which is in the middle part of the tab, clicking in “refresh” button. Once done it, the port where the device has been connected must be selected.
Figure : USB setting
• Step 5: Download firmware versionsFirst of all click on the “Search new firmware updates” button. Then mark the desired version and click on “Download checked” button.
Figure : Firmware download
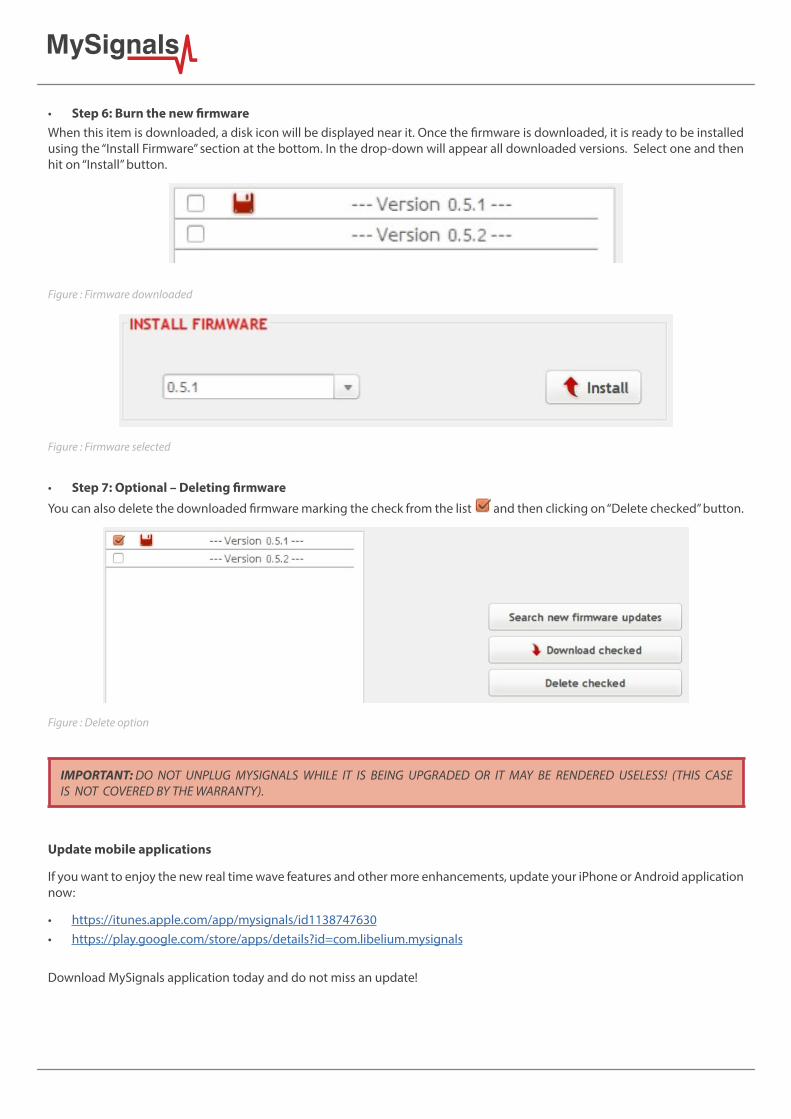
• Step 6: Burn the new firmwareWhen this item is downloaded, a disk icon will be displayed near it. Once the firmware is downloaded, it is ready to be installed using the “Install Firmware” section at the bottom. In the drop-down will appear all downloaded versions. Select one and then hit on “Install” button.
Figure : Firmware downloaded
Figure : Firmware selected
• Step 7: Optional – Deleting firmware
You can also delete the downloaded firmware marking the check from the list and then clicking on “Delete checked” button.
Figure : Delete option
IMPORTANT: DO NOT UNPLUG MYSIGNALS WHILE IT IS BEING UPGRADED OR IT MAY BE RENDERED USELESS! (THIS CASE IS NOT COVERED BY THE WARRANTY).
Update mobile applications
If you want to enjoy the new real time wave features and other more enhancements, update your iPhone or Android application now:
• https://itunes.apple.com/app/mysignals/id1138747630 • https://play.google.com/store/apps/details?id=com.libelium.mysignals
Download MySignals application today and do not miss an update!