new plastics economy a research, innovation and …
TRANSCRIPT
New Plastics Economy
A RESEARCH, INNOVATION AND BUSINESS
OPPORTUNITY FOR DENMARKJanuary 2019 – Technical report
2
Content overview
The Plastics Challenge
Vision for a Danish Plastics Economy
Short term actions to get started
Medium term actions to drive innovation and research
Long term actions to realize circular economy for plastics
Acknowledgements
Executive summary
Appendix
A Danish Perspective on The New Plastics Economy
6
16
26
35
54
4
3
60
59

3
New Plastics Economy – A Research, Innovation, and Business opportunity
for Denmark
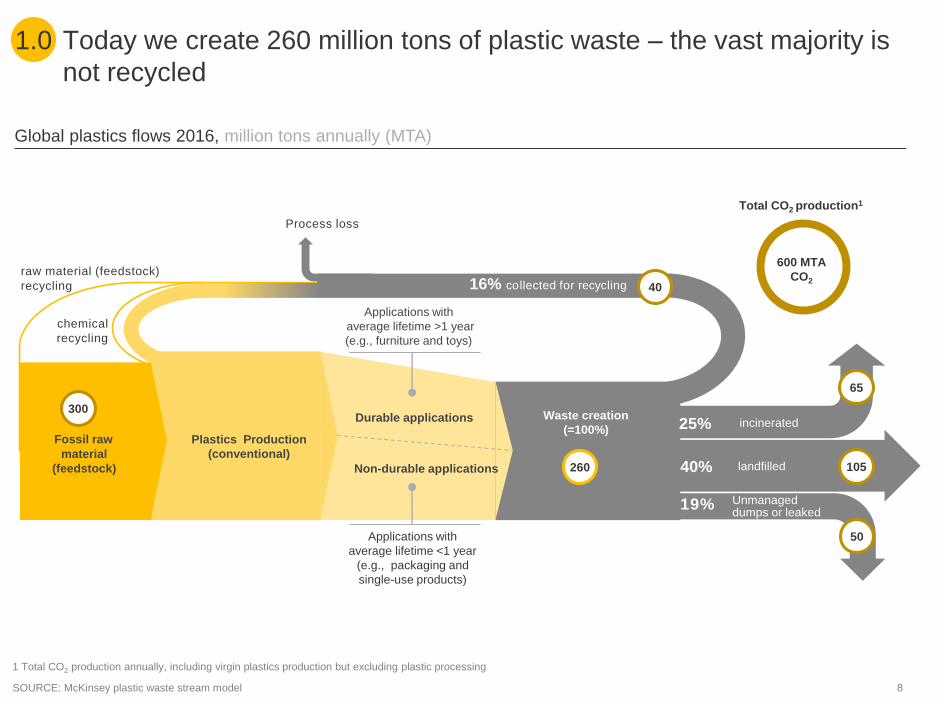
1. Human beings throw away more than half their own weight in plastic every year – 260 million tons of it. The figure will probably reach 500
million tons by 2030. 8 million tons of this waste ends up in the sea, killing wildlife, and disrupting ecosystems. To deal with this pressing
challenge, we have to define a New Plastics Economy. In Denmark, we also see the harm that waste plastics can cause at first hand
1. Every year, Denmark collects 1,000 tons of waste on its western coastline
2. The Arctic Ocean is a global sink for microplastics with an estimated 300 billion plastic items floating in the ice-free waters
3. Danes want action: 99% of Danes say it is important to act on the challenge of plastics
2. Denmark can capitalize on the commitment of its citizens to become a frontrunner in the New Plastics Economy. It can help capture the full
value of plastics through research and innovation aimed at smarter use with reduced consumption, full recycling of all consumer and industrial
plastics, development of sustainable plastics, and the elimination of pollution from plastics in use
1. Doing so offers economic benefits: Denmark loses DKK 1.6 billion a year by importing virgin plastics rather than recycling domestic plastics waste
2. Denmark will also benefit economically from cutting the environmental costs of pollution and by creating value from new technology and jobs
3. In the short term, academia, industry, and regulators can together define a research and innovation agenda that will close gaps in our
knowledge and help identify necessary technologies, regulatory changes, and societal tools
1. Towards 2025, specific milestones could include support for research and innovation from both public and private stakeholders
2. We cannot solve the plastics challenge alone. Denmark could take the lead on implementing the EU Directive on single-use plastics and fishing gear
and lead international forums to set more ambitious targets for reducing plastics pollution
4. In the medium term, Denmark has to meet the EU 2030 targets and could drive innovation in waste collection along with consumption reduction
1. The EU’s target for recycling plastic packaging is 55% by 2030. Denmark currently achieves less than a third of this. A first step to reaching it can be for
municipalities to align their criteria for collecting waste, to eliminate today’s inefficiency. Meeting the target also requires decreasing consumption and
creation of waste, specifically of plastics that are difficult to recycle. This can, for example, include scaling up pilot projects that can successfully
increase reuse of plastics
2. There is great scope for innovation. For example, we could improve collection and sorting by using AI and advanced sensors, as well as continue to
improve on recycling technologies. Additional innovation potential lies in developing new products and materials that can be reused and repaired, or
new business models that enables using less plastic
5. In the long term, a working market for recycled plastics and sustainable plastics must be established
1. This will need measures to build the demand and supply for recycled plastics. One example to build reliable supply is to promote recyclability as part of
implementing Extended Producer Responsibility, which is required for various plastic items across the EU towards 2025
2. In Denmark, we have an opportunity to develop niche applications of sustainable plastics for high-value products based on local industries
6. By realizing this vision, Denmark could capture research, innovation and business opportunities by helping to set the world on a new, less
wasteful course, in which plastics can again become a solution to problems, and not a cause of them
NOTE: In this document, “plastics” is used as a general term (unless otherwise specified), while we recognize this covers a wide field of plastic and product types. Initiatives on plastics will
have to consider the specific use of different plastic types and products.
4
Authors of the report
Thanks to the Steering Committee for guiding the work on this report
and contributing with essential insights and contacts
Flemming Besenbacher
Vice Chairman
Camilla Bjerre Søndergaard
Office Director
Peter Høngaard Andersen
Managing Director
Philip Christiani
Senior Partner
Ditte Lysgaard Vind
CEO and Managing Partner
Franz Cuculiza
Managing Director
Kim Dam-Johansen
Head of Department,
Dep. of Chemical and
Biochemical Engineering
Innovation Fund Denmark
Ministry of Environment and Food
Innovation Fund Denmark
McKinsey & Company
Lendager; The Circular Way
Aage Vestergaard Larsen
DTU Kemiteknik
Bo Frølund
Innovation Fund DenmarkScientific Officer
Peter Høngaard Andersen
Innovation Fund DenmarkManaging Director
Christof Witte
McKinsey & CompanyEngagement Manager
Helga Vanthournout
McKinsey & CompanySenior Knowledge Expert
Tore Duvold
Innovation Fund DenmarkExecutive Vice President
Johannes Lüneborg
McKinsey & CompanyPartner
Karoline Toft-Petersen
Consultant McKinsey & Company

5
Thanks to Plastic Change for providing case examples for plastic consumption reduction as well as input on potential
Danish implementation
Salling Group
B&W Vølund
Danish Technological Institute
WWF
Ministry of Climate, Energy and Building
Technical University of Denmark, Aqua
Danish Technological Institute
Plastic Change
DAKOFA
Dansk Design Center
National Museum of Denmark
Aarhus University, Emission Modeling &
Environmental Geography
Letbæk Plast
Novozymes
Arla Foods
Aalborg University, Civil Engineering
Dansk Affaldsforening
DHI (Danish Hydraulic Institute)
Haldor Tosøe
Amager Ressourcecenter
Plastic Change
Ørsted
Plastic Change
Vestforbrænding
Ocean Plastics Forum
DHI (Danish Hydraulic Institute)
Danish Plastics Federation
Kommunernes Landsforening
Aalborg University, Materials Science and
Engineering
Ministry of Environment and Food
Technical University of Denmark,
Environment
Danish Society for Nature Conservation
Danish Technological Institute
Ministry of Environment and Food
Ørsted
Aarhus University, Engineering
Technical University of Denmark,
Chemical Engineering
Technical University of Denmark,
Chemical Engineering
Technical University of Denmark,
Chemical Engineering
Ministry of Environment and Food
Færch Plast
FLSmidth
Affalds- og Ressourceindustrien
Haldor Topsøe
WWF
Haldor Tosøe
Anne Aittomaki
Head of Development and Partnerships
Yvonne Amskov
Head of Municipality Service
Peter Blach
Project Manager
Helle Buchardt Boyd
Senior Toxicologist
Christina Busk
Environmental Policy Manager
Anders Christiansen
Chief Consultant
Jesper De Claville
Professor
Anders Hastrup Clemmesen
Head of Section
Anders Damgaard
Senior Researcher
Sine Beuse Fauerby
Senior Advisor
Lars German
Director, Plastics and Packaging Technology
Anne Harborg
Team leader
Niels Henriksen
Senior Advisor in New Bio Solutions
Mogens Hinge
Associate professor
Anker Degn Jensen
Professor
Jesper Ahrenfeldt
Senior Scientist
Peter Glarborg
Professor
Frank Jensen
Chief Advisor
Jesper Emil Jensen
Regional CEO
Lars Skaarup Jensen
R&D Specialist
Marianne Munch Jensen
Chief Consultant
Kim Grøn Knudsen
Group Vice President
Anne Cecilie Lasa-Gonzalez
Corporate Partnership Manager
Tore Jeppesen
Business Development Director
Michael Løve
Executive Vice President, Netto International
Ole Hedegaard Madsen
Technology Director
Bjørn Malmgren-Hansen
Consultant
Malene Møhl
Corp. Partnership Manager on Plastic
Jacob Møller
Office Director
Torkel Gissel Nielsen
Professor
Sune Dowler Nygaard
Executive Vice President
Henrik Beha Pedersen
Founder
Ole Morten Petersen
Director
Runa Sabroe
Programme Director
Yvonne Shashoua
Senior Researcher
Marianne Thomsen
Professor
Michael Thomsen
CEO
Stig Træff
Senior Marketing Manager
Karen Marie Tybjerg
Director, Head of Packaging Optimization
Jes Vollertsen
Professor
Nana Winkler
Special Consultant
Margrethe Winther-Nielsen
Senior Researcher
Poul Georg Moses
Director
Ida Leisner
Project Manager
Annette Lendal
Consultant partnerships & policy
Duy Michael Le
Renescience output specialist
WWFThomas Kirk Sørensen
Program Manager Ocean Conservation
Aarhus University, BioscienceJakob Strand
Senior Researcher
Roskilde University, Science and EnvironmentKristian Syberg
Professor
Contributors (in alphabetic order)

6
Human beings throw away more than
half their own weight in plastic every
year – 260 million tons of it. The figure
will probably reach 500 million tons by
2030. 8 million tons of this waste ends
up in the sea, killing wildlife, and
disrupting ecosystems. To deal with this
pressing challenge, we have to define a
New Plastics Economy. In Denmark, we
also see the harm that waste plastics
can cause at first hand
one1. Every year, Denmark collects 1,000
tons of waste on its western coastline
2. The Arctic Ocean is a global sink for
microplastics with an estimated 300
billion plastic items floating in the ice-
free waters
3. Danes want action: 99% of Danes say
it is important to act on the challenge
of plastics

7
In the past 40 years, global plastics production has increased tenfold1.0
250
150
100
0
50
200
300
350
Growth in global plastics production 1950-2016, Million tons annually
Milli
on
to
ns
1950 2016201020001990198019701960
32 MT
(1973)
330 MT
(2016)
SOURCE: Ellen MacArthur Foundation and McKinsey & Company “New Plastics Economy” (2016); Plastics Europe “Plastics -The Facts 2013” (2013); Plastics
Europe “Plastics -The Facts 2015” (2015); McKinsey plastic waste stream model
8
1 Total CO2 production annually, including virgin plastics production but excluding plastic processing
SOURCE: McKinsey plastic waste stream model
Today we create 260 million tons of plastic waste – the vast majority is
not recycled
Global plastics flows 2016, million tons annually (MTA)
1.0
600 MTA
CO2
Total CO2 production1
raw material (feedstock)
recycling
chemical
recycling
landfilled
19%
incinerated
Plastics Production
(conventional)Fossil raw
material
(feedstock)
16% collected for recycling
Waste creation
(=100%)
Unmanageddumps or leaked
Applications with
average lifetime >1 year
(e.g., furniture and toys)
300
40
260
65
105
50
40%
25%
Applications with
average lifetime <1 year
(e.g., packaging and
single-use products)
Plastics Production
(conventional)
Process loss
Durable applications
Non-durable applications

9
~8 million tons of plastics leak into the ocean annually, mainly because
of waste mismanagement, littering behavior, and poor design
SOURCE: Expert interviews; World Bank “What a Waste 2.0” (2018); Ellen MacArthur Foundation and McKinsey & Company “New Plastics Economy” (2016)
1.0
The US and Europe
Asia
Rest of the world
2% = 160 TTA
82% = 6,560 TTA
16% = 1,280 TTA
Geographical sources of plastic in the
ocean, thousand tons annually (TTA)
Total: 8,000 TTA
Plastic pollution sources
Intentional
waste
Mismanagement
Marine-based
waste
Littering
and dumping
▪ Plastic with a use pattern or design that is
unsuitable for collection systems, causing
high likelihood of leakage into the environment,
e.g., toy gun cartridges, particles from tires,
and small detached packaging items
Description
▪ Plastics that have successfully been
collected still end up as pollution due to
unmanaged landfills or mismanaged waste
handling
▪ Dumping of waste at sea, e.g., fishing boats
dumping damaged fishing nets or waste from
oil rigs
▪ Plastics with a design to leak into the ocean,
e.g., dolly ropes
▪ Uncollected waste from littering/dumping by
both citizens and organizations, e.g., due to
insufficient infrastructure or lack of education
10
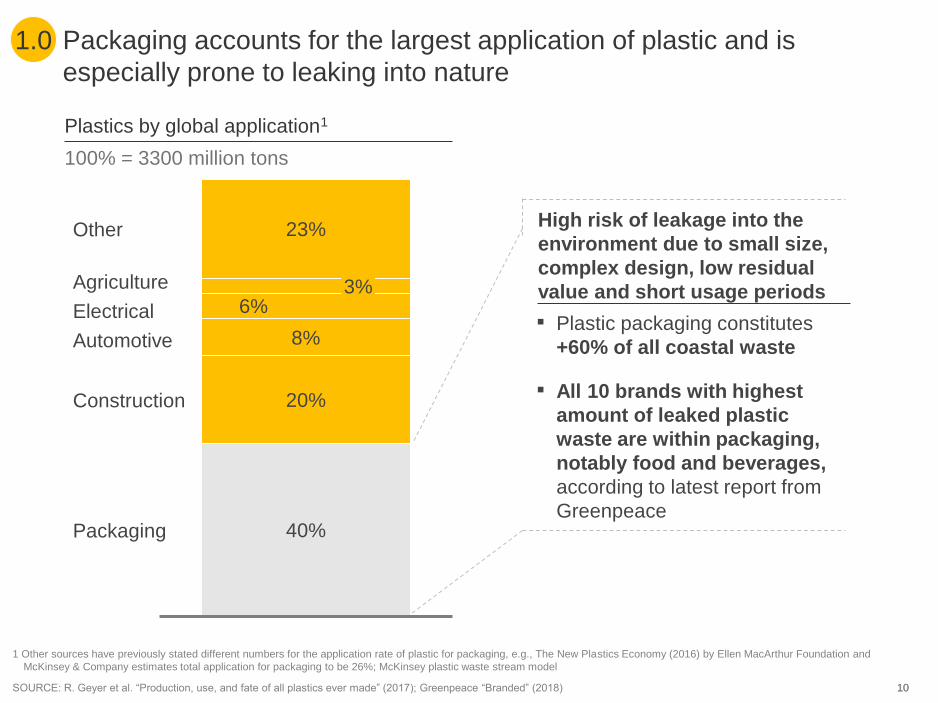
Packaging accounts for the largest application of plastic and is
especially prone to leaking into nature
10
40%
20%
6%
23%
Electrical
Other
3%Agriculture
Packaging
Automotive
Construction
8%
SOURCE: R. Geyer et al. “Production, use, and fate of all plastics ever made” (2017); Greenpeace “Branded” (2018)
Plastics by global application1
100% = 3300 million tons
1 Other sources have previously stated different numbers for the application rate of plastic for packaging, e.g., The New Plastics Economy (2016) by Ellen MacArthur Foundation and
McKinsey & Company estimates total application for packaging to be 26%; McKinsey plastic waste stream model
1.0
▪ Plastic packaging constitutes
+60% of all coastal waste
▪ All 10 brands with highest
amount of leaked plastic
waste are within packaging,
notably food and beverages,
according to latest report from
Greenpeace
High risk of leakage into the
environment due to small size,
complex design, low residual
value and short usage periods
11
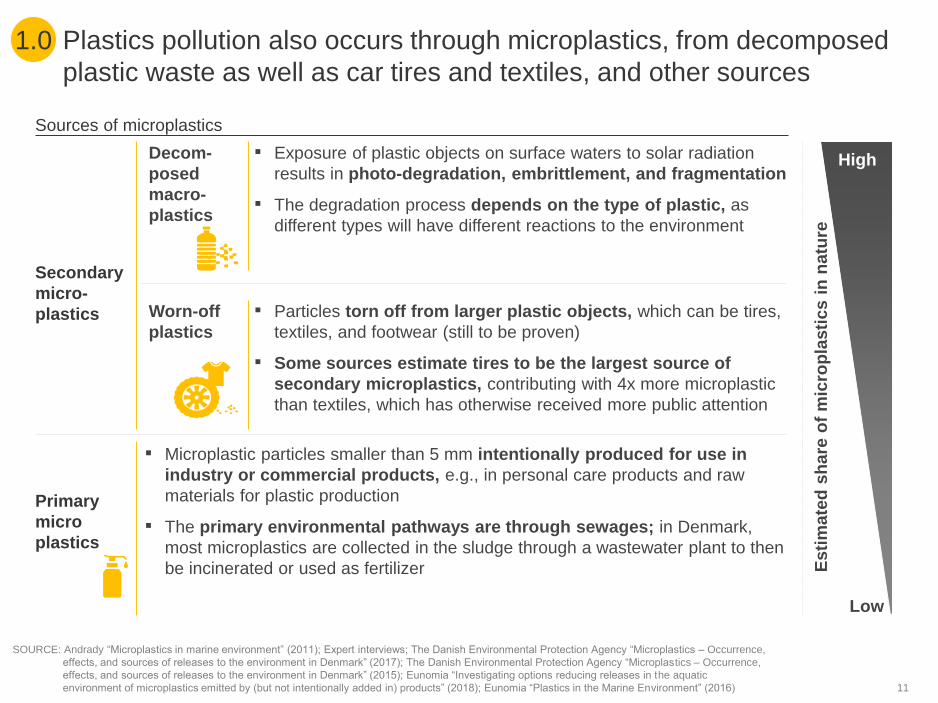
Plastics pollution also occurs through microplastics, from decomposed
plastic waste as well as car tires and textiles, and other sources
SOURCE: Andrady “Microplastics in marine environment” (2011); Expert interviews; The Danish Environmental Protection Agency “Microplastics – Occurrence,
effects, and sources of releases to the environment in Denmark” (2017); The Danish Environmental Protection Agency “Microplastics – Occurrence,
effects, and sources of releases to the environment in Denmark” (2015); Eunomia “Investigating options reducing releases in the aquatic
environment of microplastics emitted by (but not intentionally added in) products” (2018); Eunomia “Plastics in the Marine Environment” (2016)
1.0
Sources of microplastics
Decom-
posed
macro-
plastics
Worn-off
plastics
▪ Microplastic particles smaller than 5 mm intentionally produced for use in
industry or commercial products, e.g., in personal care products and raw
materials for plastic production
▪ The primary environmental pathways are through sewages; in Denmark,
most microplastics are collected in the sludge through a wastewater plant to then
be incinerated or used as fertilizer
▪ Particles torn off from larger plastic objects, which can be tires,
textiles, and footwear (still to be proven)
▪ Some sources estimate tires to be the largest source of
secondary microplastics, contributing with 4x more microplastic
than textiles, which has otherwise received more public attention
Primary
micro
plastics
Secondary
micro-
plastics
▪ Exposure of plastic objects on surface waters to solar radiation
results in photo-degradation, embrittlement, and fragmentation
▪ The degradation process depends on the type of plastic, as
different types will have different reactions to the environment
Es
tim
ate
d s
ha
re o
f m
icro
pla
sti
cs
in
na
ture
Low
High

12
While Danish pollution is low, Denmark is still exposed to marine waste
from elsewhere - 1000 tons per year on the Danish West Coast
SOURCE: Nordic Council of Ministers “Marine Litter in Nordic Waters” (2015); UNEP “Marine Litter - An analytical overview” (2005); KIMO via Danish EPA
press release (March 2018); Strand, J., Tairova, Z. & Metcalfe, R. d’A “Status on beach litter monitoring in Denmark” (2015)
1 Based on OSPAR + MARLIN data 2002-2012
▪ 1000 tons of waste – mostly plastics
- washes onto the Danish West
Coast annually
▪ The ocean currents create a local
circulation in the Skagerrak region
that functions as an accumulation
area for marine litter
▪ Coastal areas in Skagerrak receive
~10% of all marine litter in the North
Sea, despite only covering about 2% of
the total coastline
Transport via ocean currents and local circulation cause waste accumulation in Skagerrak
Circulation of ocean currents in the North Sea
and Skagerrak
1.1
13
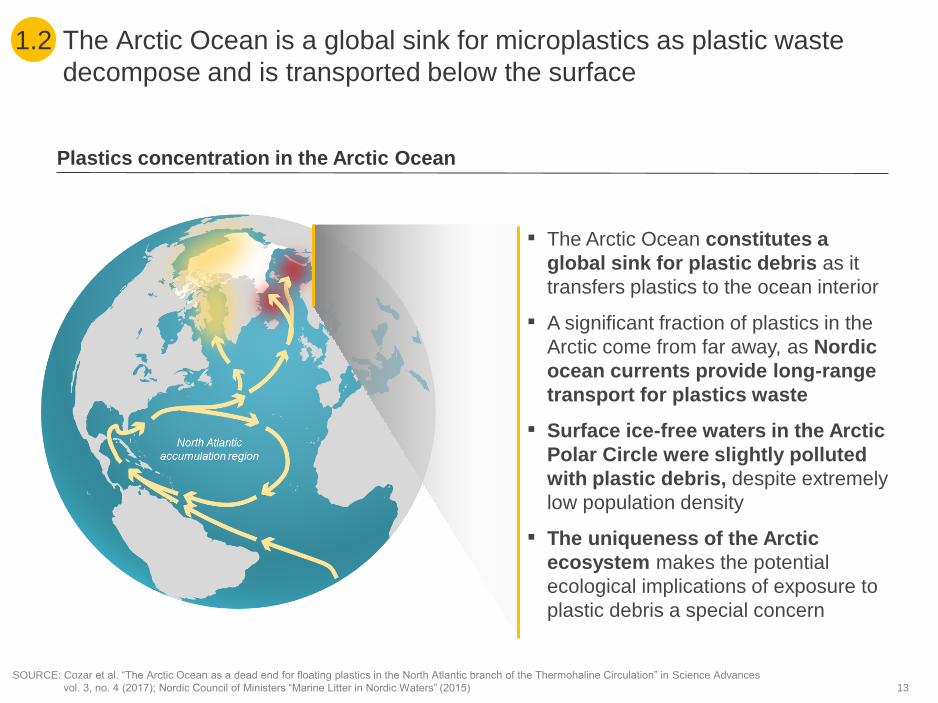
The Arctic Ocean is a global sink for microplastics as plastic waste
decompose and is transported below the surface
SOURCE: Cozar et al. “The Arctic Ocean as a dead end for floating plastics in the North Atlantic branch of the Thermohaline Circulation” in Science Advances
vol. 3, no. 4 (2017); Nordic Council of Ministers “Marine Litter in Nordic Waters” (2015)
▪ The Arctic Ocean constitutes a
global sink for plastic debris as it
transfers plastics to the ocean interior
▪ A significant fraction of plastics in the
Arctic come from far away, as Nordic
ocean currents provide long-range
transport for plastics waste
▪ Surface ice-free waters in the Arctic
Polar Circle were slightly polluted
with plastic debris, despite extremely
low population density
▪ The uniqueness of the Arctic
ecosystem makes the potential
ecological implications of exposure to
plastic debris a special concern
Plastics concentration in the Arctic Ocean
1.2
14
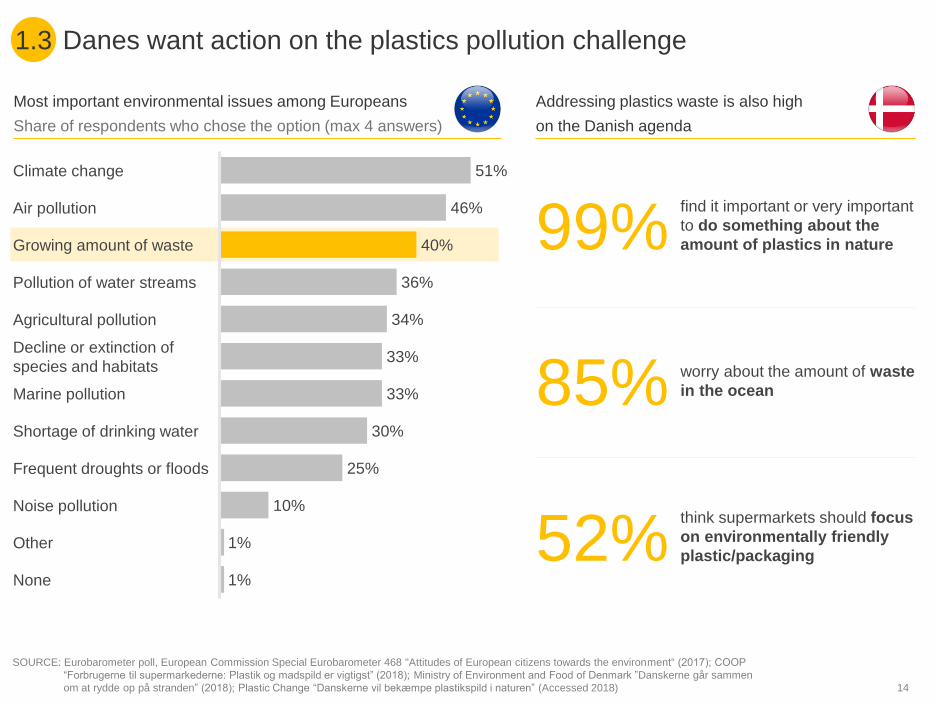
Danes want action on the plastics pollution challenge
SOURCE: Eurobarometer poll, European Commission Special Eurobarometer 468 "Attitudes of European citizens towards the environment“ (2017); COOP
“Forbrugerne til supermarkederne: Plastik og madspild er vigtigst” (2018); Ministry of Environment and Food of Denmark ”Danskerne går sammen
om at rydde op på stranden” (2018); Plastic Change “Danskerne vil bekæmpe plastikspild i naturen” (Accessed 2018)
1.3
51%
46%
40%
36%
34%
33%
33%
30%
25%
10%
1%
1%
Shortage of drinking water
Climate change
Air pollution
Growing amount of waste
Marine pollution
Agricultural pollution
Pollution of water streams
Decline or extinction of
species and habitats
Frequent droughts or floods
Noise pollution
Other
None
Most important environmental issues among Europeans
Share of respondents who chose the option (max 4 answers)
Addressing plastics waste is also high
on the Danish agenda
worry about the amount of waste
in the ocean85%
think supermarkets should focus
on environmentally friendly
plastic/packaging52%
find it important or very important
to do something about the
amount of plastics in nature99%
15
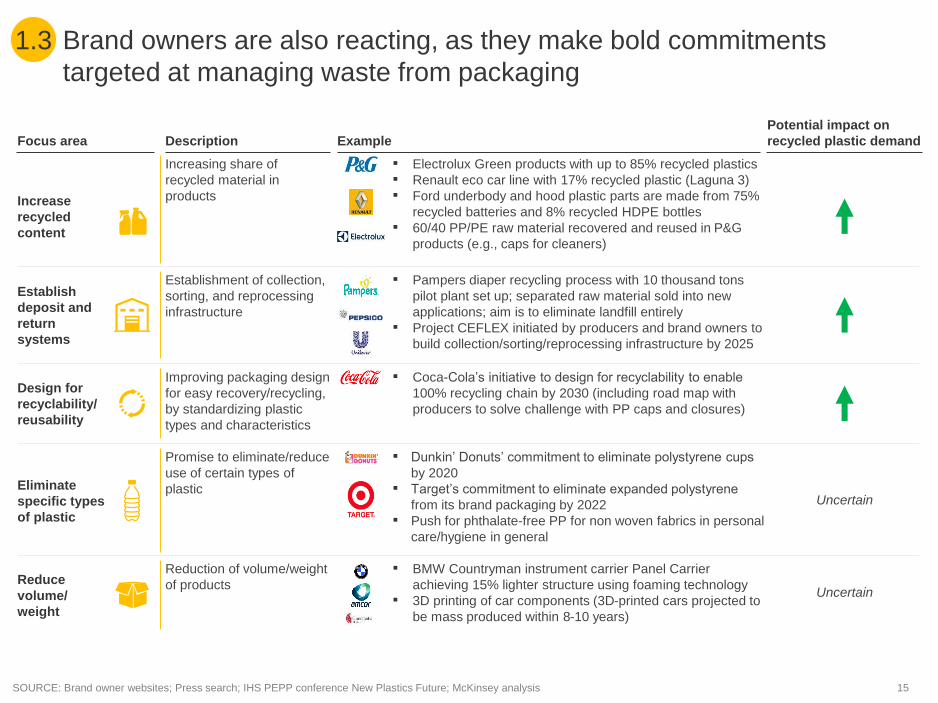
Brand owners are also reacting, as they make bold commitments
targeted at managing waste from packaging
SOURCE: Brand owner websites; Press search; IHS PEPP conference New Plastics Future; McKinsey analysis
1.3
Potential impact on
recycled plastic demandFocus area
Increase
recycled
content
Example
▪ Electrolux Green products with up to 85% recycled plastics
▪ Renault eco car line with 17% recycled plastic (Laguna 3)
▪ Ford underbody and hood plastic parts are made from 75%
recycled batteries and 8% recycled HDPE bottles
▪ 60/40 PP/PE raw material recovered and reused in P&G
products (e.g., caps for cleaners)
Description
Increasing share of
recycled material in
products
Establish
deposit and
return
systems
Design for
recyclability/
reusability
▪ Pampers diaper recycling process with 10 thousand tons
pilot plant set up; separated raw material sold into new
applications; aim is to eliminate landfill entirely
▪ Project CEFLEX initiated by producers and brand owners to
build collection/sorting/reprocessing infrastructure by 2025
▪ Coca-Cola’s initiative to design for recyclability to enable
100% recycling chain by 2030 (including road map with
producers to solve challenge with PP caps and closures)
▪ Dunkin’ Donuts’ commitment to eliminate polystyrene cups
by 2020
▪ Target’s commitment to eliminate expanded polystyrene
from its brand packaging by 2022
▪ Push for phthalate-free PP for non woven fabrics in personal
care/hygiene in general
Establishment of collection,
sorting, and reprocessing
infrastructure
Improving packaging design
for easy recovery/recycling,
by standardizing plastic
types and characteristics
Promise to eliminate/reduce
use of certain types of
plasticUncertain
Eliminate
specific types
of plastic
Reduce
volume/
weight
▪ BMW Countryman instrument carrier Panel Carrier
achieving 15% lighter structure using foaming technology
▪ 3D printing of car components (3D-printed cars projected to
be mass produced within 8-10 years)
Reduction of volume/weight
of productsUncertain
16
THE NEW PLASTICS ECONOMY
Denmark can capitalize on the
commitment of its citizens to become a
frontrunner in the New Plastics
Economy. It can help capture the full
value of plastics through research and
innovation aimed at smarter use with
reduced consumption, full recycling of all
consumer and industrial plastics,
development of sustainable plastics, and
the elimination of pollution from plastics
in use
two1. Doing so offers economic benefits:
Denmark loses DKK 1.6 billion a year
by importing virgin plastics rather than
recycling domestic plastics waste
2. Denmark will also benefit
economically from cutting the
environmental costs of pollution and
by creating value from new
technology and jobs

17SOURCE: Ministry of Environment and Food “Statistik for emballageforsyning og indsamling af affald 2016” (2018); Expert interviews; McKinsey analysis
Most of the Danish plastic waste is incinerated – leaving significant
potential for increased recycling
2.0
28%
Recycling
64,000
tons
Landfill
7,000
tons
57%
2%Energy
usage
200,000
tons
Plastic waste
in Denmark
350,000
tons
Export for
recycling
97,000 tons1
Export of
recycled
plastic
17,000 tons
Recycled
plastic in
production
47,000 tons
Virgin
plastics in
production
500,000
tons ▪ ~60% of plastic waste is packaging (215,000 tons)2
▪ Consists of hundreds of complex products within
various segmentations, e.g., food, toys, and
construction
▪ Composed of 6 main types (PET, HDPE, LDPE, PP,
PS, and PVC) in addition to many others
Annual plastic production and waste are not
equal due to exports and a “stock” of durable
plastics in use with consumption time above 1
year, e.g., furniture and toys
13%
Recycled
waste 46,000
tons
Import of
waste
18,000 tons
1 Data on recycling rate of exported plastics waste is poor, while expert interviews indicate that ~50% of the exported plastic waste is recycled
2 Includes primary, secondary, and tertiary packaging
Estimate of current Danish plastic production, waste, and waste treatment

18
A New Plastics Economy is part of realizing the circular economy
opportunity
SOURCE: Ellen MacArthur Foundation and McKinsey & Company in “Potential for Denmark as a Circular Economy” (2015); The Danish Ministry for
Environment and Food and Ministry of Industry, Business, and Financial Affairs “Strategi for Cirkulær Økonomi” (2018); McKinsey & Company, Ellen
MacArthur Foundation, SUN Foundation Analysis “Growth within: A circular economy vision for a competitive Europe” (2015); McKinsey recycling
economics model
2.1
The circular economy opportunity
in Denmark
▪ Upwards of DKK 45 billion in estimated
annual value potential for Danish GDP if
transforming into a circular economy by 2035
▪ Circular economy strategy for Denmark
already in place
▪ Separate strategy for plastics, “Plastik uden
spild - Regeringens Plastikhandlingsplanen”
published in December 2018
The circular economy opportunity
in Europe
▪ Increase in resource productivity by up to
3% annually
▪ A primary resource benefit to Europe’s
economies of as much as EUR 0.6 trillion
per year by 2030
▪ EUR 1.2 trillion in non resource and
externality benefits
▪ A GDP increase of as much as 7
percentage points relative to the current
development scenario, with additional
positive impacts on employment
▪ EUR 45 billion in potential value creation
from recycling plastics during 2016-2030
NOTE: See appendix for overview of the EU Circular Economy package including details on plastic-relevant elements

19
Denmark can aspire to become a front runner in the New Plastics
Economy and capture the value of plastics through research and
innovation
2.0
1100% recycling of plastics with a view to capture the full value of our waste
streams - for both household and industrial plastics –enabled by a functioning
market for reused and recycled plastics
2 Minimize or phase out plastics that are difficult to recycle and/or collect
3Find alternatives for plastics where intended use result in direct pollution
(e.g., textiles and artificial turf)
4Eliminate need for new fossil based plastics by reducing consumption, a high
level of recycling and development of new sustainable bio-based plastics
5Drive policies to stop plastics pollution of the oceans through the EU and
global forums, as Denmark cannot solve the plastics challenge alone
Elements of a vision for Denmark

20
Vision for a circular New Plastics Economy in Denmark2.0
Plastics producer
Product manufacturer
Retail/service provider
Leakage from
plastics in use
(to be minimized)
Plastics
in use
Energy recovery
PyrolysisIncineration
Feedstock producer
Fossilfeedstock
Biobasedfeedstock Maximize mechanical
recycling to capture
highest value
Reuse of plastic products,
such as cups and crates
Recycle low-value
plastics back to raw
material to bring the
material back into the
plastics loop
Sustainable alternative plastics
raw materials, e.g., from biomass
New applications of renewable
plastics and improved design,
facilitating reuse and recyclability
Schemes supporting increased
reuse and closed-loop models
Exporting energy recovery
solutions as alternative to pollution
and landfilling, based on Danish
expertise within incineration
Dissemble parts for
direct reuse

21
A set of aspirational targets on short, medium, and long term can guide
efforts needed today and in the future
2.0
Bring academia, industry and
regulators together
to define a research
and innovation agenda
to close key knowledge gaps
Medium term: Meet EU targets
and drive innovation
Long term:Establish a viable market
for renewable plastics and new
sustainable plastics
Short term:Prioritize research and
development on plastics
Align collection criteria across
municipalities and reduce
plastics consumption and
waste creation, specifically in
plastics that are difficult to recycle
Define and implement a viable
market for recycled plastics via
a combination of demand and
supply measures
Potential targets on short, medium, and long term
Innovation in necessary
recycling technologies,
and supporting technologies
for sorting and collection (e.g.,
traceability, use of AI, and
robotics) as well as innovations
for reuse and repair, and new
business models
Lead development of niche
applications of bio-based
plastics for high-value products
based on existing industry in
Denmark
Identify necessary technologies,
regulatory changes, and
societal tools

22
Industrial plastic waste1
▪ Handled by private waste managers, not allowed to
be handled by municipal waste management
▪ Consists of production waste e.g., scraps,
secondary, and tertiary packaging, discarded
construction parts, as well as “household- like” waste
▪ The manufacturing industry is the largest contributor,
making up ~30% of total plastic waste
▪ Experiences higher recycling rates due to
– Cleaner waste streams
– Availability from small number of sources with
relatively high volume
Household plastic waste2
▪ Handled by public waste management through utility
companies
▪ Collected at households or local collection sites
▪ High risk of contamination between materials
▪ Low volume per source cause high cost of collection
▪ While household
plastic waste
receives more
attention,
industrial plastic
waste makes up
the majority of
plastic waste
▪ Solving the
plastics challenge
therefore
requires focus
on both
household and
industrial plastic
waste
Solving the plastics challenge requires focusing both on industrial and
household plastics
SOURCE: Plastindustrien “Plastaffaldskilder I Danmark”; Ellen MacArthur Foundation and McKinsey & Company “Potential for Denmark as a Circular
Economy: A Case Study From: Delivering The Circular Economy – A Toolkit for Policy Makers” (2015); Danish Environmental Agency
“Affaldsstatistikken 2016” (2018)
X Share collected for recycling
40-45%
14-15%
~65%
=
~225,000 tons
annually
~35%
=
~125,000 tons
annually
Share between industrial and
household plastics in Denmark
100% = 350,000 tons
1 Includes waste from industry (manufacturing), service, construction, agriculture, forestry, and hunting sectors
2 Includes waste from permanent and secondary residences, including residents in institutions (e.g., elderly homes)
2.0
23
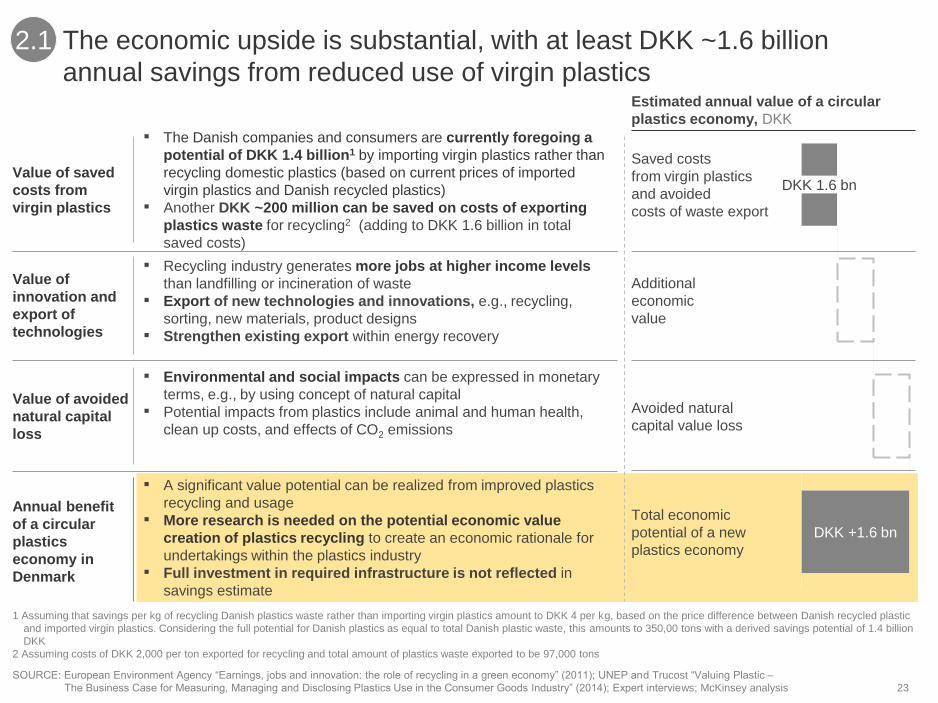
The economic upside is substantial, with at least DKK ~1.6 billion
annual savings from reduced use of virgin plastics
SOURCE: European Environment Agency “Earnings, jobs and innovation: the role of recycling in a green economy” (2011); UNEP and Trucost “Valuing Plastic –
The Business Case for Measuring, Managing and Disclosing Plastics Use in the Consumer Goods Industry” (2014); Expert interviews; McKinsey analysis
1 Assuming that savings per kg of recycling Danish plastics waste rather than importing virgin plastics amount to DKK 4 per kg, based on the price difference between Danish recycled plastic
and imported virgin plastics. Considering the full potential for Danish plastics as equal to total Danish plastic waste, this amounts to 350,00 tons with a derived savings potential of 1.4 billion
DKK
2 Assuming costs of DKK 2,000 per ton exported for recycling and total amount of plastics waste exported to be 97,000 tons
Value of saved
costs from
virgin plastics
▪ The Danish companies and consumers are currently foregoing a
potential of DKK 1.4 billion1 by importing virgin plastics rather than
recycling domestic plastics (based on current prices of imported
virgin plastics and Danish recycled plastics)
▪ Another DKK ~200 million can be saved on costs of exporting
plastics waste for recycling2 (adding to DKK 1.6 billion in total
saved costs)
Value of
innovation and
export of
technologies
▪ Recycling industry generates more jobs at higher income levels
than landfilling or incineration of waste
▪ Export of new technologies and innovations, e.g., recycling,
sorting, new materials, product designs
▪ Strengthen existing export within energy recovery
Value of avoided
natural capital
loss
▪ Environmental and social impacts can be expressed in monetary
terms, e.g., by using concept of natural capital
▪ Potential impacts from plastics include animal and human health,
clean up costs, and effects of CO2 emissions
Annual benefit
of a circular
plastics
economy in
Denmark
▪ A significant value potential can be realized from improved plastics
recycling and usage
▪ More research is needed on the potential economic value
creation of plastics recycling to create an economic rationale for
undertakings within the plastics industry
▪ Full investment in required infrastructure is not reflected in
savings estimate
DKK +1.6 bn
Additional
economic
value
DKK 1.6 bn
Saved costs
from virgin plastics
and avoided
costs of waste export
Total economic
potential of a new
plastics economy
Avoided natural
capital value loss
Estimated annual value of a circular
plastics economy, DKK
2.1
24
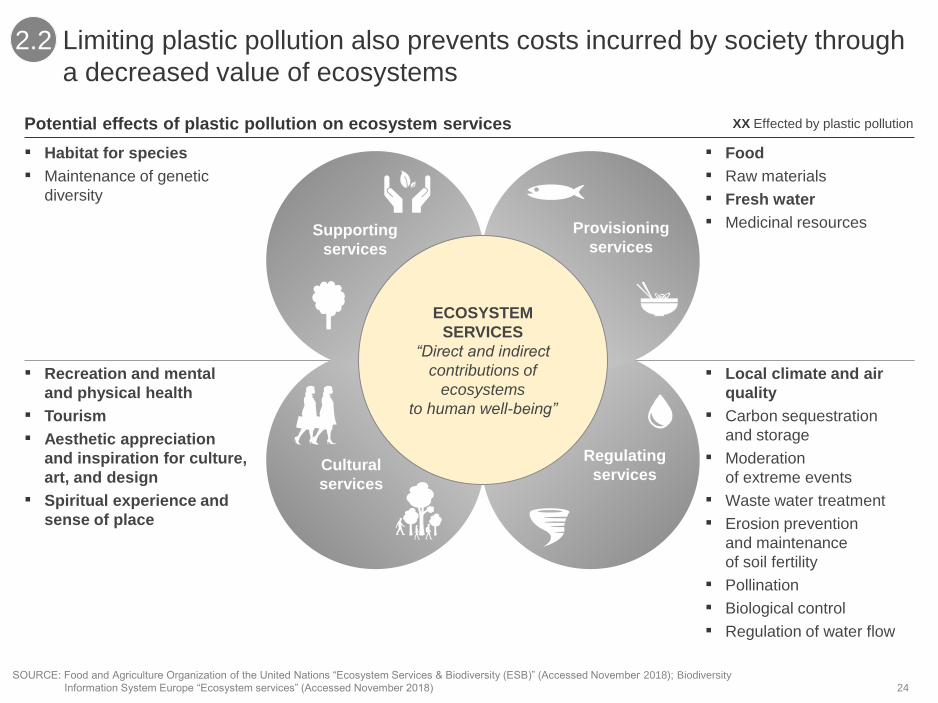
Limiting plastic pollution also prevents costs incurred by society through
a decreased value of ecosystems
SOURCE: Food and Agriculture Organization of the United Nations “Ecosystem Services & Biodiversity (ESB)” (Accessed November 2018); Biodiversity
Information System Europe “Ecosystem services” (Accessed November 2018)
2.2
Effected by plastic pollutionXXPotential effects of plastic pollution on ecosystem services
▪ Recreation and mental
and physical health
▪ Tourism
▪ Aesthetic appreciation
and inspiration for culture,
art, and design
▪ Spiritual experience and
sense of place
▪ Local climate and air
quality
▪ Carbon sequestration
and storage
▪ Moderation
of extreme events
▪ Waste water treatment
▪ Erosion prevention
and maintenance
of soil fertility
▪ Pollination
▪ Biological control
▪ Regulation of water flow
▪ Food
▪ Raw materials
▪ Fresh water
▪ Medicinal resources
▪ Habitat for species
▪ Maintenance of genetic
diversity
ECOSYSTEM
SERVICES
“Direct and indirect
contributions of
ecosystems
to human well-being”
Supporting
services
Provisioning
services
Regulating
servicesCultural
services
25
Danish CO2
reduction
commit-
ments
Circular
scenario
Linear
scenario
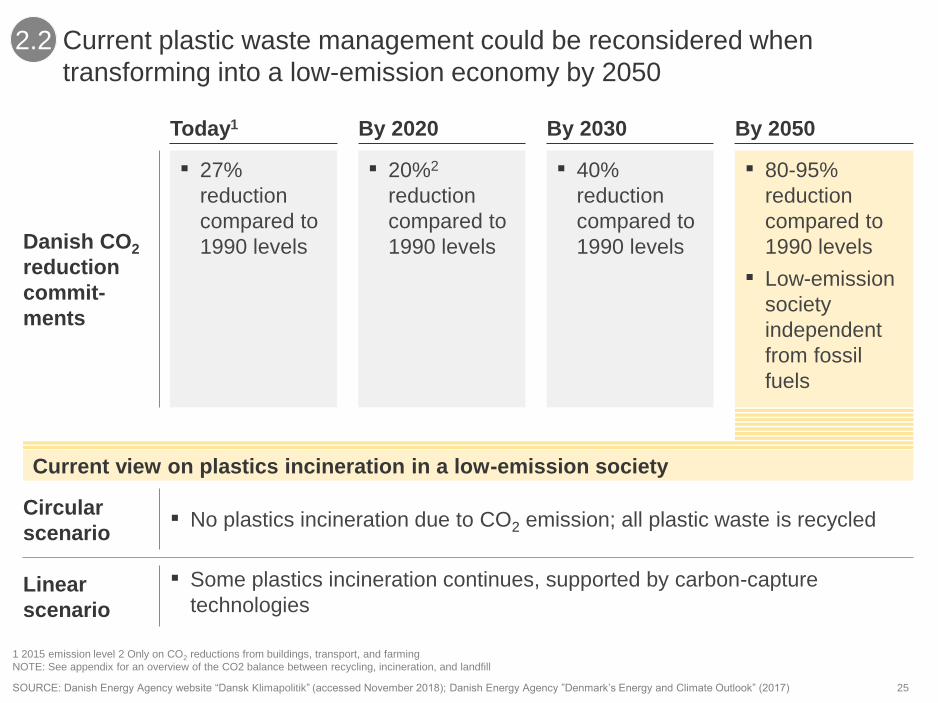
SOURCE: Danish Energy Agency website “Dansk Klimapolitik” (accessed November 2018); Danish Energy Agency ”Denmark’s Energy and Climate Outlook” (2017)
1 2015 emission level 2 Only on CO2 reductions from buildings, transport, and farming
NOTE: See appendix for an overview of the CO2 balance between recycling, incineration, and landfill
Current plastic waste management could be reconsidered when
transforming into a low-emission economy by 2050
2.2
▪ 27%
reduction
compared to
1990 levels
▪ 20%2
reduction
compared to
1990 levels
▪ 40%
reduction
compared to
1990 levels
▪ 80-95%
reduction
compared to
1990 levels
▪ Low-emission
society
independent
from fossil
fuels
Today1 By 2020 By 2050By 2030
▪ No plastics incineration due to CO2 emission; all plastic waste is recycled
▪ Some plastics incineration continues, supported by carbon-capture
technologies
Current view on plastics incineration in a low-emission society

26
In the short term, academia,
industry, and regulators can
together define a research and
innovation agenda that will close
gaps in our knowledge and help
identify necessary technologies,
regulatory changes, and societal
tools
three1. Towards 2025, specific
milestones could include
support for research and
innovation from both public
and private stakeholders
2. We cannot solve the plastics
challenge alone. Denmark
could take the lead on
implementing the EU Directive
on single-use plastics and
fishing gear and lead
international forums to set
more ambitious targets for
reducing plastics pollution
27
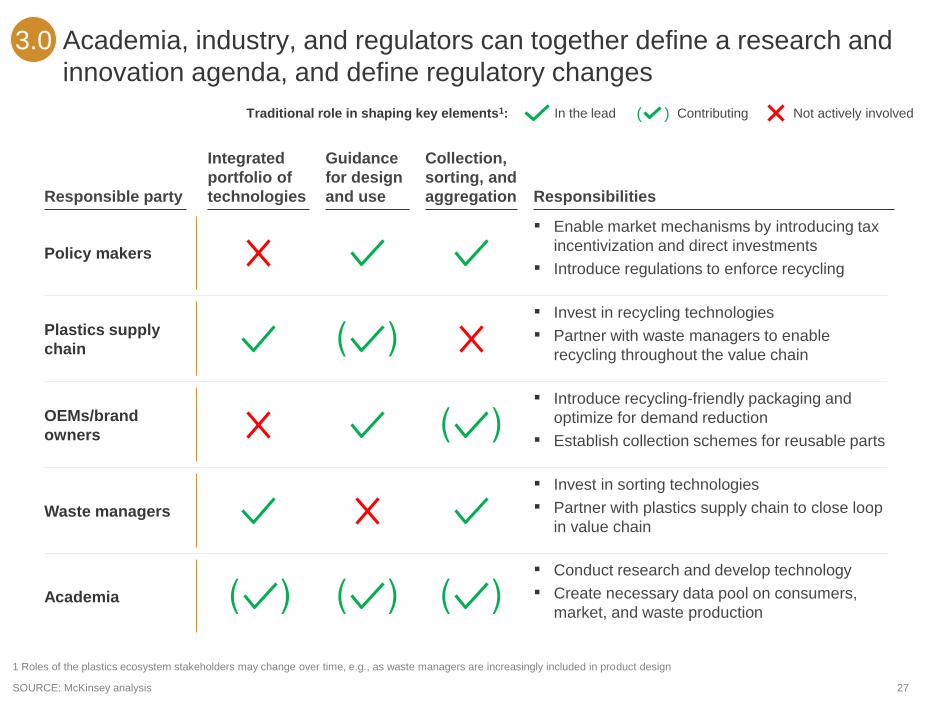
Academia, industry, and regulators can together define a research and
innovation agenda, and define regulatory changes
SOURCE: McKinsey analysis
1 Roles of the plastics ecosystem stakeholders may change over time, e.g., as waste managers are increasingly included in product design
3.0
Traditional role in shaping key elements1: Not actively involvedContributing( )In the lead
Responsible party
Guidance
for design
and use
Integrated
portfolio of
technologies
Collection,
sorting, and
aggregation
Policy makers
Plastics supply
chain
OEMs/brand
owners
Waste managers
Responsibilities
▪ Enable market mechanisms by introducing tax
incentivization and direct investments
▪ Introduce regulations to enforce recycling
▪ Invest in recycling technologies
▪ Partner with waste managers to enable
recycling throughout the value chain
▪ Introduce recycling-friendly packaging and
optimize for demand reduction
▪ Establish collection schemes for reusable parts
▪ Invest in sorting technologies
▪ Partner with plastics supply chain to close loop
in value chain
▪ Conduct research and develop technology
▪ Create necessary data pool on consumers,
market, and waste production Academia
28
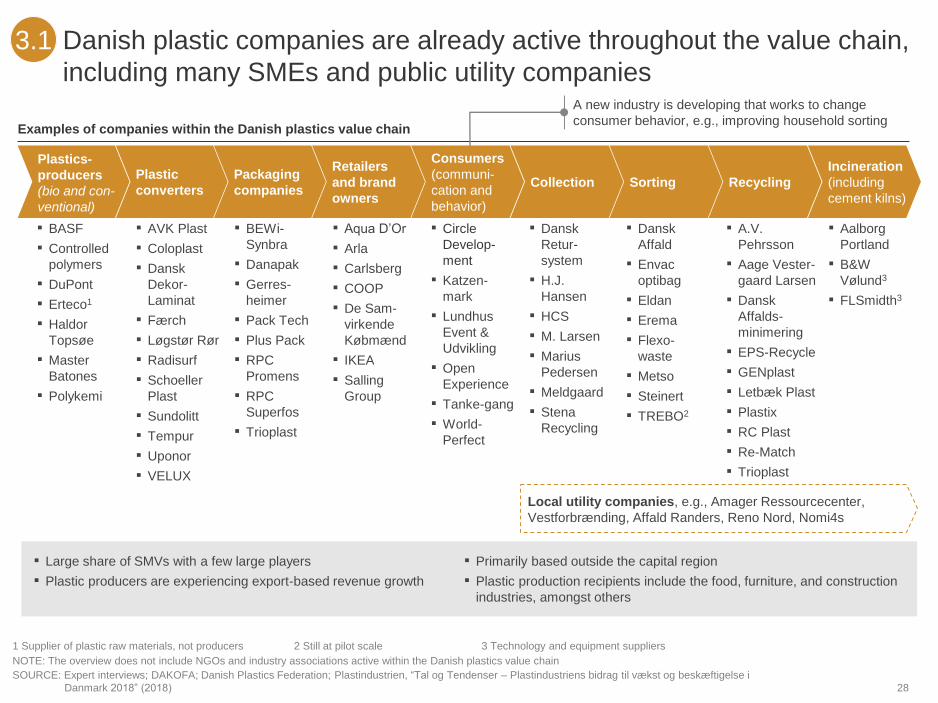
SOURCE: Expert interviews; DAKOFA; Danish Plastics Federation; Plastindustrien, “Tal og Tendenser – Plastindustriens bidrag til vækst og beskæftigelse i
Danmark 2018” (2018)
Danish plastic companies are already active throughout the value chain,
including many SMEs and public utility companies
Examples of companies within the Danish plastics value chain
A new industry is developing that works to change
consumer behavior, e.g., improving household sorting
▪ Large share of SMVs with a few large players
▪ Plastic producers are experiencing export-based revenue growth
▪ Primarily based outside the capital region
▪ Plastic production recipients include the food, furniture, and construction
industries, amongst others
▪ BASF
▪ Controlled
polymers
▪ DuPont
▪ Erteco1
▪ Haldor
Topsøe
▪ Master
Batones
▪ Polykemi
▪ AVK Plast
▪ Coloplast
▪ Dansk
Dekor-
Laminat
▪ Færch
▪ Løgstør Rør
▪ Radisurf
▪ Schoeller
Plast
▪ Sundolitt
▪ Tempur
▪ Uponor
▪ VELUX
▪ BEWi-
Synbra
▪ Danapak
▪ Gerres-
heimer
▪ Pack Tech
▪ Plus Pack
▪ RPC
Promens
▪ RPC
Superfos
▪ Trioplast
▪ Aqua D’Or
▪ Arla
▪ Carlsberg
▪ COOP
▪ De Sam-
virkende
Købmænd
▪ IKEA
▪ Salling
Group
▪ Circle
Develop-
ment
▪ Katzen-
mark
▪ Lundhus
Event &
Udvikling
▪ Open
Experience
▪ Tanke-gang
▪ World-
Perfect
▪ Dansk
Retur-
system
▪ H.J.
Hansen
▪ HCS
▪ M. Larsen
▪ Marius
Pedersen
▪ Meldgaard
▪ Stena
Recycling
▪ Dansk
Affald
▪ Envac
optibag
▪ Eldan
▪ Erema
▪ Flexo-
waste
▪ Metso
▪ Steinert
▪ TREBO2
▪ A.V.
Pehrsson
▪ Aage Vester-
gaard Larsen
▪ Dansk
Affalds-
minimering
▪ EPS-Recycle
▪ GENplast
▪ Letbæk Plast
▪ Plastix
▪ RC Plast
▪ Re-Match
▪ Trioplast
▪ Aalborg
Portland
▪ B&W
Vølund3
▪ FLSmidth3
Plastic
converters
Plastics-
producers
(bio and con-
ventional)
Collection Sorting
Incineration
(including
cement kilns)
RecyclingPackaging
companies
Consumers
(communi-
cation and
behavior)
Retailers
and brand
owners
Local utility companies, e.g., Amager Ressourcecenter,
Vestforbrænding, Affald Randers, Reno Nord, Nomi4s
3.1
1 Supplier of plastic raw materials, not producers 2 Still at pilot scale 3 Technology and equipment suppliers
NOTE: The overview does not include NGOs and industry associations active within the Danish plastics value chain
29
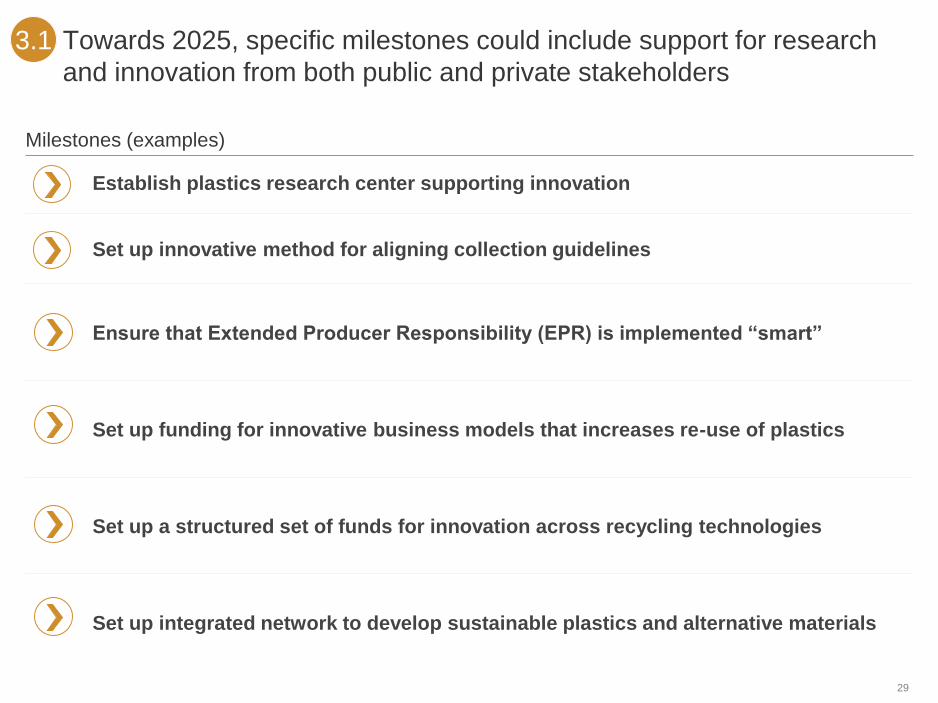
Towards 2025, specific milestones could include support for research
and innovation from both public and private stakeholders
3.1
Milestones (examples)
▪ Establish plastics research center supporting innovation
▪ Set up innovative method for aligning collection guidelines
▪ Set up funding for innovative business models that increases re-use of plastics
▪ Ensure that Extended Producer Responsibility (EPR) is implemented “smart”
▪ Set up a structured set of funds for innovation across recycling technologies
▪ Set up integrated network to develop sustainable plastics and alternative materials

30
Milestones should be based on relevant context and with an output that
supports the Danish vision
3.1
Milestone (example) Context OutputKey actions
▪ A national plastics center is
part of 2018 Danish plastics
strategy
▪ Acknowledgement of lacking
data on plastics in Denmark
▪ Danish research, data, and
knowledge on plastics have
significantly improved by 2022
▪ Identify feasible focus based on Danish capabilities
▪ Include stakeholders outside academia to challenge
agenda
▪ Include financing from private companies to ensure all
participants have a stake in ensuring a good outcome
Establish plastics
research center
supporting
innovation
Set up innovative
method for aligning
collection guidelines
Set up funding for
innovative business
models that increase
re-use of plastics
Ensure that Extended
Producer
Responsibility (EPR)
is implemented
“smart”
Set up a structured
set of funds for
innovation across
recycling
technologies
Set up integrated
network to develop
sustainable plastics
and alternative
materials
▪ Alignment of collection criteria
and system is part of the 2018
Danish plastics strategy
▪ Innovative method for identifying
feasible collection guidelines and
system
▪ Clear timeline towards a national
collection guidelines and system
▪ Set up cross-municipal agile team to identify relevant
set-up
▪ Include and develop digital methods for feasibility
analysis
▪ Create depreciation timeline for existing facilities
▪ Increased reuse of plastics
decreases plastics waste, a
necessary part of meeting EU
2025 and 2030 recycling
targets
▪ Decrease in plastics waste
▪ Decrease in resource demand
▪ Recycling at highest value point
▪ Export potential from innovative
business models
▪ Set up funding committee including external investors
from the industry
▪ Support scaling of pilot projects that have proved
successful in “closing loop”
▪ Include financing from private companies
▪ EPR be implemented across
the EU for packaging and
cigarette butts
▪ Develop state-of-the-art method for
implementing EPR
▪ Increased recycling rate
▪ Identify areas where regulation will have most impact
in terms of pollution, consumption, and recycling,
respectively
▪ Set up framework to weigh business impact against
environmental impact
▪ Full recycling of plastics in
Denmark require a
development across the
portfolio of recycling
technologies
▪ Increased recycling rate
▪ Improved outcome of recycling
process
▪ Export potential from technology
development
▪ Set up funding committee including external investors
from the industry
▪ Aim to develop technologies across recycling portfolio
at various maturity levels
▪ Include financing from private companies
▪ Based on existing industry,
Denmark can develop high-
value niche applications of
sustainable plastics to curb
CO2 emissions from plastics
▪ New innovation areas for the Danish
industry
▪ Industry leadership in sustainable
plastics and alternative materials
▪ Identify network partners across established
companies, startups, public organizations, and
academia
▪ Partners must pledge to provide expertise, facilities,
and funding for projects
NOTE: See appendix for a more detailed description of Extended Producer Responsibility
See next page for examples of research areas, e.g, as focus areas under milestone 3,4, and 5
1
2
3
4
5
6
31
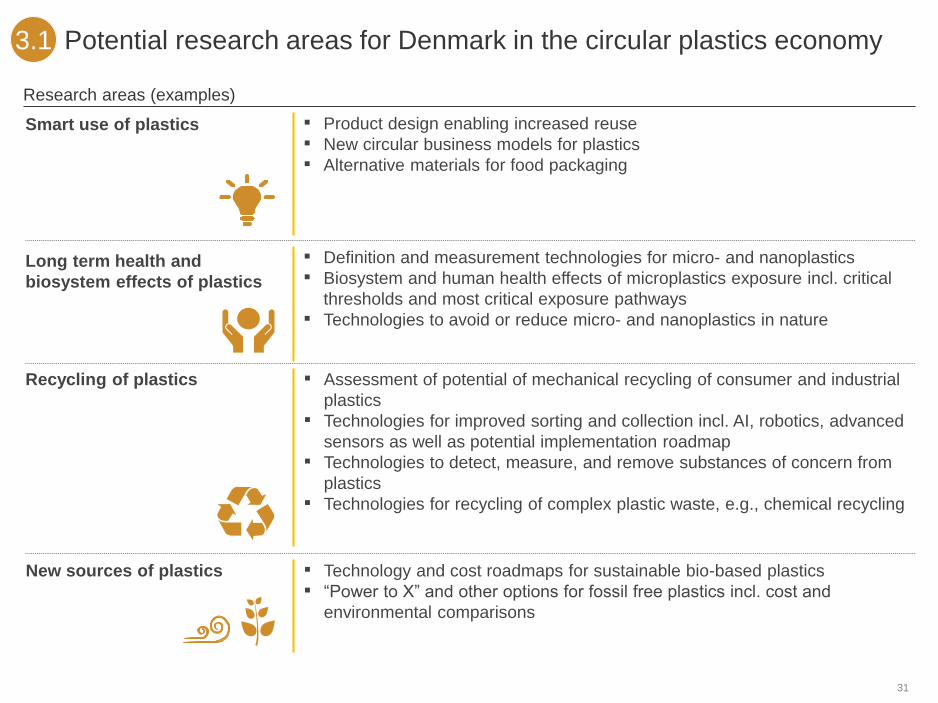
Potential research areas for Denmark in the circular plastics economy3.1
Research areas (examples)
Smart use of plastics ▪ Product design enabling increased reuse
▪ New circular business models for plastics
▪ Alternative materials for food packaging
Long term health and
biosystem effects of plastics
▪ Definition and measurement technologies for micro- and nanoplastics
▪ Biosystem and human health effects of microplastics exposure incl. critical
thresholds and most critical exposure pathways
▪ Technologies to avoid or reduce micro- and nanoplastics in nature
Recycling of plastics
New sources of plastics
▪ Assessment of potential of mechanical recycling of consumer and industrial
plastics
▪ Technologies for improved sorting and collection incl. AI, robotics, advanced
sensors as well as potential implementation roadmap
▪ Technologies to detect, measure, and remove substances of concern from
plastics
▪ Technologies for recycling of complex plastic waste, e.g., chemical recycling
▪ Technology and cost roadmaps for sustainable bio-based plastics
▪ “Power to X” and other options for fossil free plastics incl. cost and
environmental comparisons

32
Additional critical knowledge gaps remain regarding plastics, that also
requires further research
3.1
SOURCE: World Bank “What a Waste 2.0” (2018); R. Geyer et al. “Production, use, and fate of all plastics ever made” (2017); Greenpeace “Branded” (2018); The Danish
Environmental Protection Agency “Microplastics – Occurrence, effects and sources of releases to the environment in Denmark” (2015); European Commission “Factsheet,
Microplastics – focus on food and health” (2017); Lenz, Enders, Nielsen “Microplastic exposure studies should be environmentally realistic” (2016); Gall and Thompson
“The impact of debris on marine life” (2015); Wilcox, Sebille, and Hardesty “Threat of Plastic Pollution to seabirds is global, pervasive and increasing” (2015); UNEP
“Valuing Plastic” (2014); The Scottish Government “Marine Litter Issues, Impacts and Actions” (2012); Ellen MacArthur Foundation and McKinsey & Company “New
Plastics Economy” (2016); Ocean Conservancy and McKinsey & Company “Stemming the Tide” (2016) McKinsey analysis
EX
AM
PL
ES
OF
KN
OW
LE
DG
E G
AP
SE
ME
RG
ING
CO
NS
EN
SU
S
▪ >500 animal species are affected by
plastic pollution
▪ Some plastic additives regulated as
SoC, e.g., phthalates and styrene
monomer
▪ Most animals and humans have
varying amounts of plastics in
intestines, e.g., ~90% of seabirds
have plastics in their intestines
▪ To sustain value, recycling should
take place as high in the recycling
hierarchy as possible – starting with
reduction of usage
▪ Mechanical recycling saves more
CO2 per kg of plastic than other
recycling technologies today
▪ Incineration has a negative CO2
balance compared to recycling
plastic and is not considered circular
▪ Main source is decomposed
macroplastics
▪ Present within organisms, including
humans and food products as well
as in nature
▪ Detrimental to small organisms at
high levels of concentration
▪ First estimation on global natural
capital cost of plastics at EUR 65
billion per year
▪ Local estimations on potential effect
of marine litter from plastics, e.g.,
EUR ~1 million at the Shetland
Islands
▪ Significant lost value from plastics
only used once, estimated to be
EUR 70-105 billion for plastic
packaging globally
▪ ~8 million tons of plastic annually
leak into the ocean, with Asia as
biggest contributor
▪ ~160 TTA of plastic waste leaked
into the ocean in the US and Europe
▪ Packaging accounts for majority of
global plastics application and
constitutes >60% of all coastal
waste
▪ Denmark incinerates more than half
of its plastics
▪ Decomposition time and process in
different ecosystems
▪ Insight on non domestic plastics
flowing onto Danish shores
▪ Detailed data on sector generation
and treatment of plastics in
Denmark
▪ Quantity of plastic waste from
ocean-based activities in global and
Danish oceans, e.g., ghost nets
▪ Definition and analytical methods for
measurement of micro- and
nanoplastics
▪ Transport in biological systems,
e.g., membranes
▪ Toxicity and other health effects of
microplastics, e.g., as vector for
bacteria and chemicals
▪ Transport and accumulation in
ecosystems, e.g., soil
▪ Adverse impact of microplastics
particles compared to other pollution
particles, e.g., soot
▪ Main sources of microplastics in
Denmark
▪ Opportunities and feasibility of
design and citizen-based innovation
to reduce consumption and improve
recycling
▪ Economics, energy requirements,
and relation to substances of
concern for recycling technologies,
e.g., pyrolysis, monomer, and
mechanical recycling
▪ Minimum and optimal scale for full
plastic recycling, e.g., is Denmark a
big enough market?
▪ Develop sustainable bio-based
plastics that are degradable in
natural environment
▪ Total economics of sorting and
collection technologies
▪ Development pipeline and
economics of plastics traceability
technologies
▪ Technologies for separation and
detection of Substances of Concern
(SoC) from plastics for recycling
▪ Wider value chain requirements to
accommodate a circular economy
▪ Routes of exposure and
quantification of animal impact
▪ Effects of ingesting plastic for larger
animals
▪ Reach and impact of SoC from
additives on ecosystems, humans,
and animals
▪ Toxicology of plastic and its
associated substances and effect
on food chain, including humans
▪ Quantification of the risk of
recirculating older plastic
generations with SoC, e.g., for
Denmark specifically
▪ Impact of plastic leakage to
ecosystem services such as natural
systems (e.g., forests and
waterways) and urban infrastructure
(e.g., sewers)
▪ Detailed socio economic
consequences of plastic pollution,
e.g., jobs lost, exported
▪ Resources spent now and in the
future on plastic clean up globally
and in Denmark
▪ General inclusion of social sciences
within plastics research needed,
e.g., in terms of changing culture on
plastics pollution
▪ Comparative effect of regulatory
tools on consumption
▪ Barriers to a circular economy in
existing regulatory setups
Microplastics
Recycling and recycling-enabling
technologies
Health and ecosystem impact of
macroplastics
Socio economic analysis and impact
of plastic pollution
Source and distribution of
plastic in nature

33
Microplastics have gained public attention over the past years, but still
constitutes a new research area with significant unknowns
40
53
67
98
163
236
20162011 12 13 1514
Microplastics have received increasing
public and academic attention
Scientific publications on microplastics
(SCOPUS)
SOURCE: The Danish Environmental Protection Agency “Microplastics – Occurrence, effects and sources of releases to the environment in Denmark” (2015);
European Commission “Factsheet, Microplastics – focus on food and health” (2017); Eunomia “Investigating options for reducing releases in the
aquatic environment of microplastics emitted by (but not intentionally added in) products” (2018)
3.1
… still, various areas remain unclear (examples)
Emerging
consensus
▪ Standard size microplastics is less than 5
mm, with some definitions including lower
threshold of 1 mm in size
▪ Microplastics are ingested by wildlife in the
ocean, e.g., fish, whales, and plankton
Open
questions
▪ Microplastics’ ability to spread from the
digestive system, e.g., ability of
microplastics to transfer through membranes
due to their small size
▪ Dissemination of microplastics in food and
beverage products, e.g., source or origin of
microplastics measured in honey
▪ Degree to which microplastics act as a
vector, e.g., for chemicals and bacteria,
resulting in contamination of host organisms
▪ Largest sources of primary and secondary
microplastics
34
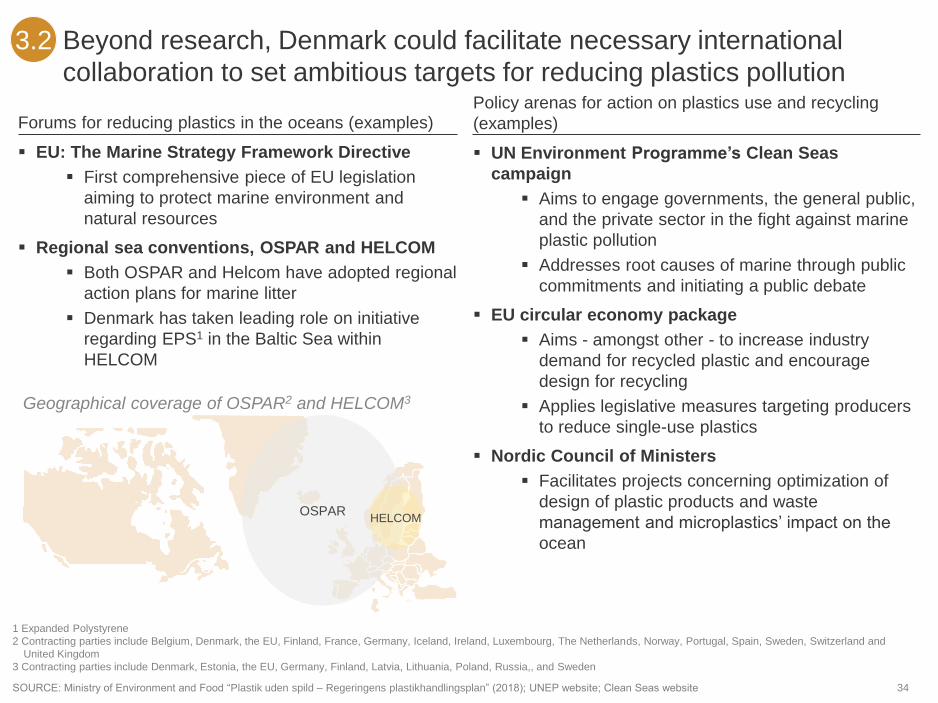
Beyond research, Denmark could facilitate necessary international
collaboration to set ambitious targets for reducing plastics pollution
SOURCE: Ministry of Environment and Food “Plastik uden spild – Regeringens plastikhandlingsplan” (2018); UNEP website; Clean Seas website
3.2
Policy arenas for action on plastics use and recycling
(examples)
▪ UN Environment Programme’s Clean Seas
campaign
▪ Aims to engage governments, the general public,
and the private sector in the fight against marine
plastic pollution
▪ Addresses root causes of marine through public
commitments and initiating a public debate
▪ EU circular economy package
▪ Aims - amongst other - to increase industry
demand for recycled plastic and encourage
design for recycling
▪ Applies legislative measures targeting producers
to reduce single-use plastics
▪ Nordic Council of Ministers
▪ Facilitates projects concerning optimization of
design of plastic products and waste
management and microplastics’ impact on the
ocean
Forums for reducing plastics in the oceans (examples)
▪ EU: The Marine Strategy Framework Directive
▪ First comprehensive piece of EU legislation
aiming to protect marine environment and
natural resources
▪ Regional sea conventions, OSPAR and HELCOM
▪ Both OSPAR and Helcom have adopted regional
action plans for marine litter
▪ Denmark has taken leading role on initiative
regarding EPS1 in the Baltic Sea within
HELCOM
Geographical coverage of OSPAR2 and HELCOM3
OSPARHELCOM
1 Expanded Polystyrene
2 Contracting parties include Belgium, Denmark, the EU, Finland, France, Germany, Iceland, Ireland, Luxembourg, The Netherlands, Norway, Portugal, Spain, Sweden, Switzerland and
United Kingdom
3 Contracting parties include Denmark, Estonia, the EU, Germany, Finland, Latvia, Lithuania, Poland, Russia,, and Sweden
35
In the medium term, Denmark has to
meet the EU 2030 targets and could drive
innovation in waste collection along with
consumption reduction
four1. The EU’s target for recycling plastic
packaging is 55% by 2030. Denmark
currently achieves less than a third of
this. A first step to reaching it can be for
municipalities to align their criteria for
collecting waste, to eliminate today’s
inefficiency. Meeting the target also
requires decreasing consumption and
creation of waste, specifically of
plastics that are difficult to recycle. This
can, for example, include scaling up
pilot projects that can successfully
increase reuse of plastics
2. There is great scope for innovation. For
example, we could improve collection
and sorting by using AI and advanced
sensors, as well as continue to improve
on recycling technologies. Additional
innovation potential lies in developing
new products and materials that can be
reused and repaired, or new business
models that enables using less plastic
36
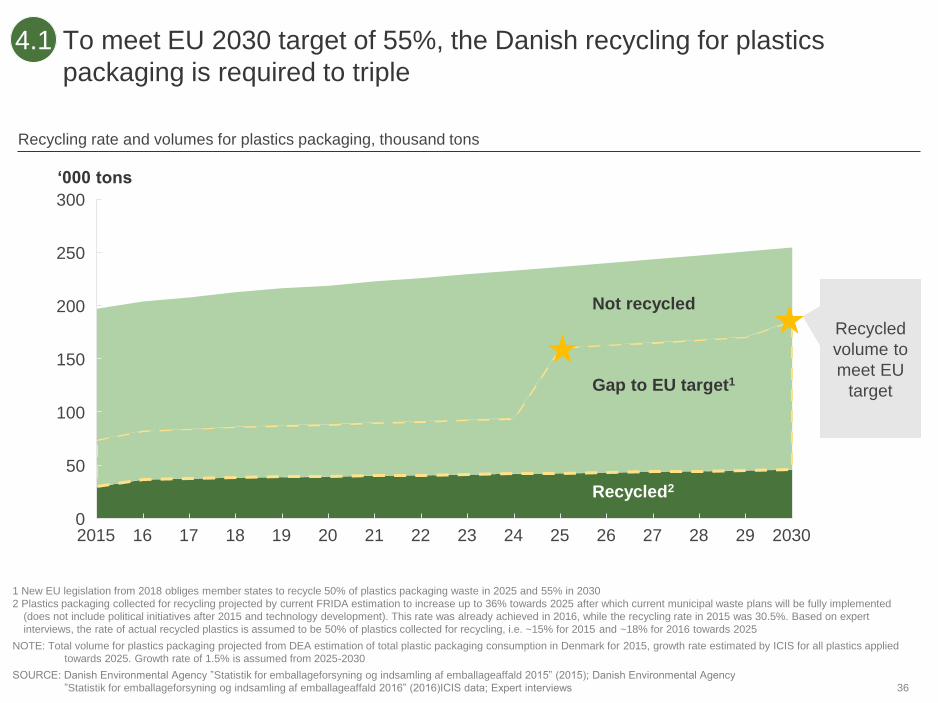
To meet EU 2030 target of 55%, the Danish recycling for plastics
packaging is required to triple
4.1
SOURCE: Danish Environmental Agency ”Statistik for emballageforsyning og indsamling af emballageaffald 2015” (2015); Danish Environmental Agency
”Statistik for emballageforsyning og indsamling af emballageaffald 2016” (2016)ICIS data; Expert interviews
Recycling rate and volumes for plastics packaging, thousand tons
100
150
0
250
50
300
200
2015 16 17 18 19 20 21 242322 20302725 26 28 29
Not recycled
Gap to EU target1
Recycled2
Recycled
volume to
meet EU
target
‘000 tons
1 New EU legislation from 2018 obliges member states to recycle 50% of plastics packaging waste in 2025 and 55% in 2030
2 Plastics packaging collected for recycling projected by current FRIDA estimation to increase up to 36% towards 2025 after which current municipal waste plans will be fully implemented
(does not include political initiatives after 2015 and technology development). This rate was already achieved in 2016, while the recycling rate in 2015 was 30.5%. Based on expert
interviews, the rate of actual recycled plastics is assumed to be 50% of plastics collected for recycling, i.e. ~15% for 2015 and ~18% for 2016 towards 2025
NOTE: Total volume for plastics packaging projected from DEA estimation of total plastic packaging consumption in Denmark for 2015, growth rate estimated by ICIS for all plastics applied
towards 2025. Growth rate of 1.5% is assumed from 2025-2030

37
Compared to European peers, Denmark ranks low for plastics
packaging collected for recycling
SOURCE: PlasticsEurope: Plastics – the Facts (2017); Plastindustrien, “Så meget plastik genbruges i Danmark” (2018); Ellen MacArthur Foundation and McKinsey &
Company ”Potential for Denmark as a Circular Economy, Case Study from: Delivering The Circular Economy – A Toolkit For Policy Makers” (2015)
4.1
Proportion of plastic packaging waste collected for recycling per European country(2016),
percent
40%20% 60%0%
Slovakia Estonia
Czech RepublicGermanyNetherlandsSweden Ireland
Belgium
Spain
Austria
UK
Slovenia
NorwayPortugal
Denmark
LatviaItalyPoland LuxembourgLithuania
Greece
Cyprus
Finland
Bulgaria
Switzerland
RomaniaCroatia HungaryMalta
France
Denmark collects less
plastic packaging waste
for recycling than
European peers▪ Large waste incineration
overcapacity has limited
the incentive to switch
waste volumes to
recycling
▪ Industry is the main
contributor to plastics
packaging recycling and
collects ~64% for
recycling, compared to
households that recycle
~15%
38
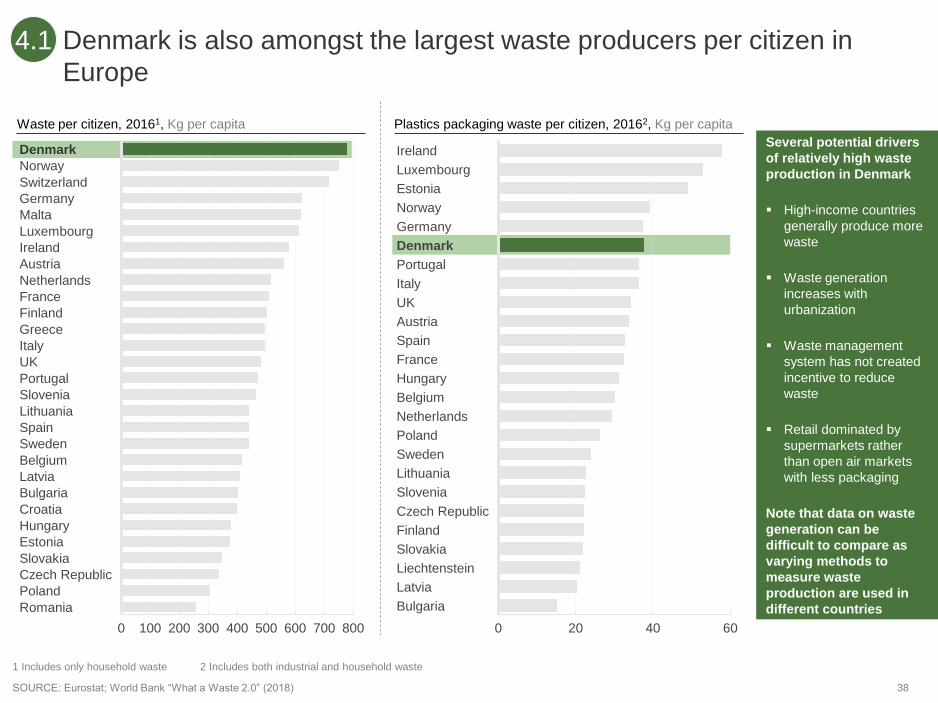
Denmark is also amongst the largest waste producers per citizen in
Europe
0 6020 40
Ireland
Estonia
Sweden
UK
Luxembourg
Norway
Germany
France
Italy
Denmark
Portugal
Austria
Spain
Bulgaria
Hungary
Belgium
Netherlands
Poland
Lithuania
Slovakia
Slovenia
Czech Republic
Finland
Liechtenstein
Latvia
8007006002000 100 300 400 500
Latvia
Norway
Austria
Spain
Denmark
Slovakia
Switzerland
Poland
Germany
UK
Malta
Luxembourg
Belgium
Ireland
Netherlands
France
Slovenia
Greece
Finland
Italy
Portugal
Lithuania
Sweden
Bulgaria
Croatia
Hungary
Romania
Estonia
Czech Republic
Plastics packaging waste per citizen, 20162, Kg per capitaWaste per citizen, 20161, Kg per capita
1 Includes only household waste 2 Includes both industrial and household waste
SOURCE: Eurostat; World Bank “What a Waste 2.0” (2018)
Several potential drivers
of relatively high waste
production in Denmark
▪ High-income countries
generally produce more
waste
▪ Waste generation
increases with
urbanization
▪ Waste management
system has not created
incentive to reduce
waste
▪ Retail dominated by
supermarkets rather
than open air markets
with less packaging
Note that data on waste
generation can be
difficult to compare as
varying methods to
measure waste
production are used in
different countries
4.1

39
Germany has developed an exemplary system with 45% of plastics
waste collected for recycling
SOURCE: IHS Chemical Economics Handbook (2016); Plastic Europe (2017); US Environmental Protection Agency (2016); Conversio (2016); Consultic,
Umweltbundesamt; CPCB India – PWM Report; web search; McKinsey analysis
Very strong activity Some activity No notable activityIndicative assessment:
1 Includes waste management players, pure recyclers and compounders, and virgin plastic producers
2 2015 figures for Germany, 2014 for France
3 Mechanical recycling could include recycling outside of Germany (export)
44
21
453
20
10
Mechanical Monomer Feedstock
▪ Recycling
differences are
driven by
regulation
▪ Plastics players
have taken little
initiative to reshape
recycling
▪ There is a lack of
economic
consequences for
producers and
suitable business
cases
▪ Brand owners only
step up where
consumers are
aware of plastic-
related problems
Realized activity to increase plastic recycling to date
Plastics collected for value
recovery 2017, percent
Plastics
value chain1 Key take-awaysConsumers
Policy
makers
Waste
managers
Key initiatives to push plastics recycling
▪ Regulate
▪ Educate
▪ Innovate
▪ Integrate
▪ Influence
▪ Purchase
recyclables
▪ Separate
waste
▪ Consolidate
▪ Integrate
▪ Innovate
▪ Design for
recyclability
▪ Increase recy-
cled content
Brand owners
Similar across
3 countries
Some advances
from global
players
Germany2
Japan
China
United
States
France2
4.1
40
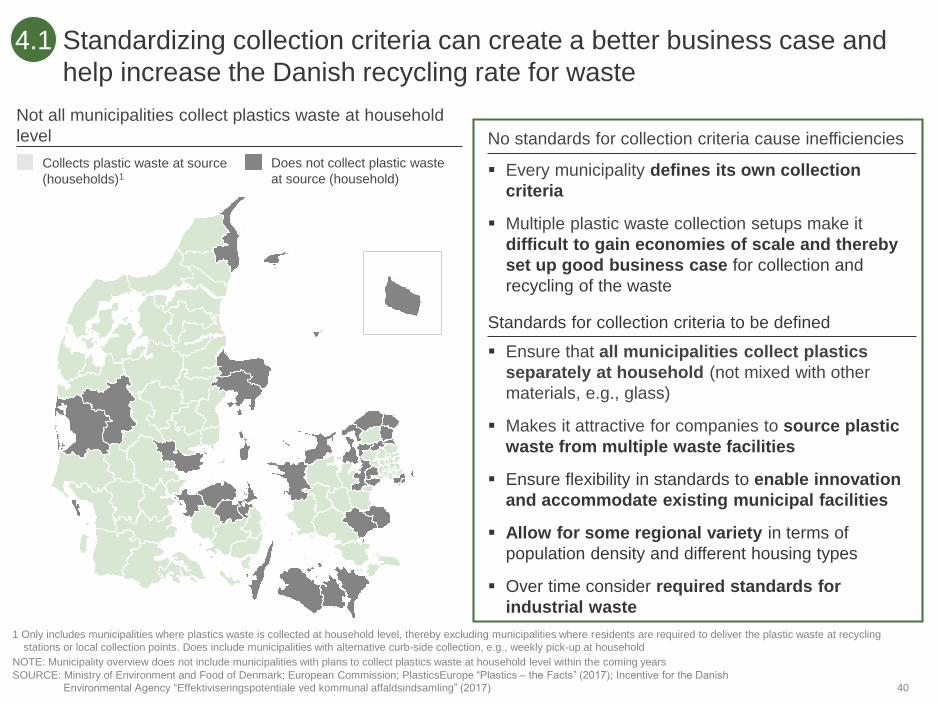
Standardizing collection criteria can create a better business case and
help increase the Danish recycling rate for waste
SOURCE: Ministry of Environment and Food of Denmark; European Commission; PlasticsEurope “Plastics – the Facts” (2017); Incentive for the Danish
Environmental Agency “Effektiviseringspotentiale ved kommunal affaldsindsamling” (2017)
Standards for collection criteria to be defined
▪ Ensure that all municipalities collect plastics
separately at household (not mixed with other
materials, e.g., glass)
▪ Makes it attractive for companies to source plastic
waste from multiple waste facilities
▪ Ensure flexibility in standards to enable innovation
and accommodate existing municipal facilities
▪ Allow for some regional variety in terms of
population density and different housing types
▪ Over time consider required standards for
industrial waste
No standards for collection criteria cause inefficiencies
▪ Every municipality defines its own collection
criteria
▪ Multiple plastic waste collection setups make it
difficult to gain economies of scale and thereby
set up good business case for collection and
recycling of the waste
Not all municipalities collect plastics waste at household
level
Does not collect plastic waste
at source (household)
Collects plastic waste at source
(households)1
4.1
1 Only includes municipalities where plastics waste is collected at household level, thereby excluding municipalities where residents are required to deliver the plastic waste at recycling
stations or local collection points. Does include municipalities with alternative curb-side collection, e.g., weekly pick-up at household
NOTE: Municipality overview does not include municipalities with plans to collect plastics waste at household level within the coming years

41
Source separation allows for consistently high recycling rates compared
to other sorting approaches
SOURCE: European Commission DG ENV, Brussels; Waste & Resources Action Programme; Consultic; McKinsey analysis
1 2014 figures
4.1
▪ With regard to recycling rates, source separation seems to be a promising approach
▪ When deriving the ideal collection and sorting approach, acceptance from citizens for separation and drop-off as
well as a minimum waste stream size for collection efficiency needs to be considered
Description
Plastics collection and sorting
Recycling rates1
▪ Residents are required to
deliver the waste to
collection sites
▪ Can be sorted or comingled
Collection
sites
▪ 37% (sorted)
▪ 24-33%
(2 fractions)
▪ Partial sorting of materials
into multiple containers
▪ Subsequent sorting of
materials at materials
recovery facility (MRF)
▪ 13-37%
▪ Source separation and
collection of plastics at
curbside
▪ Collection vehicle has
different compartments
▪ 27-33%
Evaluation
▪ Reduced collection effort
▪ Higher acceptance by
residents required
▪ Easier separation at MRF
(reduced potential for
materials to bind together)
▪ Increased collection
efficiency
▪ Allows for contamination
to be filtered out at the
point of collection
▪ Lowest sorting effort in
MRF
▪ Quality dependent on
capacity and capability of
MRF
▪ Lowest dependency on
residents’ behavior
▪ Collection of comingled
materials in a single
compartment vehicle
▪ Sorting of materials at
materials recovery facility
Multiple
streams
comingled
Source/
curbside
sorting
Single
stream
comingled
▪ 20-37%
Example countries
Cu
rbs
ide
co
lle
cti
on
42
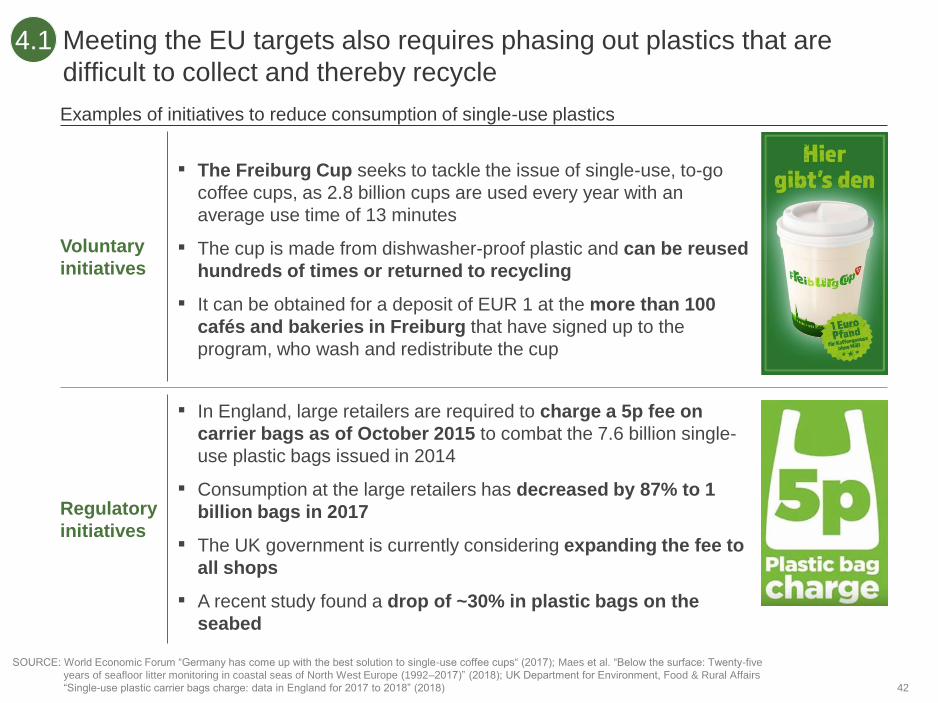
Meeting the EU targets also requires phasing out plastics that are
difficult to collect and thereby recycle
SOURCE: World Economic Forum “Germany has come up with the best solution to single-use coffee cups“ (2017); Maes et al. “Below the surface: Twenty-five
years of seafloor litter monitoring in coastal seas of North West Europe (1992–2017)” (2018); UK Department for Environment, Food & Rural Affairs
“Single-use plastic carrier bags charge: data in England for 2017 to 2018” (2018)
4.1
Examples of initiatives to reduce consumption of single-use plastics
Voluntary
initiatives
Regulatory
initiatives
▪ The Freiburg Cup seeks to tackle the issue of single-use, to-go
coffee cups, as 2.8 billion cups are used every year with an
average use time of 13 minutes
▪ The cup is made from dishwasher-proof plastic and can be reused
hundreds of times or returned to recycling
▪ It can be obtained for a deposit of EUR 1 at the more than 100
cafés and bakeries in Freiburg that have signed up to the
program, who wash and redistribute the cup
▪ In England, large retailers are required to charge a 5p fee on
carrier bags as of October 2015 to combat the 7.6 billion single-
use plastic bags issued in 2014
▪ Consumption at the large retailers has decreased by 87% to 1
billion bags in 2017
▪ The UK government is currently considering expanding the fee to
all shops
▪ A recent study found a drop of ~30% in plastic bags on the
seabed

43
Plastic consumption can be further decreased by scaling up pilot
projects that aim to increase re-use of plastic products
SOURCE: Plastic Change; Company websites
4.1
Examples of successful local pilot projects
Closed loop for plastic cups and crates at NorthSideFestival
▪ Closed loop setup for plastics packaging, e.g., by using
reusable cups and crates for beverages
▪ Plastic cups were recycled to be used at the festival the
following year as plates for food, which was well
received by the festival audience
▪ Funded by the Ministry of Food and Environment
Reusable cups in Tivoli
▪ Deposit system for all plastic cups and mugs that uses
“reverse” vending machines, that gives the deposit back
to the consumers
▪ All returned cups and mugs are washed in Tivoli’s own
facilities to quickly get them back into circulation
▪ Through its reusable cup system, Tivoli has saved 1.2
million single-use cups and mugs
Potential of local pilot projects
▪ Local pilot projects enable
testing new concepts, e.g.,
new product designs, new
infrastructure, deposit
incentives, and value chain
collaborations
▪ Larger events - such as
festivals - with large food and
beverage demand provide a
setup for pilots to reduce
single-use packaging
▪ Other setups can be shaped
around geographical areas or
institutions, e.g., universities
44
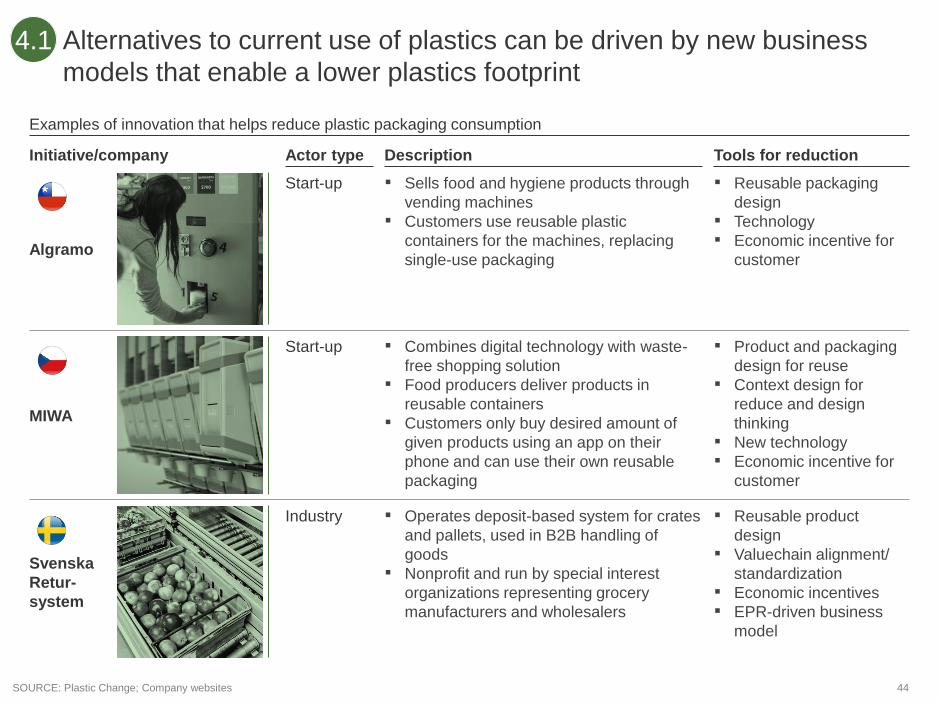
Alternatives to current use of plastics can be driven by new business
models that enable a lower plastics footprint
4.1
SOURCE: Plastic Change; Company websites
Examples of innovation that helps reduce plastic packaging consumption
Algramo
MIWA
Svenska
Retur-
system
Actor type
Industry
Start-up
Start-up
Tools for reductionInitiative/company
▪ Reusable product
design
▪ Valuechain alignment/
standardization
▪ Economic incentives
▪ EPR-driven business
model
▪ Reusable packaging
design
▪ Technology
▪ Economic incentive for
customer
▪ Product and packaging
design for reuse
▪ Context design for
reduce and design
thinking
▪ New technology
▪ Economic incentive for
customer
Description
▪ Sells food and hygiene products through
vending machines
▪ Customers use reusable plastic
containers for the machines, replacing
single-use packaging
▪ Combines digital technology with waste-
free shopping solution
▪ Food producers deliver products in
reusable containers
▪ Customers only buy desired amount of
given products using an app on their
phone and can use their own reusable
packaging
▪ Operates deposit-based system for crates
and pallets, used in B2B handling of
goods
▪ Nonprofit and run by special interest
organizations representing grocery
manufacturers and wholesalers

45
There is innovation potential all along the value chain, both in
production, use, and waste management of plastics (incl. recycling)
4.2
Production
Potential areas of innovation for plastics
▪ Design for increased reuse and recyclability
▪ Design to avoid product itself or parts of it ending up in nature
▪ Sustainable alternative plastics materials, e.g., from biomass
▪ Application of renewable plastics in niche applications
Use ▪ Business models to incentivize use of reusable packaging
▪ Closed-loop models for reuse, e.g., cups and pallets
Waste
management
▪ Mechanical recycling technologies
▪ Chemical recycling for specific low-value plastics
▪ Recognition ability of sorting technologies, e.g., optical sorting or AI
▪ Sorting for difficult waste streams, e.g., through robotics
▪ Methods for traceability of plastics, e.g., chemical markers
▪ Biological methods for degradation of plastics
▪ Technologies for tracking and removing additives

46
There are several points of innovation within design to be leveraged
based on the strong Danish design tradition
SOURCE: Expert interviews; State of Green “Circular Economy – Denmark as a Circular Economy hub” (2016); Ministry of Environment and Food, and Ministry
of Industry, Business, and Financial Affairs “Strategi for Cirkulær Økonomi” (2018)
4.2
Innovation within design can improve sustainability in
each phase of the plastics lifecycle
Sourcing
Production
Use
Collection &
sorting
Recycling
Plastics lifecycle
▪ Design choices enable high value recycling
– Capabilities in making smarter design and material choices
are in demand, as companies look to decrease risk of
negative environmental impact
– Materials and design prolongs lifetime of plastic
products
– The Danish design tradition is characterized by a focus on
quality and long-term sustainability, e.g., in furniture design
▪ System design enables innovative solutions
– Collaboration across the value chain enables new solutions
but can be difficult, especially in countries with no or little
tradition for cross-sector collaboration
– In Denmark, we have experience with efficient system
design historically (e.g., district heating) which we can
apply to new systems as well as export for other economies
▪ Application generates increased value
– Untapped potential in applying recycled high-quality
plastics to new applications, where high-quality plastics
would otherwise be too expensive, e.g., construction
products
– Some consumers are willing to pay more for a
sustainable product, which can be utilized through
designing high-value products from recycled plastics, e.g.,
design chairs from recycled plastics
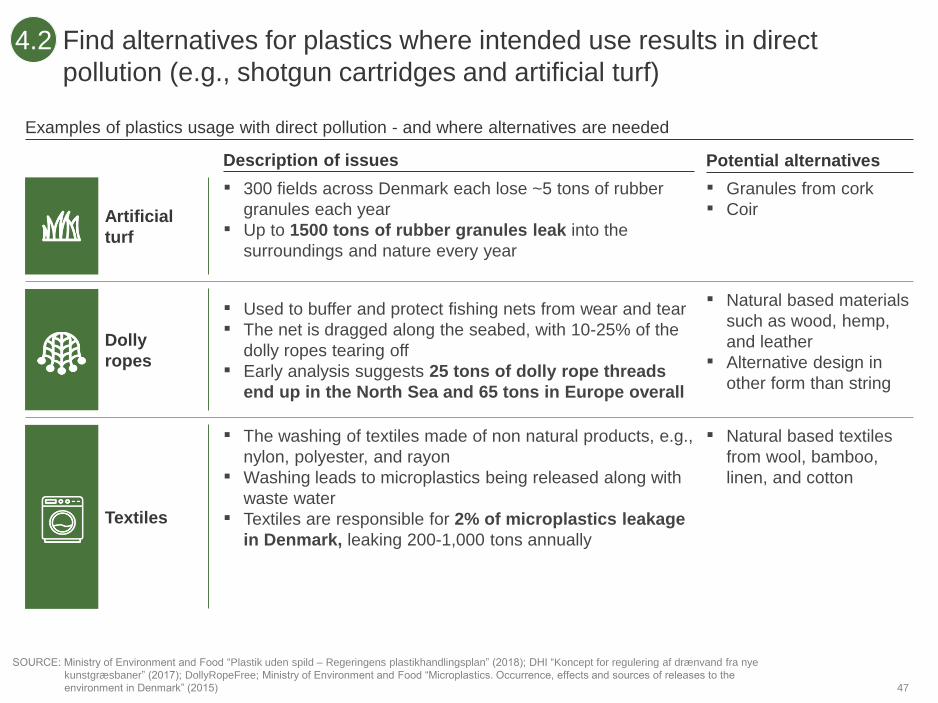
47
1. Find alternatives for plastics where intended use results in direct
pollution (e.g., shotgun cartridges and artificial turf)
4.2
SOURCE: Ministry of Environment and Food “Plastik uden spild – Regeringens plastikhandlingsplan” (2018); DHI “Koncept for regulering af drænvand fra nye
kunstgræsbaner” (2017); DollyRopeFree; Ministry of Environment and Food “Microplastics. Occurrence, effects and sources of releases to the
environment in Denmark” (2015)
Examples of plastics usage with direct pollution - and where alternatives are needed
Description of issues Potential alternatives
▪ Natural based textiles
from wool, bamboo,
linen, and cotton
▪ The washing of textiles made of non natural products, e.g.,
nylon, polyester, and rayon
▪ Washing leads to microplastics being released along with
waste water
▪ Textiles are responsible for 2% of microplastics leakage
in Denmark, leaking 200-1,000 tons annually
▪ Natural based materials
such as wood, hemp,
and leather
▪ Alternative design in
other form than string
▪ Used to buffer and protect fishing nets from wear and tear
▪ The net is dragged along the seabed, with 10-25% of the
dolly ropes tearing off
▪ Early analysis suggests 25 tons of dolly rope threads
end up in the North Sea and 65 tons in Europe overall
▪ Granules from cork
▪ Coir
▪ 300 fields across Denmark each lose ~5 tons of rubber
granules each year
▪ Up to 1500 tons of rubber granules leak into the
surroundings and nature every year
Artificial
turf
Dolly
ropes
Textiles
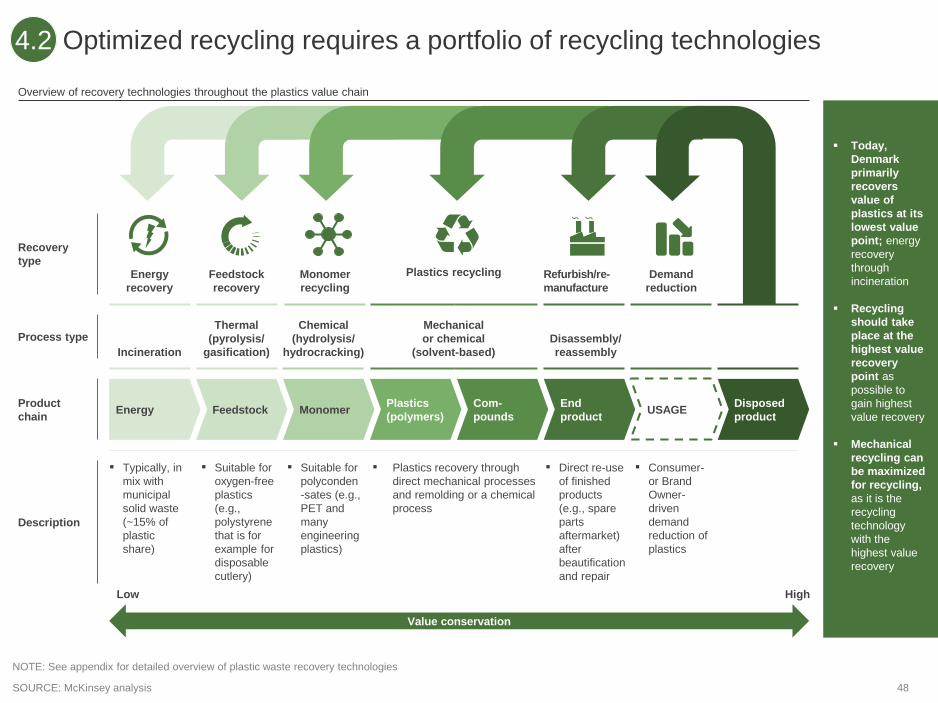
48
Optimized recycling requires a portfolio of recycling technologies
SOURCE: McKinsey analysis
4.2
▪ Today,
Denmark
primarily
recovers
value of
plastics at its
lowest value
point; energy
recovery
through
incineration
▪ Recycling
should take
place at the
highest value
recovery
point as
possible to
gain highest
value recovery
▪ Mechanical
recycling can
be maximized
for recycling,
as it is the
recycling
technology
with the
highest value
recovery
Refurbish/re-
manufacture
Monomer
recycling
Plastics recyclingFeedstock
recovery
Demand
reduction
Energy
recovery
Recovery
type
Product
chainEnergy Feedstock Monomer
Plastics
(polymers)
Com-
pounds
End
productUSAGE
Disposed
product
Process type
Incineration
Thermal
(pyrolysis/
gasification)
Chemical
(hydrolysis/
hydrocracking)
Mechanical
or chemical
(solvent-based)
Disassembly/
reassembly
▪ Direct re-use
of finished
products
(e.g., spare
parts
aftermarket)
after
beautification
and repair
▪ Consumer-
or Brand
Owner-
driven
demand
reduction of
plastics
▪ Plastics recovery through
direct mechanical processes
and remolding or a chemical
process
▪ Suitable for
polyconden
-sates (e.g.,
PET and
many
engineering
plastics)
▪ Suitable for
oxygen-free
plastics
(e.g.,
polystyrene
that is for
example for
disposable
cutlery)
▪ Typically, in
mix with
municipal
solid waste
(~15% of
plastic
share)
Description
High
Overview of recovery technologies throughout the plastics value chain
Value conservation
Low
NOTE: See appendix for detailed overview of plastic waste recovery technologies
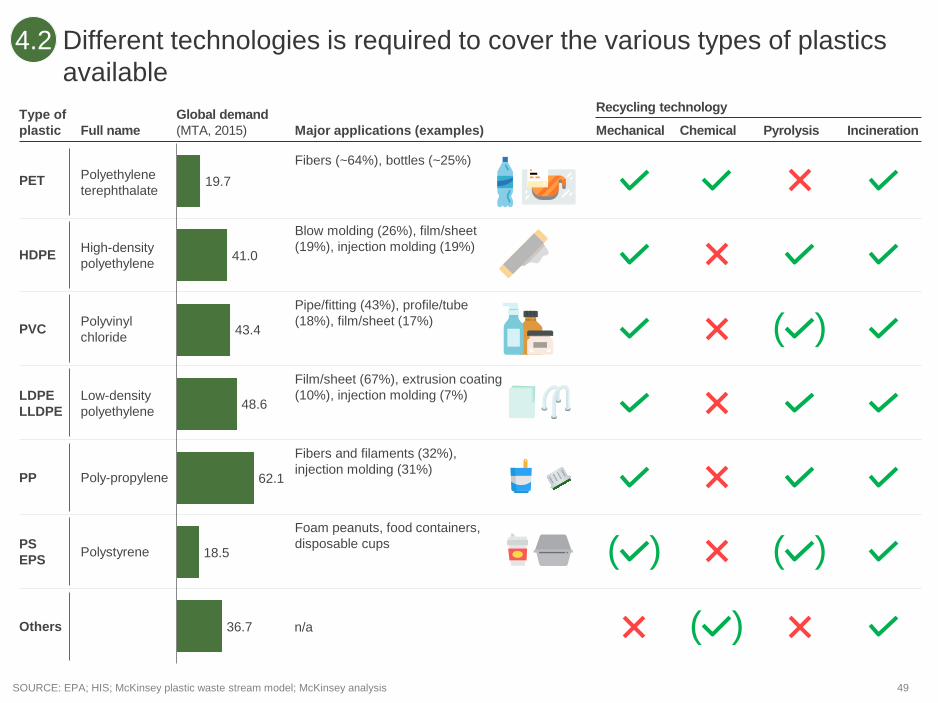
49
Different technologies is required to cover the various types of plastics
available
Global demand
(MTA, 2015)Full name
Poly-propylene
Low-density
polyethylene
High-density
polyethylene
Polystyrene
Polyethylene
terephthalate
Polyvinyl
chloride
48.6
43.4
19.7
18.5
41.0
62.1
36.7
SOURCE: EPA; HIS; McKinsey plastic waste stream model; McKinsey analysis
4.2
Type of
plastic
PP
LDPE
LLDPE
HDPE
PS
EPS
PVC
Others
PET
n/a
( )
( )
( )
( )
Major applications (examples)
Fibers and filaments (32%),
injection molding (31%)
Film/sheet (67%), extrusion coating
(10%), injection molding (7%)
Blow molding (26%), film/sheet
(19%), injection molding (19%)
Foam peanuts, food containers,
disposable cups
Pipe/fitting (43%), profile/tube
(18%), film/sheet (17%)
Fibers (~64%), bottles (~25%)
Mechanical Chemical Pyrolysis Incineration
Recycling technology

50SOURCE: McKinsey analysis
A portfolio of recycling technologies could be implemented and
integrated by current participants within the plastics value chain
4.2
Downstream oil and gas Intermediates producers Plastic producers OEMs Municipalities/utilities
A fully integrated recycling system, bringing together all relevant technologies
Return scheme
Durables
Refurbish
Crude
fraction
For distribution
Direct back
to plastics Virgin High
value
Condensates
PO waste
Low-value
plastic
POs
All
Energy
Heat
Fuel
fraction
Conden-
sate waste
Low-value
plastic Other
waste
Mixed
waste
Source
separated
Durable and
nondurable
waste collection
Distributed
pyrolysisLandfill
High-
value
plastic
Fuels
Fuel/fuel
blending
Oil and gas
extraction
Monomer
production
Plastic
production
Product
conversionOEM End useRefinery
Centralized
pyrolysis
Incinera-
tion
Plastic
collection,
sorting,
and
distribution
MRF1Mechanical
recycling
PET
monomer
1 Material recovery facility
NOTE: See appendix for an example of key elements in an integrated portfolio of technologies
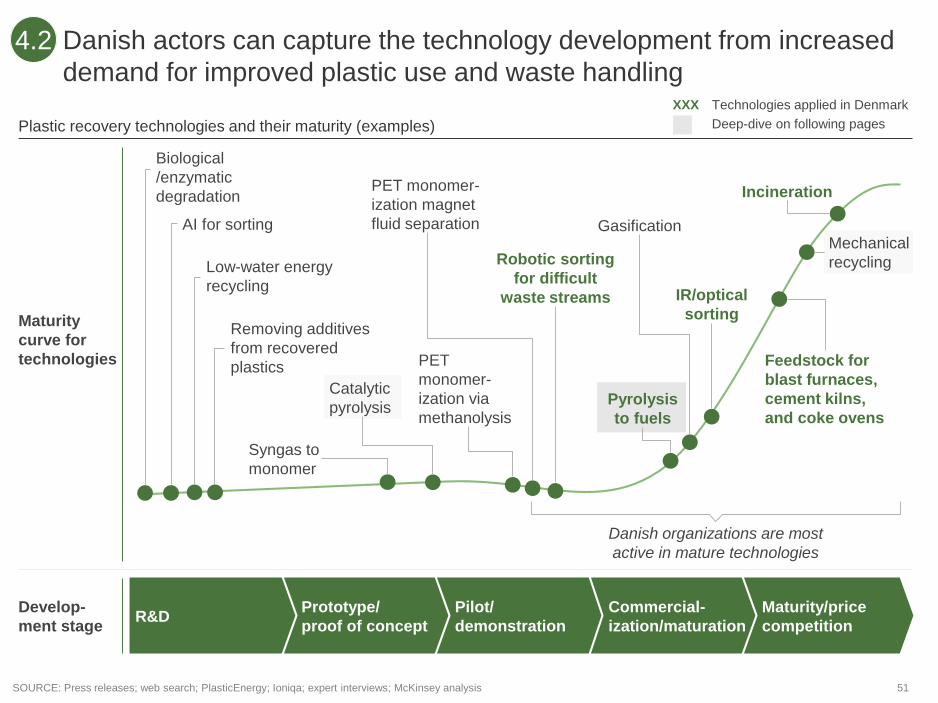
51
Danish actors can capture the technology development from increased
demand for improved plastic use and waste handling
SOURCE: Press releases; web search; PlasticEnergy; Ioniqa; expert interviews; McKinsey analysis
4.2
Plastic recovery technologies and their maturity (examples)
Develop-
ment stageR&D
Prototype/
proof of concept
Pilot/
demonstration
Commercial-
ization/maturation
Maturity/price
competition
Danish organizations are most
active in mature technologies
Maturity
curve for
technologies
Biological
/enzymatic
degradation Incineration
Catalytic
pyrolysis
Syngas to
monomer
Feedstock for
blast furnaces,
cement kilns,
and coke ovens
Mechanical
recycling
IR/optical
sorting
Robotic sorting
for difficult
waste streams
PET
monomer-
ization via
methanolysisPyrolysis
to fuels
AI for sorting
Low-water energy
recycling
Gasification
PET monomer-
ization magnet
fluid separation
Removing additives
from recovered
plastics
XXX Technologies applied in Denmark
Deep-dive on following pages

52
Pyrolysis could complement mechanical recycling in Denmark by
utilizing the decentralized waste system and existing know-how
4.2
1 Provided that feedstock is used for producing new plastics and not as fuel
SOURCE: Expert interviews
▪ Set up decentralized pyrolysis facilities
– Regional pyrolysis facilities to confine cost of
transporting low-value waste
– Connect to district heating system to utilize
excess heat
– Output (naphtha oil) sold to plastic producers
– likely abroad – who will have steam
crackers on production site
▪ Energy-intensive compared
to other recycling
technologies
▪ Cannot handle plastics that
can oxygen efficiently
▪ Value creation realized
abroad as reprocessing will
take place at producer
▪ Denmark could
develop edge on
specific points of the
pyrolysis value chain
▪ Several unsolved
processing issues
(e.g., feedstock
variability,
contamination)
impacting yield and
pyrolysis economics
▪ Pyrolysis facilities
could help drive
demand for improved
sorting technologies
▪ Potential to become
proprietary system
for low-density areas
that can be exported
▪ Optimize waste streams through sorting to
maximize mechanical recycling share
– Maximize share of plastics waste going to
mechanical recycling through improved
sorting technologies and better waste
streams
– Focus on PET and PVC, as these plastics
cannot be pyrolyzed
– Mechanical recycling to take place at
regionally based, smaller facilities
– Potential continuation of additional export
dependent on market development
▪ Suitable for low-value plastic
waste that cannot be
mechanically recycled
▪ More CO2-effective than
incineration1
▪ Danish know-how in place
from both industry (e.g.,
Haldor Topsøe) and
academia (e.g., DTU)
▪ Suitable for small scale
Potential set-up Innovation opportunities
Benefits and disadvantages
of pyrolysis
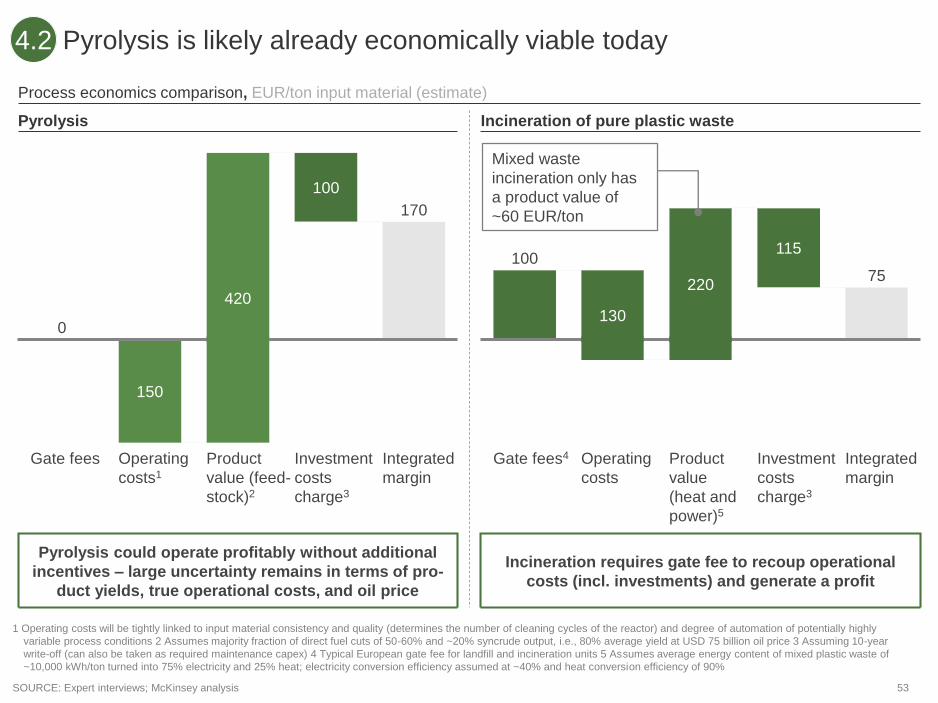
53
170
100
150
Gate fees Operating
costs1
Investment
costs
charge3
420
Product
value (feed-
stock)2
Integrated
margin
0
Pyrolysis is likely already economically viable today
10075
115
Gate fees4 Product
value
(heat and
power)5
220
130
Operating
costs
Integrated
margin
Investment
costs
charge3
Pyrolysis could operate profitably without additional
incentives – large uncertainty remains in terms of pro-
duct yields, true operational costs, and oil price
1 Operating costs will be tightly linked to input material consistency and quality (determines the number of cleaning cycles of the reactor) and degree of automation of potentially highly
variable process conditions 2 Assumes majority fraction of direct fuel cuts of 50-60% and ~20% syncrude output, i.e., 80% average yield at USD 75 billion oil price 3 Assuming 10-year
write-off (can also be taken as required maintenance capex) 4 Typical European gate fee for landfill and incineration units 5 Assumes average energy content of mixed plastic waste of
~10,000 kWh/ton turned into 75% electricity and 25% heat; electricity conversion efficiency assumed at ~40% and heat conversion efficiency of 90%
SOURCE: Expert interviews; McKinsey analysis
4.2
Pyrolysis
Incineration requires gate fee to recoup operational
costs (incl. investments) and generate a profit
Incineration of pure plastic waste
Process economics comparison, EUR/ton input material (estimate)
Mixed waste
incineration only has
a product value of
~60 EUR/ton

54
In the long term, a working market for
recycled plastics and sustainable
plastics must be established
five1. This will need measures to build
the demand and supply for
recycled plastics. One example to
build reliable supply is to promote
recyclability as part of
implementing Extended Producer
Responsibility, which is required
for various plastic items across
the EU towards 2025
2. In Denmark, we have an
opportunity to develop niche
applications of sustainable
plastics for high-value products
based on local industries

55
▪ The current market suffers from a coordination failure that slows down technology development. Volatile prices
hamper investments in technology development that can increase supply, while limited supply predictability hinders
demand growth
▪ A market for recycled plastics could be established to set the value of recycled plastics at a level that makes
exhaustive waste collection, technological development, and higher requirements for design economically viable
▪ This is especially the case for recycled PET, where the technology for recycling and sorting is developed but demand is
still lacking to be able to unlock the remaining potential for recycling1
The market for recycled plastics can be vastly improved to enable the
economic incentive for investment into research and development
SOURCE: Expert interviews; OECD “Improving Markets for Recycled Plastics” (2018)
5.1
▪ Extended Producer Responsibility
requirements
– Incentivize design for recycling, e.g., by levying
fees according to official design manual (EPR
on plastics packaging to be implemented
throughout the EU by 2025)
▪ Certification standards for recycled plastics
– Encourage transparency and high quality to
decrease uncertainty about presence of
additives in plastics waste
▪ Minimum requirements on recycled plastics share
– Create separate demand for recycled plastics
suppliers, as they currently compete against virgin
plastics suppliers
▪ Consumer education and awareness campaigns
– Stimulate consumer demand for products
containing recycled plastics
▪ Green Criteria for Public procurement
– Set requirements for recycled plastics content in
certain product groups purchased with public funds
▪ Tax virgin plastics
– Incentivize plastics producers to use more recycled
raw materials
Potential demand measures Potential supply measures
1 See example on next page

56
Recycled PET exemplifies the current difficult market for recycled
plastics, deriving from fixed cost structures and volatile prices
5.1
15
40
2013 14
2,050
16 17
80
20181,400
1,600
1,450
1,500
1,550
1,650
1,700
110
90
1,750
1,800
1,850
1,900
1,950
2,000
60
20
2,100
30
2,150
0
10
50
70
100
Oil price
rPET
Virgin PET
SOURCE: IHS; World Bank; Expert interviews
▪ Stable supply of recycled PET
(rPET), due to
- High system automation and
technology maturity
- Existing high recycling rates
(in mature markets)
▪ However, rPET prices trail virgin
plastics prices, causing unstable
supplier profitability
- Recycled PET production is
profitable when oil prices are
high
- Profits easily plummet due to
relatively fixed manufacturing
costs (~70% of total costs)
▪ Volatility has caused multiple
players to drop out of business,
which again creates difficulties for
steady supply of rPET
North America PET virgin, recycled resin, and oil
prices, USD per metric ton, USD/barrel

57
Denmark has potential to lead development of niche applications of
sustainable bio-based plastics for high-value products
▪ Plastics deteriorate as they are used and recycled over and over, creating a
need to add new raw materials
▪ Process loss occurs during recycling, meaning that even if plastics demand
stabilized, there would still be a need for new raw materials
▪ Current raw material for plastics primarily come from fossil fuels, which must
be replaced for future raw material production to avoid CO2 emissions
▪ Bio-based plastics should still be kept to a minimum due to competition with
food sources, risk of land grabbing, and loss of biodiversity
▪ Applying sustainable bio-based plastics for niche applications can help
keep production under control, while Denmark has several industries where
innovation within bioplastics is relevant
Demand for new plastics raw material should be met with sustainable
bio-based plastics
▪ Sustainable bio-based plastics are
especially attractive for companies
looking to become completely
free of fossil fuels
▪ A profit margin high enough to
carry additional costs of
sustainable bio-based plastics is
required
▪ Examples of companies looking
into bio-based plastic
applications of high-end products:
▪ LEGO® botanical
elements will all be
made from bio-based
plastics in the future
▪ Bio-based plastics to
be used in numerous
Apple components in
the future, e.g., in
iPhone cover glass
and speaker
enclosures
Plastics production
Process
loss
Deterioration of plastics
Recycling
New raw
materials
SOURCE: Expert interviews; company websites
New raw materials for plastics are necessary, as process loss occurs
and materials deteriorate through recycling
5.2
NOTE: To remain sustainable, bio-based plastics should take part of the circular system similar to other plastics through recycling

58
Bio-based plastics still face a number of challenges to become a
scalable and sustainable alternative to plastics from fossil fuels
SOURCE: Bioplastics Guide; Wageningen University & Research; Ellen MacArthur Foundation “The New Plastics Economy” (2016); McKinsey analysis
1 Decomposes under specific conditions and contains at least 50% organic matter
5.2
Benefits and challenges for biodegradable and nonbiodegradable bio-based plastics
ChallengesBenefits
Bio-
degradable1
▪ Current development can degrade
only under very specific
conditions (e.g., presence of water,
light, oxygen, temperature)
▪ Biodegradable plastics
contaminate regular plastic
recycling streams due to composition
▪ Bio-based plastics but they do still
create CO2 emissions
▪ Growing demand generates
increased competition for
biomass, incl. food sources, as
well as risk of land grabbing and
decreased biodiversity
▪ Plastic products prone to
leakage, e.g., wrappers
▪ Items where usage causes
tearing, e.g., fishing
equipment (such as dolly
ropes)
▪ Smaller plastic pieces that
are difficult to collect upon
usage, e.g., shot shells
and soft gun bullets
▪ Potential for
decomposition under the
right conditions
(composting facility)
▪ Made from bio-based
feedstock (e.g., sugar
cane), can also in some
cases be based on fossil
fuels
▪ Bio-based plastics might appear
sustainable, but they do still
create CO2 emissions
▪ Growing demand generates
increased competition for
biomass, incl. food sources, as
well as risk of land grabbing and
decreased biodiversity
Examples of niche
applications
Non-
biodegradable
▪ High-value plastic
products from companies
looking to become
completely fossil-free
▪ Made from bio-based
feedstock (e.g.,
sugarcane) and not fossil
fuels
▪ Creates lower CO2
emissions than plastics
based on fossil fuels
Only relevant if bio-based
plastics are fully compostable
under natural conditions
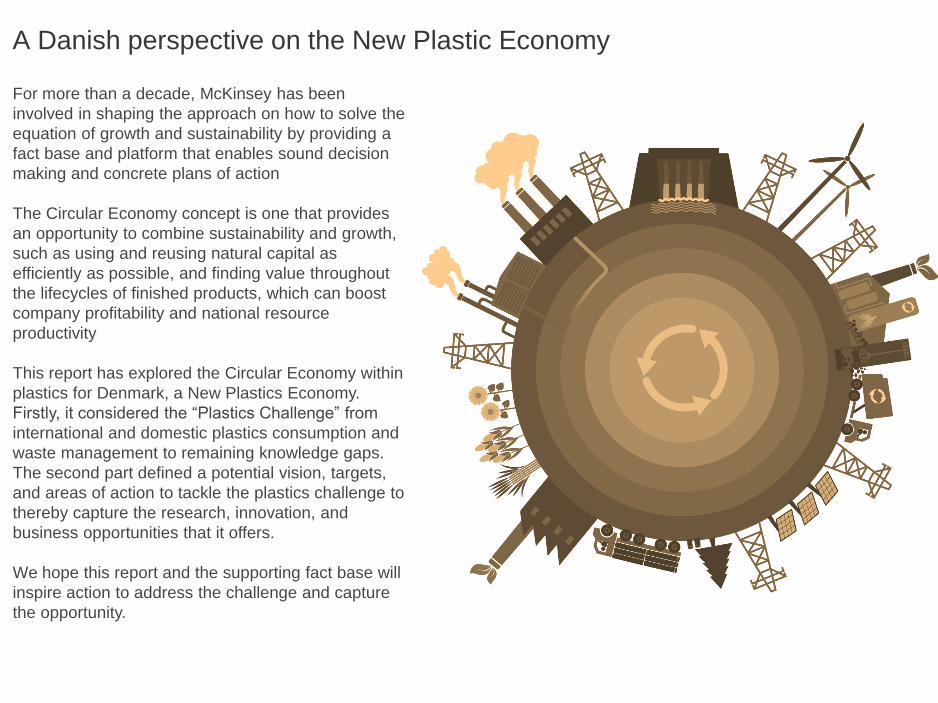
59
A Danish perspective on the New Plastic EconomyOUT?
59
For more than a decade, McKinsey has been
involved in shaping the approach on how to solve the
equation of growth and sustainability by providing a
fact base and platform that enables sound decision
making and concrete plans of action
The Circular Economy concept is one that provides
an opportunity to combine sustainability and growth,
such as using and reusing natural capital as
efficiently as possible, and finding value throughout
the lifecycles of finished products, which can boost
company profitability and national resource
productivity
This report has explored the Circular Economy within
plastics for Denmark, a New Plastics Economy.
Firstly, it considered the “Plastics Challenge” from
international and domestic plastics consumption and
waste management to remaining knowledge gaps.
The second part defined a potential vision, targets,
and areas of action to tackle the plastics challenge to
thereby capture the research, innovation, and
business opportunities that it offers.
We hope this report and the supporting fact base will
inspire action to address the challenge and capture
the opportunity.

60
APPENDIX

61
China, previously a main importer of plastics waste, banned all imports
waste as of January 2018 causing countries to struggle with managing low-
value plastics waste
SOURCE : ISWA, UN CoMTrade press search; Agricultural Plastic Recycling Conference “Science Advances” (June, 2018)
Context
Impact on
industry
Year
What it is
National Sword – campaign
▪ 15 smuggling operations were
exposed, 22,100 tons of foreign
waste confiscated
▪ 100% custom checks on imported
materials increase lead time by
up to 4 times and increase
demurrage cost for exporters
▪ Recycling in China is encouraged
from own commercial and domestic
waste streams
2017 Feb
▪ One-year campaign consisting of
focused crackdown on smuggling
and illicit activities related to
recyclable and waste materials (i.e.
illegal imports, improper recycling
operations)
National sword – full ban
▪ Economies such as the EU, US
and Japan now face the challenge
of managing the waste
previously shipped off to China
as existing capacity cannot cope
with increased domestic recycling
▪ This may lead to increased
landfilling and incineration until a
long-term solution is identified
▪ It has been estimated that 111
million metric tons of plastic
waste will be stranded by 2030
as a result
▪ Risk of plastic waste export
moving to other developing
countries with sub-par
environmental standards
2017 July
▪ Permanent ban on plastics and
mixed paper (amongst other waste)
to clean the Chinese industry of
contaminated waste effective from
January 1st 2018
▪ Until 2018, China imported
about 70% of world’s
traded plastic waste,
amounting to 8.9 MT in 2012
▪ 40% of total plastics waste
collected in Europe (EU-
27), or 87% of plastic waste
exported, was in 2012 sold
to China and Hong Kong,
amounting to USD 767
million in trade
▪ Chinas has increasingly
implemented waste import
policies, e.g., “Green
Fence” of 2013 to increase
the waste quality that China
is receiving while reducing
illegal smuggling and trading
APPENDIX
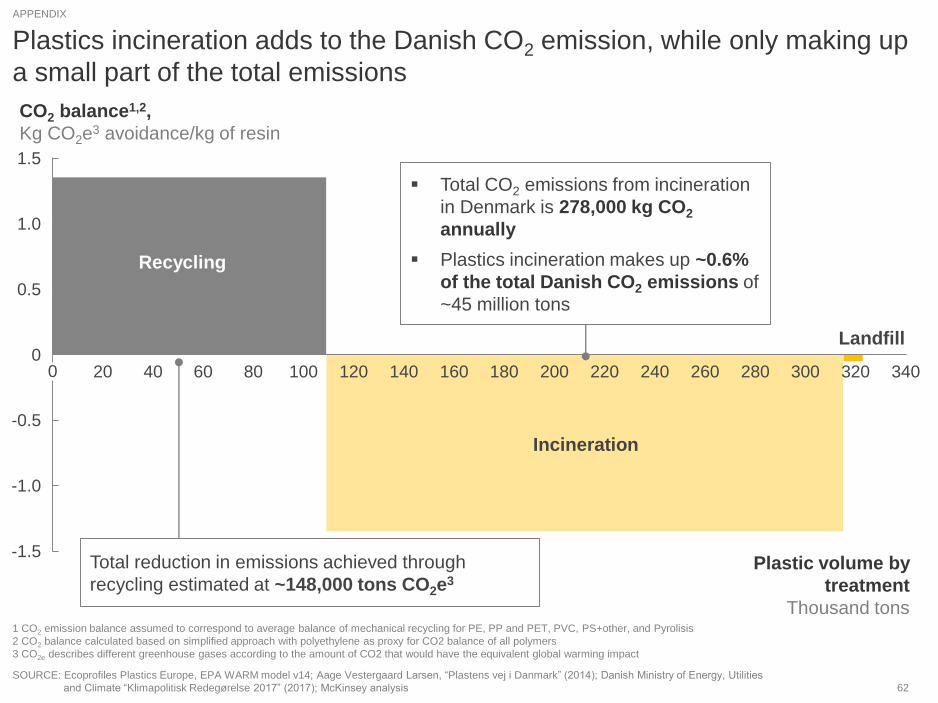
62
Plastics incineration adds to the Danish CO2 emission, while only making up
a small part of the total emissions
2800 12080 22018020 24060 100 140 320 340
-1.5
0.5
-1.0
260200
-0.5
3000
1.5
1.0
16040
Plastic volume by
treatment
Thousand tons
CO2 balance1,2,
Kg CO2e3 avoidance/kg of resin
1 CO2 emission balance assumed to correspond to average balance of mechanical recycling for PE, PP and PET, PVC, PS+other, and Pyrolisis
2 CO2 balance calculated based on simplified approach with polyethylene as proxy for CO2 balance of all polymers
3 CO2e describes different greenhouse gases according to the amount of CO2 that would have the equivalent global warming impact
SOURCE: Ecoprofiles Plastics Europe, EPA WARM model v14; Aage Vestergaard Larsen, “Plastens vej i Danmark” (2014); Danish Ministry of Energy, Utilities
and Climate “Klimapolitisk Redegørelse 2017” (2017); McKinsey analysis
Landfill
Incineration
Recycling
▪ Total CO2 emissions from incineration
in Denmark is 278,000 kg CO2
annually
▪ Plastics incineration makes up ~0.6%
of the total Danish CO2 emissions of
~45 million tons
Total reduction in emissions achieved through
recycling estimated at ~148,000 tons CO2e3
APPENDIX
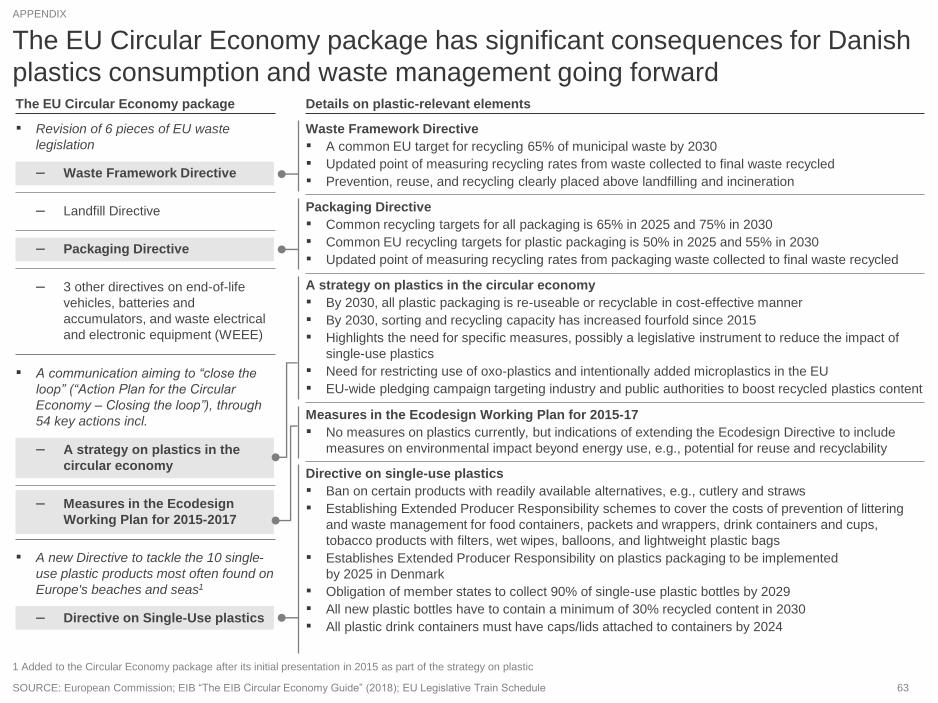
63
– Waste Framework Directive
– A strategy on plastics in the
circular economy
– Packaging Directive
– Measures in the Ecodesign
Working Plan for 2015-2017
– Directive on Single-Use plastics
The EU Circular Economy package has significant consequences for Danish
plastics consumption and waste management going forward
SOURCE: European Commission; EIB “The EIB Circular Economy Guide” (2018); EU Legislative Train Schedule
1 Added to the Circular Economy package after its initial presentation in 2015 as part of the strategy on plastic
The EU Circular Economy package
▪ Revision of 6 pieces of EU waste
legislation
▪ A communication aiming to “close the
loop” (“Action Plan for the Circular
Economy – Closing the loop”), through
54 key actions incl.
– Landfill Directive
– 3 other directives on end-of-life
vehicles, batteries and
accumulators, and waste electrical
and electronic equipment (WEEE)
▪ A new Directive to tackle the 10 single-
use plastic products most often found on
Europe's beaches and seas1
Details on plastic-relevant elements
Waste Framework Directive
▪ A common EU target for recycling 65% of municipal waste by 2030
▪ Updated point of measuring recycling rates from waste collected to final waste recycled
▪ Prevention, reuse, and recycling clearly placed above landfilling and incineration
Measures in the Ecodesign Working Plan for 2015-17
▪ No measures on plastics currently, but indications of extending the Ecodesign Directive to include
measures on environmental impact beyond energy use, e.g., potential for reuse and recyclability
Directive on single-use plastics
▪ Ban on certain products with readily available alternatives, e.g., cutlery and straws
▪ Establishing Extended Producer Responsibility schemes to cover the costs of prevention of littering
and waste management for food containers, packets and wrappers, drink containers and cups,
tobacco products with filters, wet wipes, balloons, and lightweight plastic bags
▪ Establishes Extended Producer Responsibility on plastics packaging to be implemented
by 2025 in Denmark
▪ Obligation of member states to collect 90% of single-use plastic bottles by 2029
▪ All new plastic bottles have to contain a minimum of 30% recycled content in 2030
▪ All plastic drink containers must have caps/lids attached to containers by 2024
A strategy on plastics in the circular economy
▪ By 2030, all plastic packaging is re-useable or recyclable in cost-effective manner
▪ By 2030, sorting and recycling capacity has increased fourfold since 2015
▪ Highlights the need for specific measures, possibly a legislative instrument to reduce the impact of
single-use plastics
▪ Need for restricting use of oxo-plastics and intentionally added microplastics in the EU
▪ EU-wide pledging campaign targeting industry and public authorities to boost recycled plastics content
Packaging Directive
▪ Common recycling targets for all packaging is 65% in 2025 and 75% in 2030
▪ Common EU recycling targets for plastic packaging is 50% in 2025 and 55% in 2030
▪ Updated point of measuring recycling rates from packaging waste collected to final waste recycled
APPENDIX
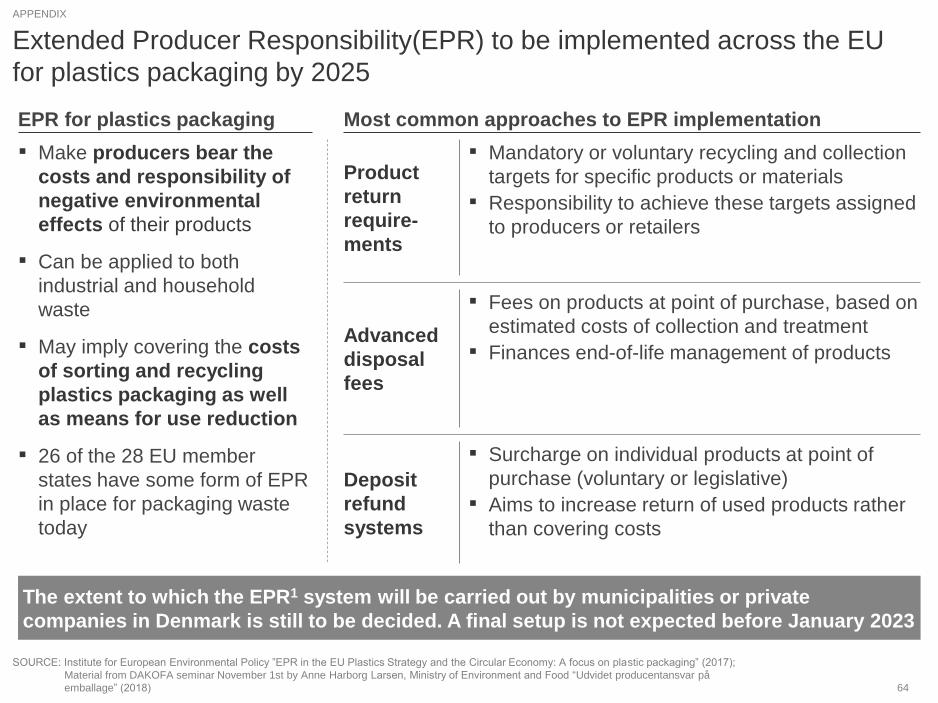
64
Extended Producer Responsibility(EPR) to be implemented across the EU
for plastics packaging by 2025
SOURCE: Institute for European Environmental Policy ”EPR in the EU Plastics Strategy and the Circular Economy: A focus on plastic packaging” (2017);
Material from DAKOFA seminar November 1st by Anne Harborg Larsen, Ministry of Environment and Food “Udvidet producentansvar på
emballage” (2018)
APPENDIX
The extent to which the EPR1 system will be carried out by municipalities or private
companies in Denmark is still to be decided. A final setup is not expected before January 2023
▪ Surcharge on individual products at point of
purchase (voluntary or legislative)
▪ Aims to increase return of used products rather
than covering costs
Advanced
disposal
fees
▪ Fees on products at point of purchase, based on
estimated costs of collection and treatment
▪ Finances end-of-life management of products
Deposit
refund
systems
Product
return
require-
ments
▪ Mandatory or voluntary recycling and collection
targets for specific products or materials
▪ Responsibility to achieve these targets assigned
to producers or retailers
Most common approaches to EPR implementationEPR for plastics packaging
▪ Make producers bear the
costs and responsibility of
negative environmental
effects of their products
▪ Can be applied to both
industrial and household
waste
▪ May imply covering the costs
of sorting and recycling
plastics packaging as well
as means for use reduction
▪ 26 of the 28 EU member
states have some form of EPR
in place for packaging waste
today

65
The Danish deposit refund system is highly successful and could be applied
to more areas as part of implementing EPR1 in Denmark
SOURCE: Dansk Retursystem website; Dansk Retursystem 2017 annual report; Ministry of Environment and Food
Dansk Retursystem (DRS) has been highly successful in providing a closed loop for cans
and bottles
Consumers
After use, products are
handed in and the
deposit is disbursed with
the guarantee of the
packaging being reused
Producers
Cans and bottles are
registered with DRS
and marked to
become part
of the deposit
refund system
Shops and
restaurants
Required to handle
the empty bottles
and cans after sale
supported by DRS
Cans and
bottles are
reprocessed
into new ones
at facilities
abroad
Reprocessors
Registers new products,
handles fees and refunds,
and collects and sorts
Dansk Retursystem
DANSK
RETUR
SYSTEM
16,000 tons of plastics are handled by
DRS, equal to ~5% of Danish
plastics waste, leaving a lot of
potential for the refund system2
How can we utilize the well-
functioning DRS to get equally
impressive rates on other plastic
waste streams?
1.2 billion packaging products were
returned in 2017
9 out of 10 single-use bottles or cans
are returned
1 Extended Producer Responsibility
2 Juice bottles will be included in the deposit refund system by 2020, which is expected to add 6,000 tons of packaging to the system with majority being plastics
APPENDIX
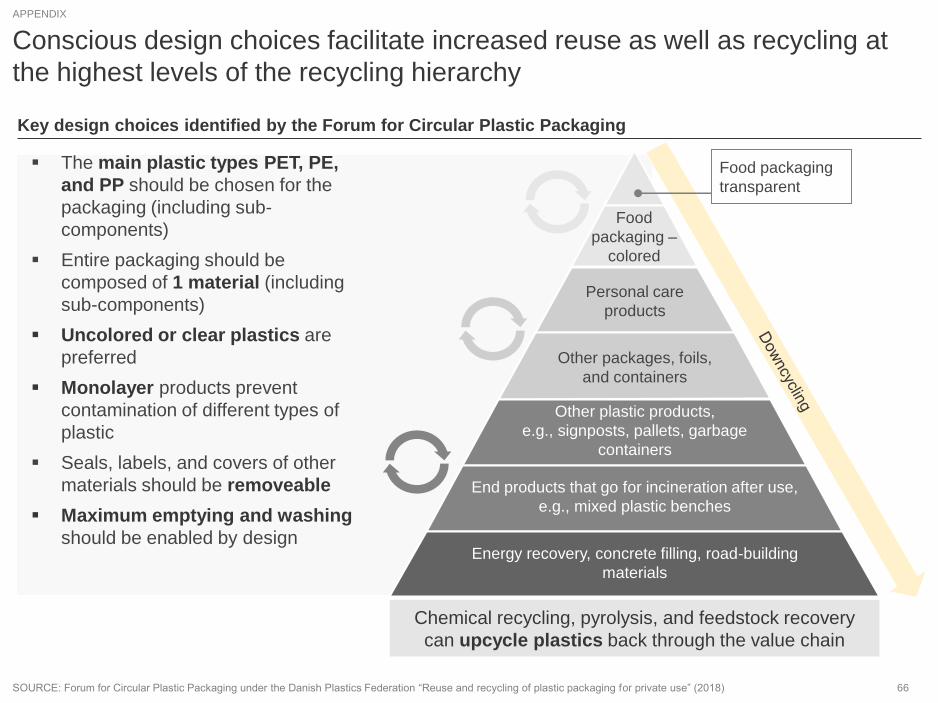
66
Conscious design choices facilitate increased reuse as well as recycling at
the highest levels of the recycling hierarchy
SOURCE: Forum for Circular Plastic Packaging under the Danish Plastics Federation “Reuse and recycling of plastic packaging for private use” (2018)
Food
packaging –
colored
Personal care
products
Other packages, foils,
and containers
Other plastic products,
e.g., signposts, pallets, garbage
containers
End products that go for incineration after use,
e.g., mixed plastic benches
Energy recovery, concrete filling, road-building
materials
Key design choices identified by the Forum for Circular Plastic Packaging
▪ The main plastic types PET, PE,
and PP should be chosen for the
packaging (including sub-
components)
▪ Entire packaging should be
composed of 1 material (including
sub-components)
▪ Uncolored or clear plastics are
preferred
▪ Monolayer products prevent
contamination of different types of
plastic
▪ Seals, labels, and covers of other
materials should be removeable
▪ Maximum emptying and washing
should be enabled by design
Chemical recycling, pyrolysis, and feedstock recovery
can upcycle plastics back through the value chain
Food packaging
transparent
APPENDIX
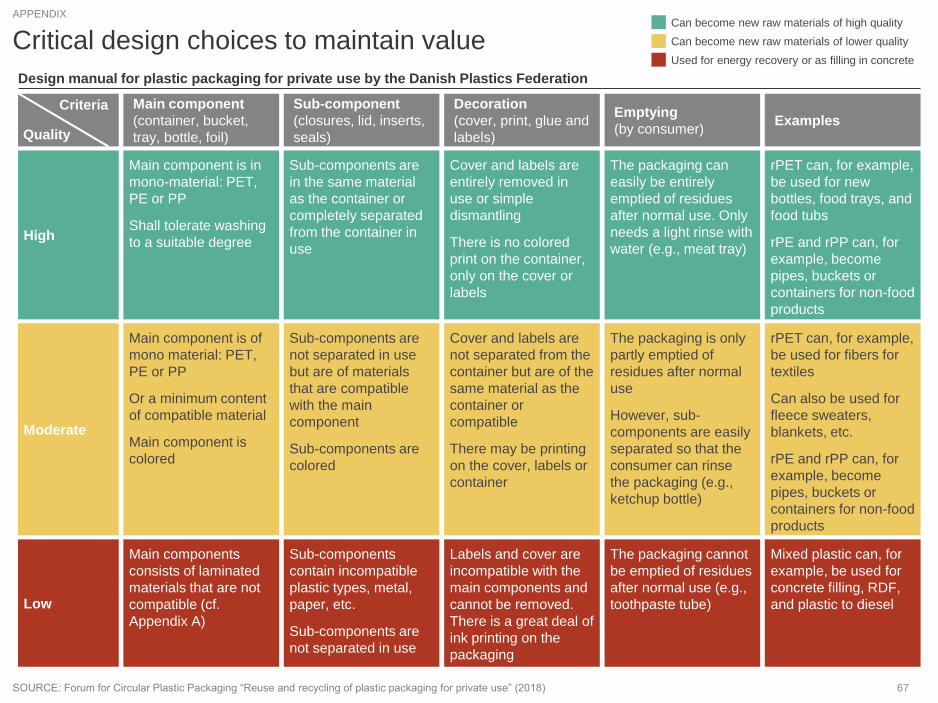
67
Critical design choices to maintain value
SOURCE: Forum for Circular Plastic Packaging “Reuse and recycling of plastic packaging for private use” (2018)
Can become new raw materials of high quality
Can become new raw materials of lower quality
Used for energy recovery or as filling in concrete
Design manual for plastic packaging for private use by the Danish Plastics Federation
Main component is in
mono-material: PET,
PE or PP
Shall tolerate washing
to a suitable degree
Sub-components are
in the same material
as the container or
completely separated
from the container in
use
Cover and labels are
entirely removed in
use or simple
dismantling
There is no colored
print on the container,
only on the cover or
labels
The packaging can
easily be entirely
emptied of residues
after normal use. Only
needs a light rinse with
water (e.g., meat tray)
rPET can, for example,
be used for new
bottles, food trays, and
food tubs
rPE and rPP can, for
example, become
pipes, buckets or
containers for non-food
products
High
Main components
consists of laminated
materials that are not
compatible (cf.
Appendix A)
Sub-components
contain incompatible
plastic types, metal,
paper, etc.
Sub-components are
not separated in use
Labels and cover are
incompatible with the
main components and
cannot be removed.
There is a great deal of
ink printing on the
packaging
The packaging cannot
be emptied of residues
after normal use (e.g.,
toothpaste tube)
Mixed plastic can, for
example, be used for
concrete filling, RDF,
and plastic to dieselLow
Main component is of
mono material: PET,
PE or PP
Or a minimum content
of compatible material
Main component is
colored
Sub-components are
not separated in use
but are of materials
that are compatible
with the main
component
Sub-components are
colored
Cover and labels are
not separated from the
container but are of the
same material as the
container or
compatible
There may be printing
on the cover, labels or
container
The packaging is only
partly emptied of
residues after normal
use
However, sub-
components are easily
separated so that the
consumer can rinse
the packaging (e.g.,
ketchup bottle)
rPET can, for example,
be used for fibers for
textiles
Can also be used for
fleece sweaters,
blankets, etc.
rPE and rPP can, for
example, become
pipes, buckets or
containers for non-food
products
Moderate
Main component
(container, bucket,
tray, bottle, foil)
Sub-component
(closures, lid, inserts,
seals)
Decoration
(cover, print, glue and
labels)
Emptying
(by consumer)Examples
Quality
Criteria
APPENDIX

68
Overview of plastic waste recovery technologies
Economic drivers
Applicability
window Technological challengesOutput
Demand
reduction
▪ Consumer behavior (GDP
growth, urbanization,
lifestyle preferences, etc.
▪ Substitution
▪ Low to medium
▪ All plastics
▪ N/A▪ N/A
Mechanical
recycling
▪ Plastics price
▪ Waste acquisition cost
▪ Low to medium
▪ Estimate: 30-50%
▪ Mostly PET,
polyolefins
▪ Clean collection and sorting
(pure plastic waste streams)
▪ Contaminations
▪ Downcycling
▪ Plastics
Monomer
▪ Monomer price
▪ Waste acquisition cost
▪ Low (<10%)
▪ Limited to
polyesters and
polyamides
(condensates)
▪ Clean collection
▪ Process sensitivity to
impurities
▪ Monomer
(plastics)
Feedstock
recycling/
pyrolysis
▪ Oil/fuel price▪ Medium to high
▪ Most and mixed
plastics (excl.
Polystyrene,
PVC)
▪ Integration with downstream
users
▪ Process costs and CapEx
investments
▪ Disposal of byproducts
▪ Fuel
▪ Oil/naphtha
▪ Gas
▪ Wax
Refurbish-
ment
▪ Industry standardization▪ Low
▪ Durable goods
▪ Plastics deterioration (limited
lifetime)
▪ Durable
goods
Energy
recovery/
incineration
▪ Oil/fuel price
▪ Landfill cost
▪ Waste acquisition cost
▪ All plastics
▪ Mixed waste
streams
▪ Integration with broader
MSW stream
▪ Legal emissions
requirements (GHG, toxicity)
▪ Energy
▪ Electricity
SOURCE: McKinsey analysis
APPENDIX
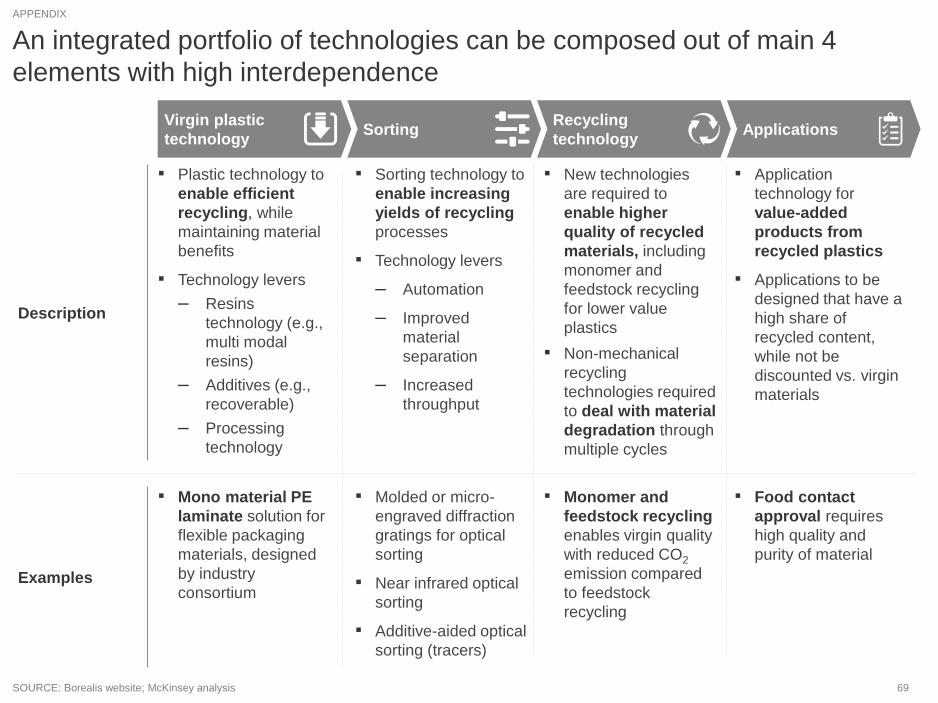
69SOURCE: Borealis website; McKinsey analysis
An integrated portfolio of technologies can be composed out of main 4
elements with high interdependence
Virgin plastic
technology Sorting
Recycling
technology Applications
Examples
▪ Mono material PE
laminate solution for
flexible packaging
materials, designed
by industry
consortium
Description
▪ Food contact
approval requires
high quality and
purity of material
▪ Application
technology for
value-added
products from
recycled plastics
▪ Applications to be
designed that have a
high share of
recycled content,
while not be
discounted vs. virgin
materials
▪ Molded or micro-
engraved diffraction
gratings for optical
sorting
▪ Near infrared optical
sorting
▪ Additive-aided optical
sorting (tracers)
▪ Sorting technology to
enable increasing
yields of recycling
processes
▪ Technology levers
– Automation
– Improved
material
separation
– Increased
throughput
▪ Monomer and
feedstock recycling
enables virgin quality
with reduced CO2
emission compared
to feedstock
recycling
▪ New technologies
are required to
enable higher
quality of recycled
materials, including
monomer and
feedstock recycling
for lower value
plastics
▪ Non-mechanical
recycling
technologies required
to deal with material
degradation through
multiple cycles
▪ Plastic technology to
enable efficient
recycling, while
maintaining material
benefits
▪ Technology levers
– Resins
technology (e.g.,
multi modal
resins)
– Additives (e.g.,
recoverable)
– Processing
technology
APPENDIX