new orleans bike share feasibility study & business plan
TRANSCRIPT

NEW ORLEANS BIKE SHARE ORGANIZATIONAL AND BUSINESS PLAN | FINAL REPORT
e
NEW ORLEANS BIKE SHARE FEASIBILITY STUDY & BUSINESS PLAN
Final Report
December 2014
New Orleans Regional Planning Commission
The Regional Planning Commission for Jefferson, Orleans, Plaquemines, St. Bernard, St. Tammany and Tangipahoa Parishes
City of New Orleans
State Project #H.972035

NEW ORLEANS BIKE SHARE FEASIBILITY STUDY AND BUSINESS PLAN | FINAL REPORT
The Regional Planning Commission for Jefferson, Orleans, Plaquemines, St. Bernard, St. Tammany and Tangipahoa Parishes | City of New Orleans | State Project #H.972035 | i
Acknowledgements
The New Orleans Bike Share Feasibility Study and Business Plan could not have been completed without the ideas, input, and general support of community stakeholders, public officials, and City/NORPC staff including but not limited to the following individuals:
CITY OF NEW ORLEANS Mitchell J. Landrieu, Mayor Andy Kopplin, Deputy Mayor & Chief Administrative Officer Cedric Grant, Deputy Mayor Facilities, Infrastructure, and Community Development Charles Allen, Director of Coastal & Environmental Affairs, Ray Bolling, Director, Office of Neighborhood Engagement Charles Brown, Executive Director, New Orleans Public Library Cindy Connick, Executive Director, Canal Street Development Corporation Ashleigh Gardere, Advisor to the Mayor for Strategy and Development Bill Gilchrist, Director of Place-Based Planning, Chief Michael Harrison, Superintendent, New Orleans Police Department Jeffrey Hebert, Executive Director, New Orleans Redevelopment Authority Lary Hesdorffer, Director, Vieux Carré Commission Mark Jernigan, Director, Department of Public Works Alex Lebow, Director of Strategic Partnerships, Office of Mayor Mitch Landrieu Jared Munster, Director, Department of Safety and Permits Councilmember Kristen Gisleson Palmer, Chair of the Transportation Committee Charlotte Parent, Director, Health Department George Patterson, Director, Department of Property Management Elliot Perkins, Executive Director, Historic District Landmarks Commission Aimee Quirk, Office of Economic Development Vic Richard, CEO, New Orleans Recreation Development Commission Bob Rivers, Director, City Planning Commission Jennifer Ruley, Pedestrian and Bicycle Engineer
NEW ORLEANS REGIONAL PLANNING
COMMISSION Walter Brooks, Executive Director Karen Parsons, Principal Planner and Project Manager Dan Jatres, Pedestrian and Bicycle Program Manager Lynn Dupont, Principal Planner and GIS Coordinator
OTHER STAKEHOLDERS 504HealthNet Audubon Institute Bike Easy Downtown Development District Entergy Corporation Friends of Lafitte Corridor Gibbs Construction Greater New Orleans Hotel & Lodging Association Greater New Orleans, Inc. Greater New Orleans Sports Foundation Housing Authority of New Orleans HRI Properties Idea Village JCH Development KidsWalk Coalition Louisiana Public Health Institute Louisiana Restaurant Association New Orleans Chamber of Commerce New Orleans City Park New Orleans Convention and Visitors Bureau New Orleans Ernest N. Morial Convention Center New Orleans Tourism and Marketing Corporation NOLA Business Alliance Ochsner Health System Recovery School District Ride New Orleans SMG Stirling Properties Transdev/Regional Transit Authority Tulane University Tulane University Prevention Research Center UNO Transportation Institute Urban Conservancy Where Ya' Rack? Young Leadership Council
Project Team
NELSON\NYGAARD Karina Ricks, Principal Evan Corey, Senior Associate Tomoko Delatorre, GIS Specialist
THE HAWTHORNE AGENCY Geneva Coleman Karimah Stewart

NEW ORLEANS BIKE SHARE FEASIBILITY STUDY AND BUSINESS PLAN | FINAL REPORT
The Regional Planning Commission for Jefferson, Orleans, Plaquemines, St. Bernard, St. Tammany and Tangipahoa Parishes | City of New Orleans | State Project #H.972035 | ii
Table of Contents
Page
ES Executive Summary ....................................................................................................... ES-1 What is Bike Share and How Could it Benefit New Orleans? ..................................................... ES-2 Is New Orleans Ready for Bike Share? ........................................................................................... ES-3 Bike Share Program Vision And Goals............................................................................................. ES-4 Rolling Out BIke Share in New Orleans ........................................................................................... ES-5 When Can Bike Share Be Ready? ..................................................................................................... ES-7
1 Introduction ......................................................................................................................1-1 New Orleans, At a Glance .................................................................................................................. 1-2 Report Structure ..................................................................................................................................... 1-4
2 Achieving Outcomes, Defining Success ...........................................................................2-1 Bike Share and Its Anticipated Outcomes ......................................................................................... 2-2 Vision and Goals for the New Orleans Bike Share Program ....................................................... 2-8
3 Environmental Scan .........................................................................................................3-1 Geography, Demographics, and Tourism Profile ............................................................................ 3-1 Built Environment .................................................................................................................................... 3-5 Transportation Assessment ................................................................................................................. 3-11 Is New Orleans Ready for Bike Share? .......................................................................................... 3-15
4 Recommended Organizational Structure .........................................................................4-1 Organizational Options ....................................................................................................................... 4-2 Organizational Assessment .................................................................................................................. 4-6
5 Recommended Service Area and Phasing .......................................................................5-1 System Types Analyzed ....................................................................................................................... 5-1 Conditional System Recommendation ................................................................................................ 5-4 Determining Bike Share Demand ........................................................................................................ 5-5 Phase 1 and 2 Service Area Boundaries .......................................................................................... 5-9 System Parameters .............................................................................................................................. 5-17
6 How Much Will Bike Share Cost? .....................................................................................6-1 Pre-Launch Start-up Costs .................................................................................................................... 6-1 Near- and Long-Term Capital Costs .................................................................................................. 6-2 Ongoing Operating Costs .................................................................................................................... 6-3
7 Funding Strategy ..............................................................................................................7-1 Proposed Pricing Structure ................................................................................................................... 7-1 Ridership and Revenue Forecasts ....................................................................................................... 7-4 Snapshot of Three-Year Funding Shortfall ..................................................................................... 7-11 Funding and Revenue Options .......................................................................................................... 7-11
8 An Action Plan for Bike Share .........................................................................................8-1 Immediate Action Plan .......................................................................................................................... 8-1 Supporting Strategies ........................................................................................................................... 8-6 New Orleans’ Preliminary Equity Strategy for Bike Share ........................................................... 8-9 Implementation Timeline ..................................................................................................................... 8-15
Appendix A Detailed Cost Estimates
Appendix B New Orleans Bike Share Briefing Paper

NEW ORLEANS BIKE SHARE FEASIBILITY STUDY AND BUSINESS PLAN | FINAL REPORT
The Regional Planning Commission for Jefferson, Orleans, Plaquemines, St. Bernard, St. Tammany and Tangipahoa Parishes | City of New Orleans | State Project #H.972035 | iii
Table of Figures
Page
Figure 1 Bike share readiness ........................................................................................................... ES-3
Figure 2 Recommended Service Area and Conceptual Station Locations ................................ ES-6
Figure 3 Snapshot of Phase 1 Funding Need ................................................................................. ES-7
Figure 4 Initial projected community benefits of bike share in New Orleans .......................... 2-7
Figure 5 Population and Employment Density Index (2014) ....................................................... 3-2
Figure 6 Transit Dependency Index .................................................................................................. 3-3
Figure 7 Blocks RTA Riders Walked to Transit Stop ...................................................................... 3-5
Figure 8 Future Land Use Map ........................................................................................................... 3-7
Figure 9 New Orleans Historic Districts .......................................................................................... 3-10
Figure 10 Existing and Funded Bike Network ................................................................................. 3-12
Figure 11 RTA System Map ................................................................................................................. 3-13
Figure 12 Planned BRT Corridors ....................................................................................................... 3-15
Figure 13 Bike share readiness matrix ............................................................................................. 3-17
Figure 14 Summary of bike share organizational structures .......................................................... 4-5
Figure 15 New Orleans bike share organizational assessment ..................................................... 4-8
Figure 16 Advantages and issues of dock-based bike share systems ......................................... 5-2
Figure 17 Advantages and issues of hub-based, smart-bike systems .......................................... 5-3
Figure 18 The "Reside | Work | Recreate | Move | Shop" demand analysis approach ...... 5-5
Figure 19 New Orleans Bike Share Demand Analysis Results ....................................................... 5-8
Figure 20 Proposed system size scenarios ....................................................................................... 5-10
Figure 21 Scenario 1, Phase 1 System Plan (Station-Based System) ......................................... 5-13
Figure 22 Scenario 1, Phase 2 System Plan (Station-Based System) ......................................... 5-14
Figure 23 Scenario 2, Phase 1 System Plan (Smart-Bike, Hub-Based System) ......................... 5-15
Figure 24 Scenario 2, Phase 2 System Plan (Smart-Bike, Hub-Based System) ......................... 5-16
Figure 25 Station density and spacing comparison ........................................................................ 5-17
Figure 26 Bike share station-based dimensions and access requirements ................................. 5-20
Figure 27 General smart-bike hub dimensions and access ........................................................... 5-24
Figure 28 Bike share productivity in select systems (trips per bike per day in 2012) ............ 5-26
Figure 29 Scenario 1 pre-launch start-up, capital, and operating costs by phase ................... 6-4
Figure 30 Scenario 2 pre-launch start-up, capital, and operating costs by phase ................... 6-4
Figure 31 Scenario 1 five-year cost summary by phase ................................................................ 6-5
Figure 32 Scenario 2 five-year cost summary by phase ................................................................ 6-5
Figure 33 Proposed pricing structure and overages ........................................................................ 7-3
Figure 34 Scenario 1, Phase 1 & 2 ridership forecast by month at Year 3 (at maturity)........ 7-5
Figure 35 Scenario 2, Phase 1 & 2 ridership forecast by month at Year 3 (at maturity)........ 7-6
Figure 36 Year 3 projected trips by user market and scenario .................................................... 7-7
Figure 37 Summary of Year 3 subscription and overage fee revenue ranges .......................... 7-7
Figure 38 Scenario 1 five-year ridership and user revenue projection, Phase 1 ...................... 7-8
Figure 39 Scenario 1 five-year ridership and user revenue projection, Phase 1+2 ................ 7-8
Figure 40 Scenario 2 five-year ridership and user revenue projection, Phase 1 ...................... 7-9
Figure 41 Scenario 2 five-year ridership and user revenue projection, Phase 1+2 ................ 7-9
Figure 42 Productivity and cost effectiveness forecast validation ................................................ 7-9

NEW ORLEANS BIKE SHARE FEASIBILITY STUDY AND BUSINESS PLAN | FINAL REPORT
The Regional Planning Commission for Jefferson, Orleans, Plaquemines, St. Bernard, St. Tammany and Tangipahoa Parishes | City of New Orleans | State Project #H.972035 | iv
Figure 43 Snapshot of Phase 1 Funding Need ................................................................................ 7-11
Figure 44 Bike share sponsorship types ............................................................................................ 7-20
Figure 45 Desired Executive Director characteristics and qualifications ...................................... 8-3
Figure 46 Bike share implementation timeline for New Orleans ................................................. 8-15

NEW ORLEANS BIKE SHARE FEASIBILITY STUDY AND BUSINESS PLAN | FINAL REPORT
Regional Planning Commission for Jefferson, Orleans, Plaquemines, St. Bernard, St. Tammany and Tangipahoa Parishes | City of New Orleans | State Project #H.972035 | ES-1
EXECUTIVE SUMMARY Drawing from recent successes in cities across North America, bike share has been identified as a
tool to meet resident, worker, and visitor mobility needs. It supports multiple ongoing programs in
the City of New Orleans, including active transportation, economic development, public health, and
equity initiatives. Rooted in the momentum of these initiatives, this New Orleans Bike Share
Feasibility Study and Business Plan examines the feasibility of a bike share system in New Orleans
and makes recommendations based on lessons learned in peer cities. The New Orleans Regional
Planning Commission (RPC) and the City of New Orleans jointly funded this Bike Share Feasibility
Study and Business Plan as a result of a high-level bike share study produced by Bike Easy and a
2013 EPA Building Blocks for Sustainable Communities technical assistance workshop. The RPC and
the City recognize the ability of bike share to serve as a reliable transit service, a tool for resident and
visitor circulation, and a way to better connect people to RTA’s streetcar and bus network.
The unique constraints, opportunities, and needs of New Orleans residents necessitate an in-depth
look at whether an equitable and well-served bike share system could be operated and where. This
final report identifies a recommended implementable service area, a sustainable business model,
funding opportunities, and implementation considerations with strong emphasis on equitable access
and removing barriers to bike share. The study considers the very real challenges of implementing a
new transit system and highlights factors that will impact the viability and success of bike share in
New Orleans. This feasibility study is unique from other bike share analyses in that it evaluates the
costs and tradeoffs of two system types: a traditional station-based, smart-dock system (Scenario 1)
and a hub-based, smart-bike system model (Scenario 2).
In addition to the more recent initiatives, bike share will also benefit some of New Orleans’ more
established, highly visible community assets. The numerous lively entertainment districts attract
residents and visitors every week of the year. Events such as Mardi Gras, the New Orleans Jazz and
Heritage Festival, and Essence Festival are also enjoyed by visitors and residents alike. While these
events are part and parcel of the City’s cultural backbone, their demand for access create immense
pressure on the City’s already taxed street network and transit system. Traffic congestion, limited
parking supply, and slowly improving transit service levels could be mitigated by a bike share
system. As a new mobility choice—especially one with 24-hour service—bike share would give people
Scenario 1: A traditional dock-based system
with technology built into the docking stations
Scenario 2: A hub-based smart-bike system with
technology built into the bicycles themselves
NEW ORLEANS BIKE SHARE FEASIBILITY STUDY AND BUSINESS PLAN

NEW ORLEANS BIKE SHARE FEASIBILITY STUDY AND BUSINESS PLAN | FINAL REPORT
Regional Planning Commission for Jefferson, Orleans, Plaquemines, St. Bernard, St. Tammany and Tangipahoa Parishes | City of New Orleans | State Project #H.972035 | ES-2
a flexible, low cost transportation choice that does not require the construction of new parking
garages or clog the street network.
Image from Visit Indy
WHAT IS BIKE SHARE AND HOW COULD IT BENEFIT NEW ORLEANS?
Bike share is a low-cost, flexible public transportation service that provides on-demand access to a
network of publically-rentable bicycles. Depending on the type of system employed, public bicycles
are distributed across a defined service area at fixed smart docking stations locations, hub locations,
or individual public bike racks. Due to the point-to-point nature of bike share, this form of public
transportation generally accommodates shorter trips that replace less efficient auto and transit trips
(trip lengths average between 1 and 3 miles).
With over 30 systems operating in the United States as of December 2014, and over one hundred
more in planning or pre-implementation stages, bike sharing is the fastest growing form of public
transportation in the United States. No other form of public transportation is able to unlock a wide
range of community benefits—such as local environmental health, energy sustainability, quality of
life, public health, and economic activity—for the same modest level of capital and operating
investment.
There are myriad benefits of developing a citywide bike share system including those related to
increasing options for affordable transportation, improving transportation efficiency, supporting last
mile connections to and from transit, improving health indicators, furthering environmental
sustainability, creating jobs, and boosting economic productivity and regional competitiveness.
Based on the anticipated ridership in New Orleans, the following environmental, economic, and
health-related benefits can be achieved:
NEW ORLEANS BIKE SHARE FEASIBILITY STUDY AND BUSINESS PLAN | FINAL REPORT
Regional Planning Commission for Jefferson, Orleans, Plaquemines, St. Bernard, St. Tammany and Tangipahoa Parishes | City of New Orleans | State Project #H.972035 | ES-3
Provide a mode of transportation for the 9% of New Orleans residents without a vehicle
available
Directly create 14-28 new jobs through the New Orleans’ bike share program
Burn 58 – 70 million calories each year
Burn 16,500 – 20,000 pounds of fat each year
Reduce 1.7 million vehicle miles traveled annually
Eliminate 1.5 – 1.9 million pounds of carbon from entering the atmosphere every year
Increase net retail spending at businesses immediately adjacent to bike share stations by
$125,000-$510,000 (conservative estimate)
Save users $1.0 – $1.2 million in spending every year due to reduced driving
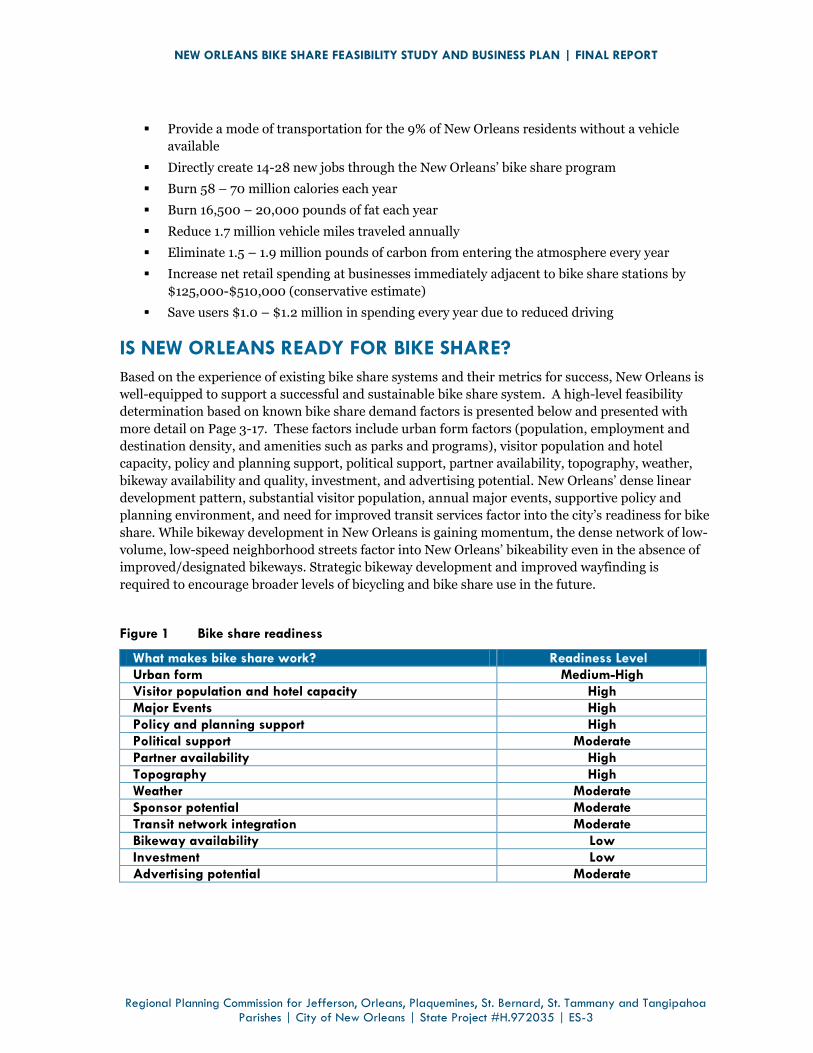
IS NEW ORLEANS READY FOR BIKE SHARE?
Based on the experience of existing bike share systems and their metrics for success, New Orleans is
well-equipped to support a successful and sustainable bike share system. A high-level feasibility
determination based on known bike share demand factors is presented below and presented with
more detail on Page 3-17. These factors include urban form factors (population, employment and
destination density, and amenities such as parks and programs), visitor population and hotel
capacity, policy and planning support, political support, partner availability, topography, weather,
bikeway availability and quality, investment, and advertising potential. New Orleans’ dense linear
development pattern, substantial visitor population, annual major events, supportive policy and
planning environment, and need for improved transit services factor into the city’s readiness for bike
share. While bikeway development in New Orleans is gaining momentum, the dense network of low-
volume, low-speed neighborhood streets factor into New Orleans’ bikeability even in the absence of
improved/designated bikeways. Strategic bikeway development and improved wayfinding is
required to encourage broader levels of bicycling and bike share use in the future.
Figure 1 Bike share readiness
What makes bike share work? Readiness Level
Urban form Medium-High
Visitor population and hotel capacity High
Major Events High
Policy and planning support High
Political support Moderate
Partner availability High
Topography High
Weather Moderate
Sponsor potential Moderate
Transit network integration Moderate
Bikeway availability Low
Investment Low
Advertising potential Moderate

NEW ORLEANS BIKE SHARE FEASIBILITY STUDY AND BUSINESS PLAN | FINAL REPORT
Regional Planning Commission for Jefferson, Orleans, Plaquemines, St. Bernard, St. Tammany and Tangipahoa Parishes | City of New Orleans | State Project #H.972035 | ES-4
BIKE SHARE PROGRAM VISION AND GOALS
The vision and goals for New Orleans’ bike share program were developed through a series of Idea
Session working groups that brought together community organizations, advocacy and non-profit
leaders, business stakeholders, and public officials representing a number of agencies throughout the
city. A vision for bike share in New Orleans was collaboratively developed and is as follows:
Bike share will serve as an accessible and affordable transportation network that benefits residents and visitors across economic conditions and neighborhoods. This mobility tool will help New Orleans meet its equity, public health, workforce development, economic development, innovation, and congestion relief goals.
The following goals derived from conversations with Idea Session and stakeholder interview
participants. As bike share is rolled out in New Orleans, the system will:
Provide more affordable and accessible transportation options.
Lead as an international model for equitable bike share programs.
Operate in a fiscally sustainable manner minimizing ongoing operating subsidy from the City
of New Orleans.
Expand workforce mobility options.
Connect residents and visitors to the places they want to go around the city.
Employ local staff, especially from disadvantaged communities and at-risk youth programs.
Promote health and wellness, helping New Orleans become one of the top ten fittest cities in
America by 2018.
Help achieve mobility objectives including VMT reduction, congestion relief, and reduced
search-for-parking traffic and parking demand.
Facilitate a change in street culture and safety resulting in respectful co-existence among
people walking, bicycling or operating motor vehicles.
Fully integrate into the public transportation system, including fare integration.
Attract residents and visitors to all neighborhoods, spurring economic development and
retail sales.
Reinforce the City’s objective to create a pedestrian and bicycle-friendly city.
Introduce more residents to bicycle transportation and expand the number of daily bicycle
users.
Leverage public support and funding for increased and improved bicycle infrastructure.

NEW ORLEANS BIKE SHARE FEASIBILITY STUDY AND BUSINESS PLAN | FINAL REPORT
Regional Planning Commission for Jefferson, Orleans, Plaquemines, St. Bernard, St. Tammany and Tangipahoa Parishes | City of New Orleans | State Project #H.972035 | ES-5
Image from Coast Bike Share
ROLLING OUT BIKE SHARE IN NEW ORLEANS
Bike share programs can be owned, managed, and operated in a variety of ways. The organizational
assessment presented in Chapter 4 presents the range of organizational structures currently
employed in North America and evaluates their feasibility within the context of New Orleans
(including factors related to different management arrangements, system operators, capital
ownership, staff capacity, ability to support major events, equity, and financial risk and liability).
With current conditions, we recommend the City consider establishing a non-profit corporation to
manage the bike share program and administer a contract with a private equipment vendor and
system operator. If conditions change, however, the City should conduct due diligence, including
review of the organizational assessment found in Chapter 4, to determine if alternate operating
models should be considered.
After evaluating the functionality, system sizing, costs, revenue, and funding gaps for two conceptual
bike share system types (a station-based scenario and a smart-bike, hub- based scenario), this study
conditionally recommends the City of New Orleans and the future system administrator develop a
hub-based, smart-bike bike share system. We recognize that such systems are still in their infancy in
the U.S. and New Orleans can and should continue to monitor and learn from the experience of cities
who have adopted the new approaches. It is important to note, however, that this type of bike share
system is projected to require supplemental revenue for operations beyond phase one. If conditions
change, however, the City should conduct due diligence and utilize the full analysis found in
Chapters 5 through 7 to determine which system type best meets the new baseline conditions.
NEW ORLEANS BIKE SHARE FEASIBILITY STUDY AND BUSINESS PLAN | FINAL REPORT
Regional Planning Commission for Jefferson, Orleans, Plaquemines, St. Bernard, St. Tammany and Tangipahoa Parishes | City of New Orleans | State Project #H.972035 | ES-6
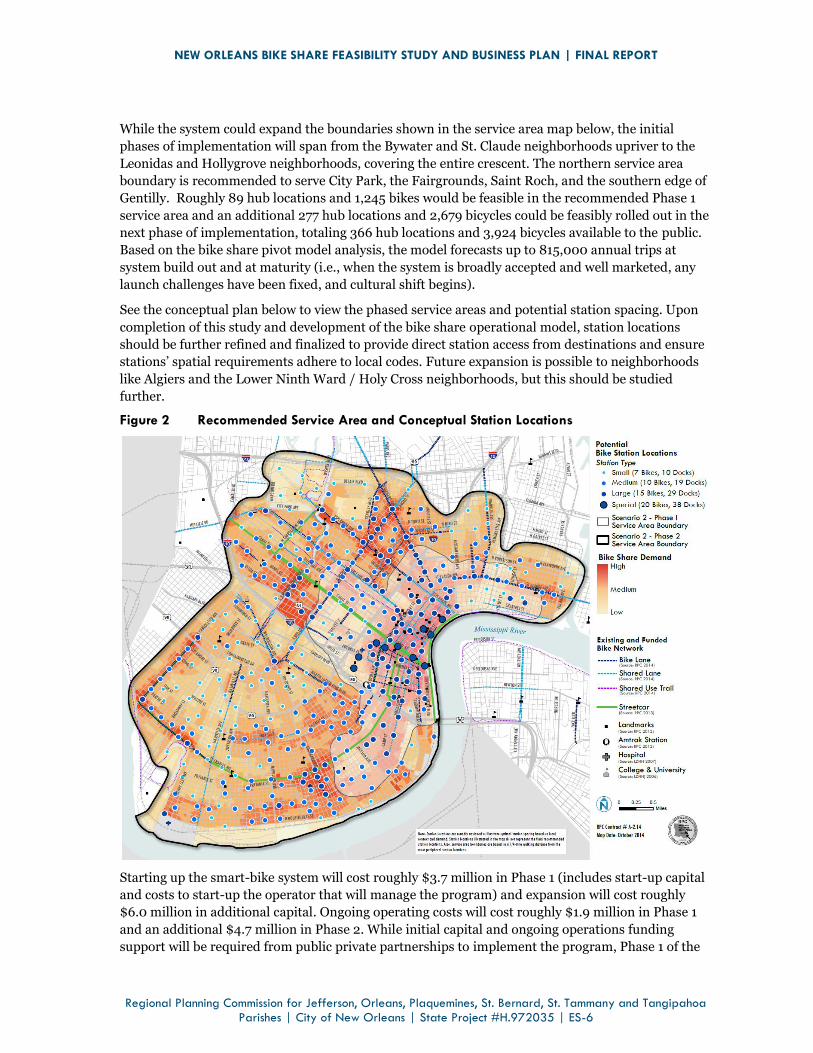
While the system could expand the boundaries shown in the service area map below, the initial
phases of implementation will span from the Bywater and St. Claude neighborhoods upriver to the
Leonidas and Hollygrove neighborhoods, covering the entire crescent. The northern service area
boundary is recommended to serve City Park, the Fairgrounds, Saint Roch, and the southern edge of
Gentilly. Roughly 89 hub locations and 1,245 bikes would be feasible in the recommended Phase 1
service area and an additional 277 hub locations and 2,679 bicycles could be feasibly rolled out in the
next phase of implementation, totaling 366 hub locations and 3,924 bicycles available to the public.
Based on the bike share pivot model analysis, the model forecasts up to 815,000 annual trips at
system build out and at maturity (i.e., when the system is broadly accepted and well marketed, any
launch challenges have been fixed, and cultural shift begins).
See the conceptual plan below to view the phased service areas and potential station spacing. Upon
completion of this study and development of the bike share operational model, station locations
should be further refined and finalized to provide direct station access from destinations and ensure
stations’ spatial requirements adhere to local codes. Future expansion is possible to neighborhoods
like Algiers and the Lower Ninth Ward / Holy Cross neighborhoods, but this should be studied
further.
Figure 2 Recommended Service Area and Conceptual Station Locations
Starting up the smart-bike system will cost roughly $3.7 million in Phase 1 (includes start-up capital
and costs to start-up the operator that will manage the program) and expansion will cost roughly
$6.0 million in additional capital. Ongoing operating costs will cost roughly $1.9 million in Phase 1
and an additional $4.7 million in Phase 2. While initial capital and ongoing operations funding
support will be required from public private partnerships to implement the program, Phase 1 of the

NEW ORLEANS BIKE SHARE FEASIBILITY STUDY AND BUSINESS PLAN | FINAL REPORT
Regional Planning Commission for Jefferson, Orleans, Plaquemines, St. Bernard, St. Tammany and Tangipahoa Parishes | City of New Orleans | State Project #H.972035 | ES-7
system will be profitable in its first year of operation. Expanding the system to areas outside the
highest pockets of demand will require additional sources of revenue to meet budget shortfalls,
which is typical of delivering a well-covered and equitably served public transit system. Key funding
strategies to support capital and operating costs include:
Title, presenting, and major sponsorships
Public grants
Foundation contribution
Direct station purchase and limited station sponsorship
Corporate membership and employee wellness programs
System design and costs for the station-based system alternative (Scenario 1) are also presented in
this report.
WHEN CAN BIKE SHARE BE READY?
This report recommends the City develop a non-profit corporation pursuant to the Louisiana Non-
Profit Corporation Law, Title 12, Chapter 2 of the Louisiana Revised Statutes 1950. Non-profit
development and engagement with the business community and other community stakeholders is
the City’s first step in the implementation process. Critical first steps to move the program closer to
implementation include hiring an Executive Director and establishing a Board of Directors,
fundraising, writing an RFP for vendor and operator services, and executing the program’s equity
strategy. An 18-24 month implementation timeline is achievable, which will put bikes on the ground
by spring or summer 2016. Securing initial funding for the non-profit and capital will play a large
role in making this timeline a reality.
As a theoretical exercise, Phase 1 capital and operating costs for both scenarios were projected out
three years to understand the funding gap that is necessary to be recover through grants,
sponsorship, and other contributions. The results of this exercise are shown in Figure 3.
Figure 3 Snapshot of Phase 1 Funding Need
Scenario 1: Station-based system 827 bicycles, 60 stations
Scenario 2: Smart Bike, hub-based system 1,245 bicycles, 89 hubs
Total capital costs $4.1 million $3.1 million
3-year operating costs $4.5 million $5.7 million
Initial 3-year costs $8.6 million $8.8 million
3-year revenue (see Figure 38 & 39) $5.0 million $7.3 million
Initial investment (RPC + local match)
$1.5 million $1.5 million
Initial 3-year funding $6.5 million $8.8 million
Delta/Shortfall ($2.1 million) $0.0 million
Note: All cost and revenue figures are for Phase 1 only.
All figures are rounded to reinforce the conceptual nature of this analysis.

NEW ORLEANS BIKE SHARE FEASIBILITY STUDY AND BUSINESS PLAN | FINAL REPORT
Regional Planning Commission for Jefferson, Orleans, Plaquemines, St. Bernard, St. Tammany and Tangipahoa Parishes | City of New Orleans | State Project #H.972035 | 1-1
1 INTRODUCTION Emerging from the post-Katrina rebuilding years, New Orleans has reestablished itself as a dynamic
city, balancing constant change, economic growth, and population influx with a deeply rooted
respect for history, tradition, and culture. The city offers a rich quality of life rooted in its vibrant,
pedestrian friendly streets, diverse historic neighborhoods, entrepreneurial spirit, and growing
economy. These elements, along with a transit rich urban form, are the backdrop for unique
amenities and critical destinations that residents and visitors seek to access and enjoy year round.
However, a number of transportation challenges persist that threaten New Orleans’ high quality of
life. Congestion, air pollution, and the slow recovery of rubber-tired transit service since Katrina
hamper the overall health and economic prospects of the city. The City and its public sector partners
have made concerted efforts to balance livability, economic sustainability, social equity, and
environmental health through transportation policies, infrastructure, and initiatives that will provide
residents and visitors with more transportation choices.
Bay Area Bike Share has seen early success, which has spurred earlier than anticipated expansion to areas throughout the San Francisco Bay Area.
Bike share has been identified as one tool to meet resident, worker, and visitor mobility needs. It
supports multiple ongoing initiatives, including active transportation, economic development, public
health, and equity initiatives. Rooted in the momentum of these initiatives, this New Orleans Bike
Share Feasibility Study and Business Plan examines the feasibility of a bike share system in New
Orleans and makes recommendations based on lessons learned in peer cities. The unique
Source: Bay Area Bike Share Source: Bay Area Bike Share

NEW ORLEANS BIKE SHARE FEASIBILITY STUDY AND BUSINESS PLAN | FINAL REPORT
Regional Planning Commission for Jefferson, Orleans, Plaquemines, St. Bernard, St. Tammany and Tangipahoa Parishes | City of New Orleans | State Project #H.972035 | 1-2
constraints, opportunities, and needs of New
Orleans residents necessitate an in-depth look
at whether an equitable and well-served bike
share system could operate. The study’s
process and final document identifies a
recommended implementable service area, a
sustainable business model, funding
opportunities, and implementation
considerations. The study considers the very
real challenges of implementing a new transit
system, and highlights factors that will impact
the viability and success of bike share in New
Orleans.
NEW ORLEANS, AT A GLANCE
The city’s 370,000 residents live in 72 distinct
neighborhoods that range in urban form and
character from central business district to
mixed use historic neighborhood to single use
districts and arterial commercial corridors.
Many of these neighborhoods and broader
districts exhibit unique urban transportation
challenges and opportunities.
New Orleans has developed a dense public
transportation network including buses,
streetcars, and ferries. Although the system
serves all neighborhoods, lengthy headways, limited operating hours, and poor coverage in some
areas keep many from utilizing the transit system. Other routes face peak crowding and duplicitous
service. Many riders walk long distances and/or wait for long periods at transfer points.
New Orleans has the highest bike ridership rate of any major Southern city (8th highest in the US).
The city has made significant progress in growing the bikeway network from 5 miles before
Hurricane Katrina to nearly 100 miles now. In addition, approximately 60% of New Orleans’ 72
neighborhoods are now served by bikeways. Nonetheless, the bicycle network also faces a number of
challenges. Limited bikeway connectivity between neighborhoods and major destinations and a lack
of wayfinding stymie potential bicycle users. A backlog of pavement maintenance needs affects users
of all modes and constrains the transportation budget.
Pressures on the city expand beyond transportation infrastructure and mobility issues, however. As
mentioned in the New Orleans 2030 Master Plan, the city faces unique climate and economic
pressures. As the city moves forward in a post-Katrina economy built around resiliency, the city has
established an ethos of innovation.
This is evident by the city's ability to attract the highest rate of entrepreneurship in the United States.
The metropolitan area’s rate of business startups is more than 50% higher than the national average.
What is Bike Share?
Bike share is a low-cost, flexible public transportation service that provides on-demand access to a network of publically-rentable bicycles. Depending on the type of system employed, public bicycles are distributed across a defined service area at fixed smart docking stations locations, hub locations, or individual public bike racks. Due to the point-to-point nature of bike share, this form of public transportation generally accommodates shorter trips that replace less efficient auto and transit trips (trip lengths average between 1 and 3 miles).
With over 30 systems operating in the United States as of July, 2014, and over one hundred more in planning or pre-implementation stages, bike sharing is the fastest growing form of public transportation in the United States. No other form of public transportation is able to unlock a wide range of community benefits—such as local environmental health, energy sustainability, quality of life, public health, and economic activity—for the same modest level of capital and operating
investment.

NEW ORLEANS BIKE SHARE FEASIBILITY STUDY AND BUSINESS PLAN | FINAL REPORT
Regional Planning Commission for Jefferson, Orleans, Plaquemines, St. Bernard, St. Tammany and Tangipahoa Parishes | City of New Orleans | State Project #H.972035 | 1-3
Entrepreneurship spiked shortly after Katrina and has remained higher than the national average
ever since. Annually, out of every 100,000 adults, 501 have started businesses.1
From this entrepreneurial spirit have risen a number of innovative approaches to tackling
transportation, land use, equity, and public health challenges. This has spilled over to various public
policy and planning initiatives, including:
Complete Streets Ordinance. The City of New Orleans unanimously passed a Complete
Streets Ordinance requiring that all transportation improvements be planned, designed, and
constructed to encourage walking, bicycling, and transit use. Bike share frequently spurs the
development of bicycle infrastructure by generating momentum for bicycle improvements in
the community, so bike share will both help achieve the goals of the initiative and benefit
from it. The Complete Streets Ordinance can be viewed here.
The Fit NOLA Partnership. The partnership has brought together over 100 organizations
to develop a strategy for a fitter, healthier New Orleans. Looking for ways to make physical
activity easier for all New Orleanians is a critical component of this effort. Considering the
positive health outcomes that bike share can bring to a community, bike share could help
achieve the goals of this initiative in direct ways.
Lafitte Greenway. The 3.1-mile Lafitte Greenway and Revitalization Corridor will restore
many of the areas devastated by Hurricane Katrina between Mid-City and the French
Quarter. Running along a former rail corridor, this greenway will provide direct access to the
CBD amenities as well as neighborhoods and City Park. Bike share stations along this
corridor will create better access and bring positive economic benefits to adjacent
neighborhoods.
The Lafitte Greenway will run between Mid-City and the French Quarter, creating a comfortable bicycling environment.
1 Brookings Institution. (2013) The New Orleans Index at Eight. https://gnocdc.s3.amazonaws.com/reports/GNOCDC_NewOrleansIndexAtEight.pdf
Source: City of New Orleans

NEW ORLEANS BIKE SHARE FEASIBILITY STUDY AND BUSINESS PLAN | FINAL REPORT
Regional Planning Commission for Jefferson, Orleans, Plaquemines, St. Bernard, St. Tammany and Tangipahoa Parishes | City of New Orleans | State Project #H.972035 | 1-4
Livable Claiborne Communities. The City of New Orleans recently completed a study to
understand how communities along the Claiborne Avenue corridor can be strengthened and
revitalized for its residents and for the city and region. The study is an integrated
transportation and neighborhood revitalization planning process identifying ways in which
the City can meet the transportation needs of the community, and the result may lead to
more bicycle infrastructure in the neighborhood.
New Developments. A wave of new developments has created numerous sites ideal for
bike share. The biomedical corridor is expected to bring 11.6 million square feet of new and
renovated building space and 34,000 new jobs. Other projects provide a multitude of mixed
use residential and commercial developments. World class attractions generate tremendous
visitor interest and activity.
Bike share can build on these initiatives, working to augment transit, improve access to jobs, and
spur the development of more bicycle infrastructure. In doing so, the system will add to the city’s
overall livability goals.
In addition to the more recent initiatives, bike share will also benefit some of New Orleans’ more
established assets. The numerous lively entertainment districts attract residents and visitors every
week of the year. Events, such as Mardi Gras, the New Orleans Jazz and Heritage Festival, and
Essence Festival are also enjoyed by visitors and residents alike. While these events are part and
parcel of the City’s cultural backbone, their demand for access create immense pressure on the City’s
already taxed street network and transit system. Traffic congestion, limited parking supply, and
slowly improving transit service levels could be mitigated by a bike share system. As a new mobility
choice—especially one with 24-hour service—bike share would give people a flexible, low cost
transportation choice that does not require the construction of new parking garages or clog the street
network.
The built environment and policy conditions listed above are critical factors in determining bike
share feasibility. Additional existing condition details can be found in the Environmental Scan in
Chapter 2 or Appendix B.
REPORT STRUCTURE
This feasibility study is unique in analyzing and evaluating the costs and tradeoffs of both a
traditional station-based (or smart-dock system) system and the emerging hub-based smart-bike
system model. The New Orleans Regional Planning Commission (RPC) and the City of New Orleans
jointly funded this Bike Share Feasibility Study and Business Plan as a result of a high-level bike
share study produced by Bike Easy and a 2013 EPA Building Blocks for Sustainable Communities
technical assistance workshop. This Study addressed:
Identification of vision, goals, and objectives for bike share
Engagement of key stakeholders
Development of an organizational and governance strategy for New Orleans
Creation of a high-level business plan, bike share demand analysis, and feasibility
assessment
This report is an action-oriented planning document that provides implementation guidance for a
potential future bike share in New Orleans. The report is organized as follows:

NEW ORLEANS BIKE SHARE FEASIBILITY STUDY AND BUSINESS PLAN | FINAL REPORT
Regional Planning Commission for Jefferson, Orleans, Plaquemines, St. Bernard, St. Tammany and Tangipahoa Parishes | City of New Orleans | State Project #H.972035 | 1-5
Chapter 2 assesses the anticipated outcomes and benefits of a bike share system in
New Orleans. This chapter also presents the goals established by community stakeholders
that fed into the organizational and system evaluation.
Chapter 3 summarizes an extensive environmental scan, highlighting key existing
conditions that impact the viability and long-term sustainability of bike share in New
Orleans.
Chapter 4 examines and assesses the applicable organizational structures that could
own, administer, and operate a bike share system. The formal organizational
recommendation impacts everything from the system’s design and implementation
considerations at the end of the report.
Chapter 5 represents the first part of the business plan. This chapter defines the two
system types evaluated during this study—including a station-based system and a hub-
based, smart-bike system—and establishes the recommended service area and
conceptual phasing for the two system options based on the demand analysis and
ridership forecast results.
In the second part of the business plan, Chapter 6 establishes the start-up, capital, and
operating costs of two system types by phase.
In the final element of the business plan, Chapter 7 presents a menu of available funding
options for capital and operations available and establishes a potential funding strategy
that can guide the program as it seeks funding for initial capitalization and operations.
Chapter 8 presents an action-oriented implementation strategy including an equity
action plan that will catalyze the bike share program from planning phase to pre-launch
activities.
At the end of the report, the Appendix details the business plan’s cost assumptions and the
briefing paper (with a detailed environmental scan).
This report is a planning document. Much of the analysis uses assumptions based on the experience
of existing bike share programs that exhibit similar conditions as New Orleans. Organizational,
demand, and financial analyses conducted during this study employ as much locally relevant data
and assumptions as feasible. However, bike share remains a relatively new and constantly evolving
experience in the United States. Thus, the entities tasked to administer and operate the bike share
system should likewise continue to learn from emerging efforts and adjust assumptions as necessary.

NEW ORLEANS BIKE SHARE FEASIBILITY STUDY AND BUSINESS PLAN | FINAL REPORT
Regional Planning Commission for Jefferson, Orleans, Plaquemines, St. Bernard, St. Tammany and Tangipahoa Parishes | City of New Orleans | State Project #H.972035 | 2-1
2 ACHIEVING OUTCOMES, DEFINING SUCCESS
Some of the most important metrics of system success are qualitative rather than quantitative. While
number of users is important, equally important are the urban objectives bike share supports. Urban
revitalization, cultural shifts in how people move, and fostering a more bicycle-accepting culture are
often overlooked components of bike share.
Some neighborhood characteristics yield higher ridership counts than others. Compact, mixed use,
bikeable communities are typically able to support a dense network of productive bike share stations.
Nice Ride Minnesota characterizes these communities as Bike Places, which exhibit:
A demographic shift reflecting the national trend towards changing housing (compact
rather than dispersed), technology (broad adoption of smart phones), and travel
(diminishing reliance on automobiles) preferences.
Dense residential and employment centers able to support 18-hour activity.
A continuous network of dense, mixed-use neighborhoods housing a variety of local
and regional destinations.
A diversity of transportation options.
A wealth of urban amenities including public spaces and human-scale main streets with
restaurants, bars, and other retail options.
A comfortable and extensive bicycle infrastructure.
Community programming, events, and cultural attractions.
Visitor amenities including hotels and destinations.
Parking pricing levels that reduce congestion and encourage non-auto travel.
A Productive transit system and a strong transit culture.
General cultural awareness of bicycling.
The conditions listed above collectively make up a Bike Place and serve as the critical threshold of a
community able to support a public bike share system. Operational considerations bring different
measures of success. Programs planned to limit the amount of rebalancing2 necessary lead to
reduced emissions produced by the program. Additionally, many programs consider well maintained
bicycle fleets and successful service calls when evaluating the success of the program.
2 Rebalancing refers to the ongoing, and often complex, operational cost driver of a bike share system. Motorized vehicles or high capacity rebalancing bikes redistribute bikes over the course of a service day to ensure the appropriate number of bikes and open docks are available to customers.

NEW ORLEANS BIKE SHARE FEASIBILITY STUDY AND BUSINESS PLAN | FINAL REPORT
Regional Planning Commission for Jefferson, Orleans, Plaquemines, St. Bernard, St. Tammany and Tangipahoa Parishes | City of New Orleans | State Project #H.972035 | 2-2
What challenges lay ahead for New Orleans?
The expectations for bike share programs are set high as a result of the well-publicized success of larger programs. Although bike share is becoming a common form of transportation for many cities, it is still relatively new, and brings challenges that other modes of transportation do not have.
Safety: Despite the outstanding safety record of bike share programs, a frequent concern community members have is safety. Few on-street bicycle facilities and low helmet rates among bike share users exacerbate safety concerns.
Advertising: Cities with strict for-hire vehicle advertising and sign codes, such as New Orleans, Honolulu, and Savannah, have heightened concerns with regard to advertising and bike share systems. Advertising revenue is a major and vital source of revenue for most programs, meaning that this issue will likely need to be amicably resolved (see Appendix B for more information).
Historic Districts: If New Orleans implements a bike share program, a major challenge will be working within the existing codes related to development in historic districts (see Appendix A for more information). New Orleans has unique historic districts, but other cities have faced similar constraints. In New York City, for instance, “landmark districts” prohibit billboards and other large advertising. Stations were eventually permitted in these areas after working with neighborhood associations and historic preservation commissions. These stations, however, do not have large advertisements as are found at other stations.
Parking/Sidewalks: Parking challenges also frequently develop when implementing stations. When the sidewalks are too narrow to site a station, docking stations may be placed in the street replacing a parking space. This can result in objections from nearby businesses or residents.
Equity: Equity is an essential consideration for any mass transit system. However, to many, bicycling is perceived as transportation mode for upper-class whites. Ensuring that all community members have access to the system will work to breakdown this misconception.
Vandalism: Bicycles are seen as small, light and highly mobile which raises concerns that they are vulnerable to theft and vandalism. Despite the fact that most systems experience few problems, vandalism continues to be a significant perceived concern among communities.
Evolution of bike share: The transportation industry, like all modern industries, is innovating rapidly and bike share, more than most modes, is benefiting from rapid advances in both hardware and technology systems. Despite the opportunities permitted by these evolving systems, they bring with them inherent risks and untried or immature approaches. While these new systems hold great promise, municipalities are inherently risk-averse and are not eager to be the first adopter and test market.
BIKE SHARE AND ITS ANTICIPATED OUTCOMES
Bike share is the most cost-effective transportation system investment on a dollar invested per trip
and consumer cost per trip basis. Bike share is having transformative effects on urban mobility,
while demonstrating the ability to improve local economic activity and access to jobs, quality of life,
public health and environmental conditions. Bike share systems have proven popular among
residents, visitors, and businesses seeking walkable, vibrant urban neighborhoods. No other form of
public transportation is able to unlock such wide ranging benefits for such a modest level of capital
and operating investment.
From the long list of benefits, successful programs prioritize goals and design a system that best
meets those goals. A system aimed to cater to tourists may have a different spatial layout than a
system focused on equity; similarly, a system with the intention of helping more people commute by
bicycle would differ from a system focused on recreation.
The following sections outline some of the most evident outcomes of bike share in New Orleans.

NEW ORLEANS BIKE SHARE FEASIBILITY STUDY AND BUSINESS PLAN | FINAL REPORT
Regional Planning Commission for Jefferson, Orleans, Plaquemines, St. Bernard, St. Tammany and Tangipahoa Parishes | City of New Orleans | State Project #H.972035 | 2-3
Equity
Many transit-dependent residents cannot comfortably depend on transit. In many lower income,
job-poor neighborhoods transit service is of lower frequency (30 to 60 minute headways), shorter
span (reducing or suspending service after 8pm), indirect (requiring a transfer to the final
destination) and/or unreliable (experiencing congestion delays that may delay arrival times). Entry-
level or hourly workers can scarcely risk being late to work for fear of penalty or firing. Nor can they
afford excessive unproductive (e.g. non-wage earning) time in transit while they must pay for
childcare or miss the opportunity for additional time on their second or third job.
Capital Bikeshare in Washington DC and surrounding cities prioritized system expansion in areas that served traditionally disadvantaged populations. Today, the system serves all neighborhoods in the District and is working to bring more stations to areas with the greatest need.
Source: Capital Bikeshare
Bicycle travel provides highly reliable travel times, virtually no limitation on “frequency” or “span” of
service (as it is on-demand), and extremely low costs to users and providers. According to American
Community Survey five-year estimates (2009-2013), nearly 9% of employed residents in New
Orleans do not have a vehicle available. In some neighborhoods, the rate of zero-car households is
much higher. Along the Claiborne Corridor, an estimated 40% of residents do not have access to a
vehicle. Bike share may add convenience to many of these residents by providing reliable service to
bus stops and other destinations.
For these reasons and more, many bike share programs have begun looking at the needs of lower
income, job- and amenity-poor and/or lesser served neighborhoods when determining new station
locations. A study from London’s Barclays Cycle Hire program found that stations in low income
areas frequently outperformed those in higher income areas.3 Nice Ride Minnesota in the Twin Cities
has sited stations in low income communities, particularly communities underserved by transit or
places with higher rates of obesity, diabetes, or transit use. These stations are not located in areas
with characteristics historically predictive of high bike share ridership, but they will help the
program achieve its goal to improve transportation access across all incomes. Stations placed in low
income areas of New Orleans could help deliver greater access to jobs, education centers, healthcare,
groceries, libraries, and parks that certain areas of the city currently lack.
With new innovative strategies, bike share also may benefit members of the community who are
unbanked, which means they have no checking or savings account. According to a study authorized
by the U.S. Department of Treasury, 12.5% of Orleans Parish households are considered unbanked.
This compares to 5.1% in the metropolitan area, 8.7% in the state, and 7.7% in the nation. This 12.5%
3 Ogilvie, F. & Goodman, A. 2012. Inequalities in usage of a public bicycle sharing scheme. Preventive Medicine55(1): 40-45.

NEW ORLEANS BIKE SHARE FEASIBILITY STUDY AND BUSINESS PLAN | FINAL REPORT
Regional Planning Commission for Jefferson, Orleans, Plaquemines, St. Bernard, St. Tammany and Tangipahoa Parishes | City of New Orleans | State Project #H.972035 | 2-4
represents 14,241 unbanked households. Another 25.5% or 29,053 of Orleans Parish households are
considered underbanked. Underbanked is when a person has an account but continues to rely on
alternative financial services, like check cashing services, payday loans, rent-to-own agreements, or
pawn shops. Once again, the Orleans Parish percentage of 25.5% is higher than the metropolitan
percentage of 18.1%, Louisiana’s 22.9% and the nation’s 17.9%.4
Transportation Efficiency
Bike share expands mobility, raises bicycling and transit ridership rates, and reduces automobile use.
In some systems, up to 50% of users expressed that they make more trips by bicycle.5 Approximately
25-45% of bike share trips replace a vehicle trip.6 Bike share also helps improve transit efficiency and
reduce urban core crowding on transit. In Washington, DC, 25% of Capital Bike share users switched
from a short transit trip. Although converting some transit trips to bicycle trips, bike share does not
negatively compete with transit. Instead it provides added overall system flexibility and travel choice
that enables transit to confidently convert additional auto trips. In neighborhoods underserved by
transportation options are offered with inefficient transit routing (e.g., loop routes), bike share can
expand mobility and access options, improve connections to transit, reduce transit wait times, and
even eliminate the need to transfer between routes or transit services. In New Orleans, this could
help serve some of the most crowded bus routes, such as routes serving certain areas of the CBD,
New Orleans East and Algiers.
More information related to meeting the equity challenge in underserved transit communities is
listed in the case studies in Appendix B.
Last Mile Connectivity
Bike share systems in other cities
have seamlessly provided transit
connections, implementing bicycle
docking stations at major transit
centers like rail stations or bus
transfer hubs. The New Orleans
Regional Transit Authority (RTA)
and the Jefferson Parish
Department of Transportation (JeT)
serve more than 400,000 residents,
roughly a third of the population in
the New Orleans–Metairie-Kenner
Metropolitan Statistical Area. By
locating bicycle docking stations at
transit centers, New Orleans bike
share could enable easier access to transit, particularly to residents living more than a half mile from
4 City of New Orleans Office of Community Development http://www.nola.gov/community-development/documents/general-reports/2012-2016-consolidated-plan-city-of-new-orleans-w/
5 Velib’ Website, “Now We Know You Better;” (http://www.velib.paris.fr/les_newsletters/10_aujourd_hui_nous_vous_connaissons_mieux).
6 Based on 2012 Denver B-Cycle and Capital Bike share data.
Bike share stations in Minneapolis are located near transit stops to help transit riders reach the last mile of their destination. Source: Nelson\Nygaard

NEW ORLEANS BIKE SHARE FEASIBILITY STUDY AND BUSINESS PLAN | FINAL REPORT
Regional Planning Commission for Jefferson, Orleans, Plaquemines, St. Bernard, St. Tammany and Tangipahoa Parishes | City of New Orleans | State Project #H.972035 | 2-5
a transit stop. This will provide added mobility that current transit cannot provide at a fraction of the
cost. Moreover, in areas with limited nighttime or weekend service, bike share could help some
transit patrons access their stops more efficiently.
Bike share works as a supplement to the transit system, enabling transit riders to get to the optimal
transit lines for their trip. This minimizes their transfers between lines and makes transit a more
convenient choice for a larger group of people.
A Healthier New Orleans
Many people in New Orleans are afflicted with preventable diseases related to inactivity and
sedentary lifestyles. Roughly 12% of New Orleans’ population has diabetes, and 32% are clinically
obese based on Body Mass Index (BMI).7 Bike share not only provides an additional option for
meeting a necessary household trip but concurrently provides an opportunity for physical activity –
an imperative to mitigate the upward trends of these diseases. For instance, a 15-minute bike
connection made just four times per week would burn about 500 calories a week and 26,000 calories
per year. In the first 6 years of Paris’ Velib system, users burned a combined 19 billion calories. This
upward trend in active transportation and increased physical activity is likely to be replicated in New
Orleans, as other systems have reported up to 66% of surveyed users stating increased bicycling
outside of bike share use since subscribing. Just as important, the endorphins released while
engaging in active transportation increase personal happiness, blood circulation, energy, memory,
and overall job performance necessary for employment success and advancement.
Healthcare organizations in cities across the country have seen the positive impact bike share has on
the health of their communities. Frequently, these organizations, which include public health
agencies, hospitals, and private foundations, provide grants to promote the use of the system,
particularly in areas with health disparities.
A More Sustainable New Orleans
Bike share contributes to broader environmental goals by providing alternatives to the motor vehicle.
This results in reductions of vehicle miles traveled (VMT), greenhouse gas emissions, air pollution,
and dependence on petroleum. In 2012, Capital Bikeshare trips in the Washington DC region
resulted in 1.2 million pounds of carbon emissions avoided and reduced 4.4 million VMT. Paris’
Velib system has saved 274 million pounds of carbon emission since beginning operations in 2007.
As ridership grows, bike share programs can result in noteworthy reductions in a city’s emissions.
7 New Orleans Health Department (2010). Healthy Lifestyles in New Orleans. http://www.nola.gov/nola/media/Health-Department/Publications/Healthy-Lifestyles-in-New-Orleans-Community-Health-Data-Profile-final.pdf

NEW ORLEANS BIKE SHARE FEASIBILITY STUDY AND BUSINESS PLAN | FINAL REPORT
Regional Planning Commission for Jefferson, Orleans, Plaquemines, St. Bernard, St. Tammany and Tangipahoa Parishes | City of New Orleans | State Project #H.972035 | 2-6
The benefits of bike share grow with increased ridership. More people using the bikes means reduced VMT and vehicle emissions.
Source: Richard Masoner
Regional and National Competitiveness
Cities are actively participating in a global marketplace of people choosing to live where they want,
employers choosing where to locate, and consumers choosing where to make their next vacation and
spend their disposable income. In order to attract employers, a talented workforce, and visitors,
cities must offer amenities that make a place livable and easy to navigate.
Of the U.S.’s top ten vacation destinations, New Orleans is the only major tourist market without a
bike share system on the ground or in implementation phase.8 Nearly every city with a convention
center either has a system, has it funded or has selected a vendor. This is not the case in New
Orleans. Creating a bikeable city is increasingly attractive to people looking for places to live and
tourists seeking urban destinations that do not require the use of a motor vehicle. Cities like Atlanta,
Nashville, Memphis and Raleigh are investing in bicycle infrastructure and programs as a tool to
entice a workforce that is increasingly attracted to vibrant, diverse, urban places.9
Economic Productivity
The retail spending behavior of bicyclists is well documented. In Portland, shoppers arriving by
bicycle spend 20% more each month than those arriving by car (spending less per trip but making
8 Trip Advisor. Top 25 Destinations in the U.S. http://www.tripadvisor.com/TravelersChoice-Destinations-cTop-g191
9 Angie Schmitt (2013). “Chicago, Seattle Mayors Spar Over Bike Lanes, Tech Workers”, Streetsblog: http://dc.streetsblog.org/2013/02/21/chicago-seattle-mayors-spar-over-bike-lanes-tech-workers/

NEW ORLEANS BIKE SHARE FEASIBILITY STUDY AND BUSINESS PLAN | FINAL REPORT
Regional Planning Commission for Jefferson, Orleans, Plaquemines, St. Bernard, St. Tammany and Tangipahoa Parishes | City of New Orleans | State Project #H.972035 | 2-7
more trips). Bike share has been linked to increased retail activity and contributes to more lively and
active mixed use and retail districts. In the Twin Cities, bike share users spend a net extra $150,000
at businesses adjacent to bike share stations. These are purchases that would not have been made
without bike share. A study of Capital Bikeshare in Washington, D.C. found that 70% of the 140
businesses surveyed stated that bike share has had a positive impact on the neighborhood, and 10%
of respondents perceived an increase in customers due to bike share. The study also received more
than 300 respondents from bike share users, two thirds of whom reported using bike share to reach
a destination associated with consumer spending.10 This figure would be compounded in New
Orleans by the number of annual visitors who frequent the urban core.
Job Creation
The experience of cities of similar size to New Orleans has shown that bike share can create 10-15
new full time jobs and 5-20 part-time positions. Job creation, however, is related to the size of the
system and the organizational model used. As the system expands to other neighborhoods or
communities and ridership grows, employment increases. Bike share programs have an opportunity
to partner with local workforce development organizations to hire from underemployed and
returning citizen populations for rebalancing the system, repairing the bicycles, or participating in
marketing efforts.
Community Benefits
Based on the recommended full system size roll out and its corresponding ridership range, New
Orleans may achieve the following community benefits:11
Figure 4 Initial projected community benefits of bike share in New Orleans
Type of Benefit Performance Metric
Equity Provide mode of transportation for 9% of New Orleans without a vehicle available
Health 58 – 70 million calories burned each year
16,500 – 20,000 pounds of fat burned each year
Environmental/ Energy
1.7 million in potential annual VMT savings
1.5 – 1.9 million estimated pounds of carbon saved annually
Economic
14-28 new jobs created directly by New Orleans’ bike share program (depending on system size and phase; does not including ancillary temporary jobs)
$125,000-$510,000 net increase in retail spending at businesses immediately adjacent to bike share stations (conservative estimate)
$1.0 – $1.2 million in potential annual savings from reduced driving
10 Anderson, Ryan, et al. (2013). Economic Impact & Operational Efficiency for Bikeshare Systems. http://ralphbu.files.wordpress.com/2014/01/virginia-tech-capital-bikeshare-studio-report-2013-final.pdf
11 The projected community benefits were modeled by extrapolating the experiences and results of existing bike share systems across North America and Europe, including Capital Bike share (Washington DC area), NiceRide MN (Twin Cities), Vélib (Paris), and others.

NEW ORLEANS BIKE SHARE FEASIBILITY STUDY AND BUSINESS PLAN | FINAL REPORT
Regional Planning Commission for Jefferson, Orleans, Plaquemines, St. Bernard, St. Tammany and Tangipahoa Parishes | City of New Orleans | State Project #H.972035 | 2-8
VISION AND GOALS FOR THE NEW ORLEANS BIKE SHARE PROGRAM
The vision and goals for the New Orleans Bike Share program were developed through a series of
“Idea Sessions.” These working groups included community, advocacy and non-profit leaders,
business stakeholders, and public officials representing a number of agencies throughout the city.
Stakeholders from the business, advocacy, and non-profit sectors joined the public officials through
each step of the process. A vision for bike share in New Orleans was collaboratively developed and is
as follows:
Bike share will serve as an accessible and affordable transportation network that benefits residents and visitors
across economic conditions and neighborhoods. This mobility tool will help New Orleans meet its equity, public
health, workforce development, economic development, innovation, and congestion relief goals.
The following goal statements derive from conversations with Idea Session and stakeholder
interview participants.
Bike share in New Orleans will…
Provide more affordable and accessible transportation options.
Lead as an international model for equitable bike share programs.
Operate in a fiscally sustainable manner minimizing ongoing operating subsidy from the City
of New Orleans.
Expand workforce mobility options.
Connect residents and visitors to the places they want to go around the City.
Employ local staff, especially from disadvantaged communities and at-risk youth programs.
Promote health and wellness, helping New Orleans become one of the top ten fittest cities in
America by 2018.
Help achieve mobility objectives including VMT reduction, congestion relief, and reduced
search-for-parking traffic and parking demand.
Facilitate a change in street culture and safety resulting in respectful co-existence among
people walking, bicycling or operating motor vehicles.
Fully integrate into the public transportation system, including fare integration.
Attract residents and visitors to all neighborhoods, spurring economic development and
retail sales.
Reinforce the City’s objective to create a pedestrian and bicycle-friendly city.
Introduce more residents to bicycle transportation and expand the number of daily bicycle
users.
Leverage public support and funding for increased and improved bicycle infrastructure.
An anticipated challenge of these goals will be achieving both the financial self-sustainability and
equity goals. Although bike share programs in peer cities continue to pursue their equity goals, these
programs rely on some public funding. Stations located in neighborhoods with disadvantaged
populations often lack many of the characteristics of stations with high ridership levels. In New
Orleans, lower income neighborhoods are often low in population and employment density. This
typically results in lower ridership levels. In subsequent chapters, this document will identify some

NEW ORLEANS BIKE SHARE FEASIBILITY STUDY AND BUSINESS PLAN | FINAL REPORT
Regional Planning Commission for Jefferson, Orleans, Plaquemines, St. Bernard, St. Tammany and Tangipahoa Parishes | City of New Orleans | State Project #H.972035 | 2-9
innovative approaches to helping make such stations more profitable. Marketing, education
campaigns, and station sponsorship are some of the ways in which a system can distribute stations
equitably while still raising adequate revenue.
Another challenge is maintaining lasting fiscal sustainability without financial support from the City
of New Orleans. Securing system sponsors, if the system depends on sponsor support, could be
challenging if the public sector does not have skin in the game. Many cities limit support of a future
bike share system to in-kind services and may help fund bike share capital (including initial
matching funds). The City has expressed interest in a sustainable system supported by ongoing
operating costs. This is an assumption employed throughout this study.
Boston’s Hubway bike share system is a great peer system Source: Nelson\Nygaard

NEW ORLEANS BIKE SHARE FEASIBILITY STUDY AND BUSINESS PLAN | FINAL REPORT
Regional Planning Commission for Jefferson, Orleans, Plaquemines, St. Bernard, St. Tammany and Tangipahoa Parishes | City of New Orleans | State Project #H.972035 | 3-1
3 ENVIRONMENTAL SCAN An early step in determining the feasibility of bike share in New Orleans is to establish a baseline
read of existing conditions relating to demographics, transportation, and land use. This
environmental scan will provide a profile of demographics and tourism, assess the built environment
and existing transportation network, and document key initiatives that support bike share. These
findings provide input into a preliminary determination of feasibility on page 3-16 and will be used
to inform the demand analysis and ridership forecast.
This chapter is an excerpt of a larger environmental scan, which is located in Appendix B.
GEOGRAPHY, DEMOGRAPHICS, AND TOURISM PROFILE
This section provides an overview of factors related to bike share use propensity, including
topography, climate, population and employment density, transit propensity, and tourism.
Topography and Climate
New Orleans is a flat city relative to many other places that have implemented or have planned bike
share programs (e.g., San Francisco, Seattle, and Pittsburgh). Yet, the city does have some minor
elevation gains, most notably between Dillard University and the Mississippi River. This elevation
gain totals less than 20 feet and will not likely be a prohibitive factor for most users. Most elevation
change results from structures like bridges and overpasses.
The humid subtropical climate may become a major barrier to use. For six months a year, the
average high in New Orleans exceeds 80°F and rises to 90°F or higher for June, July, and August.
These months are also the rainiest, experiencing as much as eight inches of rain per month. These
climatic characteristics may prevent many unaccustomed users from riding during the summer, but
the mild winters make New Orleans a year-round biking city. November through April is dry relative
to the summer, and the lower temperatures make for more pleasant biking conditions on most days.
Population and Employment Density
Population and employment densities are clustered in neighborhoods along the Mississippi River
and Mid-City. Areas closer to Lake Pontchartrain and on the Westbank have lower population and
employment densities. Historically, bike share stations surrounded by denser population and
employment activity tend to have higher patronage than stations in areas with lower densities. The
map below uses 2010 Census data and Longitudinal Employer-Household Dynamics (LEHD) data to
map population and employment densities in New Orleans. Using this map as an indicator of
neighborhood performance alone would predict that the French Quarter, Central Business District
(CBD), Uptown, Mid-City, and adjacent neighborhoods have the greatest concentration of demand
generators and therefore likely to support the highest rate of bike share usage. Parts of Gentilly,

NEW ORLEANS BIKE SHARE FEASIBILITY STUDY AND BUSINESS PLAN | FINAL REPORT
Regional Planning Commission for Jefferson, Orleans, Plaquemines, St. Bernard, St. Tammany and Tangipahoa Parishes | City of New Orleans | State Project #H.972035 | 3-2
Algiers, and New Orleans East show moderate population and employment densities, but these areas
would likely have lower ridership rates than the denser areas to the south.
Figure 5 Population and Employment Density Index (2014)
Population and employment densities are highest in the CBD, Mid-City and Uptown/Carrollton areas. Areas with higher density are more likely to host successful bike share stations.
Source: Nelson\Nygaard
Mode Split and Transit Ridership
The City of New Orleans, which has twice the bicycle mode share (people using the bicycle as their
primary commute vehicle) of any other major city in the South, has contributed to the growth in
bicycling nationwide. New Orleans has seen its bicycle mode share more than double since 2005,
rising from 1.0% of commute trips to 2.4% of commute trips in 2012.
According to American Community Survey estimates, transit mode share has declined from 12.2% in
2005 to 6.6% in 2012, at least partially a result of transit system damage caused by Hurricane
Katrina. However, transit has regained momentum with new post-Katrina investments. Ridership
has raised each of the past four years, and the Regional Transit Authority (RTA) and Jefferson
Transit (JeT) vehicles carry about 47,000 riders and 6,800 riders on weekdays, respectively. Bike
share may complement this growth in ridership by helping resolve the “last mile” issue for areas with
poor connectivity or limited hours of operation.

NEW ORLEANS BIKE SHARE FEASIBILITY STUDY AND BUSINESS PLAN | FINAL REPORT
Regional Planning Commission for Jefferson, Orleans, Plaquemines, St. Bernard, St. Tammany and Tangipahoa Parishes | City of New Orleans | State Project #H.972035 | 3-3
Transit Dependency
Population and employment density, however, are not the only factors to consider when determining
the geographic scope of bike share stations or the propensity for transit use. Certain areas of New
Orleans show a greater need for new transportation options. These areas may benefit the most from
bike share stations, even if their population and employment densities are lower than Downtown
New Orleans.
The Transit Dependency Index is based on a number of factors that have historically shown higher
transit utilization rates including census data of density of minority populations, populations who
speak a language other than English, people in poverty, and zero vehicle households. The results
show Census Block Groups throughout the city with a demonstrated need for more transportation
options (Figure 6). Most of these areas are clustered in areas with higher population and
employment densities, but many areas of New Orleans East and Algiers also have a high transit
propensity equivalent to that of the CBD. Although many of these areas have access to existing
transit lines, many of these lines have limited night or weekend service. Bike share stations in these
locations may help residents access their jobs, groceries, and other needs more efficiently in off-peak
hours.
Figure 6 Transit Dependency Index
Areas demonstrating the greatest need for transit include Treme, the Seventh Ward, and Central City. The Transit Propensity Index was calculated based on a number of factors that have historically indicated higher transit rates.
Source: Nelson\Nygaard

NEW ORLEANS BIKE SHARE FEASIBILITY STUDY AND BUSINESS PLAN | FINAL REPORT
Regional Planning Commission for Jefferson, Orleans, Plaquemines, St. Bernard, St. Tammany and Tangipahoa Parishes | City of New Orleans | State Project #H.972035 | 3-4
Tourism Profile
Residents and workers are not the only users of bike share systems. Visitors also enjoy the
convenience and cost effectiveness of bike share systems. This user group is more likely to purchase
short-term passes, which boost the ridership numbers and increase the financial viability of the
system.
As one of the most popular tourist destinations in the country, New Orleans has a large visitor base
to draw from. According to the 2012 Convention & Visitors Bureau annual report, over nine million
visitors traveled to New Orleans for vacation/pleasure or business/convention purposes. Visitors
spent over $6 billion and frequented the bars, cafes, casinos, and museums located throughout the
city; however the majority of visitors spend time in the French Quarter and/or Garden District. The
climate, topography and gridded, narrow street network of the city lend themselves well to biking
and are comfortable for inexperienced or unfamiliar users. In other cities, patrons of the businesses
enjoy the unhurried convenience of using a bicycle to ride between destinations, and bike share
could make these leisurely trips on bicycles possible.
The demographics of New Orleans’ visitors provide further evidence that bike share has demand
among tourists. Less than half (48%) arrive in a personal vehicle, and a fourth of the visitors are
between the ages of 18 and 34. This age group represents the highest age group for bike share users.
The second highest user demographic, people between 35 and 50, are also frequent visitors to New
Orleans. In total more than half of visitors are under the age of 50.12.
Visitors currently spend an average of $10 per day and $38 per trip on local transportation. Although
use of the streetcars and ferries is frequently listed among the most positive experiences of surveyed
visitors, public transportation is also among the most frequently cited negative experiences.
Comments have referred to the public transportation system as ineffective, expensive, and
inconvenient (i.e. limited hours of operation, indirect routes, and long wait times). Providing bike
share as an alternative can help boost the experience of visitors by providing a convenient and more
affordable way to travel among the city’s multitude of destinations. Most visitors, however, are
unwilling to spend more than $10 per day on transportation, so keeping the daily price of bike share
below this amount may be critical to attracting visitors.13
As shown in Figure 7, all riders of RTA rarely walk more than five blocks to a stop. Compared to
residents, visitors are less likely to walk more than a block to a transit stop. Although these results
may suggest that RTA provides convenient service for visitors and residents, this graph may also
suggest how far people are willing to walk to ride transit. Coordinating with bike share stations may
expand the number of people willing to ride transit by decreasing the time an individual will need to
reach a stop.
12 New Orleans Area Visitor Profile: Annual Report, 2012.
13 Ibid.

NEW ORLEANS BIKE SHARE FEASIBILITY STUDY AND BUSINESS PLAN | FINAL REPORT
Regional Planning Commission for Jefferson, Orleans, Plaquemines, St. Bernard, St. Tammany and Tangipahoa Parishes | City of New Orleans | State Project #H.972035 | 3-5
Figure 7 Blocks RTA Riders Walked to Transit Stop
Source: 2012 RPC Comprehensive Operational Analysis On-Board Survey
Special events, such as Mardi Gras, Jazz Fest, and Essence Festival, are opportunities to boost visitor
experience and ridership numbers. These festivals bring several challenges from the visitor’s
perspective. Difficulty finding a taxi, disrupted street connectivity, and more expensive parking can
make the experience of arriving at the events frustrating. Bike share offers an affordable
transportation option that allows the user to arrive at destinations without many of these
frustrations.
Overall, tapping into the large visitor and tourist population provides an opportunity to bolster the
financial viability of a bike share system beyond what residents and workers alone could support.
Capturing visitor spending on transportation could enable a transfer of benefit to support the
extension of the system to second or even third tier neighborhoods that would be unable to justify a
bike station on local demand alone. Visitor revenue capture is a key reason why Washington, D.C.’s
Capital Bikeshare is operating in the black.
BUILT ENVIRONMENT
The built environment in New Orleans will play a major role in the success, accessibility, scalability,
and perceived safety of bike share. Likewise, land use and right-of-way conditions will play an
important role in determining bike share ridership. This section considers these factors in light of
how compatible a bike share system would be if implemented with the existing conditions.
Land Use
Bike share performs best in compact settings offering a mix of commercial and residential uses.
Major destinations – for example entertainment districts, sporting arenas, institutions, and parks -
also generate or attract bike share demand. In addition to creating a pleasant area to explore on two
0%
5%
10%
15%
20%
25%
30%
35%
40%
45%
0-1 2 3 4 5 6 7 8 9 10 11+
Share
of
resp
ondents
Blocks Walked
Resident (n=4293) Visitor (n=323) All (n=4616)

NEW ORLEANS BIKE SHARE FEASIBILITY STUDY AND BUSINESS PLAN | FINAL REPORT
Regional Planning Commission for Jefferson, Orleans, Plaquemines, St. Bernard, St. Tammany and Tangipahoa Parishes | City of New Orleans | State Project #H.972035 | 3-6
wheels, historic districts often have narrower streets and low volume streets ideal for safe bike
conditions. This section highlights areas of New Orleans with these characteristics.
Mixed-Use Centers
New Orleans’ mixed-use centers are located in and near the CBD, Mid-City, the French Quarter,
Bywater, and Marigny, but general commercial districts can be found throughout the city. Areas with
major commercial centers located near residential land uses include Algiers, St. Roch, Gentilly
Woods, and New Orleans East. Although bike share typically performs best in mixed-use areas,
residents of single use residential neighborhoods could bike to transit stops and other amenities
located at neighborhood commercial centers.
Source: Nelson\Nygaard
Mixed use environments make for ideal locations for bike share stations because the areas include both a high number of residents and frequently visited destinations.

NEW ORLEANS BIKE SHARE FEASIBILITY STUDY AND BUSINESS PLAN | FINAL REPORT
Regional Planning Commission for Jefferson, Orleans, Plaquemines, St. Bernard, St. Tammany and Tangipahoa Parishes | City of New Orleans | State Project #H.972035 | 3-7
Figure 8 Future Land Use Map
The CBD, French Quarter, Marigny, and Bywater feature mixed use districts. Areas of Algiers, Mid-City, and New Orleans East have major commercial centers located near residential zones. Neighborhood commercial districts are scattered throughout the city functioning as ‘Main Street’ areas within residential areas.
Source: City of New Orleans, New Orleans 2030 Plan, 2010

NEW ORLEANS BIKE SHARE FEASIBILITY STUDY AND BUSINESS PLAN | FINAL REPORT
Regional Planning Commission for Jefferson, Orleans, Plaquemines, St. Bernard, St. Tammany and Tangipahoa Parishes | City of New Orleans | State Project #H.972035 | 3-8
Destinations
Sporting arenas, entertainment districts, and
museums are clustered in the CBD-French
Quarter area and many of the commercial and
mixed-use centers mentioned above. City Park,
Audubon Park, Treme, Pontchartrain Park,
Lakeshore Drive Parks, Crescent Park, and the
local universities are destinations outside the
CBD that residents and visitors frequent.
Although the CBD and French Quarter have
hundreds of destinations, the distances
between them are often too great to walk for
most people. For example, the French Quarter
stretches for nearly a mile between Esplanade
Avenue and Canal Street. Many of the hotels
and parking catering to visitors of the French
Quarter fall outside this boundary, which can
make for a long walk. This type of trip is ideal for bike share users. Opting for bike share could turn a
25 minute walk into a ten minute bike ride.
The numerous destinations in the CBD and French Quarter neighborhoods make them ideal places
for a dense network of bike share stations. Outside the CBD, the destinations are farther apart but
still numerous. While financial feasibility of service area expansion toward Lake Pontchartrain needs
to be carefully examined, expanding the network to include City Park, the Lakefront and Audubon
Park could reduce vehicle trips to these parks and help visitors explore the historic districts
throughout the city. Figure 19 displays most of the key destinations that will generate the bulk of bike
share trips in New Orleans.
A challenge for many destination cities is how to entice and enable visitors and downtown workers to
travel beyond the central districts such as the French Quarter and CBD to experience and patronize
the larger city, spreading their spending power to other neighborhoods and local enterprises. Bike
share effectively shrinks perceived distance by shrinking actual travel time thus bringing
destinations closer together and expanding the convenient range of access for downtown patrons and
workers and providing broader access from the larger city to jobs in the downtown.
Many of New Orleans’ key destinations are located near the CBD, but placing stations outside Downtown New Orleans will help visitors and residents reach parks, universities, and other neighborhood centers. Source:Nelson\Nygaard

NEW ORLEANS BIKE SHARE FEASIBILITY STUDY AND BUSINESS PLAN | FINAL REPORT
Regional Planning Commission for Jefferson, Orleans, Plaquemines, St. Bernard, St. Tammany and Tangipahoa Parishes | City of New Orleans | State Project #H.972035 | 3-9
Historic Districts
New Orleans’ historic districts are
some of the most appealing places to
ride a bicycle. Their narrow, low-
speed, low-traffic streets provide a
pleasant contrast to wide high-
volume streets. The rich
architectural heritage encourages
visitors and residents to explore
these areas at slower speeds than a
motor vehicle.
The historic districts of New Orleans
are abundant and provide great
connections between the CBD and
outlying destinations such as
Audubon Park, the Lakefront and
City Park. Assuming a clearly
marked bicycle route, a visitor or
resident could ride between the CBD
and Audubon Park in 30 minutes.
This trip is generally too far to
comfortably walk and thus favors
use of a motor vehicle. Stations placed along a bike corridor to the Park could enable a user to make a
stop and explore the Garden District along the way. Stations could also be placed near businesses as
an economic development tool.
Strict design standards, however, pose a challenge to placing stations in these districts. For many
systems, advertising at stations is a major source of revenue. Sign code restrictions could limit
revenue potential in these neighborhoods. Nearly all of the areas that have higher concentrations of
residents, attractions or jobs – the generators for bike share use – are within a local or national
historic district or neighborhood conservation area. While this would not preclude bike share, it
introduces a significant factor to consider in equipment selection and system design.
Riding through New Orleans’ historic districts offer low-traffic streets for people on bicycles to enjoy. Source: Nelson\Nygaard

NEW ORLEANS BIKE SHARE FEASIBILITY STUDY AND BUSINESS PLAN | FINAL REPORT
Regional Planning Commission for Jefferson, Orleans, Plaquemines, St. Bernard, St. Tammany and Tangipahoa Parishes | City of New Orleans | State Project #H.972035 | 3-10
Figure 9 New Orleans Historic Districts
New Orleans’ numerous historic districts are destinations in themselves, and they can also serve as pleasant, low traffic bicycle routes between the CBD and outlying destinations.
Source: City of New Orleans, New Orleans 2030 Plan, 2010
Right-of-Way
New Orleans has a dense network of streets,
which is one of the best indicators of a great
bicycling city. The small block sizes keep
motor vehicle speeds low and provide
alternatives to streets with high traffic
volumes. The existing street network
presents great opportunities to develop a
low-stress neighborhood bikeway network.
The fine grid of streets provides great
connectivity between bike share stations
and businesses and destinations in all
directions around it.
Yet, pavement conditions of many of these
streets are poor. Even though public bikes
The dense network of streets and small block sizes allow pedestrians and people on bicycles multiple low-traffic alternatives to arterials.
Source: NACTO Urban Street Design Guide

NEW ORLEANS BIKE SHARE FEASIBILITY STUDY AND BUSINESS PLAN | FINAL REPORT
Regional Planning Commission for Jefferson, Orleans, Plaquemines, St. Bernard, St. Tammany and Tangipahoa Parishes | City of New Orleans | State Project #H.972035 | 3-11
are sturdy, they will require more frequent maintenance on streets with poor pavement conditions.
Moreover, the ride will be less comfortable–and therefore less desirable—for users. Street lighting
may also pose an issue. Although bike share bicycles are equipped with front and rear lights, street
lighting is improving along many streets in New Orleans and patrons may feel uncomfortable cycling
on dark streets in evening hours.
Another challenge for these streets is the narrow sidewalks. Bike share stations require between six
and 8 feet of sidewalk depth. If the sidewalks are to maintain ADA standards and allow for
comfortable docking movements, stations could not be located on sidewalks less than 10-feet in
width. On streets with on-street parking, a bike share station could fit easily into a parking space.
Removing parking, however, can be a challenge in areas where parking is in high demand.
TRANSPORTATION ASSESSMENT
Another indicator of bike share feasibility is how well the base bicycle and transit network can
integrate with a future bike share system. The following sections identify gaps in the transportation
network and assess bicycle and transit network considerations as they relate to bike share.
Bicycle Network
In the past five years, the bike network in New Orleans has expanded by about 400%. Total bikeway
network distance in the city has skyrocketed to 94 miles with 60% of the city’s 72 neighborhoods
served by at least one bikeway. The existing and funded bike network contains about 24 miles of off-
street trails and more than 30 miles of bike lanes (not including shared lanes or bicycle boulevards).
Much of the mileage is concentrated in Mid-City, Gentilly, and the CBD, but Algiers, City Park,
Lakeview, and Uptown offer bicycle lanes, trails, and signage as well (Figure 10). Low volume, low
speed neighborhood streets play a significant role for people riding bicycles in New Orleans. This
street type plays a major role in more dense, historic neighborhoods in creating bike-friendly
environments. A number of these streets are designated with shared lane markings. Bike share
programs have been implemented in peer cities with much less bike infrastructure, but successful
systems are in cities where users of all levels and abilities have sufficient designated facilities to feel
safe bicycling.
Bicycle ridership in the Marigny and Bywater neighborhoods is among the highest in the city, even with limited bicycle infrastructure.
Source: Nelson\Nygaard

NEW ORLEANS BIKE SHARE FEASIBILITY STUDY AND BUSINESS PLAN | FINAL REPORT
Regional Planning Commission for Jefferson, Orleans, Plaquemines, St. Bernard, St. Tammany and Tangipahoa Parishes | City of New Orleans | State Project #H.972035 | 3-12
Figure 10 Existing and Funded Bike Network
New Orleans offers 94 miles of bikeways today. The existing and funded bike network offers more than 30 miles of bike lanes and 24 miles of off-street trails.
Source: Nelson\Nygaard
Transit System
Successful bike share programs in peer cities have worked to seamlessly integrate their bike share
program into the existing transit network by co-locating docking stations with transit stops. A
handful of programs have even implemented fare cards compatible with both bike share and the
existing transit system. This section highlights the existing network and considers the proposed
network as well.
Existing Transit Network
RTA operates a system of 32 bus routes and 4 streetcar lines within the cities of New Orleans and
Kenner. According to RPC’s Comprehensive Operational Analysis, the RTA system carried about
47,000 riders on weekdays, 38,000 on Saturdays, and 27,000 on Sundays in 2011. Base headways
are generally between 30 and 60 minutes, although the streetcar lines and a handful of bus routes
operate more frequently. Service spans are generally long, with many routes operating until
midnight or later. All routes operate daily except for 108 Algiers Local, 32 Leonidas, and 60 Hayne.

NEW ORLEANS BIKE SHARE FEASIBILITY STUDY AND BUSINESS PLAN | FINAL REPORT
Regional Planning Commission for Jefferson, Orleans, Plaquemines, St. Bernard, St. Tammany and Tangipahoa Parishes | City of New Orleans | State Project #H.972035 | 3-13
The St. Charles and Canal streetcar lines carry significantly more riders than other services (9,300
and 7,300 weekday boardings, respectively). The bus routes with the highest ridership are the 94
Broad (3,500), 39 Tulane (2,700), and 88 St. Claude/Barracks (2,200).14
Figure 11 RTA System Map
Nearly all of RTA’s 32 bus routes terminate in the CBD. JeT serves areas on the Eastbank and Westbank of Jefferson Parish.
Source: New Orleans RTA, 2012
According to an on-board survey completed during the Comprehensive Operational Analysis (COA)
of the transit system conducted in September 2011, the majority of RTA transit riders who live in
New Orleans had to make a transfer to reach their destinations. Less than a third of visitors,
however, made a transfer. Bike share as an option may reduce necessary transfers for transit riders
by providing the option to step off a bus, grab a bike, and reach their destination more quickly than
having to wait at a stop for a second or third bus.
JeT provides service on 12 fixed routes in Jefferson Parish, operating 11 bus routes on weekdays, six
on Saturdays, and four on Sundays. These routes enter the city on either Tulane Avenue or by
crossing the Crescent City Connection. Routes are classified based on whether they operate on the
14 RPC Comprehensive Operational Analysis, 2012

NEW ORLEANS BIKE SHARE FEASIBILITY STUDY AND BUSINESS PLAN | FINAL REPORT
Regional Planning Commission for Jefferson, Orleans, Plaquemines, St. Bernard, St. Tammany and Tangipahoa Parishes | City of New Orleans | State Project #H.972035 | 3-14
Eastbank or Westbank. JeT carries about 6,800 riders on weekdays, 3,100 on Saturdays, and 1,200
on Sundays. Headways are highly variable, with peak headways ranging from 20 to 78 minutes.
Service begins at 5:20 AM and ends at 10:32 PM. Route E1 Veterans carries significantly more riders
than any other route, with about 1,600 weekday boardings. The second highest route is E2 Airport,
with about 1,110 weekday boardings (RPC Operational Analysis, 2012).
Outside of the CBD, major transfer points include the
Cemeteries Transfer, the intersection of South
Carrollton Avenue and South Claiborne Avenue, the
intersection of Washington Avenue and South Broad
Street and the intersection of Pace Boulevard and
Sandra Drive. Placing bike share stations at transfer
points is critical to integrating bike share networks into
the existing transit network.
As shown in Figure 11, The Canal Street Ferry runs
between Algiers Point and the CBD, providing access
across the river for pedestrians and people with
bicycles for $2 each way. The ferry operates from 6:00
a.m. to 10:00 p.m. on weekdays, with shorter hours on
weekends. A second ferry line operates between Lower
Algiers and Chalmette. Bike share stations placed at
the ferry terminals could allow users to dock their bikes
before getting on the ferry, reducing crowding and
preventing riders from accruing additional fees for
time they are not riding the bike.
While headways and spans are generally adequate, there are few affordable alternatives for transit
users who miss their bus or ferry and cannot afford to wait for the next. Service and hospitality jobs,
which represent a large portion of the entry level jobs in New Orleans, frequently require late
evening or early morning work hours. Bike share could provide an important means to supplement
the existing transit system by providing additional flexibility and security for transit-dependent users
and effectively extend the span of transit service to provide 24-hour mobility options.
Proposed Transit Network
Based on conversations with RTA staff, the agency plans to add more than 43,000 hours of service to
their existing bus routes in 2014. These hours are being allocated across both coverage and
productivity routes. Other transit enhancements are planned for key corridors. The Regional
Planning Commission’s recently completed Comprehensive Operations Analysis proposes the
consolidation of several high ridership routes into four bus rapid transit (BRT) corridors. Of these
four routes, the following two have good potential for development:
E3 Jefferson Highway + Route 16 Claiborne: The corridor is long enough for
implementation of BRT service. Stop reduction and signal priority have the potential to
reduce up to 50 percent of runtime or about 25 minutes. Runtime savings would be
attractive for riders to wait and use the BRT service over the local on a typical 3 mile trip.
Route 94 Broad + Route 24 Napoleon: The corridor is long enough for implementation
of BRT service. Stop reduction and signal priority have the potential to reduce over 30
RTA operates four streetcar lines. The stops will make excellent locations for bike share stations and help integrate bike share into the existing transit network. Source: Nelson\Nygaard

NEW ORLEANS BIKE SHARE FEASIBILITY STUDY AND BUSINESS PLAN | FINAL REPORT
Regional Planning Commission for Jefferson, Orleans, Plaquemines, St. Bernard, St. Tammany and Tangipahoa Parishes | City of New Orleans | State Project #H.972035 | 3-15
percent of runtime or about 20 minutes. Runtime savings would be very attractive for riders
to wait and use the BRT service over the local on a typical 5 mile trip.
The Loyola Avenue Streetcar Line opened in January 2013 and future expansion has been planned.
The Rampart Streetcar Expansion will bring six sheltered stops on a 1.5-mile route extending from
Canal Street to Elysian Fields Avenue. This line is expected to open in 2015 at the earliest.
Figure 12 Planned BRT Corridors
Four potential BRT corridors were analyzed in the Regional Planning Commission’s COA.
Source: Regional Planning Commission and Nelson\Nygaard, Comprehensive Operational Analysis, 2012
Private, For-Hire Options
Residents and visitors also have private, for hire transportation options such as taxi cabs, pedicabs,
and private shuttles. While pedicabs are often utilized for the tourist experience (and not necessarily
for mobility in itself), taxi and shuttle services are often procured for longer distance trips that are
not well served by bike share. That said, bike share supports other public and private transportation
services. Rather than viewing bike share as a competitor, representatives from all walks of
transportation services and operations in cities across the United States have seen notable symbiosis
with bike share. In many cases, bike share can alleviate peak demand (mostly benefiting transit and
private shuttles) or eliminating the need to serve short, inefficient trips (particularly in the case of
taxis, if priced appropriately). Bike share also supports one-way trips which could possibly encourage
greater use of shuttles, transit, or taxis for return trips. Unmet demand during certain hours and
special events may be more easily served with bike share. This is particularly the case during
JazzFest and major events at the Convention Center and the Superdome.
IS NEW ORLEANS READY FOR BIKE SHARE?
Based on the experience of existing bike share systems and their metrics for success, New Orleans is
well-equipped to support a successful and sustainable bike share system. A high-level feasibility
determination based on known bike share demand factors is presented on the following page. These

NEW ORLEANS BIKE SHARE FEASIBILITY STUDY AND BUSINESS PLAN | FINAL REPORT
Regional Planning Commission for Jefferson, Orleans, Plaquemines, St. Bernard, St. Tammany and Tangipahoa Parishes | City of New Orleans | State Project #H.972035 | 3-16
factors include urban form factors (population, employment and destination density, and amenities
such as parks and programs), visitor population and hotel capacity, policy and planning support,
political support, partner availability, topography, weather, bikeway availability and quality,
investment, and advertising potential.
Subsequent chapters will present key risks and sensitivities that might impact the bike share
implementation timeline and the long-term success of the bike share system.

NEW ORLEANS BIKE SHARE FEASIBILITY STUDY AND BUSINESS PLAN | FINAL REPORT
Regional Planning Commission for Jefferson, Orleans, Plaquemines, St. Bernard, St. Tammany and Tangipahoa Parishes | City of New Orleans | State Project #H.972035 | 3-17
Figure 13 Bike share readiness matrix
What makes bike share
work? Readiness
Level Characteristics in New Orleans
Urban form Medium-High
New Orleans’ dense linear development pattern consists of a variety of destinations serving a variety of travel markets (commuters, shoppers, visitors, students, etc.). Interspersed throughout this linear band of development are well used parks, civic spaces, and land uses that serve residents’ daily needs. Action required: None.
Visitor population and hotel capacity
High New Orleans accommodates over 9 million visitors per year. Less than half (48%) arrive in a personal vehicle, and they spend about $10 per day on local transportation. New Orleans has 33,500 hotel rooms (not including private rental units). That’s compared to 33,000 in San Francisco, a much larger city in terms of population and employment. Action required: Perceived competition with taxis, marketing to visitors, and balancing the accessibility needs of visitors and residents.
Major Events High New Orleans hosts a number of major events that would benefit from the convenience and flexibility of bike share. Mardi Gras, Jazz Fest, Essence Festival, sporting events, and others face major transportation challenges. Visitors and residents will be able to more easily navigate street closures during these events. Action required: Communicating transportation options to event attendants and promoting bicycle circulation during parades and other events.
Policy and planning support
High Bike share supports a broad number of local, regional, and statewide planning and policy initiatives, including the New Orleans 2030 Plan, the Complete Streets Policy Ordinance, the Metropolitan Bicycle and Pedestrian Plan, the EPA Technical Assistance for Sustainable Communities: Building Blocks Report, RPC’s Comprehensive Operational Analysis, Public Works’ Standard Drawings for Pedestrian and Bicycle Facilities, and Downtown and Economic Development Studies, among many others. Action required: None.
Political support
Moderate There is general interest in the ability of bike share to expand mobility options to lower income communities and areas that increase workforce access. However, there is skepticism that the City will be able to provide long-term financial support for the system. Action required: Not all political leaders are familiar with bike share and how it will benefit the city. Additional education and engagement is needed after completing this study.
Partner availability
High New Orleans has a rich network of community partners that could help a bike share program fund initial capitalization, apply for grants, market and encourage bike share use, work with local businesses, and find job training programs for disadvantaged youth. Bike Easy, Broad Community Connections, Freret Street Main Street, the Downtown Development District, Louisiana Public Health Institute and various private sector leaders, among others, would make exceptional partners in developing a citywide system. Action required: Many community groups and potential funders are unfamiliar with how bike share will benefit the people, businesses, and places they represent.

NEW ORLEANS BIKE SHARE FEASIBILITY STUDY AND BUSINESS PLAN | FINAL REPORT
Regional Planning Commission for Jefferson, Orleans, Plaquemines, St. Bernard, St. Tammany and Tangipahoa Parishes | City of New Orleans | State Project #H.972035 | 3-18
What makes bike share
work? Readiness
Level Characteristics in New Orleans
Topography High New Orleans is much flatter than other cities with bike programs. Topographical elevation variations across the city are less than 20 feet; however structures such as bridges and overpasses do provide some greater elevation changes. This will not be a prohibitive factor for most users. Action required: None.
Weather Moderate The humid subtropical climate may be a major barrier to use. For six months of the year, the average high exceeds 80° F and rises to 90° F or higher for June, July, and August. These months are also the rainiest. Mild winters, however, make New Orleans a year-round biking city. November through April is drier, and the lower temperatures make for more pleasant biking conditions. Action required: None.
Sponsor potential
Moderate New Orleans is home to numerous major employers, including several in the utility, energy, banking and gaming industries that may be interested in being corporate or partial sponsors of the program. Partial or co-sponsorship may come from hospitals, universities, or hotels. Action required: The bike share program leadership will need to seek out title or co-sponsors of the program to help fund and market the new system.
Transit network integration
Moderate Buses, ferries, and streetcars allow people to access most neighborhoods throughout the city during the weekday. Some neighborhoods have limited access late in the evenings and on weekends. Action required: Prioritizing transit hubs with the greatest need for additional mobility options.
Bikeway availability
Low Limited bikeway coverage and narrow, uncomfortable bikeway conditions would discourage bike share use. However, the dense network of low-volume, low-speed neighborhood street factor into New Orleans’ bikeability even in the absence of improved/designated bikeways. Strategic bikeway development and better wayfinding is required to encourage broader levels of bicycling and bike share use in the future. Action required: The current bike network has gaps between key destinations (e.g. parks, grocery stores, tourist sites, etc.) The City should consider investing in key Uptown-Downtown connections as well as better connections between Mid-City/Lakeview and Uptown/Garden District.
Investment Low Capital investment coupled with redevelopment in dense urban districts like the biomedical corridor will help the City achieve the land use intensity needed to support bike share and other transit investments that accommodate short urban trips. However, efforts to increase density are limited. Action required: Current development code does not encourage the co-development of bike share stations with new mixed-use centers. This should be updated.
Advertising potential
Moderate Sign code restrictions limit the ability to generate advertising revenue in the French Quarter and other historic districts. However, advertising on the bicycles’ fenders and baskets is permitted. Outside the French Quarter and other historic districts, there is more potential for advertising at docking stations or information kiosks. Action required: Strict sign code in historic districts will reduce revenue from advertising.

NEW ORLEANS BIKE SHARE FEASIBILITY STUDY AND BUSINESS PLAN | FINAL REPORT
Regional Planning Commission for Jefferson, Orleans, Plaquemines, St. Bernard, St. Tammany and Tangipahoa Parishes | City of New Orleans | State Project #H.972035 | 4-1
4 RECOMMENDED ORGANIZATIONAL STRUCTURE
Bike share programs can be owned, managed, and operated in a variety of ways. The range of
organizational structures currently employed provides a spectrum of different management
arrangements, system operators, capital ownership, and financial risk and liability. Each type of
organizational structure carries inherent tradeoffs for the public and private sector. Assessing the
applicability of various bike share organizational structures for the City of New Orleans and the
Regional Planning Commission (RPC) is a foundational element of determining bike share’s
feasibility. This assessment will highlight opportunities for funding, level of staff capacity and
expertise, and other key decisions points such as financial risk and liability.
This section provides an overview of a range of organizational structures along with key
characteristics that define each structure. The organizational structures summarized below include:
Publically-owned, privately-operated
Non-profit owned and operated
Administrative non-profit
Privately-owned and operated
Publicly-owned and operated
Owned and operated as part of a street-furniture advertising contract.
Transit agency-owned, privately operated
The following characteristics will be used in a subsequent phase to help guide the evaluation of a bike
share program in New Orleans and determine which organizational structure would work best given
the local political environment, partners, and resources.
Financial Risk/Liability: Bike share programs require a significant amount of capital
investment (bikes and bike share stations) and come with a high level of liability (equipment
safety, crashes, theft, etc.). Who takes on the financial risk and liability issues of the program
will be a key decision factor for the City of New Orleans and RPC.
Funding Sources: The organizational structure of the bike share program influences the
funding sources available. Publicly-managed bike share programs, for example, do not have
the ability to fundraise.
Operating Responsibility: In any bike share system, there is an entity responsible for
managing the overall operations of the system, including the customer service call center,
remote system surveillance, and redistribution efforts, maintaining bicycle and station
maintenance, and providing administrative services, marketing, fundraising. Deciding
whether or not the City of New Orleans or RPC have the organizational capacity and
expertise to manage and/or operate a bike share program will be a key decision factor.

NEW ORLEANS BIKE SHARE FEASIBILITY STUDY AND BUSINESS PLAN | FINAL REPORT
Regional Planning Commission for Jefferson, Orleans, Plaquemines, St. Bernard, St. Tammany and Tangipahoa Parishes | City of New Orleans | State Project #H.972035 | 4-2
Capital Ownership: Who owns the capital property of a bike share program (i.e. bikes and
bike stations) varies by organizational structure. Bike share programs require significant
capital investment; who takes on this responsibility will need to be decided.
Separate Capital Vendor/Operator: In some cases, the vendor who provides the bikes
and bike share stations is different from the bike share operator. Bike share programs could
benefit from this model since the vendor’s mission to increase its profit margin is separated
from the operator’s mission which is to serve its customers.
Level of Staff Capacity: Whether or not the City of New Orleans or RPC have the staff
capacity, expertise, or desire to manage or operate the bike share system will play a role in
deciding the appropriate organizational structure for New Orleans.
ORGANIZATIONAL OPTIONS
The most commonly employed operating models in North America that are applicable in New
Orleans are summarized below. Additional detail and case studies related to these organizational
options can be found in Appendix B.
Option 1: Publically-owned, privately operated. In this case, a city or region contracts with a
private turnkey operator15. The public entity managing the system often owns the capital (bikes,
stations, etc.) and is responsible for establishing a sustainable funding strategy. Funding sources are
limited to public grants, membership revenue, and advertising revenue. Decision-making is typically
guided by an advisory committee, but is managed through a conventional municipal governance
process. Financial risk is assumed by the public entity, while liability coverage is assumed by the
private turnkey operator. This structure would require limited staff involvement or expertise from
the City of New Orleans and RPC since the main operating functions would be assumed by the
private operator. City or RPC staff would be required to manage the contract with the turnkey
operator, secure startup funding, and manage/coordinate a decision-making committee internally.
Capital Bikeshare in Washington, DC operates under this model.
Option 2: Non-profit owned and operated. Under this model, a private, non-profit
organization (either pre-existing or established specifically for bike share administration) manages,
owns, and operates the bike share system. The non-profit organization manages a customer service
call center, remote system surveillance, and redistribution efforts, maintaining bicycle and station
maintenance, and providing administrative services, marketing, fundraising, etc. Decision-making is
handled by a Board of Directors, which includes major private sector sponsors and elected leaders.
The non-profit model potentially has a strong ability to leverage funding since it can retain both
public funding and also fundraise from private sources. Under this structure, the City of New Orleans
and RPC would require limited staff involvement and expertise since the main operating functions
would be assumed by the private non-profit operator. Nice Ride Minnesota is an example of a
statewide non-profit owner/operator.
Option 3: Administrative non-profit. Another example of a non-profit structure is one that
owns and administers the system but does not operate it. In this case, a non-profit is formed to
15 A “turnkey operator” refers to a private, for profit vendor business that provides bike share services. There are several such companies operating in North America. While their role and responsibility varies from city to city, most turnkey operators are, under contract, responsible for delivering bike share bikes and docking stations, managing communications and software systems, operating and maintaining the bikes and docking stations, and redistributing bicycles as needed. Turnkey operator may also play a role in marketing, funding development, expansion planning, and other administrative tasks.

NEW ORLEANS BIKE SHARE FEASIBILITY STUDY AND BUSINESS PLAN | FINAL REPORT
Regional Planning Commission for Jefferson, Orleans, Plaquemines, St. Bernard, St. Tammany and Tangipahoa Parishes | City of New Orleans | State Project #H.972035 | 4-3
oversee all duties, except for day-to-day operations. The only difference between this and the non-
profit owned and operated model described above is that the administrative non-profit does not
operate the system. Instead, the non-profit often leads all fundraising efforts, prepares purchase
orders for bike share equipment, and markets bike share services. The non-profit contracts with a
turnkey private operator to implement the system roll out and operate the system. That said, the
non-profit can require the turnkey operator or a third party specialist to fulfill any of the
administrative tasks as part of the service agreement. Under this structure, the City of New Orleans
and RPC would require limited staff involvement and expertise since the main management and
operating functions would be assumed by the non-profit and private operator. Strategic decision-
making is handled by a Board of Directors under the non-profit. Denver B-Cycle and Seattle’s
impending system (Pronto Cycle Share) are examples of this business model.
Option 4: Privately owned and operated. In this case, a private operator is procured to
operate the system, while maintaining control of the capital. This operating arrangement has been
implemented in Miami Beach (DecoBike) and New York City (Citibike). The private operator also
takes ownership of fundraising, if necessary (i.e., in some cases, enough user revenue is generated to
fund the system). A private operation offers public agencies less control of system size and growth;
this depends largely on the private operator’s ability to generate revenue and their strategy to turn a
profit. This model offers public agencies limited requirement for staff time dedicated to bike share
and completely transfers risk to the private operator. A major, potential drawback for the City of New
Orleans is this model’s conflict with the need to become a leader in equitable system design and the
likely reliance on subsidy or low profit margins. This option’s likely influence on system growth
would not sync with the City’s desire to integrate bike share into neighborhoods that might not be
profitable in the eyes of a private system owner. Based on these reasons and current conditions, this
operating model was not selected for further evaluation.
Option 5: Publicly-owned and operated. In this case, the public agency—be it a city, parish,
regional government, transit agency, or state entity—procures and owns the bike share bikes,
docking stations, and supporting equipment and manages the day-to-day operations of the system.
This includes managing a customer service call center, remote system surveillance, and
redistribution efforts, maintaining bicycle and station maintenance, and providing administrative
services, marketing, fundraising, etc. This operating model has been used in European and Asian
cities (most notably in Guangzhou, China) due to their ability to secure greater public monies to
support bike share as a core urban transportation service. There are no North American examples.
Due to the lack of leading American examples, stakeholder preferences to separate bike share
operations from the City’s purview, and the amount of financial risk placed on the City, this option
was not viewed favorably. Based on these reasons and input from this study’s stakeholder input
process, this operating model was not selected for further evaluation.
Option 6: Owned and operated as part of a street-furniture advertising contract. This
operating model—common to European bike share systems—uses major street furniture advertising
contracts (e.g. JCDeceaux as funder, manager, and operator). The model relies entirely on the
revenue potential drawn from bike share station sponsorship and advertising. Due to New Orleans’s
strict public right-of-way and historic district sign codes (governed by the Historic District
Landmarks Commission and the Vieux Carre Commission) and the community value of limiting
visual clutter in the public view shed and streetscape, this operating model is likely not viable for
New Orleans. Additional barriers include a cumbersome approvals process that is too difficult to
justify financial risk to potential advertisers as well as a lack of proven experience providing
sustainable funding in the United States. Based on these reasons and input from this study’s
stakeholder input process, this operating model was not selected for further evaluation.

NEW ORLEANS BIKE SHARE FEASIBILITY STUDY AND BUSINESS PLAN | FINAL REPORT
Regional Planning Commission for Jefferson, Orleans, Plaquemines, St. Bernard, St. Tammany and Tangipahoa Parishes | City of New Orleans | State Project #H.972035 | 4-4
Option 7: Transit agency owned, privately operated. In this case, a transit agency contracts
with a private turnkey operator. The transit agency managing the system often owns the capital
(bikes, stations, etc.) and is responsible for establishing a sustainable funding strategy. Funding
sources are limited to public grants, membership revenue, and advertising revenue. Decision-making
is typically guided by an advisory committee, and, depending on the structure of the transit agency,
may be managed through a quasi-governance process. Financial risk is assumed by the transit
agency, while liability coverage is assumed by the private turnkey operator. In the context of New
Orleans, the New Orleans Regional Transit Authority (RTA) staff would be required to manage the
contract with the turnkey operator, secure startup funding, and manage/coordinate a decision-
making committee internally. This can be an appealing model given that the transit agency’s top
priority is to provide useful transit service, rather than generate revenues.
This model is not currently being deployed in the U.S.; however there are numerous European
examples including Deutsche Bahn, the rail company in Germany, Dutch Railways in the
Netherlands and Veloway (Veolia). Initial conversations considered the RTA as a potential program
administrator, but RTA officials currently hesitate to operate the system due to labor costs. Based on
these reasons and input from this study’s stakeholder input process, this operating is currently not
being selected for further evaluation.
Figure 14 on the following page summarizes the various organizational structures and includes
examples that are currently or soon to be in operation.

NEW ORLEANS BIKE SHARE FEASIBILITY STUDY AND BUSINESS PLAN | FINAL REPORT
Regional Planning Commission for Jefferson, Orleans, Plaquemines, St. Bernard, St. Tammany and Tangipahoa Parishes | City of New Orleans | State Project #H.972035 | 4-5
Figure 14 Summary of bike share organizational structures
Organizational Structure
Financial Risk/Liability Funding Sources
Operating Responsibility
Capital Ownership
Level of Staff
Capacity Peer Example(s)
Publically-owned, privately operated
Financial risk assumed by public entity; turnkey operator takes on liability risk/coverage
Public grants, membership revenue, sponsorship, advertising revenue depending on the jurisdiction
Private turnkey operator
Public entity owns equipment
Medium Washington D.C. (Capital Bikeshare)
Boston, MA (Hubway)
Non-profit owned and operated
Financial risk assumed by the non-profit entity
Fundraising opportunities, public grants, membership revenue, advertising revenue depending on the jurisdiction
Non-profit Non-profit Low Minneapolis, MN (Nice Ride Minnesota)
Administrative non-profit
Financial risk assumed by non-profit
Fundraising opportunities, public grants, membership revenue, possible advertising revenue depending on the jurisdiction
Private turnkey operator
Non-profit Low Denver, CO (Denver B-Cycle)
Privately-owned and operated
Financial risk assumed by private company
Fundraising opportunities, sponsorships, membership revenue, possible advertising revenue depending on the jurisdiction
Private turnkey operator
Private turnkey operator
Low New York, NY (Citibike)
Miami Beach, FL (DecoBike)
Publicly-owned and operated
Financial risk assumed by the public entity
Public grants, membership revenue, possible advertising revenue depending on the jurisdiction
Public entity Public entity High Various European/Asian systems
Transit agency owned, privately operated
Financial risk assumed by transit agency
Public grants, membership revenue, advertising revenue depending on the jurisdiction
Private turnkey operator
Transit agency owns equipment
Medium Systems in Germany (Call a Bike) and the Netherlands (OV-fiets)
Separate operator and vendor
Financial risk assumed by non-profit, private company, or the public
Fundraising opportunities, public grants, membership revenue, possible advertising revenue depending on the jurisdiction
Private or non-profit turnkey operator or public entity
Private turnkey operator
Low-High depending on operator
Pittsburgh, PA

NEW ORLEANS BIKE SHARE FEASIBILITY STUDY AND BUSINESS PLAN | FINAL REPORT
Regional Planning Commission for Jefferson, Orleans, Plaquemines, St. Bernard, St. Tammany and Tangipahoa Parishes | City of New Orleans | State Project #H.972035 | 4-6
ORGANIZATIONAL ASSESSMENT
Prior to evaluating the various bike share organizational structure options, the consultant conducted
a screening process based on stakeholder input. Three organizational models were selected for
further evaluation and final screening based on input from the Project Advisory Committee, Business
Advisory Committee, and various other stakeholder groups. The options that progressed to detailed
evaluation include:
Option 1: Publically-owned, privately operated
Option 2: Non-profit owned and operated
Option 3: Administrative non-profit
The following evaluation criteria were used to screen the organizational structure options and select
a preferred bike share model for New Orleans:
Capital ownership
Operational transparency
Profit sharing and risk/liability
Operating expertise
Fundraising capacity
Ability to support major events (e.g.
Mardi Gras, Jazz Fest)
Citywide expansion potential
Staff capacity / organizational interest
Equity
The matrix displayed in Figure 15 on the following page summarizes the comparative tradeoff
analysis used to evaluate New Orleans’ three organizational model options. Based on the
assessment, an administrative non-profit model (Option 3) is recommended for
implementation in New Orleans. The primary reasons for this recommendation include:
Ability of a non-profit to achieve key bike share system objectives, particularly those goals
related to equity and financial sustainability. Related to equity, an administrative non-profit
provides the flexibility to develop, test, and implement innovative solutions to engage
disadvantaged communities and remove barriers to entry. Specific programs can be
developed under the auspices of the non-profit in order to tackle core equity issues. The use
of a turnkey operator does not affect the geographic scope of the system. Turnkey operators,
in turn, often play a role in hiring people from disadvantaged communities.
Ability of a non-profit organization to secure public, private, and non-profit funding sources,
including public grant funding, general funds, non-profit contributions, and sponsor
support. The administrative non-profit model simplifies the process of receiving and using
private donations and there are no restrictions for federal funding being awarded to a non-
profit. While the City aims to limit subsidies feeding into the bike share program’s capital
and operations, low ridership or the lack of a sponsor is a real risk that may also lead to
requests from the non-profit for public funding.
The City has been historically successful at developing non-profit corporations to carry out
city services (e.g. NOLA Business Alliance and the New Orleans Recreation Development
Commission). The people of New Orleans tend to trust and place more value on grassroots
initiatives and services. A non-profit owner would instill civic ownership, if it is designed to
serve the diverse socioeconomic markets housed within the city.
Potential business partners and private and institutional sponsors in New Orleans expressed
a strong support for a non-profit organizational structure (as well as a strong preference to
remove the prospective bike share program from the City’s purview).

NEW ORLEANS BIKE SHARE FEASIBILITY STUDY AND BUSINESS PLAN | FINAL REPORT
Regional Planning Commission for Jefferson, Orleans, Plaquemines, St. Bernard, St. Tammany and Tangipahoa Parishes | City of New Orleans | State Project #H.972035 | 4-7
Liability and financial risk are not assumed by the City, but rather an independent non-
profit with multiple interests serving on the board of directors with a stake in long-term
system sustainability. This limits the potential negative public response to liability issues,
underperformance, and system failure borne on the City of New Orleans.
The City maintains the ability to influence station locations, compared to other models
where the private operator has more control over service area definition and station
locations.
Provides opportunity for a fresh image and separation of bike share organization from
existing political and public process constraints (i.e., ease of contracting, negotiations with
private entities, etc.).
Puts operations in the hands of an experienced private operator, while allowing a local
organization to achieve the program’s mission objectives.
Overwhelming positive feedback on the administrative non-profit model from an array of
public, private, and non-profit stakeholders.
Based on the success of other non-profit corporations operating in New Orleans, we recommend
establishing a non-profit corporation pursuant to the Louisiana Non-Profit
Corporation Law, Title 12, Chapter 2 of the Louisiana Revised Statutes 1950.16 While
establishing an independent 501(c)3 is an option utilized in other systems, the City should leverage
the demonstrated success of non-profit corporations established by City Ordinance while capitalizing
on the benefits of obtaining and maintaining 501(c)3 status. This will ensure the community, public
and private sector partners, and potential funders understand the City’s vested interest in fostering a
successful bike share program. We do not recommend using an existing non-profit to administer the
bike share program, as they do not have the experience to steer a transit operation.
16 See Louisiana Revised Statutes 12:201 through 12:269.

NEW ORLEANS BIKE SHARE FEASIBILITY STUDY AND BUSINESS PLAN | FINAL REPORT
Regional Planning Commission for Jefferson, Orleans, Plaquemines, St. Bernard, St. Tammany and Tangipahoa Parishes | City of New Orleans | State Project #H.972035 | 4-8
Figure 15 New Orleans bike share organizational assessment
Evaluation Criteria Capital ownership Operational transparency
Profit sharing and risk/liability
Operating expertise Fundraising capacity
Ability to support major events (e.g. Mardi Gras,
Jazz Fest)
Citywide expansion potential
Staff capacity / organizational interest
Equity
Organizational Type (and recommendation)
Option 1: Publicly-owned, privately operated Not recommended.
Public entity owns equipment and must address depreciation and replacement.
Moderate - High. Public entity controls system parameters and growth and establishes operator
contract price.
Moderate – High level of risk. Financial risk assumed by public entity (i.e., City/Parish or State). Turnkey
operator takes on liability risk / coverage.
Private operator provides operating expertise; public entity provides management
capacity.
Low – Moderate. Private and institution funding/sponsorship opportunities limited
when compared with non-profit model.
High. The City’s ability to support major events is largely determined by the service agreement with the turnkey operator. Ensuring
operations continue during major events would not be as much of a challenge because adjusting the operation using in-house resources would be integrated with necessary permitting and staffing needs.
Moderate-High. Better penetration into areas underserved by other transportation options. Growth might be reliant on
additional public funding.
Very low interest. Requires additional FTEs with skills to manage program. No funding available.
Moderate. The public entity will determine station location and how the program integrates into
disadvantaged communities. Limited ability to develop supporting programs.
Option 2: Non-profit (NP) owned and operated Not recommended.
NP organization owns equipment and must address depreciation and replacement—as opposed to a public entity.
Moderate. Board of Directors provides transparency to all sector partners.
Low – Moderate level of risk. Financial risk and liability assumed by NP. Growth depends on net revenue including user fees and sponsorship. Revenue is not shared with a private operator.
Limited operator experience can reduce service quality, reliability, and customer satisfaction.
High. NP organization is best positioned to secure public and private funding and can serve as a reliable pass through for public funds.
Low - Moderate. The NP would be able to provide support during major events but would be limited by staff capacity. May need support from the City of New Orleans (e.g., permitting).
High. Expansion guided by financial sustainability and responsiveness to mission.
Moderate interest in non-profit structure. Limited impact on City staff capacity except for public sector representation on the NP’s Board. Existing staff could support program for minor in kind services.
High. Equity decisions and innovation are based on the NP’s mission. Strong ability to develop supporting programs. The City will have some say in station siting and marketing efforts in low-income communities.
Option 3: Administrative non-profit (NP) Recommended for implementation due to minimal public sector risk, ability to attract private support, and ability to expand operations to lower demand neighborhoods.
Either the non-profit owns the equipment and must address depreciation and replacement or the system may be publically owned if
federal funds were used to procure capital.
Moderate. Board of Directors provides transparency to all sector partners.
Low level of risk. Financial risk assumed by the NP. Turnkey operator takes on liability risk/coverage.
Private operator provides operating expertise; the NP’s goal is to achieve broader mission and management capacity.
High. The NP organization is best positioned to secure public and private funding and can serve as a reliable pass through for
public funds.
Low - Moderate. The NP’s ability to support major events is largely determined by the service agreement with the turnkey operator. A contractual agreement may ensure
turnkey operator will provide support during events. May need support from the City of New Orleans (e.g., permitting).
High. Expansion guided by financial sustainability and responsiveness to mission.
High interest in non-profit structure. Limited impact on public staff capacity except for public sector representation on the NP’s Board. Existing
staff could support program for minor in-kind services.
High. Equity decisions and innovation are based on the NP’s mission. Strong ability to develop supporting programs. The City
will have some say in station siting and marketing efforts in low-income communities.
Evaluation Scale
Evaluation is based on each criterion’s impact on the City of New Orleans as well as their ability to meet the basic goals and objectives established by a group made up of public sector, private sector, non-profit, and citizen representatives that was created to explore opportunities for bike share implementation.
XXX Ideal condition
XXX Desirable condition
XXX Neutral condition
XXX Undesirable condition

NEW ORLEANS BIKE SHARE FEASIBILITY STUDY AND BUSINESS PLAN | FINAL REPORT
Regional Planning Commission for Jefferson, Orleans, Plaquemines, St. Bernard, St. Tammany and Tangipahoa Parishes | City of New Orleans | State Project #H.972035 | 4-9
THIS PAGE INTENTIONALLY LEFT BLANK.

NEW ORLEANS BIKE SHARE FEASIBILITY STUDY AND BUSINESS PLAN | FINAL REPORT
Regional Planning Commission for Jefferson, Orleans, Plaquemines, St. Bernard, St. Tammany and Tangipahoa Parishes | City of New Orleans | State Project #H.972035 | 5-1
5 RECOMMENDED SERVICE AREA AND PHASING
Determining bike share demand is the starting point of developing a financially sustainable bike
share system. This section illustrates the results of the demand analysis and presents
recommended service areas and phasing for a station-based system and a hub-based smart-bike
system. A second expansion phase has been identified for each system type, which is broadly
defined. The service boundary for the second phase could be further segmented into sub-phases
(e.g., Phase 2A, 2B, and 2C) based on available funding and community feedback for system
sizing and expansion. Future expansion decisions beyond the initial roll out phase would be
determined by the future bike share operator. Expansion would also be contingent on availability
of operating surplus to expand operations and opportunities to secure capitalization funds
(including sponsor, grant, contributions, and more). The section also illustrates conceptual
station placement based on target station spacing parameters and adjusted for destination
location and orientation toward the street. Station locations illustrated in maps do not
represent final or recommended station locations. Locations and final station sizing
should be completed during the pre-implementation phase.
SYSTEM TYPES ANALYZED
Bike share is a rapidly changing industry. The industry is becoming smarter, more efficient, and
more resilient as operators adapt to market preferences and operating challenges, and as
technology expands the utility and functionality of this nascent form of public transit. Because
bike share is in its formative stages in the transit operations industry, New Orleans has the unique
opportunity to assess the viability and strength of multiple types of bike share systems. This will
allow the City to establish a system that is uniquely suited to the conditions and needs of the City,
its residents, and visitors.
This study analyzes two types of bike share systems. This chapter develops two system scenario
concepts and the following chapters convey the cost and operating tradeoffs of each. Chapter 7
presents the recommended system type for New Orleans.
Scenario 1: A traditional dock-
based system with technology built
into the docking stations
Scenario 2: An emerging hub-based
smart-bike system with technology built
into the bicycles themselves

NEW ORLEANS BIKE SHARE FEASIBILITY STUDY AND BUSINESS PLAN | FINAL REPORT
Regional Planning Commission for Jefferson, Orleans, Plaquemines, St. Bernard, St. Tammany and Tangipahoa Parishes | City of New Orleans | State Project #H.972035 | 5-2
Scenario 1: Station-based systems
Station-based bike share systems—the dominant form of bike share now in most U.S. cities.—
provide customers a network of stations with payment kiosks and map panels. The rental
exchange occurs at the docking point as station-based technology allows users to access a bicycle
with a membership card, key fob, or access code following the purchase of a pass at the bike share
kiosk or online. Bicycles are then returned to another docking point across a network of stations.
Each dock is wired to the payment kiosk along the station’s base plate. Thus, each dock is enabled
with wireless communications.
Figure 16 Advantages and issues of dock-based bike share systems
Source: Nelson\Nygaard
Advantages
Proven technology backed by over 7 years of
performance data
Operations is well understood by bike share
operators
High visibility advertising space
Docks are clearly identifiable for wayfinding
and access/use
Iconic, predictable, and reliable station locations
Challenges/Issues
High capital cost
No flexibility in where users can dock bicycles
(relies on dense network of stations)
Can require substantial rebalancing effort with
high commuter use during peak periods
Potential for proprietary issues with docks,
bicycles and technology equipment
Wireless internet connectivity outages and solar
power disruptions can interrupt an entire station
Scenario 2: Smart-bike systems
Originally introduced in Europe, smart-bike systems utilize GPS tracking and an integrated fare
payment and locking mechanism built into the bicycles frame. The lock is compatible to fasten
with a network of public bike racks (e.g., U-Racks) that can be shared with private bicycles or with
hub locations that corral racks for smart-bike use only. For the purposes of this study, the hub-
based system is assumed allowing flexibility in the cost and amenity level of each hub location.
Hubs can be outfit with rack plates, payment kiosks, and map panels—mirroring the look and feel

NEW ORLEANS BIKE SHARE FEASIBILITY STUDY AND BUSINESS PLAN | FINAL REPORT
Regional Planning Commission for Jefferson, Orleans, Plaquemines, St. Bernard, St. Tammany and Tangipahoa Parishes | City of New Orleans | State Project #H.972035 | 5-3
of a traditional dock-based system—with networking occurring on the bicycle itself, instead of on
at the hub. We recommend eliminating out-of-hub parking to ensure reliable access to bicycles
and simplify rebalancing efforts. An alternative approach is to allow users to return their bicycle
outside the hub locations for a small fee. If this option is pursued, out-of-hub parking would only
be an option outside of historic districts. Historic districts would require parking at hub locations
to maintain the system’s orderly appearance.
A primary challenge for the City in selecting a hub-based, smart-bike system is that it is still a
relatively new concept in the U.S. and domestic systems are still being tested. As these systems
are rolled out, data and performance will be tracked and analyzed to determine needed
operational enhancements and logistical challenges of this new system type.
Figure 17 Advantages and issues of hub-based, smart-bike systems
Source: Social Bicycles
Advantages
Flexible fleet management for operators
Flexible, modular hub design can include kiosks,
map/advertising panels, or just the rack itself
Lower capital costs (between 25-50% cost
savings)
Lower cost to implement and maintain (enables
the potential for expanded service area)
Opportunity for users to park outside of hub
areas
Opportunity to trip chain (i.e., park a bike
outside of a hub location to make quick stops)
Eliminates dock-blocking issues by allowing users
to park at any public bike rack
GPS data gathering allows the system operator
to use data for system planning, assess
infrastructure needs, and locate missing
equipment
Challenges/Issues
Costly wireless connectivity fees as the number
of internet connections match the fleet size
(direct impact on operating cost)
Limited experience in the United States and
almost no data available
Rebalancing could be complicated and
unpredictable if out-of-hub parking is permitted
3G wireless internet connectivity outages can
disrupt an entire fleet rather than one hub
location (especially problematic during large
events when wireless connectivity is in large
demand in localized areas of the city)
Out-of-hub parking may limit reliable access to
the system and complicate rebalancing, more so
than with station-based systems
Lack of existing bicycle rack facilities (only a
challenge if docking is permitted outside of
hubs)

NEW ORLEANS BIKE SHARE FEASIBILITY STUDY AND BUSINESS PLAN | FINAL REPORT
Regional Planning Commission for Jefferson, Orleans, Plaquemines, St. Bernard, St. Tammany and Tangipahoa Parishes | City of New Orleans | State Project #H.972035 | 5-4
CONDITIONAL SYSTEM RECOMMENDATION
This report clearly presents the functionality, system sizing, costs, revenue, and funding gaps for
two conceptual bike share system types: A station-based scenario and a smart-bike, hub-based
scenario. Based on the data and evaluation that follows, we recommend the City of New Orleans
and the future operator develops a hub-based, smart-bike bike share system. Key rationale for
this recommendation includes:
Reduces station costs by twenty to fifty percent while maintaining similar functionality
and aesthetic appeal as station-based system.
Enables larger system coverage with the same capital cost (e.g. covers the same service
area in Phase 1 as the station based system’s Phase 2 service area)
Substantial coverage area can be achieved beyond the first phase of implementation
(depending on funding availability)
More flexibility for the user and better integration with the fixed route transit system
Serves a greater number of low-income neighborhoods, better connecting them to job
centers and transit
Doubles the potential long-term job creation at system build out than the station-based
bike share system
We must caveat this recommendation, however. The hub-based, smart-bike concept
is untested in a large urban area where trip chaining and out-of-hub parking can
create cost complexities. While we believe this to be the best existing alternative for the City
of New Orleans to achieve the stated objectives, optimize available funds, and embrace forward-
thinking technologies; we recognize that such systems are still in their infancy in the U.S. and
New Orleans can and should continue to monitor and learn from the experience of cities who
have adopted the new approaches.
The City and its future operator should pursue a hub-based, smart-bike system, if this nascent system type proves successful where they have recently been launched (e.g., Phoenix and Tampa).
Source: Coast Bike Share

NEW ORLEANS BIKE SHARE FEASIBILITY STUDY AND BUSINESS PLAN | FINAL REPORT
Regional Planning Commission for Jefferson, Orleans, Plaquemines, St. Bernard, St. Tammany and Tangipahoa Parishes | City of New Orleans | State Project #H.972035 | 5-5
The City of New Orleans should proceed with implementation of the bike share non-profit over
the next 5-6 months. In the meantime, City officials and interim Board members should
coordinate with and track the performance and functionality of North American smart-bike
systems in Phoenix, AZ (Grid Bikes), Tampa, FL (Coast Bike Share), and Hamilton, Ontario
(Hamilton Bike Share), among others. In particular, the cost estimates included in this analysis
should be compared to actual experiential costs of these systems as they become available and the
numbers re-run if necessary. Areas of potential under-estimation of costs include self-balancing
rates, price insensitivity to out-of-hub charges, and increased operating costs greater than
revenue generated. If costs for the smart-bike system prove to be comparable to a station-based
system, New Orleans should reconsider a station-based system. For this reason, this report
continues to present data for both system types in the sections and chapters that follow.
DETERMINING BIKE SHARE DEMAND
This study uses a number of key assumptions based on available data to determine demand for
bike share use in New Orleans. An initial assumption is that the system would be administered
through a non-profit and operated by a private turnkey operator. Using this key underlying
assumption, a phased system plan was developed seeking to attract the highest demand travel
markets and greatest sponsorship opportunity as possible during Phase 1. The City and
stakeholders engaged during the study process agreed it was important to establish a highly
productive core ridership base that would generate the initial value of a new public transit system,
while helping to finance future expansion. This assumes that the travel profile (high demand for
short trips) and price insensitivity of a concentrated visitor market in New Orleans’ French
Quarter and adjacent central city neighborhoods would serve as the initial base service area.
Bike share demand was
determined by a weighted
composite index methodology
using a variety of bike share
demand factors characterized
as Reside | Work | Recreate |
Move | Shop. These demand
factors are proven indicators
of bike share use propensity in
systems across North
America. Our estimation of
demand is conservative, so
not to overstate ridership and
its corresponding impact on
revenue generation. Equity
was a foundational
component of establishing the
initial roll out and future
expansion phases—balancing
the need to establish a
sustainable and productive ridership base with broad access to neighborhoods with diverse
socioeconomic characteristics. The proposed system launch approach will expand coverage
carefully in order to ensure long-term sustainable operations while accomplishing the public
transit function of bike share.
Figure 18 The "Reside | Work | Recreate | Move | Shop" demand analysis approach
The recommended system plan and phasing is based on an underlying demand analysis using the Reside | Work | Recreate | Move | Shop approach Source: Nelson\Nygaard
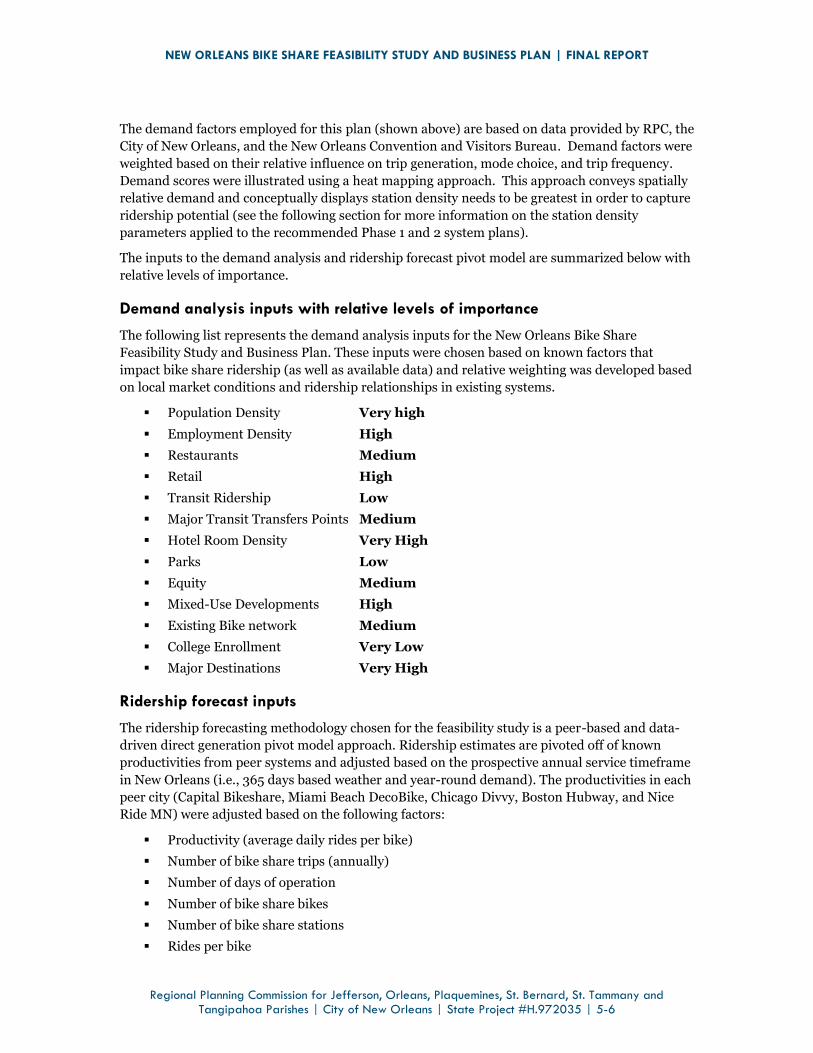
NEW ORLEANS BIKE SHARE FEASIBILITY STUDY AND BUSINESS PLAN | FINAL REPORT
Regional Planning Commission for Jefferson, Orleans, Plaquemines, St. Bernard, St. Tammany and Tangipahoa Parishes | City of New Orleans | State Project #H.972035 | 5-6
The demand factors employed for this plan (shown above) are based on data provided by RPC, the
City of New Orleans, and the New Orleans Convention and Visitors Bureau. Demand factors were
weighted based on their relative influence on trip generation, mode choice, and trip frequency.
Demand scores were illustrated using a heat mapping approach. This approach conveys spatially
relative demand and conceptually displays station density needs to be greatest in order to capture
ridership potential (see the following section for more information on the station density
parameters applied to the recommended Phase 1 and 2 system plans).
The inputs to the demand analysis and ridership forecast pivot model are summarized below with
relative levels of importance.
Demand analysis inputs with relative levels of importance
The following list represents the demand analysis inputs for the New Orleans Bike Share
Feasibility Study and Business Plan. These inputs were chosen based on known factors that
impact bike share ridership (as well as available data) and relative weighting was developed based
on local market conditions and ridership relationships in existing systems.
Population Density Very high
Employment Density High
Restaurants Medium
Retail High
Transit Ridership Low
Major Transit Transfers Points Medium
Hotel Room Density Very High
Parks Low
Equity Medium
Mixed-Use Developments High
Existing Bike network Medium
College Enrollment Very Low
Major Destinations Very High
Ridership forecast inputs
The ridership forecasting methodology chosen for the feasibility study is a peer-based and data-
driven direct generation pivot model approach. Ridership estimates are pivoted off of known
productivities from peer systems and adjusted based on the prospective annual service timeframe
in New Orleans (i.e., 365 days based weather and year-round demand). The productivities in each
peer city (Capital Bikeshare, Miami Beach DecoBike, Chicago Divvy, Boston Hubway, and Nice
Ride MN) were adjusted based on the following factors:
Productivity (average daily rides per bike)
Number of bike share trips (annually)
Number of days of operation
Number of bike share bikes
Number of bike share stations
Rides per bike

NEW ORLEANS BIKE SHARE FEASIBILITY STUDY AND BUSINESS PLAN | FINAL REPORT
Regional Planning Commission for Jefferson, Orleans, Plaquemines, St. Bernard, St. Tammany and Tangipahoa Parishes | City of New Orleans | State Project #H.972035 | 5-7
Rides per capita
Bikes per capita
Bikes per square mile of service area
Service area population and employment density
Downtown parking costs (/ hr)
Destination density (Area Walkscore proxy)
Transit boardings (number of unlinked trips) per capita
Number of tourists and visitors
Number of hotel rooms per bike
Number of university students
Bikeway network density
Bikeability, walkability, and transit orientation measures
Bike share revenue operations (#bikes*#days operation)
This approach estimated a Year 3 season ridership range. A pivot model is a way to estimate
ridership potential based on observed function of existing bike share systems. The model
aggregates a host of factors assumed to be associated with ridership coupled current system
statistics. Adjustments are made to remove some of the influences (+/-) that may distort current
ridership figure. With these adjustments made, it is possible to develop an estimated ridership by
“pivoting” off of average ridership of existing peer systems and adjusting outlier ridership
phenomena based on known ridership factors.
Adjustments were applied to metrics that may be factors associated with ridership. The amount of
adjustment per metric was determined by the assumed influence of the metric. For example, the
cost of parking downtown and number of university students were not assumed to be as strongly
associated with bike share ridership as the number of bikes in the system and the number of
tourists who visit annually. These assumptions are based on actual ridership relationships.
Adjustments ranges were placed on each metric using assumed influence. The adjustments were
applied based on the distance from the average each city’s metrics were. These adjustments were
totaled and the total adjustments were multiplied by the calculated productivity and then added
to the productivity numbers. This calculation was averaged and then multiplied by .95 and 1.15 to
give a range of relative productivity.
The Ridership Estimate is taken from the Revenue Operations calculations multiplied by the
average, .95 and 1.15 ranges of relative productivity. This number represents the average
estimated ridership of the peer systems were all associated (negative and positive) factors to be
assessed. Actual numbers rely on system size and associated factors.
Figure 19 displays the clusters of bike share demand in New Orleans. Key “hot spots” where bike
share demand is highest include the French Quarter, the CBD, and streetcar corridors along Canal
and Carrollton. Propensity for bike share use drops off to moderate and low levels as you move to
neighborhoods up and down river of the major visitor and employment centers.
It should be noted that this demand analysis and initial service area recommendations in
subsequent sections are based on current conditions. As new land uses and major trip generators
are introduced (e.g., LSU and VA Hospital facilities), demand for bike share trips will likely
increase. This could necessitate new stations/hubs or increased capacity at existing stations/hubs.

NEW ORLEANS BIKE SHARE FEASIBILITY STUDY AND BUSINESS PLAN | FINAL REPORT
Regional Planning Commission for Jefferson, Orleans, Plaquemines, St. Bernard, St. Tammany and Tangipahoa Parishes | City of New Orleans | State Project #H.972035 | 5-8
Initial station/hub locations anticipate some of these changes, but not all. Final station/ hub
locations will need to be refined during the system’s pre-implementation phase.
Figure 19 New Orleans Bike Share Demand Analysis Results
Source: Nelson\Nygaard

NEW ORLEANS BIKE SHARE FEASIBILITY STUDY AND BUSINESS PLAN | FINAL REPORT
Regional Planning Commission for Jefferson, Orleans, Plaquemines, St. Bernard, St. Tammany and Tangipahoa Parishes | City of New Orleans | State Project #H.972035 | 5-9
PHASE 1 AND 2 SERVICE AREA BOUNDARIES
The recommended Phase 1 and 2 service areas for both the dock-based and smart-bike, hub-
based systems (Scenarios 1 and 2, respectively) were defined based on six main factors:
Connectedness of demand clusters/destination density
Network barriers (both bikeway network barriers that can be improved and street
network connectivity challenges that may be difficult to overcome)
Geographic constraints (e.g., waterways/levees)
Connections to streetcar corridors, retail corridors, and trail facilities
¼ mile access buffer (based on typically tolerance for walking to public transit)
System costs (summarized in Chapter 6)
Phase 1 Scenarios, Station Spacing, and Station Locations17
The recommended Phase 1 service area for Scenario 1 – dock- based system - (shown in Figure 21
on page 5-13) encompasses 3.19 square miles of central New Orleans serving Marigny, French
Quarter, Iberville, the Central Business District, and portions of the Lower Garden District,
Central City, Treme/Lafitte, and the Seventh Ward neighborhoods. In Scenario 2 – smart bike
based system - (shown in Figure 22 on page 5-14), the recommended Phase 1 service area includes
all neighborhoods within the Scenario 1 service area and expands system access to the Garden
District, Irish Channel, and greater portions of Treme/Lafitte. It also provides access to the
periphery of Bayou St. John and Central City.
The Phase 1 launch plan for Scenarios 1 and 2 exhibits varying levels of station density, and sizing.
These differences are summarized in Figure 20. Scenario 1 assumes a 60-station network, while
Scenario 2 enjoys a denser, more expansive network of 89 hub locations. This equates to average
station density of 18.8 stations per square mile and 15.8 hubs per square mile, respectively. In
both scenarios, station spacing varies roughly by relative demand in portions of the French
Quarter and the CBD. Denser station spacing levels of 800 feet is applied to higher demand
districts like the French Quarter and downtown, whereas most other districts exhibit station
spacing between 1,000 and 1,300 feet.
These station spacing and station density standards are not applied arbitrarily. Rather, they
represent the experiences of some of North America’s most successful bike share systems in cities
with similar density and development patterns as New Orleans. More information related to
station spacing and density standards are provided in the System Parameters section below.
17 Scenario 1 expansion assumes very incremental growth, while Scenario 2 expansion is full build-out. Scenario 1, Phase 1 should be considered a “demonstration” project, while Phase 2 is considered an expansion on Phase 1. Scenario 2 Phase 1 is a true phase 1 (rather than a demonstration), while Phase 2 is considered full build out of the bike share system. Scenario 2 Phase 2 would likely roll out incrementally in sub-phases.

NEW ORLEANS BIKE SHARE FEASIBILITY STUDY AND BUSINESS PLAN | FINAL REPORT
Regional Planning Commission for Jefferson, Orleans, Plaquemines, St. Bernard, St. Tammany and Tangipahoa Parishes | City of New Orleans | State Project #H.972035 | 5-10
Figure 20 Proposed system size scenarios
Characteristics
Scenario 1, Phase 1: Dock-based
Scenario 1, Phase 1 & 2: Dock-based
Scenario 2, Phase 1: Smart-bike Hubs
Scenario 2, Phase 1 & 2: Smart-bike Hubs
Area 3.19 sq. mi. 5.73 sq. mi. 5.64 sq. mi. 22.19 sq. mi.
Number of stations/hubs 60 82 89 366
Number of bicycles 827 1,001 1,245 3,924
Number of docks/racks 1,580 1,906 2,389 7,470
Station/Hub density 18.8 stations per
sq. mi. 14.3 stations per sq. mi.
15.8 hubs per sq. mi.
16.5 hubs per sq. mi.
Dock-bike ratio 1.91 1.90 1.92 1.90
Note: Final station density may vary depending on the final station location plan.
Phase 1 station and hub locations for Scenarios 1 and 2, shown in Figure 21 and 19, were assigned
throughout the street network based on recommended station spacing standards established
above. The station locations were then adjusted based on several factors including:
Clumping of stations at major destinations or major transit corridors
Entrances of key destinations (including major tourist attractions)
Major transit transfer locations
Future redevelopment sites or major capital investments (e.g., Lafitte Greenway)
Streets with bicycle infrastructure (conversely, shying away from high volume, high speed
streets)
Recreational hubs (e.g., parks and neutral grounds with trail facilities)
Upon completion of this study and development of the bike share operator, station locations
should be further refined and finalized to provide direct station access from destinations and
ensure stations’ spatial requirements adhere to local codes.
Phase 2: Future Expansion
As illustrated in Figures 23 and 24, Phase 2 expansion patterns vary significantly in Scenario 1
and 2 due to assumed cost savings from the lower capital costs of the smart-bike, hub-based
system. We assume that all or part of the expanded service areas would likely occur within the
first five years of operation. In Scenario 1 (station-based), minor expansion would occur at high to
moderate demand clusters in the Garden District, Treme, and Lafitte.
In Scenario 2 (smart-bike, hub-based), expansion would occur in a more dramatic fashion,
although this level of growth would likely need to be managed by sub-phase. Scenario 2 Phase 2
includes expansion beyond the Phase 1 service area to contiguous clusters of high, moderate, and
low demand areas such as Mid-City, Central City, Bayou St. John, Treme, Lafitte, Hollygrove,
Leonidas, Carrollton, Freret, Uptown, Bywater, St. Claude, the Seventh Ward, the Fairgrounds,
and the south end of City Park, among other neighborhoods. For a comparison, Scenario 1 Phase
2 only serves 24% of the Scenario 2 Phase 2 build out service area. This is a substantial difference
in service coverage. If the Scenario 1 Phase 2 service area were to match the Scenario 2 Phase 2
service area and fleet, the capital cost would come at a 288% premium (roughly $17.4 million
versus $6.0 million). This was deemed unreasonable to fund given the funding and potential
sponsor environment in New Orleans and Louisiana in general. Thus, Scenario 2 Phase 2 operates
as potential implementation beyond Phase 1 that could be broken into multiple sub-phases as

NEW ORLEANS BIKE SHARE FEASIBILITY STUDY AND BUSINESS PLAN | FINAL REPORT
Regional Planning Commission for Jefferson, Orleans, Plaquemines, St. Bernard, St. Tammany and Tangipahoa Parishes | City of New Orleans | State Project #H.972035 | 5-11
funding becomes available. This explains Scenario 2 Phase 2’s larger service area. Other benefits
of this service area include service to key districts and corridors like:
Biomedical corridor, with connections to nearby universities
Esplanade Avenue, offering duplicative transit service to the adjacent neighborhood and
alternative access options for residents and visitors attending major events at the
Fairgrounds and City Park
Major retail and commercial corridors like Freret Street, Magazine Street, St. Claude
Avenue, Carrollton Avenue, South Claiborne Avenue, and St Charles Avenue
Universities and major institutions like Tulane, Loyola, LSU Health Sciences Center,
Xavier and Delgado Community College
Redeveloping corridors and districts like Claiborne Avenue, Broad Street, the Lafitte
Greenway, and OC Haley
Areas like Esplanade Avenue in Treme are proposed for bike share service in Phase 2 of the smart-bike, hub-based system (Scenario 2).
Source: Nelson\Nygaard
In both scenarios, system expansion is recommended to occur as bicycle infrastructure is
implemented to better connect these areas to the Phase 1 service area and between areas outside
the Phase 1 service area. This would help increase propensity for using the system and connect
more central demand centers to the edges of the service area boundary.
Implementing Phase 2 expansion opportunities depend on a variety of factors, including public
response to bike share, fiscal health of the operator after initial launch, Board of Director
decision-making, as well as funding availability. Scenario 2 Phase 2 represents a conceptual
service area that can be supported in the near term given current land uses, demographics, and
bicycle infrastructure.18 This is a scenario that should be further segmented into sub-phases by
18 The recommended service area is not necessarily considered a full system build out. This recommendation is based on current demand factors. As land uses and demographics shift and bike share technology and service delivery are improved, the recommended service area boundary could be augmented to serve other neighborhoods that are not included in the Scenario 2 Phase 2 system.

NEW ORLEANS BIKE SHARE FEASIBILITY STUDY AND BUSINESS PLAN | FINAL REPORT
Regional Planning Commission for Jefferson, Orleans, Plaquemines, St. Bernard, St. Tammany and Tangipahoa Parishes | City of New Orleans | State Project #H.972035 | 5-12
the bike share operator. Phasing should be determined by the “Criteria for expansion” section
below. This will allow the system to grow in areas with greater demand or interest and give the
operator (and its Board of Director strategic decision-makers) greater control in managing
system expansion.
Key Neighborhoods not Considered for Expansion
While a large number of neighborhoods in New Orleans are well-suited for bike share—
particularly in the smart-bike, hub-based system—more remote, less dense neighborhoods were
not included in the Phase 1 or Phase 2 system plans of either system scenario. This is largely due
to a lack of bike share demand and a lack of connectivity. In non-contiguous neighborhoods like
New Orleans East and Algiers, system expansion would increase operating cost substantially as it
would require additional service/rebalancing vehicles and storage facilities. Some of the
neighborhoods not recommended for Scenario 1 or 2 system service include:19
Gentilly
City Park north of I-610
Lakeview
West End
Algiers and areas down river (i.e., Westbank of Orleans Parish)
Lower Ninth Ward / Holy Cross
New Orleans East
These neighborhoods are not recommended for bike share on the basis of technical feasibility.
However, the bike share program may want to include these areas as part of its equity initiative
(see Chapter 9 for more details). Prior to system implementation, the bike share operator, the
City, and local stakeholders should engage these neighborhoods and the broader community to
gauge interest and determine the appropriate action to provide system access for use in other
areas of the city.
19 Some portions, but not all portions, of lower-income neighborhoods like Leonidas and Hollygrove are out of the ¼-mile walk buffer to a bike share station or hub location.
Although bike share could provide a key last mile transit connection for ferry passengers, the Algiers Point neighborhood lacks basic conditions that figure into bike share demand, including population density, destinations, and bicycle facilities, among others.
Source: Image from City of New Orleans and Daniel Lobo

NEW ORLEANS BIKE SHARE FEASIBILITY STUDY AND BUSINESS PLAN | FINAL REPORT
Regional Planning Commission for Jefferson, Orleans, Plaquemines, St. Bernard, St. Tammany and Tangipahoa Parishes | City of New Orleans | State Project #H.972035 | 5-13
Figure 21 Scenario 1, Phase 1 System Plan (Station-Based System)

NEW ORLEANS BIKE SHARE FEASIBILITY STUDY AND BUSINESS PLAN | FINAL REPORT
Regional Planning Commission for Jefferson, Orleans, Plaquemines, St. Bernard, St. Tammany and Tangipahoa Parishes | City of New Orleans | State Project #H.972035 | 5-14
Figure 22 Scenario 1, Phase 2 System Plan (Station-Based System)

NEW ORLEANS BIKE SHARE FEASIBILITY STUDY AND BUSINESS PLAN | FINAL REPORT
Regional Planning Commission for Jefferson, Orleans, Plaquemines, St. Bernard, St. Tammany and Tangipahoa Parishes | City of New Orleans | State Project #H.972035 | 5-15
Figure 23 Scenario 2, Phase 1 System Plan (Smart-Bike, Hub-Based System)

NEW ORLEANS BIKE SHARE FEASIBILITY STUDY AND BUSINESS PLAN | FINAL REPORT
Regional Planning Commission for Jefferson, Orleans, Plaquemines, St. Bernard, St. Tammany and Tangipahoa Parishes | City of New Orleans | State Project #H.972035 | 5-16
Figure 24 Scenario 2, Phase 2 System Plan (Smart-Bike, Hub-Based System)
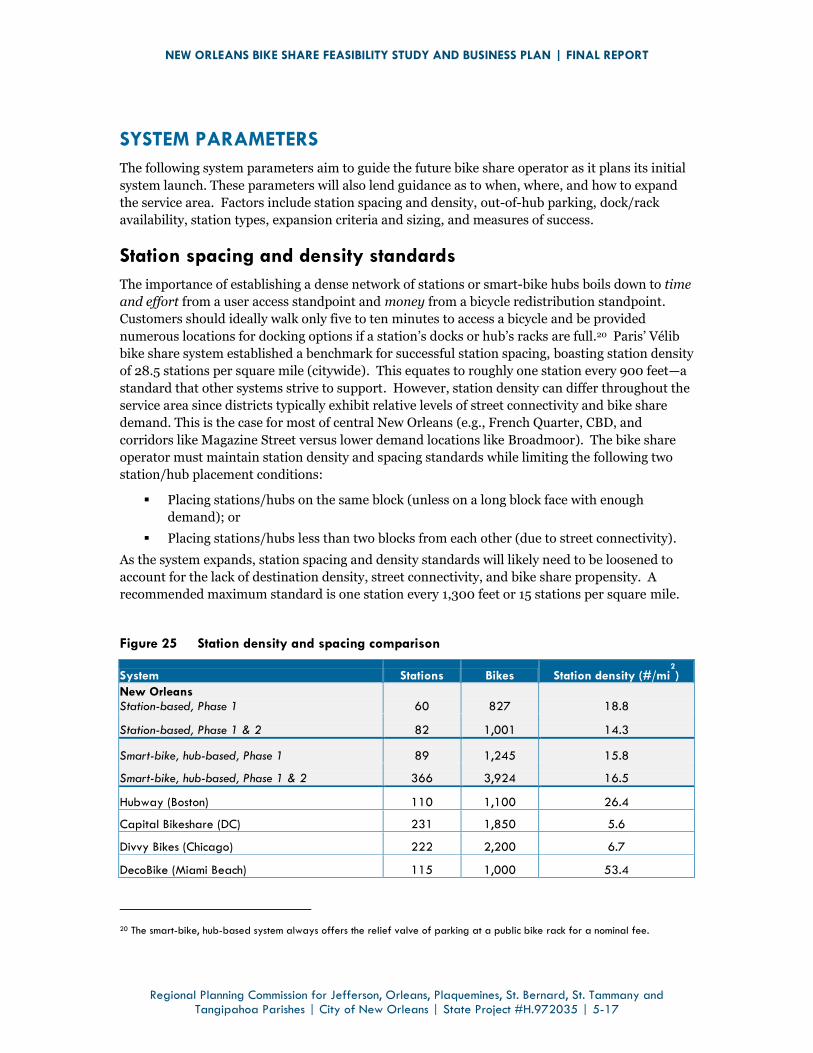
NEW ORLEANS BIKE SHARE FEASIBILITY STUDY AND BUSINESS PLAN | FINAL REPORT
Regional Planning Commission for Jefferson, Orleans, Plaquemines, St. Bernard, St. Tammany and Tangipahoa Parishes | City of New Orleans | State Project #H.972035 | 5-17
SYSTEM PARAMETERS
The following system parameters aim to guide the future bike share operator as it plans its initial
system launch. These parameters will also lend guidance as to when, where, and how to expand
the service area. Factors include station spacing and density, out-of-hub parking, dock/rack
availability, station types, expansion criteria and sizing, and measures of success.
Station spacing and density standards
The importance of establishing a dense network of stations or smart-bike hubs boils down to time
and effort from a user access standpoint and money from a bicycle redistribution standpoint.
Customers should ideally walk only five to ten minutes to access a bicycle and be provided
numerous locations for docking options if a station’s docks or hub’s racks are full.20 Paris’ Vélib
bike share system established a benchmark for successful station spacing, boasting station density
of 28.5 stations per square mile (citywide). This equates to roughly one station every 900 feet—a
standard that other systems strive to support. However, station density can differ throughout the
service area since districts typically exhibit relative levels of street connectivity and bike share
demand. This is the case for most of central New Orleans (e.g., French Quarter, CBD, and
corridors like Magazine Street versus lower demand locations like Broadmoor). The bike share
operator must maintain station density and spacing standards while limiting the following two
station/hub placement conditions:
Placing stations/hubs on the same block (unless on a long block face with enough
demand); or
Placing stations/hubs less than two blocks from each other (due to street connectivity).
As the system expands, station spacing and density standards will likely need to be loosened to
account for the lack of destination density, street connectivity, and bike share propensity. A
recommended maximum standard is one station every 1,300 feet or 15 stations per square mile.
Figure 25 Station density and spacing comparison
System Stations Bikes Station density (#/mi2
)
New Orleans Station-based, Phase 1 60 827 18.8
Station-based, Phase 1 & 2 82 1,001 14.3
Smart-bike, hub-based, Phase 1 89 1,245 15.8
Smart-bike, hub-based, Phase 1 & 2 366 3,924 16.5
Hubway (Boston) 110 1,100 26.4
Capital Bikeshare (DC) 231 1,850 5.6
Divvy Bikes (Chicago) 222 2,200 6.7
DecoBike (Miami Beach) 115 1,000 53.4
20 The smart-bike, hub-based system always offers the relief valve of parking at a public bike rack for a nominal fee.

NEW ORLEANS BIKE SHARE FEASIBILITY STUDY AND BUSINESS PLAN | FINAL REPORT
Regional Planning Commission for Jefferson, Orleans, Plaquemines, St. Bernard, St. Tammany and Tangipahoa Parishes | City of New Orleans | State Project #H.972035 | 5-18
Out-of-hub parking
For the smart-bike, hub-based system (Scenario 2), we recommend not allowing parking outside
of the hub locations. Prohibiting out-of-hub parking now would reduce the flexibility of the
system, but increase the availability of bicycles. To take advantage of the smart-bike capabilities,
however, a “hub” area should be considered not only the designated corral but some compact area
around it – say within 100 feet to mitigate concerns about stations potentially being “all full.”
If the bike share program decides to allow out-of-hub parking, setting a high out-of-hub parking
fee will be critical to discourage parking away from established hubs, and maintain some level of
reliability for bike share’s customers. The operator must balance the user value of parking a bike
when and where they want (on-demand parking) with system reliability and legibility (parking
based on available supply). If out-of-hub parking is pursued, we recommend the bike share
operator eliminate the possibility for out-of-hub parking in the historic districts. Based on
conversations with the Historic District Landmarks Commission (HDLC) and the Vieux Carre
Commission (VCC), it was determined that the smart-bike, hub-based system was deemed a
palatable system option from an aesthetic and design stand point, only if the system maintains
orderly parking in the historic districts. The most feasible way to do this is to program the system
to encourage parking at hubs (or within a few feet of the hub locations).
Dock/Rack availability
Much like traditional public transit, the utility of bike share may only be realized if the service is
perceived as efficient and reliable. Providing enough dock availability at trip destinations to
quickly end a bike share trip is a critical reliability factor that can develop a long-term or annual
subscription user rather than a one-time or once-per-year user. Stranding users at full stations
should be avoided as much as possible. Therefore, a 1.9 dock/rack per bike ratio is recommended
to ensure bikes can be reliably returned at stations near users’ intended destination and to reduce
redistribution costs. This is particularly important in hub-based systems where smart-bikes can
be used to park to any public bike parking rack (unless in a historic district, as recommended
above).
Stations and hub locations should be sized based on projected demand, actual use rates (once the
proposed system is operating), and proximity to major demand generators. For example,
although maintaining the same 1.9:1 dock-to-bike ratio, a neighborhood retail center would likely
require less docks and bikes than the Superdome, which would create large pulses during sporting
or other entertainment events.
Sample station or hub types and siting
The number of bicycles and docks at any given station shown in the Phase 1 and 2 preliminary
station locations was established by determining the relative demand of each station location and
applying an appropriate station size to meet that demand.21 Larger stations were designated for
locations that have massive demand throughout the day or during peak flows (e.g., after the
ending of a convention center, sporting, Jazz Fest event). These peak flows often require
redistribution shortly thereafter. Station accommodations can range between 7 bicycles with 10
21 Station sizing and design will need to be refined during next phase of implementation.

NEW ORLEANS BIKE SHARE FEASIBILITY STUDY AND BUSINESS PLAN | FINAL REPORT
Regional Planning Commission for Jefferson, Orleans, Plaquemines, St. Bernard, St. Tammany and Tangipahoa Parishes | City of New Orleans | State Project #H.972035 | 5-19
docks and 20 bicycles with 38 docks. While this range is flexible and depends on demand and
peak flows, it also roughly adheres to the dock-bicycle ratio standard listed above. The final
station designs will include station sizes that vary slightly from this sample station typology.
Station or rack sizing also depends on right-of-way available to locate bike share facility. The
following types of station or hub locations are recommended
Sidewalks greater than 12’: The lack of available sidewalk space in New Orleans is
pervasive and limits bike share siting significantly—particularly in the historic districts.
Bike share stations should be located in the furniture zone unless spatial constraints
dictate the station’s location in a building frontage zone.
Parking stalls: On-street parking stalls can be repurposed for a large number of bike
share docking stations or hub locations. This is likely the best opportunity for station/hub
location siting throughout the city.
Public or private surface parking stalls: Off-street surface parking stalls can be
repurposed for bike share docking stations or hub locations. This should only be
considered if the proposed site is clearly visible from the street.
Park space: In coordination with the Parks and Parkways, bike share stations could be
located on park land. This is likely not subject to USDOT Act of 1966 4(f) Evaluation and
Approval due to the non-permanence of stations and hubs.
Neutral ground: The neutral grounds located throughout the city offer substantial
space for bike share stations or hub locations. This is likely not subject to USDOT Act of
1966 4(f) Evaluation and Approval due to the non-permanence of stations and hubs.
RTA property: Co-locating bike share with transit passenger facilities ensure seamless
connections between transit modes and reinforces the last-mile link that bike share would
likely fulfill for outlying neighborhoods. Based on conversations during the planning
process, RTA is interested in working with the bike share program to site bike share on or
near RTA facilities. This collaboration is viewed as an opportunity to attract future transit
ridership.
Private property: This includes sites on private property that are visible and accessible
from the public right-of-way and supported with wayfinding signage, as feasible per New
Orleans’ sign code.
Where right-of-way is constrained or bike share access is challenging due to arterial traffic
conditions, stations or hub locations should be sited on side streets as close to the intersection as
possible. Figure 26 presents a series of graphics that demonstrate the basic station designs and
dimensions for a variety of station configurations and requirements for parking ingress and
egress. Figure 27 on page 5-24 displays the basic configuration and ingress/egress plan for a
smart-bike, hub location. The dimensions of the smart-bike hubs are much more flexible than
station-based floor plates as each rack includes an individual floor plate.
As the bike share industry matures and equipment vendors respond to the unique needs of
system owners, station equipment are becoming more flexible in their design and respond to the
unique challenges of the urban built environment.

NEW ORLEANS BIKE SHARE FEASIBILITY STUDY AND BUSINESS PLAN | FINAL REPORT
Regional Planning Commission for Jefferson, Orleans, Plaquemines, St. Bernard, St. Tammany and Tangipahoa Parishes | City of New Orleans | State Project #H.972035 | 5-20
Figure 26 Bike share station-based dimensions and access requirements
Source: Nelson\Nygaard

NEW ORLEANS BIKE SHARE FEASIBILITY STUDY AND BUSINESS PLAN | FINAL REPORT
Regional Planning Commission for Jefferson, Orleans, Plaquemines, St. Bernard, St. Tammany and Tangipahoa Parishes | City of New Orleans | State Project #H.972035 | 5-21

NEW ORLEANS BIKE SHARE FEASIBILITY STUDY AND BUSINESS PLAN | FINAL REPORT
Regional Planning Commission for Jefferson, Orleans, Plaquemines, St. Bernard, St. Tammany and Tangipahoa Parishes | City of New Orleans | State Project #H.972035 | 5-22

NEW ORLEANS BIKE SHARE FEASIBILITY STUDY AND BUSINESS PLAN | FINAL REPORT
Regional Planning Commission for Jefferson, Orleans, Plaquemines, St. Bernard, St. Tammany and Tangipahoa Parishes | City of New Orleans | State Project #H.972035 | 5-23
Source: Nelson\Nygaard

NEW ORLEANS BIKE SHARE FEASIBILITY STUDY AND BUSINESS PLAN | FINAL REPORT
Regional Planning Commission for Jefferson, Orleans, Plaquemines, St. Bernard, St. Tammany and Tangipahoa Parishes | City of New Orleans | State Project #H.972035 | 5-24
Figure 27 General smart-bike hub dimensions and access
Source: Social Bicycles
Criteria for expansion
Expansion beyond the Phase 1 service area in both the dock-based and hub-based, smart-bike
systems options will require the recommended bike share operator to meet a variety of different
factors. Potential expansion criteria may include the following provisions:22
Available funding
Ability to meet the system’s goals
System performance, which can be measured in terms of productivity (trips per dock per
day), revenue generation, ability to spur community development, or a number of other
measures of success
Public support, in the form of broad public acceptance of the system and community
support for expansion
Community and business requests for expansion
Financial sustainability through user fees and ability of the initial phase service area to
support future expansion
Future development in planned redevelopment areas
Private and public partner support (both financial and in-kind)
A density of destinations that can support a network of stations-- roughly maintaining the
station spacing and density standards listed above
22 Specific metrics should be developed and monitored by the non-profit’s Board of Directors.

NEW ORLEANS BIKE SHARE FEASIBILITY STUDY AND BUSINESS PLAN | FINAL REPORT
Regional Planning Commission for Jefferson, Orleans, Plaquemines, St. Bernard, St. Tammany and Tangipahoa Parishes | City of New Orleans | State Project #H.972035 | 5-25
Measures of Success
Monthly performance measurement and financial statements of New Orleans’ bike share system
should be arranged for internal tracking. A more public facing performance indicators report
should be conducted annually. System metrics that are commonly employed to monitor
performance, benchmark success, and gauge system health include cost recovery and system
productivity. System productivity can be further segmented by the type of market a station is
serving (e.g. daily commuter stations, visitor-based stations, and equity stations).
Cost recovery: Farebox recovery ratio is a critical performance measure as it measures the
percentage of operating costs covered by subscriptions and fees. In some cities, bike share
systems recover all or nearly all of their annual operating costs (including Nice Ride Minnesota in
the Twin Cities, Capital Bikeshare in Washington D.C., and Denver’s B-Cycle). Other systems like
Miami Beach’s DecoBike are actually turning a profit. Due to the likely high volume of tourist use
in New Orleans, we have a high degree of confidence that bike share in urban New Orleans will
operate a net positive profit that can be reinvested in the system or used to finance the initial
capital investment. One challenge will be the cyclical nature of cost recovery. The major revenue
generating months will likely coincide during months with major events like Jazz Fest (i.e.,
between April and June).
Productivity: The number of bike share trips per bike per day is one industry standard for
measuring bike share system productivity. In some ways, the success of a system is determined
by the layout/density of stations across the service area, but also, system success is determined by
the density of potential bike share users, including residents and visitors. Figure 28 below
displays varying levels of productivity in systems across the U.S. Another measure of productivity
that New Orleans’ bike share operator should consider tracking is trips per dock per day (or trips
per rack per day in the case of a hub-based system). This alternative measure monitors both
system productivity and system efficiency (i.e., the ability of the system operator to efficiently
balance the system). Monitoring the system’s ability to balance its bicycle fleet will be a critical
measure for Scenario 2 as this system type has not been applied on a citywide basis in North
America. The operator must carefully monitor this performance metric and develop rebalancing
solutions (e.g., operational changes or strong user incentives for self-balancing) if user reliability23
is not achieved.
Other metrics being tracked by bike share systems include:
Cost per trip
Cost per trip per user (by user type)
Revenue generation (e.g., revenue per trip or revenue per 30+ minute trip)
Non-revenue trips (rebalancing trips)
Membership by type and annual turnover (e.g., annual, monthly, etc.)
Safety (collisions, severity, fatalities)
Fleet maintenance (or the inverse, percentage of fleet in service)
Station or hub location full/empty occurrences (tied to system reliability)
23 On-demand bicycle availability at every hub location or dense cluster of hub locations (limited to a 450-600 foot walk).

NEW ORLEANS BIKE SHARE FEASIBILITY STUDY AND BUSINESS PLAN | FINAL REPORT
Regional Planning Commission for Jefferson, Orleans, Plaquemines, St. Bernard, St. Tammany and Tangipahoa Parishes | City of New Orleans | State Project #H.972035 | 5-26
Number of user rebalancing trips (measure of incentive strength and system self-
rebalancing for smart-bike, hub-based system only)
Local use versus tourist use
Number of unbanked individuals that access the system (and other equity considerations)
Customer satisfaction
Non-traditional metrics like retail influence, VMT reduction, and station sponsorship
requests, among others.
Figure 28 Bike share productivity in select systems (trips per bike per day in 2012)
System
Trips per bike
per day # of bikes # of stations
Capital Bikeshare (Washington DC) 3.23 1,850 231
Divvy Bikes (Chicago) 1.4* 2,200 222
Nice Ride Minnesota (Twin Cities) 0.97 1,300 170
DecoBike (Miami Beach) 2.75 1,000 115
Boston Hubway 2.12 1,100 110
*Chicago Divvy’s productivity data is from 2013.

NEW ORLEANS BIKE SHARE FEASIBILITY STUDY AND BUSINESS PLAN | FINAL REPORT
Regional Planning Commission for Jefferson, Orleans, Plaquemines, St. Bernard, St. Tammany and Tangipahoa Parishes | City of New Orleans | State Project #H.972035 | 6-1
6 HOW MUCH WILL BIKE SHARE COST?
Establishing New Orleans’ bike share program—and the operator that administers the program—
is comprised of three main cost elements: 1) pre-launch start-up costs (including non-profit
development and pre-roll out activities); 2) near- and long-term capital costs; and 3) ongoing
operating costs. The following sections present planning-level cost estimates for the station-
based and hub-based, smart-bike scenarios. Costs for system capital expenditures and operations
are forecast for the first five years, incorporating a conceptual cost schedule for system expansion
and its associated increases in operating costs. Beyond five years, system cost forecasts become
speculative; therefore these assumptions are not included.
Note: As stated in Chapter 5, Scenario 2 (hub-based, smart-bike system) is conditionally
recommended, but Scenario 1 (station-based) costs are shown for comparative purposes.
PRE-LAUNCH START-UP COSTS
The initial implementation phase of New Orleans’ bike share program includes key activities like
forming the administrative non-profit, hiring key staff, conducting community outreach, and
completing more detailed system design and station/hub location planning for the bike share
operation. These pre-launch activities represent a key funding challenge for New Orleans as
bridge funding may require public funds, charitable gifts, and/or foundation funding. Basic non-
profit infrastructure, staffing, administrative, and final planning and design activities need to be
established to begin the bike share implementation process, including fundraising. Cost elements
of the pre-launch phase include:
Executive Director salary
Website design and programming
IT and communication systems
General supplies, materials, travel
and other expenses
Marketing and promotions
Legal fees
Insurance
Station location planning and design
(could be assumed or supported by
the private operator)
Community outreach (could be
assumed or supported by the private
operator)
Based on detailed cost estimates presented in the Appendix, the pre-launch phase would cost:
Scenario 1: $474,000 one-time cost in Phase 1 (plus $109,000 for expansion)
Scenario 2 (Recommended): $557,000 one-time cost in Phase 1 (plus $789,000 for
expansion)
The high end of the cost range includes funds for detailed station/hub location planning, site
design, and permitting as well as community outreach. These two activities are time and cost

NEW ORLEANS BIKE SHARE FEASIBILITY STUDY AND BUSINESS PLAN | FINAL REPORT
Regional Planning Commission for Jefferson, Orleans, Plaquemines, St. Bernard, St. Tammany and Tangipahoa Parishes | City of New Orleans | State Project #H.972035 | 6-2
intensive and, thus, are recommended for completion earlier in the implementation process.
Based on conversations with City and private sector stakeholders, community outreach will need
to be extensive and thorough. Therefore, the estimated cost of community outreach and
supporting programming is conservatively high.
Station location planning and outreach should be conducted as a separate effort from a
vendor/operator contract, likely by a consultant with expertise in more detailed implementation.
The City of New Orleans could provide in-kind support. This approach will allow the non-profit
to allow for a proactive start on these critical activities.
NEAR- AND LONG-TERM CAPITAL COSTS
Projected capital costs include all bike share equipment and activities related to installation
including the bicycle fleet (3-speed bicycles are assumed), solar-powered docking stations or hub
racks and plates (with kiosks and platforms provided at high demand locations), bicycle and
station/hub assembly, bicycle and station/hub spare parts, GPS replacement units for smart-
bikes, and maintenance and redistribution vehicles. The total one-time capital costs for each
scenario are presented below by phase.
Scenario 1, Phase 1: $4.1 million ($1.1 million per sq. mi. served)
Scenario 1, Phase 2: $1.3 million ($0.23 million per sq. mi. served)24
Scenario 2, Phase 1 (Recommended): $3.1 million ($0.55 million per sq. mi.
served)
Scenario 2, Phase 2 (Recommended): $6.0 million25 ($0.27 million per sq. mi.
served)
State of Good Repair
As with any transit system, bike share capital equipment will degrade over time and will require
replacement. While, most bike share bicycles and stations have a useful life of roughly five years,
the useful life of racks and rack plates in a smart-bike system is likely much longer. Hub kiosks
and map/advertising panels likely experience the same wear-and-tear and useful life as a
traditional bike share station.
Although all major North American bike share systems have been in operation for less than five
years, major capital maintenance and replacement efforts are on the horizon. An important goal
for the New Orleans system is to be financially sustainable over the long-term. Thus, the program
must account for replacement costs during the early planning phases. This includes incremental
costs for replacement parts (per unit assumption) and annual assumptions for fleet replacement
banking (1.5% per year). This proactive approach to equipment life costing feeds into the bike
share program’s initial sponsorship and fundraising strategy.
24 Total square mileage, not just the new square mileage added by Phase 2.
25 Note: This cost represents the total capital cost for a coverage area that could be segmented into sub-phases (based on available funding and operator decision-making).

NEW ORLEANS BIKE SHARE FEASIBILITY STUDY AND BUSINESS PLAN | FINAL REPORT
Regional Planning Commission for Jefferson, Orleans, Plaquemines, St. Bernard, St. Tammany and Tangipahoa Parishes | City of New Orleans | State Project #H.972035 | 6-3
ONGOING OPERATING COSTS
Establishing a clear and detailed understanding of how much it will cost to operate the
recommended bike share system every year is critical to inform the program’s funding strategy (in
Chapter 7). The operating cost model used for this study assumes the following ongoing operating
costs:
Employee labor including general administrative and operations staff
Direct expenses including facilities and equipment, administrative and maintenance
materials and vehicle leasing, and IT, website, and other communication-related costs
A large component of annual operating costs will be consumed by rebalancing efforts—a
necessary daily activity to ensure reliable, on-demand access to bicycles. In systems of
comparable size to New Orleans’ build out scenarios, roughly 1,000-1,300 bicycles are rebalanced
on a daily basis. Rebalancing helps the system recalibrate during and after peak commute flows
from outlying neighborhoods to the major job centers like the CBD, medical districts, and
universities, as well as overloaded docking demand at key destinations often utilized by casual or
daily subscribers.
Preliminary estimates for on-going annual operating costs in each of New Orleans’ scenarios
are:26
Scenario 1, Phase 1: $1.5 million per year ($0.41 million per year per sq. mi. served)
Scenario 1, Phase 1+2: $1.7 million per year ($0.29 million per year per sq. mi.
served)
Scenario 2, Phase 1 (Recommended): $1.9 million per year ($0.34 million per year
per sq. mi. served)
Scenario 2, Phase 1+2 (Recommended): $4.7 million per year27 ($0.21 million per
year per sq. mi. served)
Due to the changing nature of the bike share industry and the sudden emergence of smart-bike
technology, operators are just beginning to understand the rebalancing cost implications. For that
reason, operating cost assumptions for Scenario 2 (smart-bike, hub-based system) are
conservative.
26 Note: Phase 2 operating costs do not represent an additive increment upon Phase 1 operating cost. These costs represent the new total annual operating costs.
27 Note: The Scenario 2, Phase 2 operating cost figure represents the total operating cost for a coverage area that could be segmented into sub-phases (based on available funding and opertor decision-making). If implemented in sub-phases, the annual operating costs would reduce substantially, but not proportionally.

NEW ORLEANS BIKE SHARE FEASIBILITY STUDY AND BUSINESS PLAN | FINAL REPORT
Regional Planning Commission for Jefferson, Orleans, Plaquemines, St. Bernard, St. Tammany and Tangipahoa Parishes | City of New Orleans | State Project #H.972035 | 6-4
Rebalancing bicycles (left) and other staff intensive activities like facility maintenance (right) greatly influence annual operating costs.
Source: Nelson\Nygaard and Hubway
A summary of Scenario 1 and 2 system start-up costs and ongoing operating costs are presented
in Figure 29 and Figure 30. Detailed initial capital and ongoing operating costs are presented in
the Appendix. As the system expands, capital expenditure and ongoing operating costs will
increase. Figure 31 and 32 present projected 5-year capital and operating costs.
Figure 29 Scenario 1 pre-launch start-up, capital, and operating costs by phase
Start-Up Capital Annual Operating
Phase 1 (827 bicycles, 60 stations)
$474,000 $4,100,000 $1,510,000
Cost/station
$68,602.75 $25,167
Cost/bike
$4,977.22 $1,826
Phase 1+2 (174 additional bicycles, 22 additional stations)
$109,000 $1,300,000 $1,667,000
Cost/station
$60,444.50 $20,329
Cost/bike
$7,642.41 $1,665
TOTAL (1,001 bicycles, 82 stations)
$583,000 $5,400,000 $1,667,000 (Phase 1+2)
Note: All costs are planning-level.
Figure 30 Scenario 2 pre-launch start-up, capital, and operating costs by phase
Start-Up Capital Annual Operating
Phase 1 (1,245 bicycles, 89 hub locations)
$557,000 $3,100,000 $1,910,000
Cost/hub
$34,600.39 $21,461
Cost/bike
$2,473.44 $1,534
Phase 1+2 (2,679 additional bicycles, 277 additional hub locations)
$789,000 $6,000,000 $4,705,000
Cost/hub
$21,787.71 $12,855
Cost/bike
$2,252.78 $1,199
TOTAL (3,924 bicycles, 366 hub locations)
$1,346,000 $9,100,000 $4,705,000 (Phase 1+2)
Note: All costs are planning-level.

NEW ORLEANS BIKE SHARE FEASIBILITY STUDY AND BUSINESS PLAN | FINAL REPORT
Regional Planning Commission for Jefferson, Orleans, Plaquemines, St. Bernard, St. Tammany and Tangipahoa Parishes | City of New Orleans | State Project #H.972035 | 6-5
Figure 31 Scenario 1 five-year cost summary by phase
Phase by Cost Type Pre-
launch Year 1 Year 2 Year 3 Year 4 Year 5
Capital
Start-up $474,000
$36,333 $36,333 $36,333
Phase 1
$4,100,000
Phase 2*
$433,000 $433,000 $433,000
Operations
Phase 1
$1,510,000
Phase 2*
$2,065,667 $2,343,500 $3,177,000 $3,177,000
PHASE 1 TOTAL $474,000 $5,610,000 - - - -
PHASE 2 TOTAL - - $2,535,000 $2,812,833 $3,646,333 $ 3,177,000
Note: All costs are planning-level.
* Phase 2 implementation is conceptually displayed over a 3-year timeframe (years 2 through 4). Actual implementation would likely occur over a longer implementation timeframe. Phase 2 implementation will be influenced by available funding and operator objectives and internal decision-making.
Figure 32 Scenario 2 five-year cost summary by phase
Phase by Cost Type Pre-
launch Year 1 Year 2 Year 3 Year 4 Year 5
Capital
Start-up $557,000
$263,000 $263,000 $263,000
Phase 1
$3,100,000
Phase 2*
$2,000,000 $2,000,000 $2,000,000
Operations
Phase 1
$1,950,000
Phase 2*
$ 3,478,333 $4,262,500 $6,615,000 $6,615,000
PHASE 1 TOTAL $557,000 $5,050,000 - - - -
PHASE 2 TOTAL - - $5,741,333 $6,525,500 $8,878,000 $6,615,000
Note: All costs are planning-level.
* Phase 2 implementation is conceptually displayed over a 3-year timeframe (years 2 through 4). Actual implementation would likely occur over a longer implementation timeframe. Phase 2 implementation will be influenced by available funding and operator objectives and internal decision-making.

NEW ORLEANS BIKE SHARE FEASIBILITY STUDY AND BUSINESS PLAN | FINAL REPORT
Regional Planning Commission for Jefferson, Orleans, Plaquemines, St. Bernard, St. Tammany and Tangipahoa Parishes | City of New Orleans | State Project #H.972035 | 7-1
7 FUNDING STRATEGY New Orleans is in a unique position to house a thriving bike share system that is financially
sustainable. This analysis foresees consistent cash flow due to a large, event-centered visitor
population, rapid re-urbanization in a post-Katrina economy, a relatively comfortable climate
amenable to year-round bicycle use, and high demand for on-demand and duplicative transit
services. While resident commuting is certainly a market segment that will be well served in New
Orleans, the operator’s funding strategy is firmly rooted in the influence of the city’s tourist
market. The tourist market will largely fund system operations; thus, the operator must capitalize
on this reality.
The following sections recommend a fare structure for New Orleans’s bike share system, forecast
ridership for the first five years of operation, and identify funding options and revenue streams.
The end of this chapter establishes a sample of funding ranges that will pay for net operating
losses that will likely occur during the initial 2-3 years of operation
PROPOSED PRICING STRUCTURE
New Orleans’ bike share operator should establish a fare structure that attracts annual, monthly,
and daily (casual) customers to the system, while generating enough revenue to help pay for the
system. The ability to use the pricing structure to facilitate wealth transfer and resident user
subsidy was consistently mentioned during stakeholder Idea Sessions. New Orleans’ proposed
pricing scheme is presented on the following page.
In addition to subscription fees, the proposed fee structure includes overage fees for users that
intend to keep a bicycle in circulation beyond the 30-minute free ride period. The proposed
pricing structure is based on existing peer bike share systems as shown in Figure 33, but also local
market factors and other transportation fees. The proposed pricing structure encourages short-
term, short trip rental and respects market boundaries of other private transportation services
like long-term bike rentals, taxis, and private shuttles.
The final pricing structure should be reviewed and approved by the operator. In addition, the
operator should explore simplified fare structures akin to other public transit fares. Additional
analysis should be conducted to establish per use, time-based fares with a fee program that
accrues overages after a 30 minute free ride period. This will greatly simplify access and
understanding of the system and reduce the complexity of integrating fares with RTA transit fare
payment.
Fare payment
New Orleans’ bike share system should employ credit/debit card-based online payment for
monthly and annual subscriptions, while providing additional payment options for the unbanked
or those that cannot afford lump sum payment for annual or monthly subscriptions. Daily or
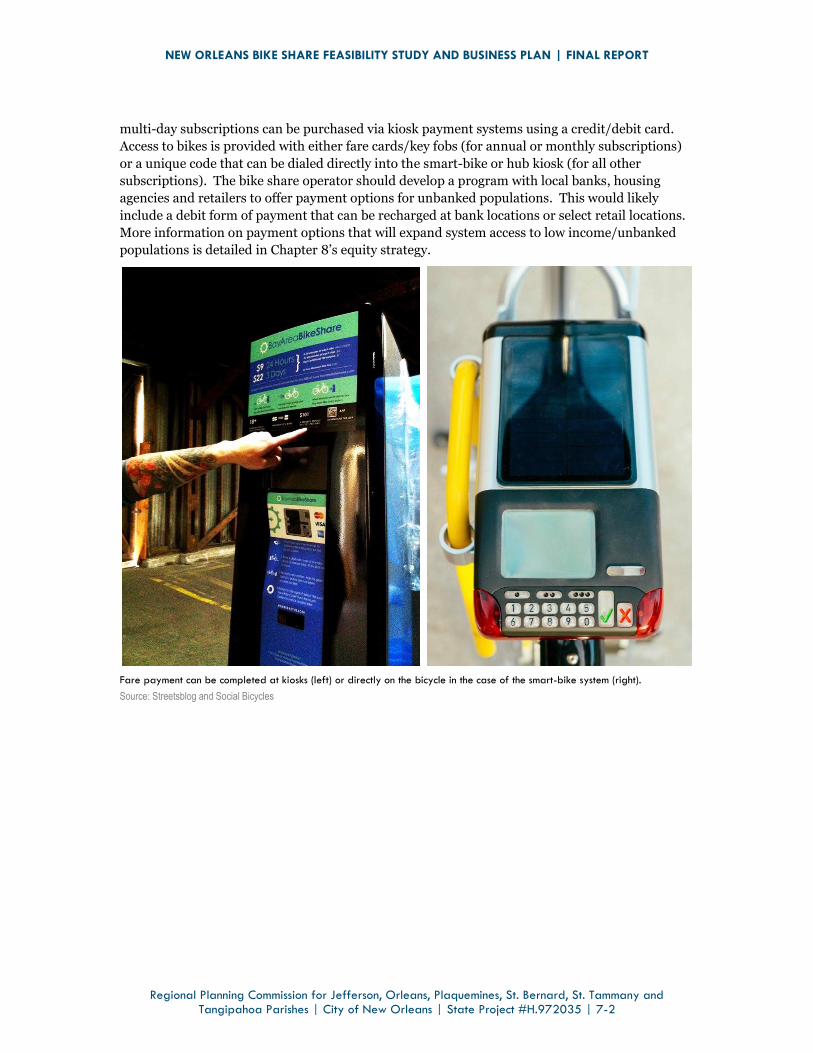
NEW ORLEANS BIKE SHARE FEASIBILITY STUDY AND BUSINESS PLAN | FINAL REPORT
Regional Planning Commission for Jefferson, Orleans, Plaquemines, St. Bernard, St. Tammany and Tangipahoa Parishes | City of New Orleans | State Project #H.972035 | 7-2
multi-day subscriptions can be purchased via kiosk payment systems using a credit/debit card.
Access to bikes is provided with either fare cards/key fobs (for annual or monthly subscriptions)
or a unique code that can be dialed directly into the smart-bike or hub kiosk (for all other
subscriptions). The bike share operator should develop a program with local banks, housing
agencies and retailers to offer payment options for unbanked populations. This would likely
include a debit form of payment that can be recharged at bank locations or select retail locations.
More information on payment options that will expand system access to low income/unbanked
populations is detailed in Chapter 8’s equity strategy.
Fare payment can be completed at kiosks (left) or directly on the bicycle in the case of the smart-bike system (right).
Source: Streetsblog and Social Bicycles

NEW ORLEANS BIKE SHARE FEASIBILITY STUDY AND BUSINESS PLAN | FINAL REPORT
Regional Planning Commission for Jefferson, Orleans, Plaquemines, St. Bernard, St. Tammany and Tangipahoa Parishes | City of New Orleans | State Project #H.972035 | 7-3
Figure 33 Proposed pricing structure and overages
Proposed Pricing Structure and Overages
Peer system Days of operation System size
Subscription type
Annual pass Monthly pass 7-day pass 5-day pass 3-day pass 24-hour pass
Miami Beach DecoBike* 365 115 stations/1,000 bikes $180 $35 - - - $24
Capital Bikeshare** 365 231 stations/1,850 bikes $75 $25 - $15 - $7
Chicago Divvy Bikes 365 222 stations/2,200 bikes $75 - - - - $7
Bay Area Bike Share 365 70 stations/700 bikes $88 - - - $22 $9
New Orleans (proposed)*** 365 Minimum (Phase 1): 89 hubs/1,245 bikes Maximum (Phase 1+2): 366 hubs/3,924
$75 $30 - $25 $16 $9
Proposed Overage Fees
Peer system Annual subscription overages 24-hour subscription overages
30-60 minutes 60-90 minutes Add. 30 minutes 30-60 minutes 60-90 minutes Add. 30 minutes
Miami Beach DecoBike* $4.00 - - - - -
Capital Bikeshare** $1.50 $4.50 $6.00 $2.00 $4.50 $8.00
Chicago Divvy Bikes $1.50 $4.50 $6.00 $2.00 $4.50 $8.00
Bay Area Bike Share $4.00 $11.00 $4.00 $4.00 $11.00 $4.00
New Orleans (proposed) $1.50 $3.00 $6.00 $2.50 $6.00 $8.00 Note: Some peer pricing includes taxes while other are the price shown plus tax. *DecoBike annual pass is for unlimited 30 minute rides. There is also a $300 option for unlimited 60 minute rides. Monthly pass is for 30 60-minute rides. There are also several hourly passes. This rate schedule is structure like a traditional bike rental.
**Capital Bikeshare also includes an annual subscription payment program for $84. *** The operator may elect to use lower rates, based on demand. This does not include reduced fares for university students or qualifying low income individuals, a pricing mechanism the non-profit should pursue and negotiate.

NEW ORLEANS BIKE SHARE FEASIBILITY STUDY AND BUSINESS PLAN | FINAL REPORT
Regional Planning Commission for Jefferson, Orleans, Plaquemines, St. Bernard, St. Tammany and Tangipahoa Parishes | City of New Orleans | State Project #H.972035 | 7-4
RIDERSHIP AND REVENUE FORECASTS
Forecasting user-generated revenue from the
initial phase service area is based on several
basic assumptions:
The system’s propensity to generate
trips
The proportion of casual (daily) and
member (subscriber) users
How price sensitive users are to paying
overage fees28
Estimated bike share ridership for each system
scenario and phase was forecast using a bike
share pivot model developed by
Nelson\Nygaard. This type of analysis is used
for transit ridership forecasting where a specific
transit service is being introduced. A pivot
model is a way to estimate ridership potential
based on known demand factors of existing bike
share systems in comparable cities. The model
aggregates factors assumed to be associated
with ridership coupled with current system
statistics. Adjustments are made to remove
some of the influences that may distort current
ridership figures. With these adjustments made
it is possible to estimate ridership by “pivoting”
off the average ridership of existing peer
systems and adjusting outlier ridership
phenomena based on known ridership factors.
Five peer bike share systems were chosen for
this analysis based on similarities of scale, city
characteristics, organizational structure, and
likely operational needs. The five systems
analyzed include Capital Bikeshare
(Washington, DC); Chicago Divvy, Boston
Hubway; Nice Ride MN (Twin Cities); and
Miami Beach DecoBike.
28 Overage fees are escalating charges imposed when a bicycle is not returned within 30 minutes of the original time of access.
Who will use bike share in New Orleans?
Three primary bike share markets are present in New Orleans:
Resident non-commute market: This market includes residents within New Orleans’ service area seeking to make short trips between key destinations or seeking last-mile transit connections.
The residential market is currently limited due to New Orleans’s auto-oriented culture. An even smaller segment of residents seeks weekday or weekend connections to transit or neighborhood retail along corridors like Magazine Street.
Visitor/tourist market: New Orleans is a major regional tourist hub and attracts over 9 million visitors per year. While visitors are relatively insensitive to price, they also value cheap on-demand transportation. In some cases, they value fun or amenity-type transportation. Due to their length of stay, price insensitivity, limited need for time competitive transportation, and willingness to sightsee while in transit, the visitor market would make up the bulk of use in New Orleans.
Commuter market: This market includes employees and students throughout urban New Orleans seeking access to job centers, particularly in the CBD, French Quarter, biomedical corridor, and universities. Need for late night transit service signals that bike share could serve as a lifeline transportation option when RTA’s service is suspended at night.
Source: Nelson\Nygaard

NEW ORLEANS BIKE SHARE FEASIBILITY STUDY AND BUSINESS PLAN | FINAL REPORT
Regional Planning Commission for Jefferson, Orleans, Plaquemines, St. Bernard, St. Tammany and Tangipahoa Parishes | City of New Orleans | State Project #H.972035 | 7-5
Ridership
Based on the bike share pivot model analysis, the model forecasts up to 815,000 annual trips at
system build out and at maturity (i.e., the system is broadly accepted and well marketed, any
launch challenges have been fixed, and cultural shift begins). Ridership forecasts assume the
system is operating 365 days per year. Figure 34 and Figure 35 summarizes each scenario’s
ridership by phase and by month at Year 3 (maturity). Forecast monthly ridership corresponds to
New Orleans’ monthly visitor flows. Bike share ridership is likely to peak in April and May,
corresponding to the city’s most well attended events and weather conditions that are most
amenable to bicycle travel.
Figure 34 Scenario 1, Phase 1 & 2 ridership forecast by month at Year 3 (at maturity)
Month Phase 1 (Low) Phase 1 (High) Phase 1+2 (Low) Phase 1+2 (High)
January 19,100 23,200 23,300 28,100
February 18,500 22,400 22,500 27,200
March 19,800 23,900 24,000 29,000
April 29,600 35,900 36,000 43,600
May 29,600 35,900 36,000 43,600
June 19,800 23,900 24,000 29,000
July 23,500 28,400 28,500 34,500
August 16,100 19,400 19,500 23,600
September 17,300 20,900 21,000 25,400
October 17,300 20,900 21,000 25,400
November 19,100 23,200 23,300 28,100
December 17,300 20,900 21,000 25,400
TOTAL (rounded) 247,000 299,000 300,000 363,000 Note: All projections are planning-level.

NEW ORLEANS BIKE SHARE FEASIBILITY STUDY AND BUSINESS PLAN | FINAL REPORT
Regional Planning Commission for Jefferson, Orleans, Plaquemines, St. Bernard, St. Tammany and Tangipahoa Parishes | City of New Orleans | State Project #H.972035 | 7-6
Figure 35 Scenario 2, Phase 1 & 2 ridership forecast by month at Year 3 (at maturity)
Month Phase 1 (Low) Phase 1 (High) Phase 1+2 (Low) Phase 1+2 (High)
January 29,000 35,000 52,200 63,200
February 28,100 33,900 50,600 61,100
March 29,900 36,200 53,900 65,200
April 44,900 54,200 80,900 97,800
May 44,900 54,200 80,900 97,800
June 29,900 36,200 53,900 65,200
July 35,500 42,900 64,000 77,400
August 24,300 29,400 43,800 53,000
September 26,200 31,600 47,200 57,100
October 26,200 31,600 47,200 57,100
November 29,000 35,000 52,200 63,200
December 26,200 31,600 47,200 57,100
TOTAL (rounded) 374,000 452,000 674,000 815,000 Note: All projections are planning-level.
Annual and 24-hour Subscription and Fee-Based Revenue
As demonstrated in Figure 36, most bike share users in New Orleans will be casual, daily users
(roughly 65%) largely from the visitor market, and they will access the system with a 24-hour
subscription. Comparing apples to apples in Phase 1, 225,200 24-hour subscriptions would be
purchased annually in Scenario 2 by Year 3 compared to 179,800 24-hour subscriptions in
Scenario 1. The 24-hour subscription market is anticipated to make 36% more trips than the
annual subscription user market in both system scenarios. After Year 3, annual and 24-hour
subscriptions would increase roughly 10% in total, and remain constant.
Even using conservative assumptions related to user trip rates, trip duration, and visitor daily
pass purchases (1% of annual visitors), New Orleans’ strong visitor market will lead to sizeable
subscription and overage fee revenue. This analysis assumes out-of-hub fee of $5 being accrued
on 2.5% of trips (an industry rule of thumb). As detailed in Figure 37, Scenario 1 is estimated to
annually generate roughly $1.8 million in Phase 1 and $2.3 million in Phase 1+2. This is compared
to annual revenues of approximately $2.9 million and $4.1 million generated in Phase 1 and 2 of
Scenario 2, respectively. Subscription revenue makes up the bulk of revenue generation in all
phases of each scenario.29
Note: This ridership forecast and market segmentation assumes a conservative estimated
annual member base, although it is roughly proportional to the member base in Capital
Bikeshare as it relates to system ridership.
29 Note: Revenue projections use the average of each phase’s low and high ridership projection.

NEW ORLEANS BIKE SHARE FEASIBILITY STUDY AND BUSINESS PLAN | FINAL REPORT
Regional Planning Commission for Jefferson, Orleans, Plaquemines, St. Bernard, St. Tammany and Tangipahoa Parishes | City of New Orleans | State Project #H.972035 | 7-7
Figure 36 Year 3 projected trips by user market and scenario
Scenario/Phase Casual (24 hr)
Trips Casual (24 hr) Subscriptions
Annual Member Trips
Annual Member Subscriptions
Scenario 1, Phase 1 177,500 179,800 95,600 5,857
Scenario 1, Phase 1+2 215,500 198,800 116,000 10,681
Scenario 2, Phase 1 268,500 225,200 144,600 11,215
Scenario 2, Phase 1+2 483,900 333,000 260,600 17,437 Note: Trips are based on the average of low and high ridership estimates by phase. Casual subscriptions were calculated using a conservative casual trip rate (2 trips per subscription) plus 1% of total annual New Orleans visitors based on 2012. Convention and Visitors Bureau data (conservatively assumes 1 trip per subscription). Given the likely similarity in visitor and resident use to Capital Bikeshare (CaBi), annual subscriptions are modeled by applying the proportion of New Orleans ridership to CaBi ridership (i.e., 11% and 22% of the average of New Orleans’ low and high ridership estimate in Scenario 1 and 2, respectively) to the total number of CaBi annual subscriptions. Note: This ridership forecast and market segmentation assumes a conservative estimated annual member base, although it is similar to annual membership figures seen in Boston and Minneapolis.
Figure 37 Summary of Year 3 subscription and overage fee revenue ranges
Scenario 1,
Phase 1
Scenario 1,
Phase 1+2
Scenario 2,
Phase 1
Scenario 2,
Phase 1+2
User fee revenue
Annual user fee revenue $11,800 $18,200 $15,700 $35,500
24-hour user fee revenue $454,000 $544,600 $453,800 $544,500
Out-of-hub fee (2.5% of all
trips at $5) - - $528,400 $652,600
Subtotal*† (rounded) $396,000 $478,000 $848,000 $1,048,000
Subscription revenue
Annual subscription revenue $439,300 $801,000 $841,100 $1,307,700
24-hour subscription revenue $1,618,200 $1,789,200 $2,027,700 $2,997,000
Subtotal** (rounded) $1,440,000 $1,813,000 $2,008,000 $3,013,000
TOTAL REVENUE (rounded) $1,836,000 $2,291,000 $2,856,000 $4,061,000 *Subtotal incorporates a 5% non-collection and 10% vendor profit discount. Out-of-hub fee revenue is provided for Scenario 2 only. **Subtotal incorporates separate 10% discounts for vendor profit, Employee Benefit Reductions (annual subscriptions only), and 24-hour subscription giveaways. †Fee revenue assumes overage accrual based on the average overages observed in Capital Bikeshare and Nice Ride (2013 data). Note: All projections are planning-level. Revenue levels shown above are estimated to be met by Year 3 of operation.
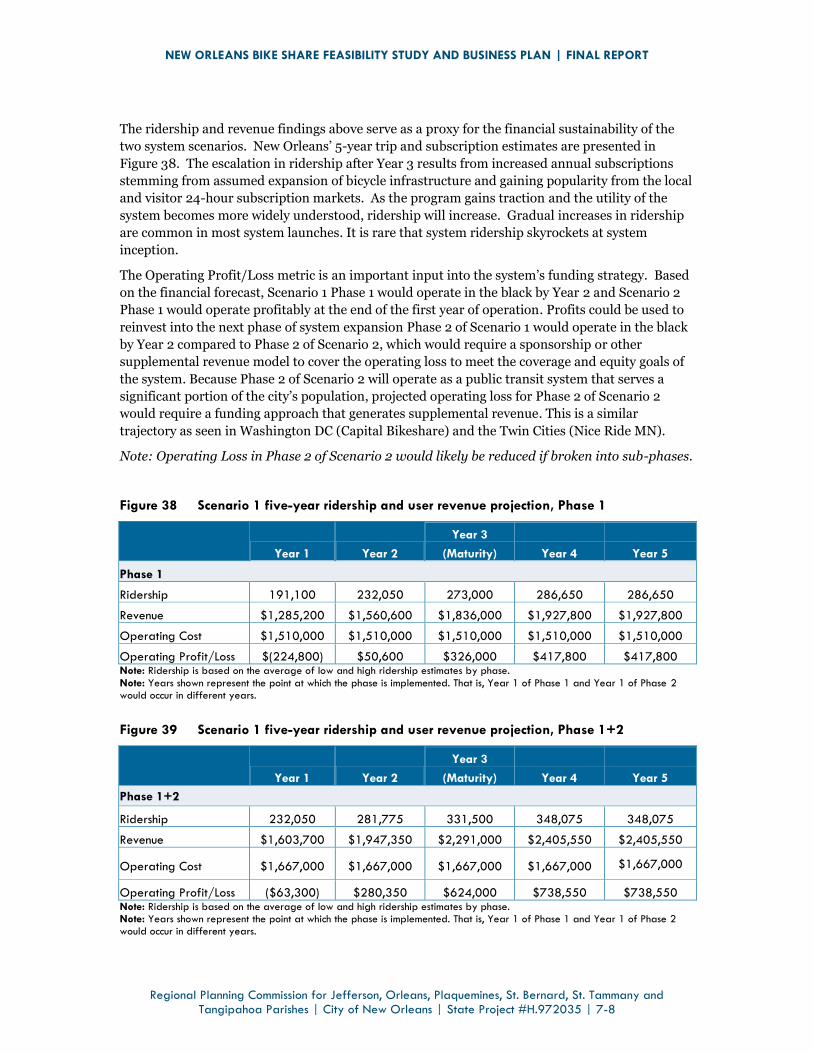
NEW ORLEANS BIKE SHARE FEASIBILITY STUDY AND BUSINESS PLAN | FINAL REPORT
Regional Planning Commission for Jefferson, Orleans, Plaquemines, St. Bernard, St. Tammany and Tangipahoa Parishes | City of New Orleans | State Project #H.972035 | 7-8
The ridership and revenue findings above serve as a proxy for the financial sustainability of the
two system scenarios. New Orleans’ 5-year trip and subscription estimates are presented in
Figure 38. The escalation in ridership after Year 3 results from increased annual subscriptions
stemming from assumed expansion of bicycle infrastructure and gaining popularity from the local
and visitor 24-hour subscription markets. As the program gains traction and the utility of the
system becomes more widely understood, ridership will increase. Gradual increases in ridership
are common in most system launches. It is rare that system ridership skyrockets at system
inception.
The Operating Profit/Loss metric is an important input into the system’s funding strategy. Based
on the financial forecast, Scenario 1 Phase 1 would operate in the black by Year 2 and Scenario 2
Phase 1 would operate profitably at the end of the first year of operation. Profits could be used to
reinvest into the next phase of system expansion Phase 2 of Scenario 1 would operate in the black
by Year 2 compared to Phase 2 of Scenario 2, which would require a sponsorship or other
supplemental revenue model to cover the operating loss to meet the coverage and equity goals of
the system. Because Phase 2 of Scenario 2 will operate as a public transit system that serves a
significant portion of the city’s population, projected operating loss for Phase 2 of Scenario 2
would require a funding approach that generates supplemental revenue. This is a similar
trajectory as seen in Washington DC (Capital Bikeshare) and the Twin Cities (Nice Ride MN).
Note: Operating Loss in Phase 2 of Scenario 2 would likely be reduced if broken into sub-phases.
Figure 38 Scenario 1 five-year ridership and user revenue projection, Phase 1
Year 1 Year 2
Year 3
(Maturity) Year 4 Year 5
Phase 1
Ridership 191,100 232,050 273,000 286,650 286,650
Revenue $1,285,200 $1,560,600 $1,836,000 $1,927,800 $1,927,800
Operating Cost $1,510,000 $1,510,000 $1,510,000 $1,510,000 $1,510,000
Operating Profit/Loss $(224,800) $50,600 $326,000 $417,800 $417,800 Note: Ridership is based on the average of low and high ridership estimates by phase. Note: Years shown represent the point at which the phase is implemented. That is, Year 1 of Phase 1 and Year 1 of Phase 2 would occur in different years.
Figure 39 Scenario 1 five-year ridership and user revenue projection, Phase 1+2
Year 1 Year 2
Year 3
(Maturity) Year 4 Year 5
Phase 1+2
Ridership 232,050 281,775 331,500 348,075 348,075
Revenue $1,603,700 $1,947,350 $2,291,000 $2,405,550 $2,405,550
Operating Cost $1,667,000 $1,667,000 $1,667,000 $1,667,000 $1,667,000
Operating Profit/Loss ($63,300) $280,350 $624,000 $738,550 $738,550 Note: Ridership is based on the average of low and high ridership estimates by phase. Note: Years shown represent the point at which the phase is implemented. That is, Year 1 of Phase 1 and Year 1 of Phase 2 would occur in different years.

NEW ORLEANS BIKE SHARE FEASIBILITY STUDY AND BUSINESS PLAN | FINAL REPORT
Regional Planning Commission for Jefferson, Orleans, Plaquemines, St. Bernard, St. Tammany and Tangipahoa Parishes | City of New Orleans | State Project #H.972035 | 7-9
Figure 40 Scenario 2 five-year ridership and user revenue projection, Phase 1
Year 1 Year 2
Year 3
(Maturity) Year 4 Year 5
Phase 1
Ridership 289,100 351,050 413,000 433,650 433,650
Revenue $1,999,200 $2,427,600 $2,856,000 $2,998,800 $2,998,800
Operating Cost $1,910,000 $1,910,000 $1,910,000 $1,910,000 $1,910,000
Operating Profit/Loss $89,200 $517,600 $946,000 $1,088,800 $1,088,800 Note: Ridership is based on the average of low and high ridership estimates by phase. Note: Years shown represent the point at which the phase is implemented. That is, Year 1 of Phase 1 and Year 1 of Phase 2 would occur in different years.
Figure 41 Scenario 2 five-year ridership and user revenue projection, Phase 1+2
Year 1 Year 2
Year 3
(Maturity) Year 4 Year 5
Phase 1+2
Ridership 521,150 632,825 744,500 781,725 781,725
Revenue $2,842,700 $3,451,850 $4,061,000 $4,264,050 $4,264,050
Operating Cost $4,705,000 $4,705,000 $4,705,000 $4,705,000 $4,705,000
Operating Profit/Loss ($1,862,300) ($1,253,150) ($644,000) ($440,950) ($440,950) Note: Ridership is based on the average of low and high ridership estimates by phase. Note: Years shown represent the point at which the phase is implemented. That is, Year 1 of Phase 1 and Year 1 of Phase 2 would occur in different years.
Productivity and Cost Effectiveness Validation
Productivity and cost effectiveness metrics were compared with the experience of existing bike
share systems to validate forecast bike share ridership and revenue in New Orleans. Metrics used
in this cross-examination include subscriptions per bike and trips per bike per day. Systems used
for this analysis are based on similar operating characteristics, business plans, and available data.
Although slightly more productive in Scenario 1 Phase 1, Scenario 1 Phase 2, and Scenario 2 Phase
1, New Orleans is most similar to Denver B-Cycle, Boston Hubway, and Nice Ride MN when
comparing trips per bike per day. When comparing annual subscriptions per bike, New Orleans is
most similar to Capital Bikeshare.
The ridership and revenue forecasts summarized in the previous four figures are deemed
reasonable and have been validated.
Figure 42 Productivity and cost effectiveness forecast validation
System Bicycles Annual subscriptions1 Annual trips2
Trips per bike per day
Annual subscriptions per bike
New Orleans (Scenario 1, Phase 1)
827 5,857 273,000 0.9 7.0
New Orleans (Scenario 1, Phase 2)
1,001 10,681 331,500 0.9 10.7

NEW ORLEANS BIKE SHARE FEASIBILITY STUDY AND BUSINESS PLAN | FINAL REPORT
Regional Planning Commission for Jefferson, Orleans, Plaquemines, St. Bernard, St. Tammany and Tangipahoa Parishes | City of New Orleans | State Project #H.972035 | 7-10
System Bicycles Annual subscriptions1 Annual trips2
Trips per bike per day
Annual subscriptions per bike
New Orleans (Scenario 2, Phase 1)
1,245 11,215 413,000 0.9 9.0
New Orleans (Scenario 2, Phase 2)
3,924 17,437 744,500 0.5 4.4
Capital Bikeshare (DC only) 2,574 41,176 2,623,272 2.8 16.0
Denver B-Cycle3 709 4,023 263,000 1.3 5.7
Boston Hubway4 1,200 7,048 533,755 1.9 5.9
Nice Ride Minnesota5 1,556 3,000 305,000 0.9 1.9 1 Represents New Orleans’s low end annual subscription estimate for Year 3 of each respective phase of development.
2 New Orleans’ Year 3 ridership projections are used to compare 2013 ridership from existing systems.
3 Based on a 278 day season.
4 Based on a 240 day season.
5 Based on a 217 day season.

NEW ORLEANS BIKE SHARE FEASIBILITY STUDY AND BUSINESS PLAN | FINAL REPORT
Regional Planning Commission for Jefferson, Orleans, Plaquemines, St. Bernard, St. Tammany and Tangipahoa Parishes | City of New Orleans | State Project #H.972035 | 7-11
SNAPSHOT OF THREE-YEAR FUNDING SHORTFALL
As a theoretical exercise, Phase 1 capital and operating costs for both scenarios were projected out
three years to understand the funding gap that is necessary to be recover through grants,
sponsorship, and other contributions. The results of this exercise are shown in Figure 43. Based
on the Year 3 maturity threshold used to cap capital costs, operating costs, and revenue (see ramp
up in Figures 38 and 39), initial funding levels (projected revenue plus initial known funding from
RPC) only make up 76% of Scenario 1, but fully cover the capital and operating funding needs of
Scenario 2. The remainder needs to be generated through other funding and revenue streams.
Based on the experience of other bike share systems, opportunities for sponsorship, and the
conservative revenue projections, it is well within reason to assume that the shortfall shown
below can be covered by additional funding mechanisms. The following section details funding
and revenue options to make up that gap.
Figure 43 Snapshot of Phase 1 Funding Need
Scenario 1: Station-based system 827 bicycles, 60 stations
Scenario 2: Smart Bike, hub-based system 1,245 bicycles, 89 hubs
Total capital costs $4.1 million $3.1 million
3-year operating costs $4.5 million $5.7 million
Initial 3-year costs $8.6 million $8.8 million
3-year revenue (see Figure 38 & 39) $5.0 million $7.3 million
Initial investment (RPC + local match)
$1.5 million $1.5 million
Initial 3-year funding $6.5 million $8.8 million
Delta/Shortfall ($2.1 million) $0.0 million
Note: All cost and revenue figures are for Phase 1 only.
All figures are rounded to reinforce the conceptual nature of this analysis.
FUNDING AND REVENUE OPTIONS
User revenue alone cannot finance the initial capital in full and is unlikely to be sufficient to cover
future phase expansion. A diverse funding strategy is necessary for a long-term, sustainable bike
share operation.
Bike share often operates as a public-private venture. Most successful bike share programs
receive funding from a range of public and private sources, and each sector’s participation
strengthens the ability to leverage funding. Although frequently touted as a private market
approach to transportation, bike share programs almost always require some public funding to
launch and maintain the operation. More recently, private investment has shouldered much of the
capital and operating investment as a way to leverage bike share’s positive impact on social,
environmental, and economic goals in their own public outreach campaigns. The private sector’s
willingness to contribute signals future success to potential program sponsors, the media, and the
public.
The following sections summarize funding options available for New Orleans’ initial phase system
launch.

NEW ORLEANS BIKE SHARE FEASIBILITY STUDY AND BUSINESS PLAN | FINAL REPORT
Regional Planning Commission for Jefferson, Orleans, Plaquemines, St. Bernard, St. Tammany and Tangipahoa Parishes | City of New Orleans | State Project #H.972035 | 7-12
Public Funding and Grants
Numerous federal agencies offer funding streams that bike share programs across the country
have used for capital and operating funds. These include the Federal Highway Administration
(FHWA), the Federal Transit Administration (FTA), the U.S. Department of Energy (DOE), U.S.
Department of Housing and Urban Development (HUD), and the National Park Service (NPS).
Bike share programs nationwide have received federal and state awards through open
communication and collaboration with state departments of transportation and metropolitan
planning organizations, such as the Regional Planning Commission (RPC). As a relatively new
component to the transportation system, bike share has unique barriers to implementation. For
this reason, operators and local agencies have centered discussions on how bike share will
address challenges such as air quality, job access, transit ridership, economic development, and
public health. Funding for bike share capital or operating costs is often a smaller component of a
larger transportation, housing, or economic development project. The federal and state grants
discussed below will require the operator and/or local agencies to address these challenges while
coordinating grant writing with the Louisiana Department of Transportation and Development
(DOTD), RPC, the Louisiana Department of Natural Resources (DNR), the Housing Authority of
New Orleans (HANO), or the Louisiana Department of Health and Hospitals (DHH). In addition
to local agencies and a potential bike share operator, existing non-profits can work to secure
grants. Broad Community Connections, Freret Business and Property Owner Association, Old
Algiers Main Street, Bike Easy, and other local non-profit community development groups may
have grant options that public agencies do not.
Additional challenges come with eligibility. According to the FTA, bike share is not formally
defined as public transit. As a result, the bicycles cannot be paid for with FTA dollars, but other
components of the system can. The FHWA, however, does fund bicycles because they are defined
as part of the parking system. Attention to these details is critical for successful grant
applications.
Federal Funding Sources
Congestion Mitigation and Air Quality (CMAQ) Improvement Program. Bike share
funding from FHWA frequently comes through the CMAQ Improvement Program. Recipients of
these funds include government agencies and private, non-profit organizations, particularly in
urban areas that do not meet National Ambient Air Quality Standards. Even though New Orleans
meets these standards, the Louisiana DOTD still receives approximately $11.5 million per year in
maintenance funding that may be used for bike share program development and capital
procurement. To initiate this grant process, the program administrators will need to request RPC
to place bike share on the list of Transportation Improvement Program projects. Likewise,
coordination with DOTD is critical to ensure livability-oriented investments that reduce
congestion and further clean air efforts—like bike share—are considered for CMAQ awards.
Programs that have benefited from this funding source include Boston Hubway, Bike
Chattanooga, and Capital Bikeshare, among several others. None of those programs required local
match grants, but in general CMAQ matching is 20% local match. The next call for projects is
expected in the first quarter of 2016.

NEW ORLEANS BIKE SHARE FEASIBILITY STUDY AND BUSINESS PLAN | FINAL REPORT
Regional Planning Commission for Jefferson, Orleans, Plaquemines, St. Bernard, St. Tammany and Tangipahoa Parishes | City of New Orleans | State Project #H.972035 | 7-13
Roughly 80% of Capital Bike share’s initial system launch and 75% of its expansion to Arlington was funded by CMAQ funds.
Source Nelson\Nygaard
Moving Ahead for Progress in the 21st Century (MAP-21). The current federal
transportation bill, MAP-21, includes a grant program for alternative transportation projects
called the Transportation Alternatives Program (TAP). Because the grant program has just begun,
only a handful of bike share programs have benefited from this revenue source. For example,
Puget Sound Bike Share—an administrative non-profit—received a $750,000 Transportation
Alternatives grant administered through the Washington Department of Transportation. DOTD
will administer the final apportionment, so the bike share operator and/or public agency needs to
communicate bike share’s relatively minor funding needs and major benefits to DOTD for funding
consideration. Of the federal revenue sources on the list, the Transportation Alternatives Program
is one of the most flexible, but also one of the most competitive. Program sponsors will need to
underscore the ways in which bike share will help achieve existing state and local transportation
goals. Grants require a 20% local match and the next application period is due July 31, 2016.
Federal Transit Administration (FTA). The FTA offers an additional set of bike share
funding sources. FTA funding sources have been used in a number of different ways, including
planning, docking stations, and on-street infrastructure. These funds, however, have not
historically paid for the bicycles themselves because bicycles are not formally recognized as a form
of public transit. Bike share funding from FTA generally comes with the stipulation that the
system must directly enhance transit service. Therefore, the operator and/or public sponsor needs
to work with the City of New Orleans, RTA, and JeT to consider ways in which bike share can
support and enhance transit service. While transit capital funding received by RTA or JeT could
qualify to be used for bike infrastructure, these revenue sources compete for funding with transit
operations and other capital needs. Grant opportunities include the following:
FTA 5316 Job Access Reverse Commute funds can be used if the stations help
connect lower-income residents and employees to jobs and job training sites. This grant
aims to address the unique transportation challenges faced by welfare recipients and low-
income persons, many of whom have difficulty accessing jobs from inner city locations. If
a proposed bike share service includes lower income areas and employment centers, the

NEW ORLEANS BIKE SHARE FEASIBILITY STUDY AND BUSINESS PLAN | FINAL REPORT
Regional Planning Commission for Jefferson, Orleans, Plaquemines, St. Bernard, St. Tammany and Tangipahoa Parishes | City of New Orleans | State Project #H.972035 | 7-14
New Orleans bike share program could qualify for FTA 5316. This grant requires a 20%
local match.
FTA 5307 Urbanized Area Formula Program funds stipulate that pedestrian and
bicycle access projects are eligible for funding. The challenge is that this may compete
with funding for RTA and JeT. Coordination with the City of New Orleans is required.
These grants require a 10-20% match.
FTA Bus Livability Discretionary Grants (unallocated Section 5309 Bus and Bus
Facilities funding) fund projects that fulfill the six livability principle of the Interagency
Partnership for Sustainable Communities. Bicycle infrastructure and bike share are
eligible if the bike share program is oriented toward bus stop integration. This may entail
docking stations or information kiosks at bus stops—an approach that was successfully
employed by Boston Hubway. The New Orleans Bike Share program should work with the
City of New Orleans and RTA to determine how the program can best achieve this
objective. Capital assistance grants are funded up to 80% of the net project costs. The
application timeline is on a rolling basis. Historically, the program has been fully
earmarked. However, if the program is not fully earmarked, unallocated or discretionary
funds may be available. Such funds may be allocated at the discretion of the federal
Secretary of Transportation.
FTA 5309 New Starts funding as part of the North Rampart streetcar extension could
be used for bike share station procurement as this would constitute an eligible station
access improvement.
TIGER Grants. The Transportation Investment Generating Economic Recovery (TIGER)
Discretional Grant program has broad eligibility, making it a highly competitive program. Bike
share programs have won awards for system expansion, but these awards have come through
multimodal grant applications. For instance, Chicago’s Divvy bike share system benefitted from a
$20 million TIGER grant to repair 3.6 miles of track on the Chicago Transit Authority’s Blue Line.
To build a successful grant application for New Orleans bike share, the applicant must
demonstrate how bike share will address transportation challenges of national importance. This
may entail a joint application with another transportation project, such as streetcar expansion or
busway improvements. Regardless of the approach, working with closely with RTA and JeT is
highly recommended. Most successful grant applications are filed through transit agencies or
departments of transportation. This grant requires an 80% federal/20% local match. The 2015
application deadline is not available.
Centers for Disease Control and Prevention (CDC). The CDC’s Division of Nutrition,
Physical Activity, and Obesity cooperative agreements, Prevention and Public Health funds, and
the Communities Putting Prevention to Work Program provided funding to help communities
reduce obesity rates. Boston Hubway, Nashville B-Cycle, and San Antonio Bike share have
received this grant by considering the public health benefits bike share brings to cities.
The CDC has also recently announced a new funding opportunity to advance obesity prevention
and promote equity.
DP14-1417 Partnerships to Improve Community Health will provide funding to
local public health offices, local housing authorities, school districts, and local
transportation. Ten to 15 large cities will receive awards ranging from $1 million to $4
million on projects that create environments promoting good health for all. Successful
projects will work to promote healthy weight and improve access to health care services.

NEW ORLEANS BIKE SHARE FEASIBILITY STUDY AND BUSINESS PLAN | FINAL REPORT
Regional Planning Commission for Jefferson, Orleans, Plaquemines, St. Bernard, St. Tammany and Tangipahoa Parishes | City of New Orleans | State Project #H.972035 | 7-15
While the 2014 cycle application deadline was July 22, 2014, another round of funding is
expected in 2015.
New Orleans bike share program administrators will need to demonstrate bike share’s potential
public health impacts on obesity, type 2 diabetes, and air quality when applying for public health
grants. Partnering with local public health organizations, the New Orleans Health Department
and the Louisiana Department of Health and Hospitals will help reinforce the positive health
impacts of bike share, build support for the program’s implementation, and demonstrate to the
CDC that the groundwork for meeting health goals has been laid.
U.S. Department of Energy (DOE). Numerous bike share programs have benefited from
DOE’s Energy Efficiency and Conservation Block Grant program. The grant program’s goal is to
reduce fossil fuel emissions and reduce total energy use. These grants benefit projects that
support these goals and also spur economic development. Denver B-Cycle and San Antonio Bike
share received this grant after stipulating emissions reductions and potential vehicle miles
traveled savings. Working with the business community, particularly local business associations,
may inform bike share program leadership on economic development opportunities. This may
result in a stronger case for why bike share should receive the DOE grant.
Federal Lands Access Program. MAP-21 established the Federal Lands Access Program,
which aims to improve transportation facilities that provide access to Federal lands. The program
supplements state and local resources for public roads, transit systems, and other transportation
facilities, emphasizing high-use recreation sites and economic generators. The program provides
flexibility for a wide range of transportation projects, including bicycles projects. New Orleans is
home to New Orleans Jazz National Historical Park and the Jean Lafitte National Historical Park
and Preserve in the French Quarter and the Jazz Walk of Fame at Algiers Point. These sites would
be accessible by bike share and would therefore qualify for the grant. The grant gives preference
to high use sites, which would make these locations candidates for docking stations, information
kiosks, or other equipment a bike share program may need.
This grant uses a sliding scale for local match funding requirements. "Soft-matches" or "in-kind
matches" (e.g., donations of funds, materials, services, right-of-way acquisition, utility relocation)
may be permitted from the project sponsor. More detail on the matching options can be found in
United States Code Title 23, Section 120.
HUD Community Development Block Grants. The U.S. Department of Housing and Urban
Development’s (HUD) Community Development Block Grant Program is a flexible program that
provides communities with resources to address a wide range of unique community development
needs. The program areas provide assistance for cities of all sizes, neighborhoods, and areas
affected by natural disasters. The Entitlement Communities program area may be the most
suitable for bike share funding in New Orleans. This program allocates annual grants to larger
cities to develop viable communities. The funding can be used for housing and opportunities to
expand economic prospects for low- and moderate-income residents. This grant would require
working with the Housing Authority of New Orleans to gain approval from HUD. Although HUD
has granted funds for bicycle programs and infrastructure, the applicant would need to legitimize
how funding components or marketing in lower income areas would improve the living and
employment situation of residents. Bike share would likely need to be a smaller component of a
larger housing or economic development project to have a successful grant application. The
application period begins in November 2014. For formula grants, action plans associated with the
Consolidated Plan must be submitted based on the grantee's program year, but no earlier than

NEW ORLEANS BIKE SHARE FEASIBILITY STUDY AND BUSINESS PLAN | FINAL REPORT
Regional Planning Commission for Jefferson, Orleans, Plaquemines, St. Bernard, St. Tammany and Tangipahoa Parishes | City of New Orleans | State Project #H.972035 | 7-16
November 15, 2014 or no later than August 15, 2015 of the fiscal year for which the funds are
allocated.
State, Metropolitan, and City Funding Sources
A small number of bike share programs have relied on state funding, either directly from the state
departments of transportation, departments of health, or through universities. The University of
Minnesota, for instance, provided $150,000 for the start-up of Nice Ride Minnesota. The Florida
Department of Transportation granted $300,000 to Broward B-Cycle (Fort Lauderdale), covering
about 28% of the start-up costs. State health departments have committed funding as well. The
Hawaii State Department of Health has committed $1 million toward bike share capital from their
Healthy Hawaii Initiative tobacco settlement funds.
Considering bike share’s benefits to the tourism market, tourism grants could be one other source
of revenue. The Louisiana Office of Tourism has a competitive grant program for marketing,
which may help fund some of the promotion of bike share before its launch. Events also eligible
for grants include the grand opening of a new Louisiana tourism attraction. A successful grant
could ensure a smooth rollout for the bike share tourist market. The New Orleans Tourism
Marketing Corporation, the City’s leisure travel promotion agency, may also work to smooth this
transition by dedicating some of its more than $7 million budget for marketing and promotion of
the bike share program. The same could be said for the Convention and Visitors Bureau and the
Convention Center, which have annual budgets amounting to $12.6 million and $57 million,
respectively.30
A more flexible source of funding could come from RPC. Formula funding from metropolitan
planning organizations are available for planning activities that support the economic vitality,
increase safety of the transportation system for non-motorized users, promote energy
conservation, and improve the quality of life. RPC has $1.5 million or more of funding that
could be used for the planning of the bike share network. This funding, however,
requires a 20% match from the City.
City transportation funding has been one of the more common sources of funding, especially for
ongoing maintenance and operations costs. Dedicating a relatively small amount of funding from
a stable revenue source can help the system run smoothly, equitably, and safely. Funding from the
automated traffic enforcement camera fund or parking revenue are two options to promote long-
term program stability.
Other local funds could stem from the BP Gulf Coast Oil Spill settlement funds. The 2010
Deepwater Horizon disaster led to more than 100 nonprofit organizations and government
entities receiving $44 million from BP. Of this total, Louisiana agencies received $16 million for
tourism. Recipients included the New Orleans Tourism Marketing Corporation, New Orleans City
Park, New Orleans Museum of Art, New Orleans Convention & Visitors Bureau, and the Louisiana
Department of Culture, Recreation, and Tourism. Any of these agencies or non-profits could set
aside a small portion of this revenue for information kiosks, bicycles, or docking stations, if
applicable.
30 2014 Convention and Visitors Bureau and the Louisiana Division of Administration

NEW ORLEANS BIKE SHARE FEASIBILITY STUDY AND BUSINESS PLAN | FINAL REPORT
Regional Planning Commission for Jefferson, Orleans, Plaquemines, St. Bernard, St. Tammany and Tangipahoa Parishes | City of New Orleans | State Project #H.972035 | 7-17
Private foundations, Loans, Grants, and One-time Gifts
Although public grants are more common revenue sources, private and institutional grants are
small, but common elements of bike share funding.
The Robert Wood Johnson Foundation helped fund the planning of bike share programs and
other bicycle initiatives. The Bristol-Myers Squibb Foundation, Lilly Endowment, Richard King
Mellon Foundation, and the Ruth Mott Foundation helped fund bike projects and may provide a
new source for bike share revenue. Companies such as REI have provided grants of less than
$50,000 on bike projects through the Bicycle Friendly Community Grants Program. Trek Bicycle
has also given money to bicycle projects through the Bicycles Belong Program. Private universities
served by the system may also help pay for bike share programs. For instance, Nice Ride
Minnesota received $30,000 from Macalester College to help fund a station at their campus.
Local universities would likely benefit from a bike share program in New Orleans. These
universities may sponsor stations, promotional materials, bicycles, or information kiosks,
particularly if these are on their campuses.
Other bike share programs have considered smaller private donations from individuals and small
businesses. The City of Boulder launched a fundraising program that focused on small gifts of
about $20 to fund capital costs. Larger one-time gifts from institutions, charitable groups, and
individuals may also generate sizable amounts of capital.
The Community Reinvestment Act, a Federal law designed to encourage banks to help meet the
needs of borrowers in low- and moderate-income neighborhoods, loaned $41 million to New York
City’s Citi Bike. This helped Goldman Sachs reach its $2 billion requirement under the Act. The
bike share system must serve lower income neighborhoods to qualify for this program, however.
A variety of banking institutions located in New Orleans may provide opportunities for these
loans. These include Regions, Chase, and Iberia.
Corporate wellness programs and benefits packages
Corporate membership programs reduce motor vehicle trips and may be an excellent revenue
generator, especially with multi-year contracts. Employers may choose to add bike share
membership to healthcare and wellness programs. This idea was well received during healthcare
and business stakeholder meetings.
Sponsorship and Advertising
Sponsorship and advertising are the primary funding sources used to cover capital and operating
costs in systems across North America. Private companies or other organizations, such as
financial groups or health insurance companies, have provided up to 100% of the capital costs for
some programs. Sponsors raise the revenue to ensure the system is fully funded and also build
relationships with other community partners to support and promote the system. Advertising, a
mechanism frequently employed by sponsors or program operators to generate revenue, has
appeared at kiosks, on billboards, on street furniture, and on the bicycles themselves. As opposed
to sponsorship, companies that advertise through bike share infrastructure do not necessarily
play a role in promoting or managing the system.

NEW ORLEANS BIKE SHARE FEASIBILITY STUDY AND BUSINESS PLAN | FINAL REPORT
Regional Planning Commission for Jefferson, Orleans, Plaquemines, St. Bernard, St. Tammany and Tangipahoa Parishes | City of New Orleans | State Project #H.972035 | 7-18
Sponsorship types
Different bike share programs have raised revenue through a variety of sponsorship types. With
each of these sponsorship types come different challenges and opportunities. Three of the most
common sponsorship types are explained below:
Title or Presenting Sponsor. In these programs, the sponsor integrates its brand directly into
the bike share system. The color and logos appears on bikes, and the title of the system includes
the sponsor’s name. The term of commitment typically ranges between 3-5 years with first right of
refusal on renewal. Examples of title sponsors include London’s Barclays Cycle Hire and New
York City’s Citibike. The advantage for the sponsor is brand exposure during the launch of the
program, and the sponsor in turn funds a significant percentage, often up to 100% of the capital
costs for the exclusivity provisions.31 The municipality, however, will have a limited input on the
aesthetics of the bikes, stations, and kiosks. Under this sponsorship type, the system sponsor may
seek other corporate partners. These secondary sponsors, called presenting sponsors, may also
place their logo on the bicycle or serve as the official payment sponsors. Examples of presenting
sponsors include New Balance in Boston’s Hubway system and Blue Cross Blue Shield of
Minnesota in Nice Ride Minnesota’s system.
Salt Lake City’s GreenBike program has a presenting sponsorship from Select Health and a basket sponsorship (a type of presenting sponsorship from Rio Tinto).
Source: SLC Bike Share
31 Although some systems are fully funded by a title or presenting sponsor, 30-40% is a more typical level of investment.

NEW ORLEANS BIKE SHARE FEASIBILITY STUDY AND BUSINESS PLAN | FINAL REPORT
Regional Planning Commission for Jefferson, Orleans, Plaquemines, St. Bernard, St. Tammany and Tangipahoa Parishes | City of New Orleans | State Project #H.972035 | 7-19
Stakeholder outreach found that there are a number of local health care organizations, hotels,
local businesses, and other organizations that have the resources and interest to enter into a
sponsor agreement with connections to New Orleans.
There is also potential for multiple presenting sponsorships. While a single title or presenting
sponsor might yield a larger upfront capital investment and reduce efforts during the second wave
of sponsor negotiations, it is unclear that this model is well suited to the New Orleans market. An
alternative is to seek multiple presenting and major sponsors. This would make sponsorship more
accessible to smaller businesses to invest in the system and reduce competition for a smaller
number of sponsorships. Potential drawbacks to this approach may include the effort required to
securing and maintain numerous sponsors and that brand recognition may become diluted with a
broader set of sponsors.
The hospitality industry, professional sports franchises like the Saints and Pelicans, event spaces,
could provide full or partial sponsorship.
Major Sponsor. Major sponsors contribute revenue to the system and receive some privileges,
such as advertising on marketing material or exclusive advertising rights on the bicycles or at
kiosks. Major sponsors, however, do not have their company name attached to the bike share
program title, and they may have only a limited role in choosing the bike color, system design,
and marketing campaigns. This sponsorship brings in less revenue for the program than title
sponsorship, but system operators have more control over aesthetics and marketing.
In July 2013, Seattle Children’s Hospital became a $500,000 major sponsor of the future Puget Sound Bike Share system and will receive employee memberships to the bike-sharing program as well as marketing exposure.
Source: Seattle Children’s Hospital
Station Purchase Sponsor. Universities, private businesses, and organizations frequently
purchase stations to ensure employees have easy access to their campuses by bicycle. Several
universities and a number of hospitals are located within the bike share operating footprint and
may consider sponsoring a station. Station sponsor opportunities are also often located at large
employers or major hotels, many of which are concentrated in the CBD, opening up station
sponsorships as a way for employers to better cater to their employees and visitors.
Equity Matching. To promote an equitable system, private entities may choose to purchase or
sponsor bike share stations or information kiosks located in lower income neighborhoods. For
instance, if a major company would like to sponsor a station near their building, they can be asked
or required to sponsor a station located in a low-income community that would benefit from

NEW ORLEANS BIKE SHARE FEASIBILITY STUDY AND BUSINESS PLAN | FINAL REPORT
Regional Planning Commission for Jefferson, Orleans, Plaquemines, St. Bernard, St. Tammany and Tangipahoa Parishes | City of New Orleans | State Project #H.972035 | 7-20
being a part of the network. This may be particularly effective with hospitals, which need to be
accessible to all income groups.
Figure 44 Bike share sponsorship types
Sponsor Type Investment Level Benefits
Title or Presenting Sponsor $1 - $2.5 million (lump sum or 3-5 year incremental payment)
Logo on all bikes and materials and media
Major Sponsor $100,000 - $500,000 High exposure on bike share materials and media
Station/Hub Purchase
Sponsor
Up to $65,000 per station (could be
more depending on the station design)
Guarantee station at corporate site,
logo on website Note: Actual investment levels may vary. For the purposes of this study, the investment levels detailed above correspond to sponsorships secured in similar markets.
Advertising
Many businesses may be interested in the advertising opportunities that bike share brings to a
community. Although New Orleans’ historic districts have strict sign codes, advertising on mobile
units and vehicle markings is not as limited. Placing advertising on the basket or rear fender has
brought in additional revenue to many systems, including Miami’s Deco Bike. Businesses have
also purchased ads at information kiosks, though these will likely not be permitted in the French
Quarter and other historic neighborhoods.
On a larger scale, some cities have paired advertising contracts with the bike share program.
Examples include Brisbane, Lyon, and Paris. Additional billboards and smaller signage
throughout the city have generated stable revenue streams, helping some of these programs
operate without any contributions from the local government.
This revenue stream comes with a number of challenges. The administrative costs of working with
businesses in developing appropriate ads can cut into the profits. Moreover, additional
advertising can lead to ad clutter, detracting from the aesthetics of New Orleans’ community.
Other opportunities
The New Orleans bike share program may also choose to leverage New Orleans’ energy industry
resources to sponsor solar docking stations. Community partners may sponsor the
implementation of solar panels and will in turn have a small decal acknowledging their
contributions (e.g., “This bike share station is powered by Company X”).
Another option could be to work with the land development community. If a developer purchases
or sponsors a station near a new development, the City could grant tax credits or reduce parking
requirements in return for bike share accommodations. This may have the added benefit of
reducing rents for residents and businesses.
Moreover, local businesses, such as retail stores, hotels, and restaurants, may choose to make
contributions to stations that are sited near their location. Bike share program administrators
may choose to follow in the footsteps of other bike share programs by providing promotions and
coupons on their website and in newsletters. Coupon books featuring bike share station-adjacent
businesses provide a promotional opportunity and may build community support for the
program.
NEW ORLEANS BIKE SHARE FEASIBILITY STUDY AND BUSINESS PLAN | FINAL REPORT
Regional Planning Commission for Jefferson, Orleans, Plaquemines, St. Bernard, St. Tammany and Tangipahoa Parishes | City of New Orleans | State Project #H.972035 | 8-1
8 AN ACTION PLAN FOR BIKE SHARE Throughout the Feasibility Study and Business Plan process, public and private sector
stakeholders have expressed support and excitement for establishing a bike share system in New
Orleans. This study determined that bike share is not only feasible, but it will flourish as a
community mobility tool. It is clear that internal staff, advocates, and the business community are
eager to move forward with implementation as quickly as possible.
Implementing New Orleans’ bike share system will require the bike share non-profit to develop a
clear and actionable work plan. This chapter offers insight into some of the key implementation
action items as well as stakeholder-generated features that will help distinguish the bike share
program as uniquely New Orleans.
IMMEDIATE ACTION PLAN
The following actions will move the non-profit forward to the vendor selection and pre-launch
phase. The following Immediate Action Plan and supporting recommendations are intended to
guide the project partners through key initial activities prior to establishing the non-profit’s
structure and hiring the non-profit’s Executive Director.
The following six actions are recommended for execution over the next six months. These steps
could be completed in a number of scenarios depending on how the program unfolds and what
entities become involved. As recommended in Chapter 5, these actions should be completed as
the Board of Director’s monitor performance of hub-based, smart-bike systems in other cities.
Establish the bike share non-profit
The first step in implementing bike share is to form the 501(c)3 non-profit corporation (pursuant
to the Louisiana Non-Profit Corporation Law, Title 12, Chapter 2 of the Louisiana Revised
Statutes 1950. The City of New Orleans’ home rule charter authorizes the foundation of non-profit
corporations as components of City commissions. To form the bike share entity as an
administrative non-profit corporation, it is necessary to establish a mission statement
complementary to the City’s mission, file articles of incorporation with legal representation,
develop a financial structure, and apply for tax exempt status.
Next Steps and Responsibility: The City of New Orleans staff, led by the Mayor’s Office
should begin discussions internally to develop the bike share non-profit corporation ordinance,
its internal structures, basic protocols, and terms of membership. The City should review the
process of developing the New Orleans Business Alliance and the New Orleans Recreation
Development Commission to identify lessons learned when establishing those non-profit
corporations.

NEW ORLEANS BIKE SHARE FEASIBILITY STUDY AND BUSINESS PLAN | FINAL REPORT
Regional Planning Commission for Jefferson, Orleans, Plaquemines, St. Bernard, St. Tammany and Tangipahoa Parishes | City of New Orleans | State Project #H.972035 | 8-2
Establish Interim Board of Directors
An interim Board of Directors should be established to guide the development of the bike share
non-profit and establish initial protocol and bylaws. Critical roles for the interim Board would be
to finalize and approve non-profit bylaws, hire an Executive Director, and begin early sponsorship
discussions. The bylaws may be amended when the Executive Director is hired and the non-
profit’s new Board of Directors is selected. We recommend the interim Board consist of mayoral
appointees and representatives of the Regional Planning Commission, private sector, non-profit
sector, or from other institutions (such as universities). Established funders should be given
priority on the Interim Board.
Next Steps and Responsibility: The Project Advisory Committee and Business Advisory
Committee for the Bike Share Feasibility Study and Business Plan process should be convened in
Fall of 2014 to select members of the interim Board of Directors. .
Obtain Seed Funding
Identifying the initial funding to begin non-profit operations represents the most immediate
challenge to implementing bike share. For the time being, no dedicated funding has been
established to create and support operations of a non-profit corporation. Identifying seed funding
is a critical initial step to bring the City closer to bike share implementation.
Next Steps and Responsibility: This Immediate Action Plan recommends identifying one or
more interim lead fundraisers in subsequent immediate actions. More detail on fundraising is
presented below.
Hire an Executive Director
More than any one person, the non-profit Executive Director will be instrumental in the
program’s success. Finding the right leader is imperative. A list of desired characteristics and
qualities for the Executive Director position are presented in Figure 45.32
Other important attributes include experience with Board management, relations, and getting
Board resolutions passed; understanding of local permitting processes and permit expediting;
and the ability to run a “lean” organization. The Executive Director must be adept at writing RFPs
such as vendor and operator contracts and should be comfortable negotiating contracts with the
support of a legal representative.
To manage and extend the reach of New Orleans’s bike share fundraising effort during the
Immediate Action Phase, seed fundraising discussions for the non-profit need to be limited to a
few key individuals. In addition to the Executive Director, having someone from the private sector
or a local foundation in this role – preferably someone who would serve on the Board of Directors
– would help build confidence with other potential funders. The Executive Director must
coordinate the fundraising efforts; providing support and direction to the fundraising lead.
Next Steps and Responsibility: The interim Board of Director’s should finalize a set of
requirements and desired attributes for the Executive Director position and determine a selection
process for hiring the best candidate. The interim Board should then advertise the position
32 These qualifications are based on the real experience of current bike share non-profit Executive Directors.

NEW ORLEANS BIKE SHARE FEASIBILITY STUDY AND BUSINESS PLAN | FINAL REPORT
Regional Planning Commission for Jefferson, Orleans, Plaquemines, St. Bernard, St. Tammany and Tangipahoa Parishes | City of New Orleans | State Project #H.972035 | 8-3
broadly to attract as many qualified candidates as possible. New Orleans has a wealth of qualified
professionals and entrepreneurs. The collective rolodex of the interim Board, Mayor’s Office, and
other influential stakeholders should be tapped in order to identify a pool of great non-
profit/business leaders.
If sufficient funding is available, the interim Board should seek to hire an Executive Director
under a contract of at least two years to ensure stability through the implementation process. It is
also advisable to structure the Executive Director’s contract with financial incentives for securing
sponsorship deals, hitting implementation targets, and meeting system performance measures.
The interim Board of Director’s should immediately identify one or more lead fundraisers, which
could be a local champion figure, board member, or other well-connected volunteer. This point
person should develop a basic “pitch book” with supporting sales materials that can be used to
secure “interim funding” on behalf of the interim Board.
Figure 45 Desired Executive Director characteristics and qualifications
Characteristic Description
Business and/or legal
acumen
Starting up and running a successful bike share non-profit will require
extensive understanding of local business and legal frameworks. Contract
writing and strong negotiation skills will also be a critical skill set when
negotiating with the turnkey operator and the City on issues of liability,
ownership, station siting, and the like. Likewise, experience with non-profit
management is an attractive skill.
Communications and
partnership building
experience
Successful bike share non-profits have many supportive partners and rely on
public and private sector support. Good interpersonal skills and the ability
to negotiate private sponsor and public sector interests are critical.
Understanding of New
Orleans and statewide
politics
The ideal candidate will need to navigate local and statewide politics to
maintain progress towards initial start-up.
Fundraising experience and
ability to identify innovative
funding sources
Fundraising is one of the most important tasks of an Executive Director. It is
important for a candidate to have intimate knowledge of the local business
environment and relationships with key businesses, the tourism industry, major
institutions, and others interested in investing in sustainability initiatives.
Experience or understanding
of business operations (bike
share operations or
otherwise)
Because the recommended operating model is an administrative non-profit,
it is not critical that the Executive Director knows service operations.
However, experience in this area would help ensure quality control and the
ability to produce contracts with appropriate performance metrics.
Identify and retain partners and resources to support non-profit development
Professional and organizational resources need to be secured, formed, or identified to support the
development of the non-profit organization. Key supporting needs for the Immediate Action Plan
and ongoing implementation include:

NEW ORLEANS BIKE SHARE FEASIBILITY STUDY AND BUSINESS PLAN | FINAL REPORT
Regional Planning Commission for Jefferson, Orleans, Plaquemines, St. Bernard, St. Tammany and Tangipahoa Parishes | City of New Orleans | State Project #H.972035 | 8-4
Establishing an internal working group including representatives from the City of New
Orleans Mayor’s Office, Department of Public Works, City Planning Commission, City
Council, RPC, RTA, Historic District Landmarks Commission, and Vieux Carre
Commission and other key public sector stakeholders. The Working Group can provide
support on items such as permitting and siting stations, historic district design review
considerations and permitting, media outreach, public sector funding development, and
fare integration. The City would need to dedicate a significant number of public employee
hours to coordinate issues regarding permitting and other activities required to expedite
bike share program development.
Attaining marketing support and public messaging about bike share from RTA. Because a
successful bike share system will yield positive ridership impacts for the local fixed route
transit system, RTA confirmed interest in marketing and messaging bike share as an
integrated component of the public transit system.
Brokering partnerships with the New Orleans Business Alliance, Housing Authority of
New Orleans, Greater New Orleans Housing Alliance, New Orleans Redevelopment
Authority, and others to help site hub or kiosk locations, educate potential users, identify
bike share champions or ambassadors, and learn about barriers to entry. This will feed
into the strategy for equitable access.
Establishing partnerships with groups like Bike Easy and Ride New Orleans that will
serve as bike share ambassadors and provide education, advocacy, and outreach support.
Formalizing a convention program with the Convention and Visitors Bureau and the New
Orleans Convention Center. During stakeholder focus groups, representatives from the
Convention and Visitors Bureau expressed interest in purchasing daily or multi-day
passes for convention goers. This would provide an immediate and long-standing influx
of revenue.
Next Steps and Responsibility: The interim Board of Directors should convene an internal
bike share working group. The working group should be tasked with establishing partnerships
and relationships to support the non-profit. The working group should also meet on a regular
basis to identify implementation challenges and brainstorm ideas for how to overcome these
challenges. The working group should also produce a work plan that can be used to prioritize
implementation tasks and convey the public sector’s in-kind support for bike sharing.
The working group and interim Board should identify potential candidates for pro-bono legal
support, if legal support cannot be provided through the City of New Orleans.
Develop a communications and community outreach strategy
The bike share operator should develop a communications and community outreach strategy that
establishes a roadmap for community outreach, education, and citywide messaging and media
correspondence. A communications and community outreach strategy can be required as part of
the vendor and operator RFP (see below). The strategy should meet and exceed the City’s goals for
equity and outreach as part of detailed system planning and implementation and guide the bike
share operator as it develops program messaging, outreach activities, and mechanisms that
engender local support. The bike share operator and the City of New Orleans will likely be
responsible for coordinating and delivering community outreach and communications activities.
During the pre-launch phase, and until the bike share operator is in operation, the City of New
Orleans’ communications director will coordinate all media communication. The RTA, RPC, and
the City of New Orleans Department of Public Works can provide technical support. Messaging

NEW ORLEANS BIKE SHARE FEASIBILITY STUDY AND BUSINESS PLAN | FINAL REPORT
Regional Planning Commission for Jefferson, Orleans, Plaquemines, St. Bernard, St. Tammany and Tangipahoa Parishes | City of New Orleans | State Project #H.972035 | 8-5
should be high level, focusing on the City and region’s role in conducting a feasibility study and
business plan. This message should remain until the bike share operator can become the “face” of
the project to the media and the public.
Once the bike share operator is established, the organization should lead all communications and
media activities. This is critical to ensure the bike share program builds brand recognition, trust,
and a rapport within the community and with potential funders.
Next Steps and Responsibility: Per recent discussions with public sector staff, media
communications should be coordinated by the City of New Orleans communications director. The
agreed upon communications and media strategy should be employed effective immediately.
Separate Vendor and Operator RFPs
Selecting a vendor and operator is an important step in establishing the bike share system.
Negotiating the details of service, performance, and roles will influence the relationship between
the contractors and the non-profit corporation and between the users and the service. A critical
next step is to develop and release a vendor/operator request for proposals (RFP). The RFP
stipulates the needs of the program and sets basic expectations for the future contract
vendor/operator. Requirements may include vendor responsibility for fundraising, marketing,
detailed station site design and performance monitoring, as well as bicycle design, payment and
transactional requirements, thresholds for local staffing, and even opportunities to experiment
with new technology and station or hub location design. Several opportunities arose during the
stakeholder Idea Sessions, including:
Integrating private bicycle parking into the design of the hub locations; and
Investigating the viability of citizen-led hub location design (i.e., painted racks and kiosks
to make the system uniquely NOLA and less likely to be vandalized).
The contract should include specific language requiring the operator to collect basic performance
information. The operator should be required to provide a performance reporting web platform
accessible to the public. This information should be linked to established performance metrics.
The contracts may be tied to attainment of performance metrics.
Next Steps and Responsibility: With the support of the City’s bike share working group, the
interim Board of Directors and the Executive Director should write separate requests for
proposals (RFPs) for the vendor and operator contracts. Reviewing, interviewing, and negotiating
the contracts will be the responsibility of the interim Board and Executive Director.
NEW ORLEANS BIKE SHARE FEASIBILITY STUDY AND BUSINESS PLAN | FINAL REPORT
Regional Planning Commission for Jefferson, Orleans, Plaquemines, St. Bernard, St. Tammany and Tangipahoa Parishes | City of New Orleans | State Project #H.972035 | 8-6
SUPPORTING STRATEGIES
In addition to the immediate actions, the non-profit should begin work on implementing supportive strategies that will ensure ridership potential is met and system goals/objectives are addressed. These strategies will help capture lasting value and broad excitement for the program. Once the Executive Director has been hired, he/she will serve as the face of the organization and will lead all remaining implementation activities with the support of the Board. The following actions should be undertaken after the Executive Director has been hired.
Fundraising
Perhaps the most pressing action to be pursued after the hiring of the Executive Director is
identifying and securing capital funding. Capital funding will likely come from a diverse set of
sources including public grants, foundation grants, sponsorship, and private gifts/contributions,
among others. See the funding and revenue section in Chapter 7 for more information.
Next Steps and Responsibility: Capital fundraising is the Executive Director’s primary role.
While he/she could garner fundraising support from the contracted vendor/operator and other
champions, this is a core responsibility of the Executive Director as it not only secures funds for
implementation, but also develops relationships with potential funders and vocal supports with
political sway.
Design and implement initial kiosk/hub location planning and siting process (work with DPW, CPC, HDLC and the VCC)
Station siting and outreach to local communities and property owners represents one of the most
time intensive elements of the bike share implementation process. The Executive Director should
work with the City-led bike share working group to begin design and permitting of stations. The
Executive Director should work hand-in-hand with the DPW, CPC, HDLC and VCC to ensure the
concerns of historic district residents are addressed.
In addition to these tasks, the planning work should identify potential impacts including parking
loss, sidewalk furniture zone needs, and coordination with bike infrastructure. The technical team
would need to include specialists in business engagement and education.
Next Steps and Responsibility: The City of New Orleans should coordinate with the
administrative non-profit. A scope of work for the station planning and design should be
developed early in 2015. Contracting this work through the bike share non-profit or the fiscal host
should allow a relatively quick selection process relative to a public agency-led process.
Reduce parking requirements for developers that purchase bike share stations and fund operations
The City of New Orleans should establish a zoning mechanism that reduces parking requirement
for developers that purchase a bike share station and cover annual operating funds for that
station. This must be considered for the Comprehensive Zoning Ordinance due for completion by
October 2014. Requiring the station to be sited at the development site will give tenants
additional transportation options and reduce parking demand at the site. A guaranteed
contribution to the annual operating fund may be tied to a penalty fee held in trust.

NEW ORLEANS BIKE SHARE FEASIBILITY STUDY AND BUSINESS PLAN | FINAL REPORT
Regional Planning Commission for Jefferson, Orleans, Plaquemines, St. Bernard, St. Tammany and Tangipahoa Parishes | City of New Orleans | State Project #H.972035 | 8-7
Next Steps and Responsibility: City of New Orleans staff should probe land developers to
assess the potential impact of the code change. With public and private support, the City should
update the City zoning code to include the parking requirement reduction.
Establish a convention attendee pass program
The non-profit should work with the Convention and Visitors Bureau (CVB) and New Orleans
Convention Center to develop a convention attendee sponsorship. Through a pass program for
convention attendees the CVB purchases a bulk number of daily or multi-day passes for
convention attendees to offer as a convention perk. This cost can be tied to the convention
attendance cost and will provide a unique experience for attendees and revenue support for bike
share.
Next Steps and Responsibility: The non-profit and the CVB need to negotiate a rate based on
the number of passes purchased in bulk and the expected utilization of the passes by attendees.
This price should be renegotiated as real data is collected about the utilization rate.
Establish shared mobility hubs at transit centers and in peripheral neighborhoods
Bike share should be viewed not as a standalone mode, but as part of a broader suite of mobility
options. To that end, the City should develop a network of integrated mobility hubs equipped with
bike share, transit, and car share facilities. Mobility hubs should be sited in transit rich centers,
but also in peripheral neighborhoods that have gaps in transit service.
Next Steps and Responsibility: Coordination between the non-profit, RTA, and the City of
New Orleans should identify mobility hub locations and study origin-destinations pairs for people
living in peripheral neighborhoods. By studying where access improvements are needed, it will be
possible to expand the reach of public transportation system, support bike share, and fill in
current transit service gaps.
Develop a pre-implementation promotional demonstration in 2016
Many city festivals exhibit notorious congestion on streets surrounding the event venue and
parking areas. The non-profit and the systems vendor/operator should use a major event in April
of 2016 as an opportunity to demonstrate the value of bike share. By providing bike share
facilities to facilitate connections between hotels, retail areas, and dense residential
neighborhoods to the festival venue site, the non-profit can begin to establish the need for bike
share from an event congestion mitigation standpoint. Jazzfest is not recommended as a
demonstration project because demand would overwhelm resources and possibly create a
negative experience for users waiting for bikes.
Next Steps and Responsibility: Beginning in Spring 2015, non-profit staff and the selected
vendor and operator should coordinate with event organizers to implement a weeklong
demonstration project in Spring of 2016 with supporting marketing materials and staff.
Identify a highly visible, generally respected public icon as an “Active Living” spokesperson for the system
During the stakeholder Idea Sessions, it became clear that public perception of bike share and
bicycling in general could be positively influenced if a high-profile figure promoted bike share and

NEW ORLEANS BIKE SHARE FEASIBILITY STUDY AND BUSINESS PLAN | FINAL REPORT
Regional Planning Commission for Jefferson, Orleans, Plaquemines, St. Bernard, St. Tammany and Tangipahoa Parishes | City of New Orleans | State Project #H.972035 | 8-8
active living. Public icons could include sporting figures or other institutional mainstays in New
Orleans.
Next Steps and Responsibility: City Hall and friends of the bike share non-profit should
leverage their contacts and relationships with high-profile public figures to establish a public
figure to begin promoting bike share and active transportation.
Integrate fare media
A key outcome of the stakeholder engagement effort was broad interest in consolidating and
integrating fare media between RTA bus, streetcar, ferry, and bike share service. The vision is that
public transportation customers can seamlessly navigate all options in the system –from ferry to
streetcar to bike share –using one fare media.
Next Steps and Responsibility: Fare media integration is a major undertaking that needs to
begin early in the bike share implementation process. The non-profit and the contracted bike
share vendor/operator should coordinate with RTA to integrate bike share, bus, rail and other
fares into a single fare media (e.g., card, key fob, smart phone, or other). The RTA is currently
studying new fare media and bike share fare integration options. The bike share non-profit should
specify in the equipment vendor RFP that bidders must demonstrate the ability of their hardware
and software platforms to accommodate integrated fare media considered by RTA.
Extend bicycle infrastructure
Although the City of New Orleans has expanded the bicycle network in recent years, the Phase 1
and much of the Phase 2 service area is not well connected by bikeways. Providing a well-
connected network of safe and comfortable bikeways in New Orleans is important to enable more
casual, occasional riders and lay the groundwork for long-term ridership. Current gaps in the
bikeway network need to be removed to establish continuous connectivity from upriver to
downriver and from the River to the Lake. The wealth of fine grain connections afforded by the
neighborhood streets are an opportunity to create continuous low-stress bicycle priority
connections throughout the city (i.e., bike boulevards).
Idea Session participants also identified a citywide bicycle wayfinding system as a key low,
hanging fruit investment.
Next Steps and Responsibility: Both prior to and after bike share is launched, the City of New
Orleans should focus investment in bikeway implementation and a network of wayfinding signs.
Develop an Education, Safety and Awareness Campaign
An oft repeated message voiced by community stakeholders is that New Orleans has a strong car
culture and the needs of people on bicycles are not generally understand by the broader public. A
robust education and awareness campaign supported by the City in partnership with key
stakeholders such as RPC, RTA, Ride New Orleans, and Bike Easy should work to change this
perception and support new riders.
Next Steps and Responsibility: In addition to bikeway implementation (see recommendation
above), the initial bike share launch needs to be supported by a visible and effective awareness
campaign that educates people about bike share’s benefits, how to drive in the presence of cyclists
and how to ride a bicycle in urban environments. There needs to be a coordinated strategy of

NEW ORLEANS BIKE SHARE FEASIBILITY STUDY AND BUSINESS PLAN | FINAL REPORT
Regional Planning Commission for Jefferson, Orleans, Plaquemines, St. Bernard, St. Tammany and Tangipahoa Parishes | City of New Orleans | State Project #H.972035 | 8-9
infrastructure improvements, education, marketing, and enforcement. This could be coupled with
helmet sponsorships, or programs that provide discounted or free helmets.
Promotion, Access and Use of Bike Share among Lower Income and Minority Residents
Bike share is public transportation; in New Orleans, the bike share network will promote access
and use by the whole community. In the wake of Hurricane Katrina transit service was decimated
and service is slowly recovering. Bike share fills an important void for users of public
transportation, closing gaps in service and providing mobility and access for residents. The
promotion, access, and use of bike share by lower income and minority residents is a high priority
for the City and should be developed even before the non-profit is established. Messaging,
information about bike share, and demonstrations that illustrate bike share’s role as public
transportation will bolster use amongst lower income and minority residents.
Next Steps and Responsibility: Develop and implement an equity action plan. The call out
box on the following pages provides background information and framing strategies that will help
the non-profit and the City achieve its goals for meaningful, targeted, and equitable access to bike
share.
NEW ORLEANS’ PRELIMINARY EQUITY STRATEGY FOR BIKE SHARE
Bicycling Minorities
Much research has been done of late on bicycle utilization generally among various demographic
groups. Young men, overall, make up the largest portion of casual or frequent cyclists. White men
comprise a large portion of this block. Women represent a much smaller proportion, although
their numbers are growing, particularly in cycling for utilitarian purposes (commute to work or to
accomplish errands).People of color make up a smaller portion of the cycling community than
they do the extant population as a whole.
Barriers to cycling for low income, female and/or minority residents are real. The fatality rate for
bicyclists is 23% higher for Hispanics and 30% higher for African Americans than it is for white
residents. Lynn Weigand, PhD, former Director of the Initiative for Bicycle and Pedestrian
Innovation at Portland State University, conducted a number of interviews with members of the
African American, Hispanic and African immigrant communities in Portland, OR. Her research
found that among Hispanics some of the significant barriers to cycling included the cost of
procuring a bicycle, the inability to ride safety with their children, no safe place to store bicycles if
they had one and a general lack of safety in their communities (in each instance over 60% of
respondents identifying these concerns.) Among African Americans the dominant obstacle was a
concern about driver hostility toward them with a full 100% of interviewees identifying this
concern. Other barriers often identified for these demographic groups is a desire to travel in a
group or with friends and a lack of a “bicycling culture” or a number of bicyclists of color
representing these groups. Despite this, over one quarter of people of color indicated they would
like to ride more but were worried about safety.
Women are also under represented in the bicycling population as compared to the general
population. Women make up only approximately 27% of bicycling trips made although they
comprise 51% of the population. Women are often referred to as the “indicator species” for

NEW ORLEANS BIKE SHARE FEASIBILITY STUDY AND BUSINESS PLAN | FINAL REPORT
Regional Planning Commission for Jefferson, Orleans, Plaquemines, St. Bernard, St. Tammany and Tangipahoa Parishes | City of New Orleans | State Project #H.972035 | 8-10
inviting bicycling conditions as women tend to be more risk averse in their cycling habits and will
only brave cycling on streets if they feel well protected and generally safe in (or from) traffic.
Cities have made extensive investments in bicycling facilities in recent years and, as a result, have
seen a marked improvement in bicycling rates among women.
Income has also frequently been identified as a barrier to bicycling as well. Research, however,
has failed to find a strong correlation between income and low bicycling rates. In fact, many low
income workers have found that bicycling – with an average annual cost of $308 per year – is a
much more affordable and reliable transportation option compared to an average of $8,220 to
own and operate an automobile. Transportation costs can be dauntingly high for low income
workers. Transportation costs for households earning less than $25,000 per year can consume
40% of their income, exceeding even the cost of housing.
The New Orleans Context
New Orleans is a “majority minority” city. Nearly 60 percent of city residents identify as African
American and 69 percent overall identify as people of color. It is also a relatively young city with
an average age of 34.6 compared to a state median age of 38.5 years and a national average of
37.2 years.
It is a city that struggles with comparatively low incomes and high poverty rates. Although
educational attainment levels rose from 2000 to 2010, incomes fell. The 2012 median household
income for New Orleans was $34,361 compared to the metro average of $44,379 and the national
median of $51,371. Poverty rates have remained relatively static from 1999 to 2012 at roughly 29
percent -- well above the national poverty rate of 16 percent. African American households made
up the largest share of households in poverty. 36 percent of renters in Orleans Parish are
classified as “severely cost-burdened” – meaning that household costs exceed 50 percent of their
household incomes – reflecting a dramatic rise in housing costs since 2000.
Although the unemployment rate in New Orleans roughly reflect the national unemployment
picture (roughly 8.8% in 2012), unemployment is particularly acute among working age (16 to 64
years old) African American men in the city. According to a 2013 report, unemployment among
this group, although typically disproportionately high in the city, has increased from 37% in 1980
to 52% in 2011 (compared to 25 percent unemployment rates for working age white males).
Although educational attainment and changes in the make up of local industry are the most
significant factors in this unequal employment landscape, access to reliable and affordable
transportation may also play a role.
Access to employment also challenges some residents of New Orleans. Household access to an
automobile improved markedly over the decade decreasing from 27 percent without such access
in 2000 to 19 percent in 2012. 10 percent of working households in New Orleans lack access to a
vehicle.
In terms of financial resources, 37 percent of New Orleans households are “asset poor” – meaning
they have insufficient resources to support themselves at the poverty line for a period of three
months should they lose their income. Nearly one quarter live in extreme asset poverty. Over 70
percent of New Orleans residents, compared to 57 percent nationally, have subprime credit scores
challenging their access to credit. 21 percent of New Orleans’ non-elderly population lacks health
insurance compared to 18 percent nationally.

NEW ORLEANS BIKE SHARE FEASIBILITY STUDY AND BUSINESS PLAN | FINAL REPORT
Regional Planning Commission for Jefferson, Orleans, Plaquemines, St. Bernard, St. Tammany and Tangipahoa Parishes | City of New Orleans | State Project #H.972035 | 8-11
Bike Share and Equity
Many bike share programs across the country have taken steps to ensure equitable access to the
system and services; however utilization of bike share among low income and minority residents
appears to lag far behind their proportional numbers in the population at large.
Bike share itself addresses some of the obstacles to bicycling identified by would-be bicyclists of
color. Bike share is generally low cost and removes the financial burden of owning a bicycle.
Bicycles are maintained by the system alleviating maintenance and vehicle reliability concerns.
And bike share provides a safe and secure location for bicycle parking and storage.
Bike share often does not, however, passively address other concerns raised by women and people
of color. Although bike share bicycles are among the safest and sturdiest on the road, bike share
systems generally are not responsible for establishing bicycle facilities such as bike lanes, trails or
protected cycle tracks. Bike share systems may include sensitivity campaigns for drivers to
improve their awareness of and response to cyclists, however most education is directed at the
bike share user rather than drivers. Bike share is generally not designed for use by children and
therefore does not well-address desires or needs for family bicycling.
Many traditional practices or aspects of bike share systems may also inadvertently challenge use
and access by low income or minority residents.
Station locations: To be financially viable, bike share stations must be productive – meaning
they must have a high rate of utilization. This generally occurs in high activity and high density
areas which tend to also be high income areas. The experience of several systems who have
located stations in lower income and/or less dense areas is that these stations, although necessary
and desired, have relatively low utilization rates and low productivity. Necessarily, the majority
and higher concentration of stations are typically located in higher productivity areas.
Membership costs: Although bike share membership is relatively inexpensive (typically $50 to
$85 per year) compared to other annual transportation costs, a lump sum payment of this
amount can be too great for many low income workers or travelers to afford. Many systems have
offered alternative membership arrangements to circumvent this obstacle including installment
payments, free or dramatically reduced cost memberships.
Membership requirements: Many systems have been challenged in finding work arounds for
other membership requirements – principally the need to securitize bicycle usage. Early systems
required a credit hold to borrow a bicycle – thus requiring sufficient credit or personal account
resources to provide. Increasingly systems have eliminated this credit hold, but most still require
some access to a user’s financial profile or accounts. Many still require even low income users to
bear the cost of bicycle replacement in the event of loss or theft. Some have found third-party
partners to cover bicycle replacement risk, however even in these instances users must provide
sufficient financial deposits to cover any use overages (when the user exceeds the allowed “free”
period of bicycle use). Because many low income residents lack access to credit, debit or sufficient
stored value card accounts, this can present a significant obstacle.
Web-based system information: Most systems provide users with real-time information on
the system – which stations/hubs have bicycles and docks available and which do not. This
information is primarily accessed through smart phone apps, although is also available online
through traditional webpages. While this is a great convenience to smartphone users with on the
go data plans and internet access, it provides little benefit to those who rely primarily on text

NEW ORLEANS BIKE SHARE FEASIBILITY STUDY AND BUSINESS PLAN | FINAL REPORT
Regional Planning Commission for Jefferson, Orleans, Plaquemines, St. Bernard, St. Tammany and Tangipahoa Parishes | City of New Orleans | State Project #H.972035 | 8-12
(MSM) communication. This is common among lower income and immigrant residents as texting
plans are much more affordable than data plans and meet their communication needs.
Recommended Bike Share Equity Strategy for New Orleans
New Orleans must take specific and diligent action to provide equitable access to the bike share
system and encourage representative use. These actions will steer New Orleans away from the
symbolic initiatives that are traditionally established in bike share programs toward more
targeted and effective equity programs. The following strategies are recommended:
Messengers matter. The city should engage in partnerships with existing groups that are
known and trusted among the low income and African American communities of the city. There is
often a high degree of distrust between minority communities and government programs or new
nonprofit initiatives. Partnering with known groups such as public housing resident associations,
health workers, school support networks, and others may help to penetrate these communities in
order to provide information about the system, mitigate suspicion or distrust, and bring
information back to system planners and operators about unique obstacles and potential
solutions. This outreach should begin as soon as possible to both inform system development and
reduce, to the extent possible, early perceptions that the system is only for use by higher income,
tourist or white constituencies. If a board of advisors is formed for the system, a fair share of its
members should be representatives from these target groups.
Membership media integration. Most, but not all, bike share systems include a unique card
or fob for accessing the bicycle system. In order to increase utilization and ready access by low
income and minority residents it is strongly advisable to seek out ways to utilize media these
population groups may already possess. Low income and minority groups may be suspicious of
providing personal identification information to a new system. By linking this system to existing
programs for which they have already registered and provided such information, it removes
another barrier. Systems to consider may include transit passes, library cards, parks or recreation
program IDs, or WIC, food stamp or unemployment benefit stored value cards. It may be
beneficial to solicit bike share operators to provide a system that does not require a unique card
or fob at all but rather utilizes PIN codes or access numbers that can be texted to users at their
request.
Extended usage periods. Demographic analysis of New Orleans indicates that many low
income residents and un- or under-employed residents live a fair distance away from the major
employment centers. In order to accommodate the use of the bike share system for access to
employment and access to amenities (which also may be a good distance away from low income
residences) the free grace period of bicycle utilization should be extended up to one-hour for
annual members compared to 30 minutes for daily users. Escalation rates for usage beyond the
grace period should also be reduced for registered low-income members in order to enable them
to satisfy other travel needs (e.g. multi-stop shopping, errands or other non-commute trips).
Cash payments. Many low income residents function strictly in a cash economy. These
potential users must be provided for options to “pay as you go” and to pay with cash. It is
theoretically possible for bike share kiosks to accept cash payment before providing an access
code for bicycle utilization; however this may lead to vandalism of kiosks. It is instead
recommended that New Orleans explore opportunities to enable payment at certain retail outlets
(for instance chain pharmacies or grocery stores, post offices, lottery sales stations, etc.); and/or

NEW ORLEANS BIKE SHARE FEASIBILITY STUDY AND BUSINESS PLAN | FINAL REPORT
Regional Planning Commission for Jefferson, Orleans, Plaquemines, St. Bernard, St. Tammany and Tangipahoa Parishes | City of New Orleans | State Project #H.972035 | 8-13
with partner banks through their ATM network. Users would provide the necessary fee in
exchange for an access code for bicycle use.
Utilize MSM networks. As stated above, the “digital divide” has changed somewhat in form.
Although a larger proportion of the population has access to cell phones, not all have access to
unlimited data plans thus limiting the convenience of real time knowledge of bike share assets
and availability. New Orleans should challenge bike share providers to provide a text based
system to provide necessary information through MSM in addition to web-based apps.
Eliminate “holds”. Bicycle loss or theft is typically very low in bike share programs around the
country. This fact has enabled most bike share programs to eliminate the necessity to place
financial holds on annual members, and frequently on daily members as well.
Reduced cost membership. As other systems have done, New Orleans should offer
dramatically reduced cost memberships to qualified low income members.
Identify partners to securitize bicycles. Despite being low, bike share operators still
generally require some means to recoup costs in the unlikely event that a bicycle is lost or stolen.
This generally means that, although they do not place “holds” on financial resources, users must
demonstrate enough financial capacity to cover the cost of a lost asset. This potential debt would
be devastating for many low income households should the unlikely ever come to pass. To
eliminate this personal risk, New Orleans should seek partnership with some entity to provide
this securitization. Local Community Development Financial Institutions, foundations, or other
parties focused on poverty alleviation and access to jobs may be willing to provide security for
bicycle use and possible overage charges. This partnership could be vital to providing access to the
system.
Partner with health programs. Obesity and diabetes are significant concerns throughout
New Orleans but are particularly acute in the low income and minority communities. The system
should work in partnership with programs providing services, education and outreach to these
communities to promote bike share utilization not only for travel to work, but for physical fitness.
Given the benefits of improved physical fitness on decreasing health cost burdens, the city and
health providers should consider providing monetary benefits to program participants who log
miles onto the bike share bicycles to improve their physical health. These credits could help to
offset membership or usage fees.
System rebalancing credits. System rebalancing is a significant cost in any bike share system.
Imbalanced systems result in high levels of user dissatisfaction and lost revenues. New Orleans
should challenge system operators to propose a system to provide usage credits to members who
assist in rebalancing the system – bringing bicycles from full or nearly full stations to empty or
nearly empty stations.
Community and Business Fare Vending. Develop a program where users can purchase
memberships and daily passes at qualifying vendor locations. This could include community
organizations, markets, and other retail locations that might want to drive traffic into their
storefront. This would require basic infrastructure like payment apps and tablets. This type of
program would also require annual pre-registration to tie users to a user account.
Station location. A prerequisite of any system in New Orleans is that stations be accessible not
only in the high activity areas of the city, but also in lower income and less transit rich areas of the
city to provide supplemental transportation services to these communities. Opportunities to
extend physical access to the bike share network include equity purchasing. Developing an

NEW ORLEANS BIKE SHARE FEASIBILITY STUDY AND BUSINESS PLAN | FINAL REPORT
Regional Planning Commission for Jefferson, Orleans, Plaquemines, St. Bernard, St. Tammany and Tangipahoa Parishes | City of New Orleans | State Project #H.972035 | 8-14
“equity purchase” funding mechanism that either requires station sponsors to pay a nominal
incremental fee for permitting that could go into a equity station capital fund requiring dual hub
location purchase for developers, business owners, or other interested station purchasers in areas
with the highest demand for bike share use. This mechanism would ensure new lower
cost/capacity hub locations (possibly without kiosks or map panels) are located in areas that are
not currently served by bike share.
Short-term neighborhood bike loan program. Access to a bicycle is the single greatest
barrier to minorities’ use of bicycles. The non-profit should partner with local organizations in
targeted neighborhoods to offer participants a bicycle for up to four months. This program will
help orient low- income individuals to bicycling, eliminating this basic barrier to entry.
Participants will also learn how to access the bike share program and ascertain bike skills. This
should be stipulated as part of the vendor/operator RFP. This type of program is being launched
in Minneapolis and St. Paul in August 2014.
Develop bike share partnership with the City of Philadelphia—an emerging leader in
bike share equity. The non-profit should leverage Mayor Mitch Landrieu’s relationship with
Philadelphia’s executive staff to engage in best practice exchange.

NEW ORLEANS BIKE SHARE FEASIBILITY STUDY AND BUSINESS PLAN | FINAL REPORT
Regional Planning Commission for Jefferson, Orleans, Plaquemines, St. Bernard, St. Tammany and Tangipahoa Parishes | City of New Orleans | State Project #H.972035 | 8-15
IMPLEMENTATION TIMELINE
Based on the ability of the City to create non-profit corporations and initial funding opportunities
from RPC and private companies, an 18- to 24-month implementation timeline is achievable. The
timeline displayed below communicates a select number of critical implementation activities by
month. Additional details related to specific launch activities (website development, hiring, smart
phone app development, etc.) will be developed by the non-profit’s Executive Director, staff, and
Board of Directors.
Figure 46 Bike share implementation timeline for New Orleans
Month 1-6
Immediate action phase activities
Month 7-10 activities
Pre-vendor selection activities
Month 11-24
Pre-deployment activities
Track performance and
experience of emerging hub-
based, smart bike systems in
North America
Develop a multi-agency bike
share working group
Establish non-profit
Establish an interim Board of
Directors
Identify and retain resources to
support non-profit development
Develop and begin implementing
communications, media, and
community outreach strategy
Identify one or more interim lead
fundraisers and secure seed
funding
Hire Executive Director
Finalize the non-profit’s Board
of Directors
Brand and name system
(public, grassroots process)
Capital Fundraising
Plan and design hub location
planning and design (could
also happen after vendor /
operator is selected)
Begin permitting/use
agreement process with DPW,
CPC, HDLC and VCC
Establish vendor selection
committee
Begin hiring key support staff
Develop and issue separate
RFP for equipment and
operations
Select vendor/operator
Continue securing capital
and operating funding
Deliver a promotional
demonstration project during
April 2016
Refine the business plan
based on secured funding
Launch system (Spring or
Summer of 2016)