new mexico climate-memo - ose.state.nm.us 1633-1653, 1720-1725, 1764-1772, 1790-1800, 1830-1841,...
TRANSCRIPT

The Randolph Center, 1877 Broadway, Suite 703, Boulder, Colorado 80302-5245 ; Tel: 303-939-8880 ; Fax: 303-939-8877 http://www.sspa.com ; email: [email protected]
e S. S. PAPADOPULOS & ASSOCIATES, INC.Environmental & Water-Resource Consultants
Memorandum Date: November 8, 2001 From: Karen Lewis and Debbie Hathaway, SSP&A To: Mike Velasquez, ACOE Kevin Flanigan, NMISC Subject: Analysis of paleo-climate and climate-forcing information for New Mexico and
implications for modeling in the Middle Rio Grande Water Supply Study This memo includes: 1. A summary of how representative the past 50 years of climate is in relation to the longer (up to
2000 year) record. 2. A summary of climate forcing (El Niño-Southern Oscillation and the Pacific Decadal
Oscillation) in New Mexico. 3. Implications for phase 3 of the Middle Rio Grande Water Supply Study 1 New Mexico/Middle Rio Grande climate: 1950-2000 in relation to the long-term record 1.1 Summary
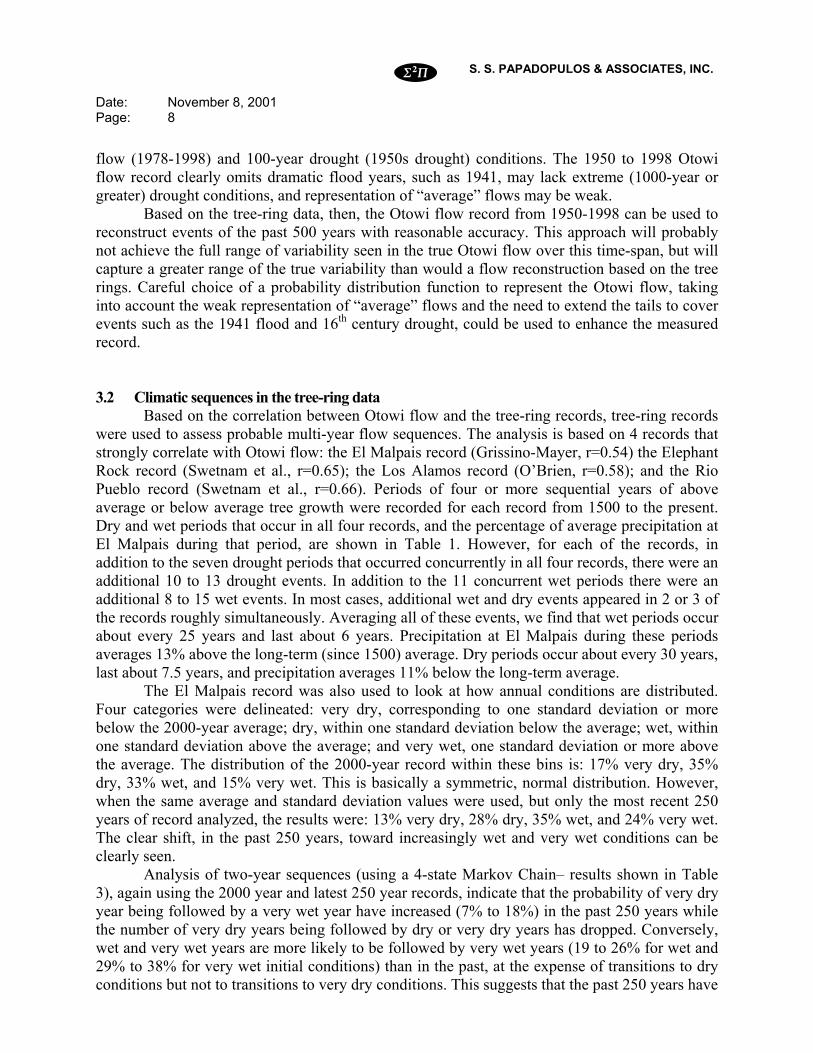
The amount and duration of above-normal rainfall during the most recent 200 years has exceeded any since the seventh century (Grissino-Mayer, 1996), and appears to have been steadily increasing since the early 1700s (Figure 1).
The 1950s drought is comparable to most of the extreme droughts of the past 1000 years. However, it is exceeded in both length and depth (i.e. extent of dryness, as measured by magnitude of the reconstructed precipitation) by a mega-drought at the end of the 16th century. This drought was both longer than that of the 1950s, lasting for 21 years, and drier. It also occurred at the end of 200 years of predominantly dry weather, unlike the 1950s drought that followed one of the wettest hundred years on record.
Regional droughts comparable to the 1950s drought in length and depth occur about once a century. Over the past 500 years, droughts comparable to the 1950s drought include: 1573-1593, 1663-1677, 1727-43, 1748-1759, 1773-83, and 1899-1904 (Table 1) (Grissino-Mayer, 1996; Scurlock and Johnson, 2001; D’Arrigo and Jacoby, 1991; Rose et al., 1981; Ackerly, 1999; Wilson, 1999; Swetnam et al., data; O’Brien, data).
Extended periods of regional above average rainfall occur on average twice a century, for shorter periods of time and with less extreme magnitude than the regional droughts. Over the past 500 years, extended periods of above average rainfall have occurred between 1507-1515, 1608-1615, 1633-1653, 1720-1725, 1764-1772, 1790-1800, 1830-1841, 1852-1870, 1882-1889, 1905-1933, and 1978-1992. Of these, the post-1978 period is by far the wettest (Table 1).
Date: November 8, 2001 Page: 2
e S. S. PAPADOPULOS & ASSOCIATES, INC.
1.2 Tree ring reconstructions of past climate Several paleo-climate and paleo-hydrology studies have been done in New Mexico, including
tree-ring reconstructions of precipitation and drought indices. (Variations in tree ring widths at New Mexico sites are frequently strongly correlated with precipitation records and can be used to reconstruct past precipitation.) They include:
• Henry Grissino-Mayer – 2000-year reconstruction of annual precipitation for northwestern New Mexico (climate division 4) based on tree rings from El Malpais National Monument.
• Henry Grissino-Mayer – 1370-year reconstruction of annual precipitation for the Southern Rio Grande in New Mexico based on tree-ring records from the Magdalena, San Mateo, and Organ Mountains.
• Ni et al. – 1000-year reconstruction of cool-season precipitation for each of the Arizona and New Mexico climate divisions based on tree-ring records from the southwestern United States (New Mexico, Arizona, southern Colorado, southern Utah, east-central California, and southern Oregon).
• D’Arrigo and Jacoby – 1000-year reconstruction of winter precipitation for northwestern New Mexico using tree-ring records from northwestern New Mexico and southern Colorado.
• Cook et al. – spatially distributed drought reconstructions (Palmer Drought Severity Index) for the contiguous United States from 1770-1978 using tree-ring records.
• Ackerly – reconstruction of Rio Grande flow at San Marcial using the best-fit tree-ring series of 20.
• Scurlock and Johnson – 500-year reconstruction of Rio Grande hydrologic history using pueblo and fort records, historical references, archeology, and tree ring data.
• Rose et al. – 1000-yr reconstruction of annual precipitation for Arroyo Hondo in north-central New Mexico using tree-ring data.
• Wilson – presentation of 1000-yr streamflow reconstruction for Rio Pueblo de Taos in north-central New Mexico. With the exception of the El Malpais and Arroyo Hondo tree ring studies, information
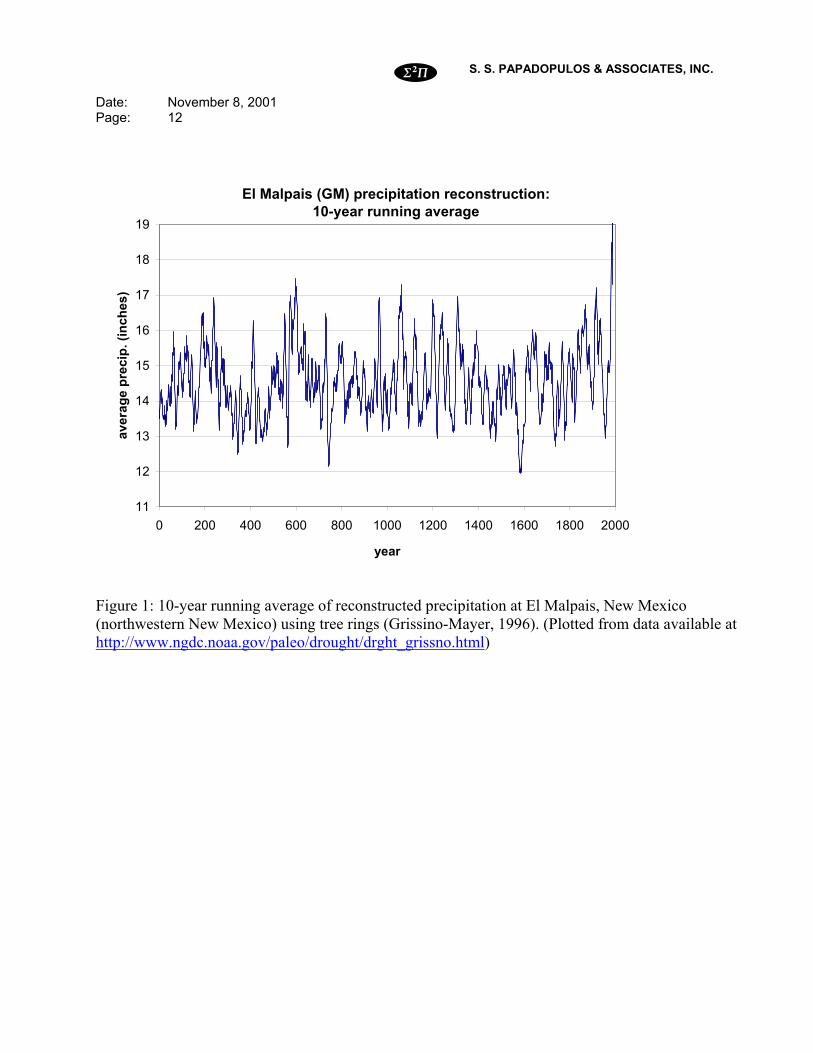
from the above precipitation and drought reconstructions is limited to analysis presented by the author(s) and visual analysis of the data graphs. These records were used to qualitatively identify decadal-scale droughts and wet periods. All of the records examined reproduce the longer-term variability seen in the Otowi index flow since 1919 (the beginning of the continuous record at Otowi Bridge), in particular capturing the 1950s drought and the post-1978 wet period. Timing for these events is similar in all records, thought event onset and secession may vary by a few years. However, the records fail to match the full magnitude of some of the individual outlier events in the Otowi flow, such as the 1941 flood (Figure 2). This general agreement in longer-term trends suggests that the tree ring data can be used as a proxy for multi-year Middle Rio Grande flow, though it should not be used to predict annual flows. (Quantitative evidence that tree-rings serve as a good proxy for the Otowi index flow is given in section 1.3.)
All the records indicate severe droughts occurring around 1573-1593, 1663-1677, 1727-43, 1748-1759, 1773-83, 1899-1904, and 1950-64 and extended periods of above average precipitation between 1507-1515, 1608-1615, 1633-1653, 1720-1725, 1764-1772, 1790-1800, 1830-1841, 1852-1870, 1882-1889, 1905-1933, and 1978-1992.
The most extreme drought of the past 1000 years is that of the late 16th century (Figure 1) (Grissino-Mayer, 1996; Ni et al., in review; Ackerly, 1999; Stahle et al., 2000). The archeological record further supports the severity of this drought, as well as a similarly extended
Date: November 8, 2001 Page: 3
e S. S. PAPADOPULOS & ASSOCIATES, INC.
drought during the late 13th century. Both the 13th and 16th century droughts correlate with known abandonment of pueblos and cultural shifts by the Native Americans living in the region (Scurlock and Johnson, 2001).
Table 1 shows the drought and wet periods of the past 500 years and the percentage of the long-term (1500-1992) average precipitation received at El Malpais during those periods. At El Malpais, during the 1950s drought precipitation was 90% of the long-term average for a period of 15 years. This is comparable, in length and dryness, to the droughts of 1663-1677, 1727-43, 1748-1759, 1773-83 and 1899-1904. During the late 16th century drought precipitation was 82% of the long-term average for a period of 21 years. It appears that the Otowi flow record does not include conditions representative of this mega-drought.
The most extreme period of high moisture over the past 1000 years has been post-1978 (Figure 1). More rainfall occurred between 1978 and 1992 than in any other 15-year period between AD 1000-1992 (Grissino-Mayer at al., 1997). Average precipitation from 1978-1992 at El Malpais is 123% of the long-term average (Table 1). Longer-term trends indicate that the amount and duration of above-normal rainfall during the most recent 200 years has exceeded any since the seventh century (Grissino-Mayer, 1996), and appears to have been steadily increasing since the early 1700s. Precipitation at El Malpais between 1900-1992, which incorporates the 1950s drought, exceeds the long-term average by 5%.
Based on these precipitation reconstructions, it appears that the past 50 years of record encompasses periods representative of both extreme drought and the greatest moisture abundance on record. However, the past 50 years of record may not capture the conditions of the 16th century mega-drought, nor is it strongly representative of average moisture conditions. Precipitation between 1950-1992 was 5% above the long-term (1500-1992) average, in spite of including the 1950s drought, and precipitation since the drought (1964-1992) has been 14% above the long-term average. In hydrologic terms, over the past 50 years New Mexico has experienced both feast and famine, but little in between.
However, it should be noted that average precipitation over the contiguous United States has increased by about 10% since 1910 (Gleick, 2000), possibly as a result of human induced climate change. The conclusion of those studying the hydrologic impact of climate change is that “water managers should begin a systematic reexamination of engineering design, operating rules, contingency plans and water allocation policies under a wider range of climatic conditions and extremes than has been traditionally used. For example, the standard engineering practice of designing for the worst case in the historical observational record may no longer be adequate” (Gleick, 2000).
1.3 Quantitative correlation between tree-ring data and the measured Otowi index flow
The paleo-climate and paleo-hydrology studies reviewed for this work are peer reviewed, generally based on multiple tree-ring records, and carefully analyzed for hydrologic correlations and therefore can be taken as strong hydrologic proxies with little extra analysis. However, the El Malpais and Arroyo Hondo studies are the only two for which the data are available. In the absence of the annual data that goes into them, the studies cannot be quantitatively correlated with the Otowi index flow. Since a multi-record correlation is preferable to only correlating flow to the El Malpais and Arroyo Hondo data, several tree-ring indices were chosen from the World Data Center for Paleoclimatology on-line database of tree ring records. Six records, using Douglas fir and Ponderosa pine (both of which are likely to have a moisture signal), were chosen at random from records located along the Upper Rio Grande basin in New Mexico.
Date: November 8, 2001 Page: 4
e S. S. PAPADOPULOS & ASSOCIATES, INC.
The records chosen were: Burned Mountain (Swetnam, Harlan and Sutherland), Elephant Rock (Swetnam, Caprio and Lynch), Los Alamos (O’Brien), Osha Mountain (Swetnam, Harlan and Sutherland), Rio Pueblo (Swetnam, Caprio and Lynch), and Sandia Crest (Briffa and Schweingruber). All six of these records were correlated with the Otowi index flow from 1919 to the end of the tree-ring record (1969 to 1987 depending on the record). Three of the records, Elephant Rock, Los Alamos, and Rio Pueblo, showed significant correlation, as did the El Malpais precipitation reconstruction (r-values of 0.54 to 0.68). It is assumed that the Arroyo Hondo record and the remaining three tree-ring series lie in regions that do not receive the same moisture stress as the runoff basin that drives flow at Otowi bridge. (Individual records can be viewed as point measurements of precipitation, which are difficult to correlate with aerial averages such as basin runoff. This is the disadvantage of individual records, as opposed to the multi-record spatial analyses used for most of the climate reconstructions discussed in section 1.2. The Arroyo Hondo study and the reconstruction done by Ackerly are the only single-record reconstructions discussed in section 1.2.)
2 Climate forcing in New Mexico: El Niño and the Pacific Decadal Oscillation 2.1 Summary
New Mexican climate and precipitation are strongly influenced by El Niño/Southern Oscillation (ENSO) effects.
• Precipitation is frequently significantly above normal during El Niño years. • La Niña years are strongly correlated with drought years. • Extended droughts are only weakly correlated with La Niña years. Since La Niña events
rarely last more than 18 months, though an extended drought may include one or two La Niña years, extended droughts are not solely due to La Niña influence.
New Mexican climate and precipitation are strongly influenced by Pacific Decadal Oscillation (PDO) effects.
• Extended droughts are correlated with the cool (negative) phase of the PDO. • Periods of above-average precipitation are correlated with the warm (positive) phase of
the PDO.
2.2 El Niño-Southern Oscillation El Niño is the warm phase of the El Niño-Southern Oscillation (ENSO). El Niño events
occur irregularly at intervals of 2-7 years, although the average is about once every 3-4 years. They typically last 12-18 months, and are accompanied by swings in the Southern Oscillation (SO), an inter-annual seesaw in Pacific Ocean equatorial (from 4oS to 4oN) sea level pressure and sea surface temperature.
The term ENSO is used to describe the full range of variability observed in the Southern Oscillation Index, including both El Niño and La Niña events. ENSO drives weather patterns for nearly three quarters of the globe and is one of the most powerful influences on world climate--second only to the changes in weather brought by the seasons (Brownlee and Tangley, 1997).
During an El Niño the equatorial trade winds slacken and the warm surface water that is normally pushed up against the western side of the Pacific Ocean begins to slide eastward. When this happens a chain reaction follows. Weakening of the trade winds reduces the upwelling of cooler waters along the west coast of the Americas and allows warm surface waters to drift
Date: November 8, 2001 Page: 5
e S. S. PAPADOPULOS & ASSOCIATES, INC.
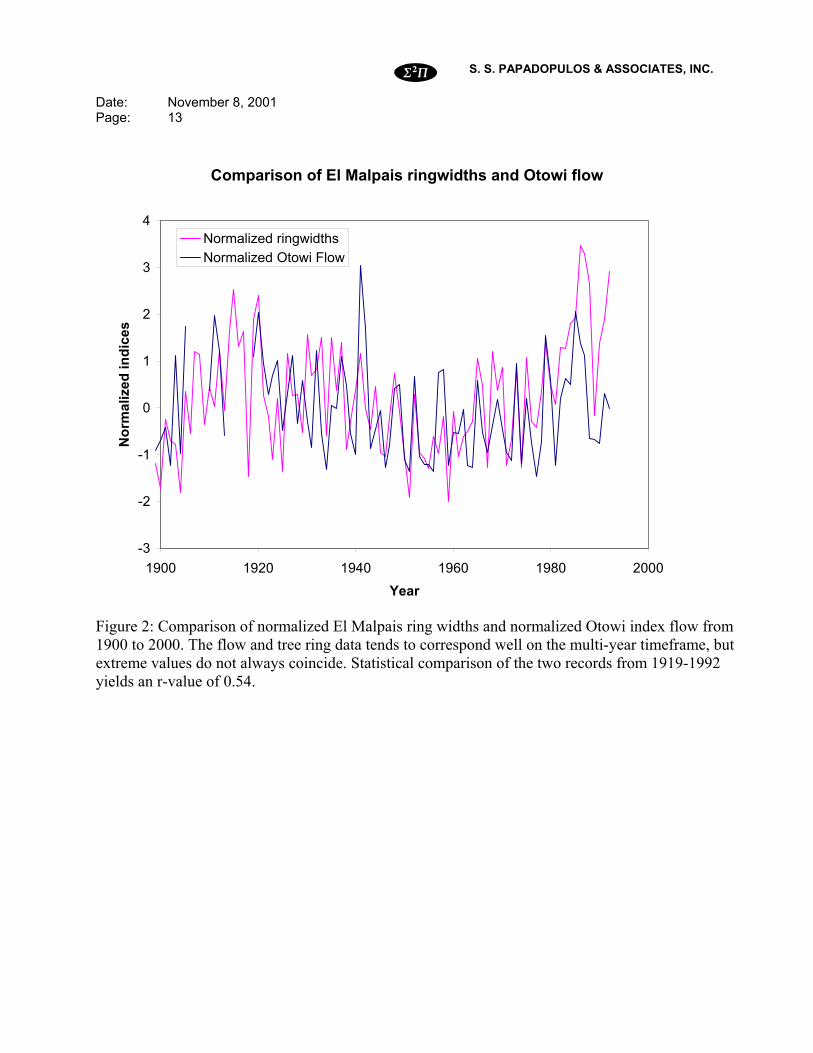
eastward (Figure 3). As the central and eastern Pacific warms, atmospheric pressure gradients along the equator weaken, and the trade winds diminish even more. At the same time, currents of warm, moist air rise from the warm water, and the rising, moisture-laden air breeds thunderstorms over the eastern Pacific (Brownlee and Tangley, 1997). During El Niño events, the jet stream over the North Pacific Ocean is invigorated and pulled farther south than normal (Figure 4), where it collects moisture and storms and carries them to the southwestern U. S. and northern Mexico (Reynolds et al., 1997).
La Niña events are the opposite. The trade winds are heightened, pushing the warm water pool in the equatorial Pacific to the west and increasing cool-water upwelling along the west coast of the Americas, leading to reduced atmospheric moisture in the eastern Pacific (Figure 3). At the same time, the jet stream over the North Pacific Ocean moves further north (Figure 4), further reducing moisture and storm advection into the southwestern US.
The shift between El Niño and La Niña events varies. Sometimes the warm El Niño events give way to unusually cold sea-surface temperatures and unusually strong trade winds typical of La Niña. On other occasions, La Niña may begin on their own, without an immediately preceding El Niño (Reynolds et al., 1997).
The strongest regional El Niño/Southern Oscillation (ENSO) signal in North America is in the southwestern U.S. and northern Mexico, where warm events (El Niño) tend to be associated with higher winter and spring precipitation. Dry springs and extensive fires are associated with cold events (La Niña) (Bradley, 1999).
The El Niño has a positive effect on winter precipitation for all of New Mexico with the largest percent increases in the central part of the state and lowest percent increase in the north portions of the state (Figure 5). La Niña cause a statewide decrease in precipitation. The biggest percentage decrease is manifested in southwestern and central New Mexico with a smaller reduction in the northern part of the state (Sevilleta LTER web site).
Both phases of ENSO also have a detectable and systematic effect on summer monsoon precipitation in New Mexico, though these effects are lower in absolute and percentage terms than those of the winter, and the different phases have different axes of influence across the state. El Niño on average causes enhanced summer precipitation in the southern part of the state and reduced summer precipitation in the northern part of the state, with the zero line running slightly south of I-40. La Niña is associated with reduced precipitation across almost all of New Mexico, with greater reduction in precipitation from east to west (Sevilleta LTER web site).
However, El Niño events do not always result in increased precipitation, nor do La Niña events always result in drought. Figure 6 shows average October-March statewide precipitation for New Mexico for 1933-1996 plotted vs. the Southern Oscillation Index (SOI). The SOI is a measure of El Niño and La Niña events. In general, the more negative the SOI, the stronger the El Niño; the more positive the SOI, the stronger the La Niña1: Values of the SOI between 0.5 and –0.5 are considered neutral. As can be seen, for New Mexico El Niño years tend to be wetter than the average and La Niña years tend to be drier than average, but very wet and dry periods 1 Both the Southern Oscillation Index and the ENSO index describe El Niño and La Niña events, but their signs are different. El Niño occurs during positive periods of the ENSO index, but during negative periods of the SO index. Both indexes are in common usage. The indices differ due to their derivation. The ENSO index is derived from sea surface temperature anomalies in the eastern equatorial Pacific Ocean and is therefore positive during El Nino events when the sea surface temperatures are unusually warm (Figure 3). The SOI index is a comparison of sea level pressures at Darwin (off the coast of Australia) and Tahiti. Positive values of the pressure index correspond to La-Niña; negative values of the pressure index correspond to El Niño.

Date: November 8, 2001 Page: 6
e S. S. PAPADOPULOS & ASSOCIATES, INC.
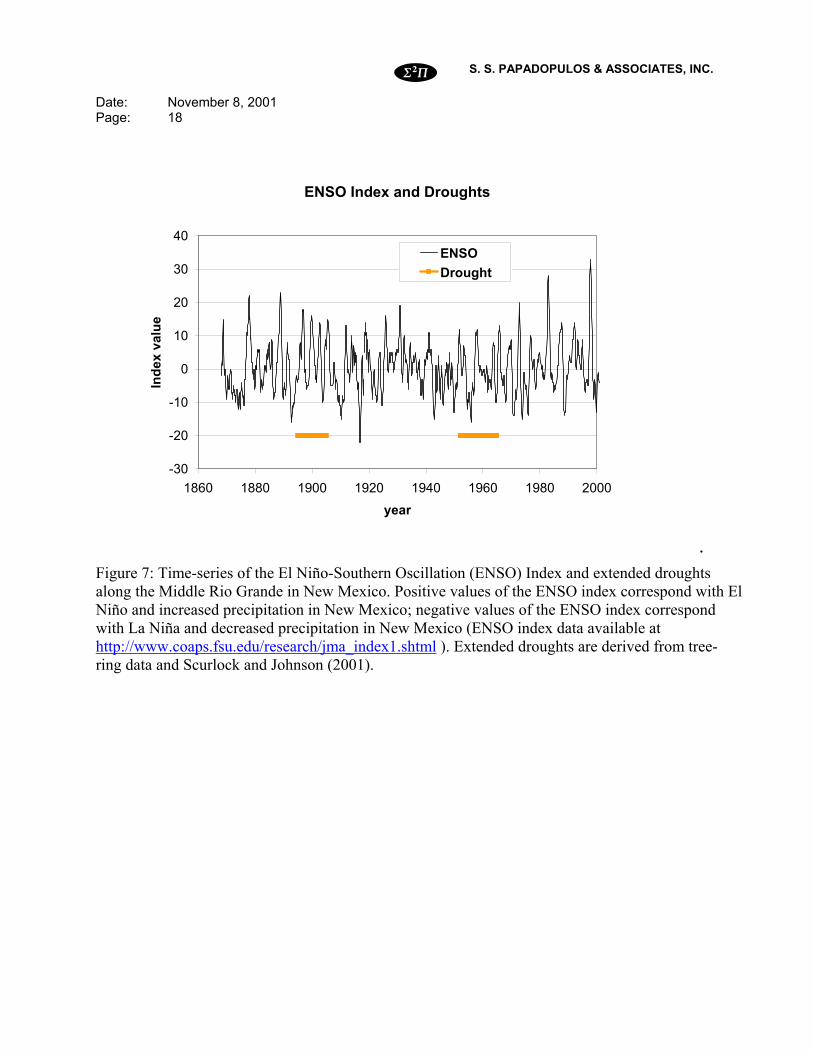
also occur during the neutral phase of the SOI. Figure 7 shows the ENSO index, a second commonly used measure of El Niño and La Niña events, plotted against historic flood and drought periods reconstructed by Scurlock and Johnson (2001) for the Middle Rio Grande. Here again, the weak correlation between ENSO and extended drought can be clearly seen.
2.3 The Pacific Decadal Oscillation
The Pacific Decadal Oscillation is a long-lived El Niño-like pattern of Pacific climate variability. The two climate oscillations, PDO and ENSO, have similar spatial climate fingerprints, but they have very different behavior in time. 20th century PDO "events" persisted for 20-to-30 years, while typical ENSO events persisted for 6 to 18 months. Relationships between the PDO and ENSO are not presently understood.
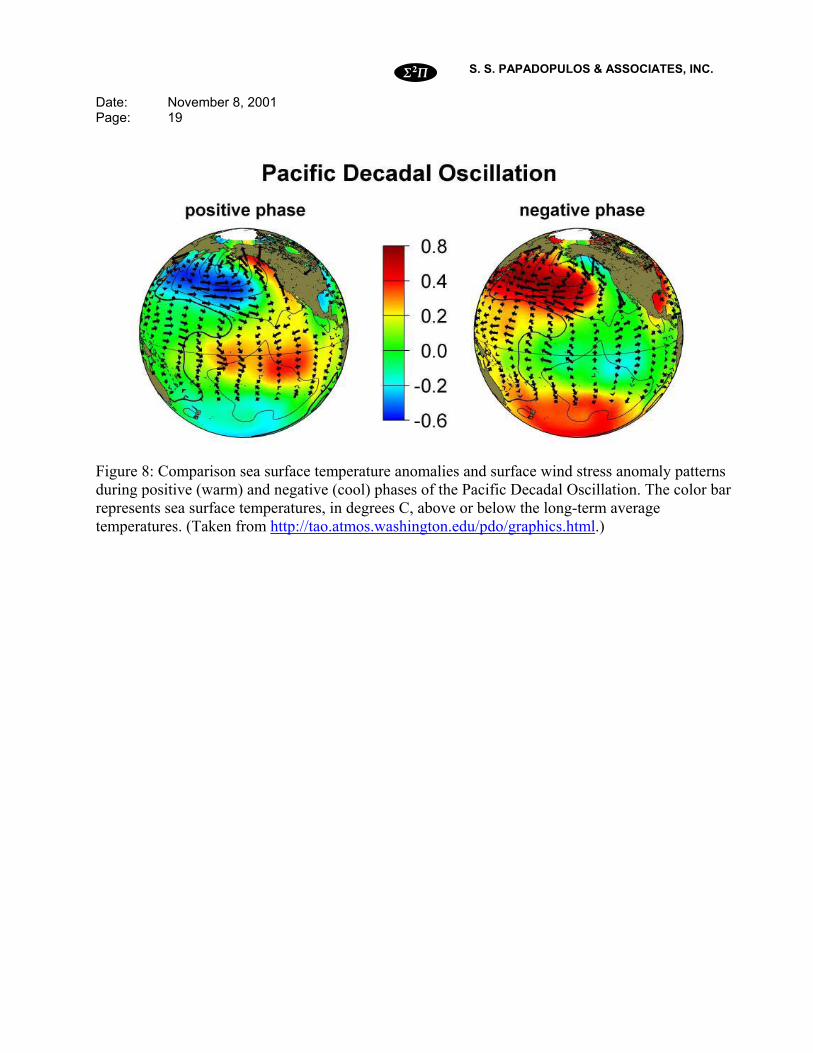
The Pacific Decadal Oscillation is derived from monthly sea surface temperature (SST) anomalies in the North Pacific Ocean, poleward of 20 degrees latitude. Just as ENSO climatic variations occur as a result of anomalously warm and cool pools of water in the equatorial Pacific Ocean, as described above, PDO climatic variations occur on a decadal time scale as a result of anomalously warm or cool sea surface temperatures in the North Pacific Ocean, poleward of 20 degrees latitude (Figure 8), and over a larger spatial scale than ENSO.
The North American climate anomalies associated with PDO are broadly similar to those connected with El Niño and La Niña, though generally not as extreme. Positive (warm, with warm water off the west coast of the Americas) phases of PDO are correlated with El Niño-like North American temperature and precipitation anomalies, while negative (cold, with cool water off the west coast of the Americas) phases of PDO are correlated with La Niña-like climate patterns (Mantua, 2000). As with ENSO, there is a strong correlation between the Pacific Decadal Oscillation and precipitation in New Mexico, with increased precipitation during the warm phase and decreased precipitation during the cold phase. During the last cold phase of the cycle (1947-1976) dry years outnumbered wet years nearly four to one (55 to 15 percent of the years). During the warm phase of the cycle (1977-1997) wet years outnumbered dry ones three to one (43 to 14 percent). For both, “wet” and “dry” indicate years with precipitation 10% above or below the average precipitation measured from 1944 to 1997 (Liles, web site).
Recent studies suggest that ENSO impact on North American climate is strongly dependent on the phase of the PDO, such that the "canonical" El Niño and La Niña patterns are strongest during years in which ENSO and PDO extremes are "in phase" (i.e. with warm PDO + El Niño, and cool PDO + La Niña, but not with other combinations) (Mantua, 2000).
The correlation between severe regional droughts in New Mexico and the cool phase of the PDO is strong. Figure 9 shows the measured Pacific Decadal Oscillation index from 1900-1998 (http://tao.atmos.washington.edu/data_sets/pdo/), the reconstructed Pacific Decadal Oscillation since 1650 (Biondi et al., 2001), and severe regions droughts in the Middle Rio Grande region of New Mexico (Scurlock and Johnson, 2001; tree-ring records). As can be seen, all 6 of the extended droughts that have occurred since 1650 have coincided with cool (negative) phases of the PDO. In particular, droughts have occurred during 4 of the 6 most negative (cool) excursions of the PDO.
The connection between New Mexico precipitation and the PDO are further supported by several independent studies which found evidence for just two full PDO cycles in the past century: cool PDO regimes prevailed from 1890-1924 and again from 1947-1976, while warm PDO regimes dominated from 1925-1946 and from 1977 through (at least) the mid-1990's. These periods correspond to the two periods of extended drought and two periods of above average

Date: November 8, 2001 Page: 7
e S. S. PAPADOPULOS & ASSOCIATES, INC.
moisture experienced by New Mexico in the past 100 years. Average flow at Otowi, on the Rio Grande, for the latter three of these periods is shown in Table 2. As can be seen, PDO phase appears to have a strong impact on flow in the Rio Grande.
There is scientific speculation that the PDO shifted around 1997 or 1998 and we have entered the cool phase. Based on the past record, this suggests New Mexico will experience drier conditions for the next one to two decades.
2.4 Implications of the New Mexico climate forcing New Mexican climate is strongly influenced by both the El Niño-Southern Oscillation
and the Pacific Decadal Oscillation. The American Southwest is already familiar with the effects of El Niño on the water supply. Prior to the 1997-98 El Niño, water-planning groups took into consideration past El Niño conditions in predicting potential spring runoff and flooding. Similarly, potential drought during La Niña years can be predicted and planned for. The longer-term effects of the Pacific Decadal Oscillation, however, are only beginning to be studied. Nonetheless, based on the past record, it appears that the Southwest would be wise to prepare for the potential of severe drought during the cool phase of the PDO, a phase which we may have just entered.
However, the warming associated with the most recent El Niños has been unusually persistent. El Niño waxed and waned for over four years in the early to mid 1990s, quickly followed by one of the strongest El Niño years ever recorded in 1997-98. Some scientists raise the possibility that heating of the atmosphere by global warming could increase the frequency and duration of El Niño events, creating longer periods of flooding and drought (Trenberth and Hoar, 1996; Reynolds et al., 1997). Certainly rainfall since the 1950s drought has been unprecedented in the last 2000 years. Researchers believe this may be a result of a dramatic shift in oceanic-atmospheric circulation patterns.
3 Implications for phase 3 of the Middle Rio Grande Water Supply Study 3.1 Evaluation of Reconstructed Otowi Flow
Though many of the tree rings records in northwestern New Mexico are significantly correlated with the Otowi index flow (r-values of 0.54 to 0.68), direct reconstructions of Otowi flow using tree ring data is not highly successful. The reconstructed flow values fail to cover the full range of measured data. This occurs because the outliers in the tree ring and flow records do not consistently coincide (Figure 2). As a result, the reconstructed record fails to capture the full variability of flow, missing both the high and low extremes and more heavily weighting median flows. Since variability of flow is one of the key attributes of New Mexico hydrology, adequately modeling variability is critical. Therefore, the direct use of reconstructed flows is not recommended for extending the flow record input to water supply models.
However, though the tree ring data may not produce useable flow reconstructions, the strong correlation between tree rings and the Otowi index flow indicates that the tree ring data can be used as a proxy to assess multi-year climatic patterns in the Otowi index flow. In particular, the tree rings records show that the period from 1950 to 1998 covers nearly the full range of tree ring variability, missing only the very driest of drought conditions (the 16th century mega-drought). This suggests that the flow record from 1950 to 1998 probably captures the bulk of the range in flow conditions at the Otowi gage, and in particular well represents above average
Date: November 8, 2001 Page: 8
e S. S. PAPADOPULOS & ASSOCIATES, INC.
flow (1978-1998) and 100-year drought (1950s drought) conditions. The 1950 to 1998 Otowi flow record clearly omits dramatic flood years, such as 1941, may lack extreme (1000-year or greater) drought conditions, and representation of “average” flows may be weak.
Based on the tree-ring data, then, the Otowi flow record from 1950-1998 can be used to reconstruct events of the past 500 years with reasonable accuracy. This approach will probably not achieve the full range of variability seen in the true Otowi flow over this time-span, but will capture a greater range of the true variability than would a flow reconstruction based on the tree rings. Careful choice of a probability distribution function to represent the Otowi flow, taking into account the weak representation of “average” flows and the need to extend the tails to cover events such as the 1941 flood and 16th century drought, could be used to enhance the measured record.
3.2 Climatic sequences in the tree-ring data Based on the correlation between Otowi flow and the tree-ring records, tree-ring records
were used to assess probable multi-year flow sequences. The analysis is based on 4 records that strongly correlate with Otowi flow: the El Malpais record (Grissino-Mayer, r=0.54) the Elephant Rock record (Swetnam et al., r=0.65); the Los Alamos record (O’Brien, r=0.58); and the Rio Pueblo record (Swetnam et al., r=0.66). Periods of four or more sequential years of above average or below average tree growth were recorded for each record from 1500 to the present. Dry and wet periods that occur in all four records, and the percentage of average precipitation at El Malpais during that period, are shown in Table 1. However, for each of the records, in addition to the seven drought periods that occurred concurrently in all four records, there were an additional 10 to 13 drought events. In addition to the 11 concurrent wet periods there were an additional 8 to 15 wet events. In most cases, additional wet and dry events appeared in 2 or 3 of the records roughly simultaneously. Averaging all of these events, we find that wet periods occur about every 25 years and last about 6 years. Precipitation at El Malpais during these periods averages 13% above the long-term (since 1500) average. Dry periods occur about every 30 years, last about 7.5 years, and precipitation averages 11% below the long-term average.
The El Malpais record was also used to look at how annual conditions are distributed. Four categories were delineated: very dry, corresponding to one standard deviation or more below the 2000-year average; dry, within one standard deviation below the average; wet, within one standard deviation above the average; and very wet, one standard deviation or more above the average. The distribution of the 2000-year record within these bins is: 17% very dry, 35% dry, 33% wet, and 15% very wet. This is basically a symmetric, normal distribution. However, when the same average and standard deviation values were used, but only the most recent 250 years of record analyzed, the results were: 13% very dry, 28% dry, 35% wet, and 24% very wet. The clear shift, in the past 250 years, toward increasingly wet and very wet conditions can be clearly seen.
Analysis of two-year sequences (using a 4-state Markov Chain– results shown in Table 3), again using the 2000 year and latest 250 year records, indicate that the probability of very dry year being followed by a very wet year have increased (7% to 18%) in the past 250 years while the number of very dry years being followed by dry or very dry years has dropped. Conversely, wet and very wet years are more likely to be followed by very wet years (19 to 26% for wet and 29% to 38% for very wet initial conditions) than in the past, at the expense of transitions to dry conditions but not to transitions to very dry conditions. This suggests that the past 250 years have

Date: November 8, 2001 Page: 9
e S. S. PAPADOPULOS & ASSOCIATES, INC.
experienced wetter weather with an increase in both dramatic shifts from extreme dry to extreme wet weather and multi-year sequences in wet weather.
3.3 Application of multi-year sequences to the modeling tasks of MRG Phase 3 The tree-ring and El Malpais reconstructed precipitation analyses indicate that
incorporating antecedent conditions into the modeling should analyze both 4 to 7 year dry and 4 to 6 year wet sequences. In doing this, drawing from the lower half of the 1950-1998 Otowi index flow distribution should give a realistic representation of drought periods. Drawing from the upper half of the 1950-1998 Otowi index flow distribution could overestimate water available during wet periods, since the wet conditions since 1950 have been unprecedented. Enhancing the Otowi index distribution by incorporating flows from 1919-1949 would partially resolve this issue, since pre-1950 flows, with the exception of 1941, are not as extreme as post-1978 flows. This still results in a record that exceeds the long-term average. However, given that predictions for climate change in the American Southwest are for increasing precipitation over the next 100 years (Sprigg and Hinkley, 2000), this is perhaps an acceptable bias to leave in the record.
In summary, we feel that the existing flow records for the Middle Rio Grande region should be used in preference to records reconstructed from proxy data. The upper half of the 1919-1998 Otowi index flow record can be used to represent above average wet conditions, and the lower half of the 1950-1998 record can be used to represent drought conditions. For general modeling, we feel that using only the 1950-1998 portion of the record is preferable to using the entire 1919-1998 continuous record since the latter incorporates two extended periods of above average moisture and only one drought period, resulting in an overrepresentation of average available moisture.
4 References: Ackerly, N. W., 1999. Paleohydrology of the Rio Grande: a first approximation. WRRI Conference Proceedings, 1-11. Biondi, F. et al., 2001, Pacific Decadal Oscillation Reconstruction. International Tree-Ring Data Bank. IGBP PAGES/World Data Center for Paleoclimatology Data Contribution Series #2001-001. NOAA/NGDC Paleoclimatology Program, Boulder CO, USA. Available at http://www.ngdc.noaa.gov/paleo/pubs/biondi2001/biondi2001.html Biondi, F., A. Gershunov, and D.R. Cayan, 2001, North Pacific decadal climate variability since AD 1661, Journal of Climate, Volume 14, Number 1, January 2001. Bradley, R. S., 1999. Paleoclimatology: Reconstructing Climates of the Quaternary, Second Edition. Harcourt Academic Press, San Diego, CA. Bradley, R. S. and P.D. Jones, editors, 1992. Climate since A.D. 1500. Routledge, London, England.

Date: November 8, 2001 Page: 10
e S. S. PAPADOPULOS & ASSOCIATES, INC.
Brownlee, S. and L. Tangley, 1997. The wrath of El Nino. US News on-line. http://www.usnews.com/usnews/issue/971006/6elni.htm. Cook, E. R., D. M. Meko, D. W. Stahle, and M. K. Cleaveland, 1999. Drought Reconstructions for the Continental United States. Journal of Climate, 12, 1145-1162. Fritts, H.C., 1991. Reconstructing Large-Scale Climatic Patterns from Tree-Ring Data. The University of Arizona Press, Tucson, AZ. Gleick, Peter H., Lead Author, 2000. Water: The potential consequences of climate variability and change for the water resources of the United States. U.S. Global Change Research Program. Green, P. M., D. M. Legler, C. J. Miranda, and J. J. O'Brien The North American Climate Patterns Associated with the El Niño-Southern Oscillation. Center for Ocean-Atmospheric Prediction Studies, Florida State University, Tallahassee, FL 32306-3041, COAPS Project Report Series 97-1. Available at: http://www.coaps.fsu.edu/lib/booklet/ Grissino-Mayer, H., 1996. A 2129-year reconstruction of precipitation for northwestern New Mexico, U.S.A. Pages 191-204 in J. S. Dean, D. M. Meko, and T. W. Swetnam, editors. Tree Rings, Environment and Humanity. Radiocarbon, Tucson, AZ. Grissino-Mayer, H., T.W. Swetnam and R.K. Adams, 1997. The rare, old-aged conifers of El Malpais: Their role in understanding climatic change in the American Southwest. New Mexico Bureau of Mines and Mineral Resources, Bulletin 156: 155-161. Grissino-Mayer, H., C.H. Baisan, and T.W. Swetnam, 1997b. A 1373-year reconstruction of annual precipitation for the southern Rio Grande basin. Final report submitted to the Directorate of Environment, Natural Resources Division, Fort Bliss, Texas for the Legacy Program. Gumerman, G.J., editor, 1988. The Anasazi in a changing environment. Cambridge University Press, Cambridge, England. Hare, S., 1999. Web site. IPHC, University of Washington. http://www.iphc.washington.edu/Staff/hare/html/decadal/post1977/nino34a.gif Liles, C.A., web site. Pacific Decadal Oscillation and New Mexico Precipitation. National Weather Service, Albuquerque, NM. http://www.srh.noaa.gov/abq/feature/PDO_NM.htm Mantua, N., 2000. Web site. JISAO, University of Washington. http://www.atmos.washington.edu/~mantua/REPORTS/PDO/PDO_egec.htm Ni, F., T. Cavazos, M.K. Hughes, A.C. Comrie and G. Funkhouser, in review. Cool Season Precipitation in the Southwestern United States since AD 1000: Comparison of Linear and Nonlinear Techniques for Reconstruction. Submitted to International Journal of Climatology.

Date: November 8, 2001 Page: 11
e S. S. PAPADOPULOS & ASSOCIATES, INC.
O’Brien, D., data. Los Alamos tree ring series, Los Alamos, New Mexico. Data archived at the World Data Center for Paleoclimatology, Boulder, Colorado, USA. http://www.ngdc.noaa.gov/paleo/treering.html Reynolds, R., M. Dettinger, D. Cayan and others, 1997. Effects of El Niño on Streamflow, Lake Level, and Landslide Potential. U.S. Geological Survey, http://geochange.er.usgs.gov/sw/changes/natural/elnino/. Rose, M.R., J.S.Dean, and W.J.Robinson, 1981. The past climate of Arroyo Hondo, New Mexico, reconstructed from tree rings. School of American Research Press, Santa Fe, NM. Scurlock, Dan, 1998. From the Rio to the Sierra: An Environmental History of the Middle Rio Grande Basin. USDA Forest Service General Technical Report, RMRS-GTR-5. Scurlock, D. and P. Johnson, 2001. Hydrologic History of the Middle Rio Grande Basin. New Mexico. Decision-Makers Field Guide, NMBMMR, pp.103-105. Sevilleta Long Term Ecological Research site, 1998. Web site. http://sevilleta.unm.edu/research/local/climate/enso/newmexico/ Sprigg, W. A. and T. Hinkley, 2000. Preparing for a Changing Climate: The potential consequences of climate variability and change. A report of the Southwest Regional Assessment Group. U.S. Global Change Research Program. Available at: http://www.ipcc.ch/ Stahle, D.W., E.R. Cook, M.K. Cleaveland, M.D. Therrell, D. M. Meko, H.D. Grissino-Mayer, E. Watson, and B. H. Luckman, 2000. Tree-ring data document 16th Century megadrought over North America. EOS, AGU 81, 12 March 2000. Swetnam, T.W., A.C. Caprio, and A.M. Lynch, data. Elephant Rock and Rio Pueblo tree ring series, Elephant Rock and Rio Pueblo, New Mexico. Data archived at the World Data Center for Paleoclimatology, Boulder, Colorado, USA. http://www.ngdc.noaa.gov/paleo/treering.html Wilson, Lee, 1999. Surface Water Hydrology of the Rio Grande Basin. WRRI Conference Proceedings, 67-78.
Date: November 8, 2001 Page: 12
e S. S. PAPADOPULOS & ASSOCIATES, INC.
El Malpais (GM) precipitation reconstruction: 10-year running average
11
12
13
14
15
16
17
18
19
0 200 400 600 800 1000 1200 1400 1600 1800 2000
year
aver
age
prec
ip. (
inch
es)
Figure 1: 10-year running average of reconstructed precipitation at El Malpais, New Mexico (northwestern New Mexico) using tree rings (Grissino-Mayer, 1996). (Plotted from data available at http://www.ngdc.noaa.gov/paleo/drought/drght_grissno.html)
Date: November 8, 2001 Page: 13
e S. S. PAPADOPULOS & ASSOCIATES, INC.
Comparison of El Malpais ringwidths and Otowi flow
-3
-2
-1
0
1
2
3
4
1900 1920 1940 1960 1980 2000Year
Nor
mal
ized
indi
ces
Normalized ringwidthsNormalized Otowi Flow
Figure 2: Comparison of normalized El Malpais ring widths and normalized Otowi index flow from 1900 to 2000. The flow and tree ring data tends to correspond well on the multi-year timeframe, but extreme values do not always coincide. Statistical comparison of the two records from 1919-1992 yields an r-value of 0.54.

Date: November 8, 2001 Page: 14
e S. S. PAPADOPULOS & ASSOCIATES, INC.
Figure 3: January-March sea-surface temperatures during El Niño and La Niña phases of the El Niño-Southern Oscillation (ENSO). Upper panels show absolute sea-surface temperatures, in degrees C, during the 1998 El Niño and 1989 La Niña. The lower panels show the sea-surface temperature departures from the average. The pool of abnormally warm water in the eastern Pacific during the El Niño and pool of abnormally cool water in the eastern Pacific during La Niña can be clearly seen in these bottom panels. (Figure taken from http://www.cpc.ncep.noaa.gov/products/analysis_monitoring/ensocycle/sst_nino_nina.gif.).
Date: November 8, 2001 Page: 15
e S. S. PAPADOPULOS & ASSOCIATES, INC.
Figure 4: The atmospheric response, including the positions of the polar and Pacific jet streams, during warm (El Niño) and cold (La Niña) phases of ENSO. Taken from the Climate Prediction Center/NCEP/NWS website: http://www.cpc.ncep.noaa.gov/products/analysis_monitoring/ensocycle/nawinter.html

Date: November 8, 2001 Page: 16
e S. S. PAPADOPULOS & ASSOCIATES, INC.
Figure 5: Normal vs. El Niño average December-March precipitation values. For each climate division in New Mexico, the figure shows: inches of precipitation received between December and March, averaged over 102 years of record (1895-1996); average El Niño precipitation (ENSO average) for the nine strongest El Niño years that occurred between 1895-1996; average El Niño precipitation as a percentage of the long-term average; and precipitation measured during the 1982-83 El Niño. From http://www.cpc.ncep.noaa.gov/products/predictions/threats2/enso/elnino/nm_bar.html.

Date: November 8, 2001 Page: 17
e S. S. PAPADOPULOS & ASSOCIATES, INC.
Figure 6: Average October-March statewide New Mexico precipitation from 1933/34 to 1996/97, plotted against the Southern Oscillation Index (SOI) for the prior June-November. La Niña years, in blue, tend to be drier than average. El Niño years, in red, tend to be wetter than average. Years for which the SOI is neutral (neither an El Niño nor a La Niña) are plotted in green. From http://www.wrcc.dri.edu/enso/octmar29.gif
Date: November 8, 2001 Page: 18
e S. S. PAPADOPULOS & ASSOCIATES, INC.
ENSO Index and Droughts
-30
-20
-10
0
10
20
30
40
1860 1880 1900 1920 1940 1960 1980 2000year
Inde
x va
lue
ENSODrought
. Figure 7: Time-series of the El Niño-Southern Oscillation (ENSO) Index and extended droughts along the Middle Rio Grande in New Mexico. Positive values of the ENSO index correspond with El Niño and increased precipitation in New Mexico; negative values of the ENSO index correspond with La Niña and decreased precipitation in New Mexico (ENSO index data available at http://www.coaps.fsu.edu/research/jma_index1.shtml ). Extended droughts are derived from tree-ring data and Scurlock and Johnson (2001).
Date: November 8, 2001 Page: 19
e S. S. PAPADOPULOS & ASSOCIATES, INC.
Figure 8: Comparison sea surface temperature anomalies and surface wind stress anomaly patterns during positive (warm) and negative (cool) phases of the Pacific Decadal Oscillation. The color bar represents sea surface temperatures, in degrees C, above or below the long-term average temperatures. (Taken from http://tao.atmos.washington.edu/pdo/graphics.html.)

Date: November 8, 2001 Page: 20
e S. S. PAPADOPULOS & ASSOCIATES, INC.
PDO Reconstruction and Droughts
-2
-1
0
1
2
1650 1675 1700 1725 1750 1775 1800 1825 1850 1875 1900 1925 1950 1975 2000
year
PDO
inde
x
PDOsevere regional droughtMeasured PDO index
Figure 9: The Pacific Decadal Oscillation index from 1650 to the present. In black are values reconstructed based on tree ring data from southern California (Biondi et al., 2001). Post-1900 values derived from sea-surface temperature measurements are shown in purple for comparison. Pre-1925 differences between the reconstructed and measured values may be due to errors and scarcity in the measured data (Biondi et al., 2001). Extended droughts along the Middle Rio Grande in New Mexico, from tree-ring data and Scurlock and Johnson (2001), are shown in orange. All six of the past severe droughts have occurred during negative (cool) phases of the Pacific Decadal Oscillation. Data available at http://www.ngdc.noaa.gov/paleo/pubs/biondi2001/biondi2001.html and http://tao.atmos.washington.edu/data_sets/pdo/.

Date: November 8, 2001 Page: 21
e S. S. PAPADOPULOS & ASSOCIATES, INC.
DROUGHT Length (years) % of average precipitation 1573-1593 21 82 1663-1677 15 93 1727-1743 17 89 1748-1759 12 93 1773-1783 11 89 1899-1904 6 86 1950-1964 15 90
WET Length (years) % of average precipitation
1507-1515 9 104 1608-1615 8 104 1633-1653 21 108 1720-1725 6 104 1764-1772 9 107 1790-1800 11 104 1830-1841 12 108 1852-1870 19 112 1882-1889 8 107 1905-1933 29 109 1978-1992 15 123
Table 1: Years of sequential above and below average tree-ring growth, and the corresponding average reconstructed precipitation at El Malpais as compared to the long-term average reconstructed precipitation at El Malpais since 1500. Periods shown in black appear in all four tree-ring records analyzed. Droughts in bold type were identified by Scurlock and Johnson (2001) and appear in 2 of the 4 (1748-1759) and 3 of the 4 (1899-1904) tree ring records respectively. See text, section 3.2 for details.
Year Average Otowi index flow
% of 1919-1998 average
PDO phase
1919-1998 1,058,102 100 1925-1945 1,146,418 108 Positive (warm) 1947-1976 824,647 78 Negative (cool) 1977-1997 1184452 112 Positive (warm)
Table 2: Average Otowi index flow for selected periods during the 1900s. Average flow (in acre feet per year) and the % of flow compared with the 1919-1998 average flow are shown. The phase of the Pacific Decadal Oscillation is also show for periods that fall entirely within one phase of the cycle.

Date: November 8, 2001 Page: 22
e S. S. PAPADOPULOS & ASSOCIATES, INC.
2000-year record i+1
i VeryDry Dry Wet VeryWet 17% VeryDry 0.22 0.42 0.29 0.07 35% Dry 0.20 0.41 0.29 0.10 33% Wet 0.16 0.31 0.35 0.19 15% VeryWet 0.07 0.25 0.40 0.29
250-year record
i VeryDry Dry Wet VeryWet 13% VeryDry 0.15 0.33 0.33 0.18 28% Dry 0.16 0.40 0.31 0.13 35% Wet 0.13 0.26 0.35 0.26 24% VeryWet 0.10 0.16 0.36 0.38
Table 3: Markov chain analysis of very wet, wet, dry, and very dry climate transitions for the past 2000 years and past 250 (1742-1992) years. The first column shows the record length and the percentage of initial years that fall into each category. The second column gives the initial year conditions; columns 3 through 6 give the probability of moving to each of the four possible conditions in the following year given the initial condition. Each row within the matrix therefore sums to one (within round-off error). For the 250-year matrix, probability changes of less than 6% are not significant.