new mexico abor nside market page 2 - 5 - jobs.state.nm.us · the information industry also remains...
TRANSCRIPT

Volume 32, No. 12, January 31, 2004
Conroy ChinoConroy ChinoConroy ChinoConroy ChinoConroy ChinoSecretarySecretarySecretarySecretarySecretary
www.dol.state.nm.usPrepared by Economic Research and AnalysisP.O. Box 1928, Albuquerque, N.M. 87103Ph: (505) 841-8645
Bill RichardsonBill RichardsonBill RichardsonBill RichardsonBill RichardsonGovernorGovernorGovernorGovernorGovernor
HIGHLIGHTS � December 2003
NM & MSA Highlights
Page 2 - 5
NM Household Data HistoryPage 6
Total Nonfarm Growth
NM Ranking
Page 6
NM Labor Force Estimates
Page 7
Unemployment Rate Rankings
by County and State
Page 8 & 9
Nonfarm Employment:
State & MSAs
Page 10-14
Average Hours & Earnings
& US Consumer Price Index
Page 15
NM Unemployment Insurance
Page 15
NM Economic Activity by AreaPage 16-17
(Special Article)
Philips Semiconductor Closing
Economic Impact SummaryPage 19
IIIIINSIDE
December 2003 over December 2002 - Not Seasonally Adjusted
Current Regional Nonfarm Employment Growth
LLLLLaborMMMMMarketRRRRReport
New MexicoNew MexicoNew MexicoNew MexicoNew Mexico
4.0%
2.0%
1.3% 1.3%
0.9%
0.5%
0.0% -0.2% -0.8% -0.9%
-1.0%
-0.5%
0.0%
0.5%
1.0%
1.5%
2.0%
2.5%
3.0%
3.5%
4.0%
NV AZ NM WY UT TX US CA OK CO
Gro
wth
U.S
. Ave
rage
...New Mexicoís over-the-year job growth was 1.3 percent in December 2003 ñ gaining9,800 jobs since this time last year. Most other states have not done this well.
...In the Albuquerque MSA, over-the-year expansions were seen in just half of the 12industry divisions, resulting in a net increase of 3,700 jobs or 1.0 percent.
...Over-the-year job growth for the Las Cruces MSA briefly dropped over the summermonths, but has since returned to a high rate of 4.0 percent.
...Over-the-year job growth in the Santa Fe MSA was 1.5 percent, adding 1,200 jobs.The over-the-year rate of job growth had been stronger prior to May this year, beforeslowing growth in government employment caused the rate to drop below the state-wide average.

-2-
New Mexico Labor Force and Payroll Employment
New Mexico Prel. Revised Change FromSeasonally Adjusted Dec 2003 Nov 2003 Dec 2002 Nov 2003 Dec 2002Civilian Labor Force 898,400 897,000 885,000 +1,400 +13,400Employment 847,000 843,500 837,200 +3,500 + 9,800Unemployment 51,400 53,500 47,800 -2,100 + 3,600Rate 5.7% 6.0% 5.4%Rate (not seasonally adjusted) 5.3% 5.7% 5.0%
New Mexicoís seasonally adjusted unemployment rate dropped to5.7 percent in December 2003, down from 6.0 percent in Novem-ber. The stateís unemployment has not been this low at any othertime during 2003. However, New Mexicoís unemployment ratewas slightly lower last December, when the number was 5.4 per-cent. Nationally the unemployment rate also dropped to 5.7percent in December 2003, the same as New Mexicoís rate.
The state experienced two major layoff events during 2003. Shockwaves in the local economy from these events led to almost 3,000lost jobs. These lost jobs include the individuals who were laid offby each of the closing companies, and jobs lost by local suppliersto each company as well as jobs lost through reduced consumerspending by former workers at other businesses such as restau-rants. The term used for this ìknock onî effect is economicmultiplier. We have estimated the effect of both layoff eventsusing proprietary economic software. The results may help toexplain the recent small reduction in job growth for the state.
Stream International, an outbound call center operator for otherbusinesses on a contractual basis, closed in July 2003. Accordingto news reports, earlier in the year the center had employed asmany as 800 workers. The economic multiplier for this industry isrelatively low at 1.7. The total impact was the loss of 1,300 jobs tothe local economy.
Philips Semiconductors closed its manufacturing plant in Albu-querque in December 2003. Public sources place recent employ-ment levels at about 600 workers, having been as high as 1,200workers about eighteen months ago. The economic multiplier forthis industry, at 2.6, is relatively high. Taking the most recent 600jobs that were lost along with the industry multiplier, the economicimpact is about 1,600 jobs.
Back to the latest employment data, December employment in-creased by 1,500 jobs from the previous month, as retailers contin-ued to hire temporary workers in the final days of the holidayshopping season. Also the federal government hired temporaryworkers to help with the record number of cards and letters sentthis time of year. However, the number of additional postalworkers hired this year was less than in the past because automa-tion has reduced the need for human intervention in sorting firstclass mail. Jobs were lost during the month in construction andmanufacturing. Construction jobs declined as they always dowhen the weather turns colder, but this year the decline camerelatively late in the season. Manufacturing jobs declined thesame month that Phillips Semiconductors officially closed in Al-buquerque.
New Mexicoís over-the-year job growth was 1.3 percent in De-cember 2003 ñ gaining 9,800 jobs since this time last year. Mostother states have not done this well. The stateís rate of job growthwas seventh highest in the nation. The fastest growing states wereNevada, Arizona, Alaska, Hawaii, Georgia, and Florida. Nation-ally the economy has lost 62,000 jobs over the year.
Most industries in the state have been growing at a slow but steadyrate; three other industries are doing really well and have added asubstantial number of jobs; four remaining industries have lost a
considerable number of jobs since last year.
The fast growing industries are 1) natural resources and mining, 2)construction, and 3) educational and health services. The first twoof these industries has been successful because of national andworld economic conditions that have improved market conditionsfor their products. The third industry has gained from state Medic-aid policy.
The stateís natural resources and mining industry continues to reapthe rewards from sustained higher prices for both oil and naturalgas. The industry as a whole was up 1,000 jobs, 7.6 percent on theyear. The oil and gas-related component increased 14.0 percent,turning in the best results since the last boom ended in 2001. Thesmaller component of mining, except oil and gas has continued tolose jobs, posting a loss of 200 jobs for the year.
Construction employment increased 2,500 jobs, or 5.5 percent,since this time last year. Almost all of the expansion has been inthe residential home building market, resulting from interest ratesthat still remain near historic lows. National data show thathomebuilders had their best year in 2003 compared to the last 25years.
The third industry to grow rapidly, educational and health ser-vices, is the stateís largest private industry. This industry hasadded 4,400 new jobs in the last year, growing at 4.5 percent.Many of the new jobs have come from the relatively small homehealth care services component, which has tripled in size since2000. Home health care employers are expanding services inresponse to Medicaid funding for the personal care option, hiringcaregivers for qualifying Medicaid recipients with self-care limita-tions. Within educational and health services, another 1,000 jobshave been added to social assistance, which includes privately-runagencies providing assistance directly to clients such as youthservices and child day care.
Looking at job losses, the professional and business services in-dustry has now lost more jobs than any other industry sector, down1,800 jobs. This industry has lost most of these jobs fairly re-cently. Most of the losses were in the administrative & supportservices component of the industry, which was down 2,900 jobs.A substantial number of jobs have been lost in each of the employ-ment services and business support services subcomponents. Theweak sub-component in employment services is professional em-ployer organizations. Such establishments provide labor or staffleasing services for other companies. For example, many hotelswill contract with such organizations to supply qualified workersto do their payroll. It appears that a number of these contracts havenot been renewed recently and firms have instead reverted todoing the work themselves. It is important to note that the much-watched temporary help services component remains steady.
The loss of manufacturing jobs shows no signs of ending, with themost recent impact being the closing of the Philips Semiconductorplant in Albuquerque. The number of manufacturing jobs in thestate was down 1,700 from last year. The information industryalso remains weak, down 800 jobs. Finally, wholesale trade haslost 500 jobs.

-3-
(Bernalillo, Sandoval & Valencia Counties)
Albuquerque MSA Labor Force and Payroll Employment
Albuquerque Prel. Revised Change FromSeasonally Adjusted Dec 2003 Nov 2003 Dec 2002 Nov 2003 Dec 2002Civilian Labor Force 394,300 398,400 390,500 -4,100 +3,800Employment 374,700 378,000 371,900 -3,300 +2,800Unemployment 19,600 20,400 18,600 -800 +1,000Rate 5.0% 5.1% 4.8%Rate (not seasonally adjusted) 4.5% 5.0% 4.3%
The Albuquerque MSA seasonally adjusted unemploymentrate was 5.0 percent in December, down slightly from 5.1percent in November but up from 4.8 percent a year ago.Unemployment has hovered fairly close to the five percentmark since the beginning of the year.
Payroll employment added only 500 jobs (0.1 percent) inDecember, quite low for a month that typically enjoys expan-sions of two or three times that amount. While seasonalincreases occurred in retail trade and postal employment,offsetting declines in a handful of industries exerted a drag onoverall growth. Manufacturing lost 300 jobs, due largely tothe closure of Philips Semiconductors. At the same time, theadvent of colder weather finally brought about a seasonalslowdown in construction activity, resulting in the loss of 500jobs. Four other industries lost between 100 and 200 jobseach. On the positive side, however, the information industryreceived an unexpected boost of 300 jobs.
Over the year, expansions were seen in just half of the 12industry divisions, resulting in a net increase of 3,700 jobs or1.0 percent. The construction industry continued to sizzle,with an annual growth rate of 7.6 percent. This strong in-crease was largely the result of an expansion in home buildingactivity. Housing permits have risen substantially over lastyear, and recently announced plans for new developments inRio Rancho and on Albuquerqueís west side should boostactivity even more.
Leisure and hospitality netted 1,300 new jobs, thanks to strongover-the-year growth in food services. Both full-service andfast food restaurants contributed to the increase. Employ-ment was boosted by the arrival of several large chain opera-tions in Albuquerque in the early part of the year; however,not a lot of new jobs have been added since then.
Educational and health services gave a relatively strong per-formance with growth of 2.6 percent, though slowing consid-erably from highs near six percent earlier in the year. All ofthe annual increase was in the industryís health care compo-nent.
Growth of 1.6 percent was seen in retail trade, with theaddition of 700 new jobs. There has been little action in thisindustry in quite some time, except for some growth in generalmerchandise stores. Essentially, performance in retail tradehas been lackluster since the high growth years of the 1990s.
Government employment rose 900, despite a decline of 300jobs in the federal branch. Growth was largely due to in-creases in state and local educational institutions, as well as instate-run medical facilities like UNM Hospital. Though gov-ernment growth of 1.2 was slightly higher than the privatesectorís growth rate (1.0 percent), government accounted foronly a quarter of the total number of new jobs. Growth intribally-owned enterprises is currently at a standstill, but thatwill change when Sandia Pueblo opens its new hotel in 2005.
Employment in the miscellaneous industry of other servicesgained 200 jobs (1.7 percent) over the year. This industry iscomposed of repair and maintenance shops, personal andlaundry services, and membership associations and organiza-tions. Electronic and computer repair services seem to bedoing particularly well.
Six industries ended the year with fewer jobs than they had 12months ago, led by a decline of 1,000 in manufacturing. Thisindustry has now undergone 30 consecutive months of over-the-year declines. The bulk of the losses came from semicon-ductors and other electronic products, where 500 jobs havedisappeared since last December and 2,800 since 1995.
The information industry continued its downward slide, shed-ding 300 jobs over the year. Most of the losses were the resultof ongoing problems in the telecommunications industry. Pro-fessional and business services also lost 300 jobs, largely dueto cutbacks in employment services, especially professionalemployer organizations.
In wholesale trade, employment fell by 2.3 percent (300 jobs)over the last 12 months. This industry has been losing groundfor the past several years, as evidenced by a decline of 1,000jobs from December 1997. Employment in financial serviceswas down by 200 jobs over the year, while transportation,warehousing, and utilities fell by 100.

-1.0%
0.0%
1.0%
2.0%
3.0%
4.0%
5.0%
6.0%
Jan-
00Fe
b-00
Mar
-00
Apr
-00
May
-00
Jun-
00Ju
l-00
Aug
-00
Sep-
00O
ct-0
0
Nov
-00
Dec
-00
Jan-
01
Feb-
01M
ar-0
1
Apr
-01
May
-01
Jun-
01
Jul-
01
Aug
-01
Sep-
01
Oct
-01
Nov
-01
Dec
-01
Jan-
02
Feb-
02
Mar
-02
Apr
-02
May
-02
Jun-
02
Jul-
02
Aug
-02
Sep-
02
Oct
-02
Nov
-02
Dec
-02
Jan-
03
Feb-
03
Mar
-03
Apr
-03
May
-03
Jun-
03Ju
l-03
Aug
-03
Sep-
03
Oct
-03
Nov
-03
Dec
-03
New MexicoLas Cruces
-4-
(Doña Ana County)
Las Cruces MSA Labor Force and Payroll Employment
Annual Nonfarm Job Growth Rates - NM and Las Cruces
Las Cruces Prel. Revised Change FromSeasonally Adjusted Dec 2003 Nov 2003 Dec 2002 Nov 2003 Dec 2002Civilian Labor Force 79,300 79,600 76,400 -300 +2,900Employment 74,000 74,200 71,800 -200 +2,200Unemployment 5,300 5,400 4,600 -100 +700Rate 6.7% 6.8% 6.0%Rate (not seasonally adjusted) 6.0% 6.1% 5.4%
The seasonally adjusted unemployment rate in the Las CrucesMSA was 6.7 percent in December 2003, down slightly fromNovemberís revised rate of 6.8 percent. A year ago the areaísunemployment rate was 6.0 percent.
The Las Cruces economy lost 200 jobs in December 2003.Declining employment in state government, resulting fromtypical seasonal employment declines at New Mexico StateUniversity, was responsible for the loss. State governmentshed a total of 500 jobs during the month. Partially offsettingthe drop in government employment were three private-sectorindustries that each added 100 jobs. The industries gainingjobs in December were retail trade, leisure and hospitality,and other services.
Over-the-year job growth for the Las Cruces area brieflydropped over the summer months, but has since returned to ahigh rate of 4.0 percent. The area has added 2,400 jobs sincethis time last year. All of the major industries remain at orabove last yearís levels. The health services industry hasadded the most jobs, with strong competition between Memo-rial Hospital and Mountain View Medical Center. Overall,educational and health services has added 600 jobs.
State government, which in Las Cruces is dominated by NewMexico State University, has grown 4.8 percent over the year,adding 400 jobs. Employment at New Mexico State Univer-sity continues to provide a boost for state government em-
ployment. This increase in state government employmentboosts total government employment 2.5 percent, even withrelatively flat employment growth in the other branches ofgovernment, including the loss of 100 federal governmentjobs over the year.
Retail trade continues to grow faster in Las Cruces thanelsewhere in the state. The industry has increased 400 jobssince last year, growing 6.0 percent. Leisure and hospitalityhas also done well recently, having increased 200 jobs. Thenew jobs are working in food services and drinking places.The increase makes for a 4.3 percent increase in food serviceand drinking places. Construction employment had for awhile been lagging the rest of the state, but has now caught upwith the increases seen elsewhere. The natural resources,mining and construction industry (mostly construction em-ployment in Las Cruces), gained 300 jobs, growing at a highrate of 8.8 percent.
Wholesale trade increased 100 jobs, having not shown a lotof activity for a while. Transportation, warehousing & utilitiesadded 100 jobs. The information industry also increased 100jobs, as did other services.
Three remaining industries reported employment levels un-changed from last year. Those industries were manufacturing,financial activities, and professional and business services.

-1.0%
-0.5%
0.0%
0.5%
1.0%
1.5%
2.0%
2.5%
3.0%
3.5%
4.0%
Jan-
00
Feb
-00
Mar
-00
Apr
-00
May
-00
Jun-
00
Jul-
00
Aug
-00
Sep
-00
Oct
-00
Nov
-00
Dec
-00
Jan-
01
Feb
-01
Mar
-01
Apr
-01
May
-01
Jun-
01
Jul-
01
Aug
-01
Sep
-01
Oct
-01
Nov
-01
Dec
-01
Jan-
02
Feb
-02
Mar
-02
Apr
-02
May
-02
Jun-
02
Jul-
02
Aug
-02
Sep
-02
Oct
-02
Nov
-02
Dec
-02
Jan-
03
Feb
-03
Mar
-03
Apr
-03
May
-03
Jun-
03
Jul-
03
Aug
-03
Sep
-03
Oct
-03
Nov
-03
Dec
-03
New MexicoSanta Fe
-5-
(Santa Fe & Los Alamos Counties)
Santa Fe MSA Labor Force and Payroll Employment
Annual Nonfarm Job Growth Rates - NM and Santa Fe
Santa Fe Prel. Revised Change FromSeasonally Adjusted Dec 2003 Nov 2003 Dec 2002 Nov 2003 Dec 2002Civilian Labor Force 83,300 83,400 80,500 -100 +2,800Employment 80,500 80,500 78,300 0 +2,200Unemployment 2,800 2,900 2,200 -100 +600Rate 3.4% 3.5% 2.7%Rate (not seasonally adjusted) 3.0% 3.3% 2.5%
The seasonally adjusted unemployment rate in the Santa FeMSA was 3.4 percent in December 2003, down a fractionfrom Novemberís rate of 3.5 percent. A year ago the areaísunemployment rate was 2.7 percent. The Santa Fe MSAcontinues to have one of the lowest rates of unemployment inthe state.
The number of jobs in the Santa Fe area increased by 200 inthe month of December 2003. The increase was the net resultof 100 additional jobs in three industries ó retail trade,financial activities, and leisure and hospitality ó combinedwith the loss of 100 jobs in natural resources, mining andconstruction. These changes were typical for December.
Over-the-year job growth in Santa Fe was 1.5 percent, adding1,200 jobs. The over-the-year rate of job growth had beenstronger prior to May this year, before slowing growth ingovernment employment caused the rate to drop below thestatewide average. Earlier this year, job growth had averaged3.3 percent. Santa Fe is still doing fairly well consideringonly half of the industries have added any jobs. Only six ofSanta Feís twelve industries have contributed new jobs, andthree have actually lost jobs.
Educational and health services has added more jobs than anyother industry, increasing 400 jobs since this time last year,growing 4.5 percent. All of the increase was in the heath care
and social assistance components; education employment re-mained flat. In contrast to the statewide trend of decliningjobs in this industry, professional and business services added300 jobs in the Santa Fe area.
Government employment increased 300 jobs. The areaís smallnumber of federal government jobs was unchanged; localgovernment increased by 100 jobs; the larger state govern-ment category was up 200 jobs. Previously the number ofstate government jobs had grown with expansions at LosAlamos National Laboratory, which is run by the Universityof California. Most of these expansions are no longer re-flected in the year-over-year growth numbers.
Retail trade added 200 jobs over the year, growing 2.2 per-cent. Other services remained strong, adding 200 jobs, grow-ing 6.7 percent. This industry includes establishments such asautomotive repair shops and church-run youth programs. Thefinancial activities industry added 100 jobs.
Two industries ñ information and construction ó remained atlast yearís employment levels. Three remaining industries haddeclining employment. The transportation, warehousing andutilities industry was down 100 jobs. Manufacturing, whichhas struggled for some time, was down 100 jobs. Finally, theleisure and hospitality industry dropped 100 jobs.

-6-
New Mexico � Seasonally Adjusted
Labor Force, Employment, Unemployment, & Unemployment Rate
Total Nonfarm Employment Growth Rankings
New Mexico and United States
December December %State Rank 2002 2003 Change ChangeNevada 1 1,060.9 1,103.1 42.2 4.0%Arizona 2 2,298.4 2,345.5 47.1 2.0%Alaska 3 287.4 292.8 5.4 1.9%Hawaii 4 568.5 578.7 10.2 1.8%Georgia 5 3,927.7 3,990.9 63.2 1.6%Florida 6 7,325.8 7,439.2 113.4 1.5%New Mexico 7 776.1 785.9 9.8 1.3%Wyoming 7 245.3 248.6 3.3 1.3%Idaho 9 570.3 576.9 6.6 1.2%Delaware 10 665.3 672.0 6.7 1.0%Utah 11 1,080.9 1,091.0 10.1 0.9%New Jersey 11 4,025.3 4,061.9 36.6 0.9%Virginia 11 3,514.0 3,545.3 31.3 0.9%Vermont 14 306.2 308.3 2.1 0.7%Kansas 15 1,347.5 1,355.2 7.7 0.6%Montana 16 395.8 397.9 2.1 0.5%South Dakota 16 380.7 382.7 2.0 0.5%Texas 16 9,485.2 9,530.3 45.1 0.5%New Hampshire 19 621.2 624.0 2.8 0.5%Mississippi 20 1,131.8 1,135.9 4.1 0.4%Maryland 21 2,495.8 2,503.5 7.7 0.3%North Carolina 22 3,854.6 3,864.6 10.0 0.3%Tennessee 23 2,686.4 2,692.5 6.1 0.2%North Dakota 23 334.1 334.8 0.7 0.2%Rhode Island 23 486.1 487.1 1.0 0.2%Washington 23 2,675.4 2,680.3 4.9 0.2%Nebraska 23 912.1 913.7 1.6 0.2%Missouri 28 2,678.9 2,681.7 2.8 0.1%Maine 29 607.6 607.8 0.2 0.0%Iowa 29 1,455.9 1,455.8 -0.1 0.0%United States 131,017.0 130,955.0 -62.0 0.0%Minnesota 29 2,657.4 2,656.6 -0.8 0.0%Wisconsin 29 2,786.7 2,785.8 -0.9 0.0%Oregon 33 1,579.3 1,578.5 -0.8 -0.1%New York 33 8,523.3 8,514.9 -8.4 -0.1%Arkansas 35 1,156.3 1,154.0 -2.3 -0.2%Pennsylvania 35 5,695.2 5,682.7 -12.5 -0.2%DC 35 415.1 414.1 -1.0 -0.2%California 35 14,584.7 14,549.0 -35.7 -0.2%Indiana 39 2,909.2 2,900.9 -8.3 -0.3%Louisiana 39 1,915.9 1,909.5 -6.4 -0.3%Kentucky 41 1,795.7 1,786.8 -8.9 -0.5%Alabama 41 1,895.4 1,885.0 -10.4 -0.5%West Virginia 43 736.0 731.4 -4.6 -0.6%Illinois 44 5,945.3 5,904.8 -40.5 -0.7%Oklahoma 45 1,489.6 1,478.4 -11.2 -0.8%Colorado 46 2,195.3 2,175.2 -20.1 -0.9%Connecticut 47 1,682.2 1,665.4 -16.8 -1.0%Ohio 48 5,483.8 5,415.4 -68.4 -1.2%Massachusetts 49 3,264.3 3,221.0 -43.3 -1.3%Michigan 50 4,498.4 4,419.9 -78.5 -1.7%South Carolina 51 1,823.0 1,781.7 -41.3 -2.3%Source: U.S. Department of Labor, Bureau of Labor Statistics
Employment numbers are not seasonally adjusted.
Employment numbers are in thousands.
Civilian Un- Unadj.Labor Employ- Employ- Rate RateForce ment ment % %
1983 609,000 547,000 62,000 10.2%1984 628,000 581,000 47,000 7.5%1985 644,000 587,000 57,000 8.9%1986 678,000 616,000 62,000 9.1%1987 682,000 622,000 60,000 8.8%1988 689,000 635,000 54,000 7.8%1989 697,000 651,000 46,000 6.6%1990 707,500 661,500 46,000 6.5%1991 725,900 674,100 51,800 7.1%1992 740,900 688,800 52,100 7.0%1993 756,000 697,800 58,200 7.7%1994 778,100 729,300 48,800 6.3%1995 791,000 741,400 49,600 6.3%1996 797,900 733,600 64,300 8.1%1997 814,200 763,300 50,900 6.3%1998 831,100 779,700 51,400 6.2%1999 809,100 763,600 45,500 5.6%2000 854,600 812,300 42,300 5.0%2001 861,500 819,800 41,700 4.8%2002 877,600 829,800 47,800 5.4%
2002 JAN 868,000 822,400 45,600 5.3% 5.5%FEB 870,300 823,500 46,800 5.4% 5.3%MAR 872,300 825,000 47,300 5.4% 5.3%APR 873,800 826,100 47,700 5.5% 5.2%MAY 875,900 827,700 48,200 5.5% 5.4%JUN 877,700 829,200 48,500 5.5% 6.6%JUL 880,000 831,100 48,900 5.6% 5.9%AUG 879,700 831,500 48,200 5.5% 5.4%SEP 880,300 831,900 48,400 5.5% 5.4%OCT 883,400 835,100 48,300 5.5% 5.2%NOV 884,800 836,600 48,200 5.4% 5.2%DEC 885,000 837,200 47,800 5.4% 5.0%
2003 JAN 890,600 838,900 51,700 5.8% 6.1%FEB 891,500 839,800 51,700 5.8% 5.7%MAR 893,600 841,000 52,600 5.9% 5.7%APR 895,700 843,200 52,500 5.9% 5.6%MAY 898,100 844,400 53,700 6.0% 5.9%JUN 900,900 847,400 53,500 5.9% 7.0%JUL 902,500 847,300 55,200 6.1% 6.5%AUG 898,700 844,300 54,400 6.1% 6.0%SEP 900,400 845,700 54,700 6.1% 5.9%OCT 897,500 843,300 54,200 6.0% 5.7%NOV 897,000 843,500 53,500 6.0% 5.7%DEC 898,400 847,000 51,400 5.7% 5.3%
# CHANGE FROMMonth Ago 1,400 3,500 -2,100 -0.3% -0.4%Year Ago 13,400 9,800 3,600 0.3% 0.3%2 Yrs. Ago 32,800 27,000 5,800 0.4% 0.5%3 Yrs. Ago 33,500 22,700 10,800 1.0% 1.0%
% CHANGE FROMMonth Ago 0.2% 0.4% -3.9%Year Ago 1.5% 1.2% 7.5%2 Yrs. Ago 3.8% 3.3% 12.7%3 Yrs. Ago 3.9% 2.8% 26.6%

-7-
1/ All estimates are made in strict accordance with methodology provided by the U. S. Department of Labor, Bureau of Labor Statistics2/ Metropolitan Statistical Area - Bernalillo, Sandoval & Valencia Counties3/ Metropolitan Statistical Area - DoÒa Ana County4/ Metropolitan Statistical Area - Santa Fe and Los Alamos Counties
New Mexico Labor Force Estimates � Not Seasonally Adjusted 1/
PRELIMINARY DECEMBER 2003 REVISED DECEMBER 2002 Absolute Change Percent ChangeLabor Force Empl. Unemp. Rate Labor Force Empl. Unemp. Rate Labor Force Empl. Unemp. Labor Force Empl. Unemp.
STATEWIDE 895,054 847,930 47,124 5.3% 882,103 838,148 43,955 5.0% 12,951 9,782 3,169 1.5% 1.2% 7.2%Albuquerque MSA 2/ 393,603 376,001 17,602 4.5% 389,840 373,063 16,777 4.3% 3,763 2,938 825 1.0% 0.8% 4.9% Bernalillo 315,635 301,895 13,740 4.4% 312,457 299,536 12,921 4.1% 3,178 2,359 819 1.0% 0.8% 6.3% Sandoval 46,874 44,559 2,315 4.9% 46,628 44,211 2,417 5.2% 246 348 -102 0.5% 0.8% -4.2% Valencia 31,093 29,547 1,546 5.0% 30,755 29,316 1,439 4.7% 338 231 107 1.1% 0.8% 7.4%Las Cruces MSA 3/ 78,592 73,854 4,738 6.0% 75,704 71,594 4,110 5.4% 2,888 2,260 628 3.8% 3.2% 15.3%Santa Fe MSA 4/ 82,091 79,602 2,489 3.0% 79,317 77,360 1,957 2.5% 2,774 2,242 532 3.5% 2.9% 27.2% Los Alamos 10,510 10,338 172 1.6% 10,124 10,047 77 0.8% 386 291 95 3.8% 2.9% 123.4% Santa Fe 71,581 69,264 2,317 3.2% 69,193 67,313 1,880 2.7% 2,388 1,951 437 3.5% 2.9% 23.2%Catron 1,125 1,026 99 8.8% 1,084 1,009 75 6.9% 41 17 24 3.8% 1.7% 32.0%Chaves 25,654 23,659 1,995 7.8% 25,701 23,710 1,991 7.7% -47 -51 4 -0.2% -0.2% 0.2%Cibola 13,595 12,941 654 4.8% 12,868 12,192 676 5.3% 727 749 -22 5.6% 6.1% -3.3%Colfax 6,685 6,295 390 5.8% 6,640 6,247 393 5.9% 45 48 -3 0.7% 0.8% -0.8%Curry 20,880 20,160 720 3.4% 20,719 20,001 718 3.5% 161 159 2 0.8% 0.8% 0.3%De Baca 978 897 81 8.3% 945 906 39 4.1% 33 -9 42 3.5% -1.0% 107.7%Eddy 23,816 22,498 1,318 5.5% 23,714 22,385 1,329 5.6% 102 113 -11 0.4% 0.5% -0.8%Grant 12,466 10,969 1,497 12.0% 13,317 11,675 1,642 12.3% -851 -706 -145 -6.4% -6.0% -8.8%Guadalupe 1,659 1,555 104 6.3% 1,614 1,511 103 6.4% 45 44 1 2.8% 2.9% 1.0%Harding 409 389 20 4.9% 419 399 20 4.8% -10 -10 0 -2.4% -2.5% 0.0%Hidalgo 1,767 1,666 101 5.7% 1,771 1,719 52 2.9% -4 -53 49 -0.2% -3.1% 94.2%Lea 26,313 25,338 975 3.7% 25,983 24,928 1,055 4.1% 330 410 -80 1.3% 1.6% -7.6%Lincoln 8,346 8,017 329 3.9% 8,063 7,762 301 3.7% 283 255 28 3.5% 3.3% 9.3%Luna 10,856 8,704 2,152 19.8% 9,911 8,442 1,469 14.8% 945 262 683 9.5% 3.1% 46.5%McKinley 26,497 24,604 1,893 7.1% 25,935 24,410 1,525 5.9% 562 194 368 2.2% 0.8% 24.1%Mora 1,934 1,656 278 14.4% 1,890 1,643 247 13.1% 44 13 31 2.3% 0.8% 12.6%Otero 21,143 20,021 1,122 5.3% 21,089 19,750 1,339 6.3% 54 271 -217 0.3% 1.4% -16.2%Quay 4,117 3,907 210 5.1% 4,134 3,934 200 4.8% -17 -27 10 -0.4% -0.7% 5.0%Rio Arriba 21,657 20,137 1,520 7.0% 21,495 20,103 1,392 6.5% 162 34 128 0.8% 0.2% 9.2%Roosevelt 8,720 8,499 221 2.5% 8,646 8,372 274 3.2% 74 127 -53 0.9% 1.5% -19.3%San Juan 52,429 48,962 3,467 6.6% 52,355 48,936 3,419 6.5% 74 26 48 0.1% 0.1% 1.4%San Miguel 13,641 12,811 830 6.1% 13,558 12,710 848 6.3% 83 101 -18 0.6% 0.8% -2.1%Sierra 4,368 4,171 197 4.5% 4,381 4,200 181 4.1% -13 -29 16 -0.3% -0.7% 8.8%Socorro 7,246 6,866 380 5.2% 7,131 6,764 367 5.1% 115 102 13 1.6% 1.5% 3.5%Taos 14,563 13,232 1,331 9.1% 14,236 13,109 1,127 7.9% 327 123 204 2.3% 0.9% 18.1%Torrance 7,817 7,465 352 4.5% 7,567 7,293 274 3.6% 250 172 78 3.3% 2.4% 28.5%Union 2,086 2,027 59 2.8% 2,074 2,021 53 2.6% 12 6 6 0.6% 0.3% 11.3%
PRELIMINARY DECEMBER 2003 REVISED NOVEMBER 2003 Absolute Change Percent ChangeLabor Force Empl. Unemp. Rate Labor Force Empl. Unemp. Rate Labor Force Empl. Unemp. Labor Force Empl. Unemp.
STATEWIDE 895,054 847,930 47,124 5.3% 899,390 848,554 50,836 5.7% -4,336 -624 -3,712 -0.5% -0.1% -7.3%Albuquerque MSA 2/ 393,603 376,001 17,602 4.5% 395,829 376,113 19,716 5.0% -2,226 -112 -2,114 -0.6% 0.0% -10.7% Bernalillo 315,635 301,895 13,740 4.4% 317,485 301,985 15,500 4.9% -1,850 -90 -1,760 -0.6% 0.0% -11.4% Sandoval 46,874 44,559 2,315 4.9% 47,064 44,572 2,492 5.3% -190 -13 -177 -0.4% 0.0% -7.1% Valencia 31,093 29,547 1,546 5.0% 31,280 29,556 1,724 5.5% -187 -9 -178 -0.6% 0.0% -10.3%Las Cruces MSA 3/ 78,592 73,854 4,738 6.0% 79,442 74,576 4,866 6.1% -850 -722 -128 -1.1% -1.0% -2.6%Santa Fe MSA 4/ 82,091 79,602 2,489 3.0% 82,143 79,410 2,733 3.3% -52 192 -244 -0.1% 0.2% -8.9% Los Alamos 10,510 10,338 172 1.6% 10,480 10,313 167 1.6% 30 25 5 0.3% 0.2% 3.0% Santa Fe 71,581 69,264 2,317 3.2% 71,663 69,097 2,566 3.6% -82 167 -249 -0.1% 0.2% -9.7%Catron 1,125 1,026 99 8.8% 1,132 1,046 86 7.6% -7 -20 13 -0.6% -1.9% 15.1%Chaves 25,654 23,659 1,995 7.8% 25,702 23,572 2,130 8.3% -48 87 -135 -0.2% 0.4% -6.3%Cibola 13,595 12,941 654 4.8% 13,667 12,912 755 5.5% -72 29 -101 -0.5% 0.2% -13.4%Colfax 6,685 6,295 390 5.8% 6,580 6,112 468 7.1% 105 183 -78 1.6% 3.0% -16.7%Curry 20,880 20,160 720 3.4% 20,790 20,044 746 3.6% 90 116 -26 0.4% 0.6% -3.5%De Baca 978 897 81 8.3% 981 890 91 9.3% -3 7 -10 -0.3% 0.8% -11.0%Eddy 23,816 22,498 1,318 5.5% 23,856 22,448 1,408 5.9% -40 50 -90 -0.2% 0.2% -6.4%Grant 12,466 10,969 1,497 12.0% 12,489 10,965 1,524 12.2% -23 4 -27 -0.2% 0.0% -1.8%Guadalupe 1,659 1,555 104 6.3% 1,649 1,545 104 6.3% 10 10 0 0.6% 0.6% 0.0%Harding 409 389 20 4.9% 412 389 23 5.6% -3 0 -3 -0.7% 0.0% -13.0%Hidalgo 1,767 1,666 101 5.7% 1,905 1,785 120 6.3% -138 -119 -19 -7.2% -6.7% -15.8%Lea 26,313 25,338 975 3.7% 26,242 25,153 1,089 4.1% 71 185 -114 0.3% 0.7% -10.5%Lincoln 8,346 8,017 329 3.9% 8,320 7,961 359 4.3% 26 56 -30 0.3% 0.7% -8.4%Luna 10,856 8,704 2,152 19.8% 11,434 9,547 1,887 16.5% -578 -843 265 -5.1% -8.8% 14.0%McKinley 26,497 24,604 1,893 7.1% 26,500 24,497 2,003 7.6% -3 107 -110 0.0% 0.4% -5.5%Mora 1,934 1,656 278 14.4% 1,940 1,667 273 14.1% -6 -11 5 -0.3% -0.7% 1.8%Otero 21,143 20,021 1,122 5.3% 21,008 19,735 1,273 6.1% 135 286 -151 0.6% 1.4% -11.9%Quay 4,117 3,907 210 5.1% 4,178 3,937 241 5.8% -61 -30 -31 -1.5% -0.8% -12.9%Rio Arriba 21,657 20,137 1,520 7.0% 21,803 20,216 1,587 7.3% -146 -79 -67 -0.7% -0.4% -4.2%Roosevelt 8,720 8,499 221 2.5% 8,825 8,580 245 2.8% -105 -81 -24 -1.2% -0.9% -9.8%San Juan 52,429 48,962 3,467 6.6% 52,680 49,042 3,638 6.9% -251 -80 -171 -0.5% -0.2% -4.7%San Miguel 13,641 12,811 830 6.1% 13,790 12,897 893 6.5% -149 -86 -63 -1.1% -0.7% -7.1%Sierra 4,368 4,171 197 4.5% 4,655 4,459 196 4.2% -287 -288 1 -6.2% -6.5% 0.5%Socorro 7,246 6,866 380 5.2% 7,257 6,866 391 5.4% -11 0 -11 -0.2% 0.0% -2.8%Taos 14,563 13,232 1,331 9.1% 14,338 12,789 1,549 10.8% 225 443 -218 1.6% 3.5% -14.1%Torrance 7,817 7,465 352 4.5% 7,762 7,391 371 4.8% 55 74 -19 0.7% 1.0% -5.1%Union 2,086 2,027 59 2.8% 2,080 2,007 73 3.5% 6 20 -14 0.3% 1.0% -19.2%

-8-
Unemployment Rates in New Mexico (Not Seasonally Adjusted)
For fast and easy access to the latest labor market information, please visit the New Mexico Department of Labor's website.There you will find a wide variety of information and tools for all kinds of people, including job seekers, employers, teachers,grant writers, career counselors, and students. All of our publications, including the one you are reading now, can be accessedonline and are available sooner than if delivered by mail. This website also includes information on Department of Laborprograms, contact names and addresses, and frequently asked questions about Department functions. In addition, all NMDOLemployer forms can be downloaded from our website for easy access. Also provided are links to other related websites,including America's Job Bank for nationwide job searches. All this and more is available on our website at:
Need Labor Market Information?We have several major publications detailing New Mexicoís:
Current economic conditions and trendsWages by occupations and areasLarger employersGrowing jobs with skills and training needsJob market with hints for finding and keeping a job
They are available, at no cost, by dropping by any NMDOL office.
www.dol.state.nm.us
...Check Out Our Website!
PRELIMINARY DECEMBER 2003 REVISED NOVEMBER 2003 REVISED DECEMBER 2002
AREAS RANK RATE AREAS RANK RATE AREAS RANK RATE
LUNA 1 19.8% LUNA 1 16.5% LUNA 1 14.8%MORA 2 14.4% MORA 2 14.1% MORA 2 13.1%GRANT 3 12.0% GRANT 3 12.2% GRANT 3 12.3%TAOS 4 9.1% TAOS 4 10.8% TAOS 4 7.9%CATRON 5 8.8% DE BACA 5 9.3% CHAVES 5 7.7%DE BACA 6 8.3% CHAVES 6 8.3% CATRON 6 6.9%CHAVES 7 7.8% CATRON 7 7.6% SAN JUAN 7 6.5%MCKINLEY 8 7.1% MCKINLEY 8 7.6% RIO ARRIBA 8 6.5%RIO ARRIBA 9 7.0% RIO ARRIBA 9 7.3% GUADALUPE 9 6.4%SAN JUAN 10 6.6% COLFAX 10 7.1% OTERO 10 6.3%GUADALUPE 11 6.3% SAN JUAN 11 6.9% SAN MIGUEL 11 6.3%SAN MIGUEL 12 6.1% SAN MIGUEL 12 6.5% COLFAX 12 5.9%LAS CRUCES MSA 2/ 13 6.0% GUADALUPE 13 6.3% MCKINLEY 13 5.9%COLFAX 14 5.8% HIDALGO 14 6.3% EDDY 14 5.6%HIDALGO 15 5.7% LAS CRUCES MSA 2/ 15 6.1% LAS CRUCES MSA 2/ 15 5.4%EDDY 16 5.5% OTERO 16 6.1% CIBOLA 16 5.3%OTERO 17 5.3% EDDY 17 5.9% SOCORRO 17 5.1%STATEWIDE 5.3% QUAY 18 5.8% STATEWIDE 5.0%SOCORRO 18 5.2% STATEWIDE 5.7% QUAY 18 4.8%QUAY 19 5.1% HARDING 19 5.6% HARDING 19 4.8%HARDING 20 4.9% CIBOLA 20 5.5% ALBUQUERQUE MSA 1/ 20 4.3%CIBOLA 21 4.8% SOCORRO 21 5.4% SIERRA 21 4.1%ALBUQUERQUE MSA 1/ 22 4.5% ALBUQUERQUE MSA 1/ 22 5.0% DE BACA 22 4.1%SIERRA 23 4.5% TORRANCE 23 4.8% LEA 23 4.1%TORRANCE 24 4.5% LINCOLN 24 4.3% LINCOLN 24 3.7%LINCOLN 25 3.9% SIERRA 25 4.2% TORRANCE 25 3.6%LEA 26 3.7% LEA 26 4.1% CURRY 26 3.5%CURRY 27 3.4% CURRY 27 3.6% ROOSEVELT 27 3.2%SANTA FE MSA 3/ 28 3.0% UNION 28 3.5% HIDALGO 28 2.9%UNION 29 2.8% SANTA FE MSA 3/ 29 3.3% UNION 29 2.6%ROOSEVELT 30 2.5% ROOSEVELT 30 2.8% SANTA FE MSA 3/ 30 2.5%
1/ Metropolitan Statistical Area - Bernalillo, Sandoval & Valencia Counties2/ Metropolitan Statistical Area - DoÒa Ana County3/ Metropolitan Statistical Area - Santa Fe and Los Alamos Counties

Unemployment Rate by State (Seasonally Adjusted)
-9-
Preliminary December Revised December2003 2002
State Rank Rate State Rank RateAlaska 1 7.7 Alaska 1 8.4Michigan 2 7.2 Oregon 2 7.3Oregon 3 7.2 Mississippi 3 7.0Washington 4 6.8 Washington 3 7.0District of Columbia 5 6.6 California 5 6.9California 6 6.4 Illinois 6 6.7Illinois 6 6.4 North Carolina 6 6.7Texas 6 6.4 District of Columbia 8 6.6New York 9 6.2 Texas 9 6.5North Carolina 10 6.1 New York 10 6.4South Carolina 10 6.1 Louisiana 11 6.3Ohio 12 6.0 Utah 11 6.3Alabama 13 5.8 Michigan 13 6.2Colorado 13 5.8 South Carolina 13 6.2Louisiana 13 5.8 Idaho 15 6.1Massachusetts 16 5.7 Pennsylvania 15 6.1New Mexico 16 5.7 West Virginia 17 6.1Tennessee 16 5.7 New Jersey 18 6.0United States 5.7 United States 6.0Arkansas 19 5.5 Alabama 19 5.9Kentucky 20 5.4 Arizona 19 5.9New Jersey 21 5.3 Colorado 21 5.8West Virginia 21 5.3 Wisconsin 22 5.7Wisconsin 23 5.2 Ohio 23 5.6Oklahoma 24 5.1 Kentucky 24 5.5Pennsylvania 24 5.1 Massachusetts 24 5.5Connecticut 26 5.0 Missouri 24 5.5Indiana 26 5.0 Rhode Island 24 5.5Maine 26 5.0 Arkansas 28 5.4Mississippi 26 5.0 New Mexico 28 5.4Missouri 26 5.0 Florida 30 5.3Rhode Island 26 5.0 Georgia 30 5.3Arizona 32 4.8 Kansas 32 5.2Idaho 32 4.8 New Hampshire 33 5.0Kansas 32 4.8 Indiana 34 4.9Florida 35 4.7 Nevada 34 4.9Minnesota 35 4.7 Tennessee 34 4.9Utah 35 4.7 Maine 37 4.8Montana 38 4.5 Connecticut 38 4.7Iowa 39 4.4 Montana 38 4.7Maryland 39 4.4 Oklahoma 38 4.7Nevada 39 4.4 Wyoming 41 4.4Delaware 42 4.1 Delaware 42 4.3Georgia 42 4.1 Minnesota 42 4.3Hawaii 42 4.1 Iowa 44 4.2New Hampshire 42 4.1 Maryland 44 4.2Vermont 46 4.0 Hawaii 46 3.9Wyoming 46 4.0 North Dakota 46 3.9Nebraska 48 3.7 Virginia 48 3.8Virginia 49 3.6 Vermont 49 3.7South Dakota 50 3.4 Nebraska 50 3.6North Dakota 51 3.2 South Dakota 51 2.8Source: U.S. Department of Labor, Bureau of Labor Statistics

1.3
1.4
1.5
1.8
2.2
2.5
4.5
5.5
7.6
-0.3
-4.7
-4.5
-2.2
-2.0
Information
Mfg.
Wholesale Trade
Pro & Bus. Services
Financial Activities
Total
Retail Trade
Gov.
Leisure & Hospitality
Trans, Warehsing, & Util.
Other Services
Educ. & Health Services
Const.
Natural Res. & Mining
-10-
Nonagricultural Wage and Salary Employment
New Mexico and Albuquerque Annual Nonfarm Job Growth Rates
NAICS IndustriesDecember 2003
Annual Growth Rates by Industry
Retail Trade12%
Information2%
Financial Activities4%
Pro & Bus. Services11%
Trans, Warehousing,& Utilities 3%
Gov.25%
OtherServices
4%
Natural Res.& Mining
2%
Leisure & Hospitality10%
Educ. & Health Services
13%
Const.6%
Mfg.5%
Wholesale Trade3%
-1.5%
-1.0%
-0.5%
0.0%
0.5%
1.0%
1.5%
2.0%
2.5%
3.0%
3.5%
4.0%
Jan-
00F
eb-0
0
Mar
-00
Apr
-00
May
-00
Jun-
00Ju
l-00
Aug
-00
Sep
-00
Oct
-00
Nov
-00
Dec
-00
Jan-
01F
eb-0
1
Mar
-01
Apr
-01
May
-01
Jun-
01Ju
l-01
Aug
-01
Sep
-01
Oct
-01
Nov
-01
Dec
-01
Jan-
02F
eb-0
2
Mar
-02
Apr
-02
May
-02
Jun-
02Ju
l-02
Aug
-02
Sep
-02
Oct
-02
Nov
-02
Dec
-02
Jan-
03F
eb-0
3
Mar
-03
Apr
-03
May
-03
Jun-
03Ju
l-03
Aug
-03
Sep
-03
Oct
-03
Nov
-03
Dec
-03
New MexicoAlbuquerque

-11-
Nonagricultural Wage and Salary EmploymentPreliminary Revised Revised Change
Dec-03 Nov-03 Dec-02 Monthly Yearly
TOTAL NONAGRICULTURAL EMPLOYMENT 1/ 785,900 784,400 776,100 1,500 9,800
GOODS PRODUCING 97,500 98,700 95,700 -1,200 1,800SERVICES-PROVIDING 688,400 685,700 680,400 2,700 8,000
NATURAL RESOURCES AND MINING 14,200 14,200 13,200 0 1,000Oil & Gas Extraction, Well Drilling 10,600 10,500 9,300 100 1,300Mining, Except Oil and Gas 3,600 3,600 3,800 0 -200
CONSTRUCTION 47,600 48,400 45,100 -800 2,500Construction of Buildings 13,500 13,700 13,100 -200 400
Residential Building Construction 7,100 7,200 6,500 -100 600Heavy and Civil Engineering Construction 7,900 8,400 8,300 -500 -400Specialty Trade Contractors 26,200 26,300 23,700 -100 2,500
MANUFACTURING 35,700 36,100 37,400 -400 -1,700Durable Goods 24,900 25,000 26,500 -100 -1,600
Computer and Electronic Products 10,300 10,400 11,100 -100 -800 Semiconductor and Other Electronics 7,100 7,300 7,700 -200 -600
Non-Durable Goods 10,800 11,100 10,900 -300 -100
WHOLESALE TRADE 22,000 22,200 22,500 -200 -500
RETAIL TRADE 95,300 93,600 94,000 1,700 1,300Motor Vehicle and Parts Dealers 12,700 12,600 12,500 100 200Food and Beverage Stores 13,100 13,100 13,900 0 -800General Merchandise Stores 22,500 21,600 20,500 900 2,000 Department Stores 7,700 7,300 8,600 400 -900 Other General Merchandise Stores 15,600 14,400 11,700 1,200 3,900Miscellaneous Store Retailers 7,300 7,200 7,500 100 -200Nonstore Retailers 3,000 3,000 3,100 0 -100
TRANSPORTATION, WAREHOUSING, AND UTILITIES 23,500 23,400 23,000 100 500Utilities 4,000 3,900 4,000 100 0Transportation and Warehousing 19,500 19,500 19,000 0 500
Truck Transportation 6,600 6,700 6,400 -100 200
INFORMATION 16,200 16,000 17,000 200 -800Telecommunications 7,700 7,500 8,100 200 -400
FINANCIAL ACTIVITIES 34,400 34,100 34,600 300 -200Finance and Insurance 24,000 23,800 24,100 200 -100
Credit Intermediation and Related Activities 12,500 12,500 12,300 0 200Insurance Carriers and Related Activities 9,600 9,500 10,000 100 -400
Real Estate and Rental and Leasing 10,400 10,300 10,500 100 -100
PROFESSIONAL AND BUSINESS SERVICES 89,200 89,200 91,000 0 -1,800Professional, Scientific, and Technical 41,400 41,100 40,100 300 1,300
Architectural, Engineering, and Related 10,500 10,400 10,900 100 -400Scientific Research and Development 13,300 13,200 12,800 100 500
Management of Companies and Enterprises 5,100 5,100 5,300 0 -200Administrative & Support & Waste Mgt & Remediation Services 42,700 43,000 45,600 -300 -2,900
Employment Services 16,700 16,800 18,700 -100 -2,000Business Support Services 5,000 5,200 6,200 -200 -1,200
EDUCATIONAL AND HEALTH SERVICES 101,400 101,200 97,000 200 4,400Educational Services 13,200 13,600 13,100 -400 100
Health Care and Social Assistance 88,200 87,600 83,900 600 4,300Ambulatory Health Care Services 33,700 33,400 31,200 300 2,500
Offices of Physicians 9,800 9,800 9,600 0 200Outpatient Care Centers 4,900 4,900 4,900 0 0Home Health Care Services 8,900 8,800 7,100 100 1,800
Hospitals 21,300 21,200 20,900 100 400Nursing and Residential Care Facilities 13,100 12,800 12,700 300 400
Nursing Care Facilities 6,800 6,600 6,500 200 300Social Assistance 20,100 20,200 19,100 -100 1,000
LEISURE AND HOSPITALITY 80,400 80,400 79,000 0 1,400Arts, Entertainment, and Recreation 7,200 7,000 7,000 200 200
Accommodation and Food Services 73,200 73,400 71,900 -200 1,300Accommodation 13,100 13,200 13,400 -100 -300Food Services and Drinking Places 60,100 60,200 58,600 -100 1,500
Full-Service Restaurants 28,500 28,900 28,500 -400 0Limited-Service Eating Places 25,100 24,900 24,300 200 800
OTHER SERVICES 28,500 28,600 27,800 -100 700Repair and Maintenance 7,500 7,500 7,400 0 100
GOVERNMENT 197,500 197,000 194,500 500 3,000Federal Government 30,200 29,700 30,400 500 -200State Government 2/ 67,300 67,800 66,200 -500 1,100
State Government Education 28,400 28,800 27,900 -400 500Local Government 100,000 99,500 97,900 500 2,100
Local Government Education 54,500 54,600 53,900 -100 6001/ Estimates include all full-time and part-time wage and salary workers who worked or received pay during the pay period which includes the 12th day of the month.
2/ Includes employees of Los Alamos National Laboratory, federally funded state programs, state supported universities, and the three branches of government.
NEW MEXICO

-12-
Nonagricultural Wage and Salary Employment
Preliminary Revised Revised Change
Dec-03 Nov-03 Dec-02 Monthly Yearly
TOTAL NONAGRICULTURAL EMPLOYMENT 1/ 367,300 366,800 363,600 500 3,700
GOODS PRODUCING 47,300 48,100 46,600 -800 700
SERVICES-PROVIDING 320,000 318,700 317,000 1,300 3,000
NATURAL RESOURCES AND MINING & CONSTRUCTION 24,000 24,500 22,300 -500 1,700
Specialty Trade Contractors 14,700 14,900 13,000 -200 1,700
MANUFACTURING 23,300 23,600 24,300 -300 -1,000
Computer and Electronic Products 9,700 9,900 10,300 -200 -600
Semiconductor and Other Electronics 6,900 7,100 7,400 -200 -500
WHOLESALE TRADE 13,000 13,200 13,300 -200 -300
RETAIL TRADE 44,300 43,400 43,600 900 700
Building Material and Garden Equipment 3,800 4,000 3,800 -200 0
Food and Beverage Stores 5,000 4,900 5,100 100 -100
General Merchandise Stores 9,300 9,100 8,400 200 900
Department Stores 4,200 4,100 4,400 100 -200
TRANSPORTATION, WAREHOUSING, AND UTILITIES 10,500 10,500 10,600 0 -100
Transportation and Warehousing 9,900 9,800 9,900 100 0
INFORMATION 10,400 10,100 10,700 300 -300
Telecommunications 5,800 5,600 6,000 200 -200
FINANCIAL ACTIVITIES 19,000 18,900 19,200 100 -200
Finance and Insurance 13,600 13,500 13,700 100 -100
Credit Intermediation and Related Activities 5,800 5,800 5,600 0 200
Depository Credit Intermediation 4,000 3,900 3,800 100 200
Insurance Carriers 4,900 4,900 5,200 0 -300
PROFESSIONAL AND BUSINESS SERVICES 57,500 57,600 57,800 -100 -300
Professional, Scientific, and Technical 28,300 28,200 27,400 100 900
Scientific Research and Development 11,400 11,300 10,900 100 500
Management of Companies and Enterprises 4,100 4,100 4,200 0 -100
Administrative & Support & Waste Mgt & Remediation Services 25,100 25,300 26,200 -200 -1,100
Employment Services 12,200 12,400 13,100 -200 -900
Business Support Services 3,100 3,100 3,000 0 100
EDUCATIONAL AND HEALTH SERVICES 43,800 43,800 42,700 0 1,100
Health Care and Social Assistance 38,700 38,600 37,600 100 1,100
Ambulatory Health Care Services 15,900 15,800 15,000 100 900
Hospitals 9,400 9,400 9,200 0 200
LEISURE AND HOSPITALITY 35,300 35,400 34,000 -100 1,300
Accommodation and Food Services 32,700 32,900 31,200 -200 1,500
Food Services and Drinking Places 27,900 28,000 26,400 -100 1,500
Full-Service Restaurants 13,000 13,200 12,200 -200 800
OTHER SERVICES 11,900 12,100 11,700 -200 200
GOVERNMENT 74,300 73,700 73,400 600 900
Federal Government 14,100 13,800 14,400 300 -300
State Government /2 24,500 24,400 24,000 100 500
Local Government 35,700 35,500 35,000 200 700
1/ Estimates include all full-time and part-time wage and salary workers who worked or received pay during the pay period which included the 12th day of the month.
2/ Includes employees of federally funded state programs, state supported universities, and the three branches of state government.
ALBUQUERQUE

-13-
Nonagricultural Wage and Salary Employment
Preliminary Revised Revised ChangeDec-03 Nov-03 Dec-02 Monthly Yearly
TOTAL NONAGRICULTURAL EMPLOYMENT /1 62,800 63,000 60,400 -200 2,400GOODS PRODUCING 6,700 6,700 6,400 0 300SERVICE PRODUCING 56,100 56,300 54,000 -200 2,100
NATURAL RESOURCES MINING & CONSTRUCTION 3,700 3,700 3,400 0 300
MANUFACTURING 3,000 3,000 3,000 0 0
WHOLESALE TRADE 1,200 1,200 1,100 0 100
RETAIL TRADE 7,100 7,000 6,700 100 400
TRANSPORTATION, WAREHOUSING, AND UTILITIES 1,600 1,600 1,500 0 100
INFORMATION 1,200 1,200 1,100 0 100
FINANCIAL ACTIVITIES 2,200 2,200 2,200 0 0
PROFESSIONAL & BUSINESS SERVICES 5,100 5,100 5,100 0 0 Administrative & Support & Waste Mgt & Remediation Services 2,500 2,500 2,500 0 0
EDUCATIONAL AND HEALTH SERVICES 9,100 9,100 8,500 0 600 Health Care & Social Assistance 8,500 8,500 7,900 0 600
LEISURE AND HOSPITALITY 6,500 6,400 6,300 100 200 Food Service & Drinking Places 4,800 4,800 4,600 0 200
OTHER SERVICES 1,500 1,400 1,400 100 100
GOVERNMENT 20,600 21,100 20,100 -500 500 Federal 3,500 3,600 3,600 -100 -100 State 8,800 9,300 8,400 -500 400 Local 8,300 8,200 8,100 100 200
Preliminary Revised Revised ChangeDec-03 Nov-03 Dec-02 Monthly Yearly
TOTAL NONAGRICULTURAL EMPLOYMENT /1 79,500 79,300 78,300 200 1,200GOODS PRODUCING 5,700 5,800 5,800 -100 -100SERVICE PRODUCING 73,800 73,500 72,500 300 1,300
NATURAL RESOURCES, MINING & CONSTRUCTION 4,500 4,600 4,500 -100 0
MANUFACTURING 1,200 1,200 1,300 0 -100
WHOLESALE TRADE 1,100 1,100 1,100 0 0
RETAIL TRADE 9,400 9,300 9,200 100 200
TRANSPORTATION, WAREHOUSING, AND UTILITIES 700 700 800 0 -100
INFORMATION 1,000 1,000 1,000 0 0
FINANCIAL ACTIVITIES 3,500 3,400 3,400 100 100
PROFESSIONAL & BUSINESS SERVICES 8,900 8,900 8,600 0 300 Administrative & Support & Waste Mgt & Remediation Services 4,600 4,500 4,300 100 300
EDUCATIONAL AND HEALTH SERVICES 9,200 9,200 8,800 0 400 Health Care & Social Assistance 7,300 7,200 6,900 100 400
LEISURE AND HOSPITALITY 9,400 9,300 9,500 100 -100 Food Service & Drinking Places 5,900 5,900 5,800 0 100
OTHER SERVICES 3,200 3,200 3,000 0 200
GOVERNMENT 27,400 27,400 27,100 0 300 Federal 1,500 1,400 1,500 100 0 State /2 18,400 18,400 18,200 0 200 Local 7,500 7,600 7,400 -100 100
1/ Estimates include all full-time and part-time wage and salary workers who worked or received pay during the pay period which included the 12th day of the month.
2/ Includes employees of Los Alamos National Laboratory, federally funded state programs, state supported universities, and the three branches of state government.
LAS CRUCES MSA
SANTA FE MSA

Nonagricultural Wage and Salary Employment
- Seasonally Adjusted -
-14-
1/ Total includes the Information sector, which is not seasonally adjusted.
LaborMarketReportTo be placed on our mailing list,or if your address has changed,or if you do NOT desire to con-tinue receiving this publication,please call or write to:
New MexicoDepartment of LaborEconomic Research& AnalysisP.O. Box 1928Albuquerque, NM 87103Phone: (505) 841-8673
NEW MEXICO Preliminary Revised Monthly
Dec-03 Nov-03 Change
TOTAL NONAGRICULTURAL EMPLOYMENT 1/ 781,600 780,000 1,600
NATURAL RESOURCES AND MINING 14,100 14,000 100
CONSTRUCTION 47,700 47,900 -200
MANUFACTURING 36,500 36,600 -100
TRADE, TRANSPORTATION AND UTILITIES 136,800 136,500 300
INFORMATION (Not Seasonally Adjusted) 16,200 16,000 200
FINANCIAL ACTIVITIES 34,400 34,200 200
PROFESSIONAL AND BUSINESS SERVICES 89,400 89,300 100
EDUCATIONAL AND HEALTH SERVICES 99,800 99,500 300
LEISURE AND HOSPITALITY 81,500 81,400 100
OTHER SERVICES 29,300 29,700 -400
GOVERNMENT 195,900 194,900 1,000
-15-
New Mexico Unemployment Insurance
Average Hours and EarningsPrepared in cooperation with the U.S. Bureau of Labor Statistics
AVERAGE WEEKLY EARNINGS AVERAGE WEEKLY HOURS AVERAGE HOURLY EARNINGS
NEW MEXICO Dec 03 Nov 03 Dec 02 Dec 03 Nov 03 Dec 02 Dec 03 Nov 03 Dec 02
NATURAL RES. & MINING $763.78 $769.73 $757.20 44.2 44.7 44.1 17.28 17.22 17.17
CONSTRUCTION $607.02 $590.13 $592.18 40.2 39.5 39.4 15.10 14.94 15.03
MANUFACTURING $532.58 $517.37 $526.03 40.5 40.2 39.7 13.15 12.87 13.25
WHOLESALE TRADE $511.41 $514.84 $499.80 34.3 34.3 35.0 14.91 15.01 14.28
RETAIL TRADE $346.50 $333.44 $317.36 33.0 32.0 31.8 10.50 10.42 9.98
FINANCIAL ACTIVITIES $497.93 $522.14 $489.71 35.9 36.9 36.6 13.87 14.15 13.38
ALBUQUERQUE MSA Dec 03 Nov 03 Dec 02 Dec 03 Nov 03 Dec 02 Dec 03 Nov 03 Dec 02
MANUFACTURING $613.82 $593.35 $606.44 41.7 40.2 39.1 14.72 14.76 15.51
Estimates include all full-time and part-time wage and salary workers who worked or received pay during the pay period which includedthe 12th day of the month. Self-employed, family workers, household workers and members of the Armed Forces are excluded. Theaverage earnings are "gross" reflecting not only changes in basic hourly and incentive wage rates but also such factors as premiumpremium pay for overtime and shift differentials. The work week information relates to the average hours for which pay was received,and is different from standard or scheduled hours due to absenteeism, labor turnover, part time work, overtime work etc.
U.S. Consumer Price IndexIndex Base Year 1982-84 = 100 PERCENT CHANGE
Dec 03 Nov 03 Dec 02 Month to Month Year to YearCPI-U 184.3 184.5 180.9 -0.1% 1.9%CPI-W 179.9 180.2 177.0 -0.2% 1.6% *CPI-U - All Urban Consumers *CPI-W - Urban Wage Earners and Clerical Workers - Source: U.S. Department of Labor, Bureau of Labor Statistics
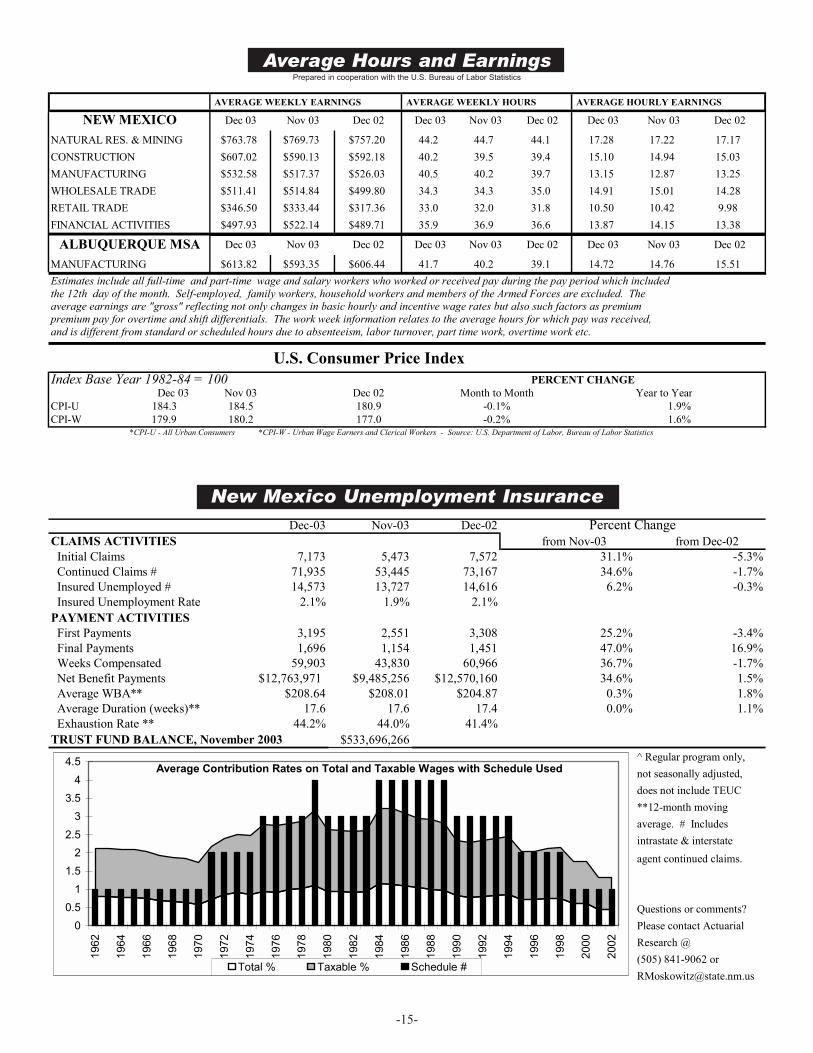
Dec-03 Nov-03 Dec-02 Percent ChangeCLAIMS ACTIVITIES from Nov-03 from Dec-02 Initial Claims 7,173 5,473 7,572 31.1% -5.3% Continued Claims # 71,935 53,445 73,167 34.6% -1.7% Insured Unemployed # 14,573 13,727 14,616 6.2% -0.3% Insured Unemployment Rate 2.1% 1.9% 2.1%PAYMENT ACTIVITIES First Payments 3,195 2,551 3,308 25.2% -3.4% Final Payments 1,696 1,154 1,451 47.0% 16.9% Weeks Compensated 59,903 43,830 60,966 36.7% -1.7% Net Benefit Payments $12,763,971 $9,485,256 $12,570,160 34.6% 1.5% Average WBA** $208.64 $208.01 $204.87 0.3% 1.8% Average Duration (weeks)** 17.6 17.6 17.4 0.0% 1.1% Exhaustion Rate ** 44.2% 44.0% 41.4%TRUST FUND BALANCE, November 2003 $533,696,266
^ Regular program only,
not seasonally adjusted,
does not include TEUC
**12-month moving
average. # Includes
intrastate & interstate
agent continued claims.
Questions or comments?
Please contact Actuarial
Research @
(505) 841-9062 or
Average Contribution Rates on Total and Taxable Wages with Schedule Used
0
0.5
1
1.5
2
2.5
3
3.5
4
4.5
196
2
196
4
196
6
196
8
197
0
197
2
197
4
197
6
197
8
198
0
198
2
198
4
198
6
198
8
199
0
199
2
199
4
199
6
199
8
200
0
200
2
Total % Taxable % Schedule #
-16-
(SOURCES: Published articles, government documents, private and public sector news releases and reports from local New Mexico Department of Labor Workforce Centers. In most cases, no attempt is made to verify accuracy of information from the above sources.)
New Mexico Area Economic Activity
Statewide:
Commuter rail service for Albuquerque has been considered ninetimes in the past thirty years but has so far not proceeded past thefeasibility study phase. Governor Richardson is very interested inadvancing commuter rail and says that he wants to make decisions,not see more studies. He has directed $1 million to jump start localrail service between Bernalillo and Belen to reduce local traffic on I-25. The more ambitious linking of commuter service between Albu-querque and Santa Fe might come later if more funds are available.
Albuquerque Area, Bernalillo County:
The City of Albuquerque is laying 14 miles of underground piping toupgrade the infrastructure in area around the Double Eagle II airport.The underground piping will include fiber-optic conduit in addition tosewer and water. The improvements are needed to support the futureEclipse Aviation manufacturing plant and other industries that willlocate near the airport.
The effort to revitalize downtown Albuquerque is showing resultsin the form of new enterprises being attracted to the area and theimprovement of existing businesses. In the past year, 21 businesseshave opened or moved to the downtown area. New restaurants andretail stores have increased the choices available to residents of thenew downtown lofts at Albuquerque High and to visitors to the area.Entertainment has been a long-time draw for downtown, and theowners of the Century Theaters chain report that the Century 14Downtown is one of the most successful 14-screen theaters that theyoperate.
Albuquerqueís new Graham Central Station nightclub opened atthe corner of San Mateo and Montgomery Boulevard. The owners ofthe new 33,000-square-foot nightclub had hoped to have a maximumoccupancy of 2,000 patrons, but failure to comply with city parkingrequirements forced a reduction to 1,260 occupants.
Wal-Mart purchased a 20-acre plot in the South Valley to be used asthe site of the companyís ninth Albuquerque store. The starting datefor construction of the new store, located at the corner of Rio Bravoand Coors Boulevard, has not yet been announced. About 475 full-and part-time workers will be employed in the 203,000-square-footsupercenter.
The hoped for sale of the Phillips Semiconductor plant evaporatedwhen the Hong Kong-base purchaser backed out of the deal. Interna-tional Technical Trade Co. Ltd. was to have bought out the now-closed plant for $18 million, but after some consideration, felt that thedeal was too great a risk and withdrew its offer. The state of NewMexico had, at one time, offered to co-invest $15 million in theproject.
During the first part of 2004, Blue Cross and Blue Shield of NewMexico plans to add about 100 more workers for claims processingand customer service. The new workers will join about 250 otheremployees at the companyís Full Service Unit in the former HomeBase store on Alexander Blvd.
Honeywell received a $150 million contract to develop a new mili-tary information system that will allow commanders to gather data onthe status of battlefield resources. The company will be adding about100 high-paying jobs to its Albuquerque aerospace operations overthe next two years. Early this year, the company expects to hire about20 experts in computer science, network design and systems integra-tion.
Sandia Pueblo, Bernalillo County:
Sandia Pueblo is building a 228-room hotel and an 18-hole golfcourse adjacent to the Puebloís casino. The hotel will feature 38,000square feet of meeting space and cost about $80 million to build. Theproject is expected to create about 300 jobs when it is completed inthe fall of 2005.
Roswell Area, Chaves County:
Millennium Transit Services LLC has completed the purchase ofthe former Novabus factory and plans to start producing buses by latespring or early summer. The company is hoping to hire formerNovabus workers.
Clovis Area, Curry County:
The stateís Job Training Incentive Program Board awarded $350,000to Burlington Northern Santa Fe Railroad to train 35 new workersat the Clovis railyard. The workers will clean and refurbish rail carsfor BNSF. The company has also announced that it will hire a total ofabout 130 new workers for the Clovis yard.
Eunice Area, Lea County:
Questions about the handling of waste from Louisiana EnergyServiceís proposed uranium enrichment plant have stopped the projectfrom going forward in Louisiana and Tennessee and threaten to derailthe project in Eunice. To gain support, LES officials assured Gover-nor Bill Richardson that no waste would be stored in New Mexicolong term. After obtaining the Governorís endorsement for the

-17-
LaborMarketReportTo be placed on our mailing list,or if your address has changed,or if you do NOT desire to con-tinue receiving this publication,please call or write to:
New MexicoDepartment of LaborEconomic Research& AnalysisP.O. Box 1928Albuquerque, NM 87103Phone: (505) 841-8673
project, the company unsuccessfully sought to have the U.S. Depart-ment of Energy accept waste at government facilities from privateenrichment companies. At present, there is no private company in thecountry than can process the high-level radioactive waste into a formthat can be disposed of as low-level waste. Both the Governor andSenator Domenici are seeking a prohibition against long-term wastestorage in New Mexico as part of the companyís license agreement.
Los Alamos Area, Los Alamos County:
A new four-screen movie theater called the Reel Deal opened in LosAlamos in mid-December. The new theater has seating for almost500 patrons.
EspaÒola Area, Rio Arriba County:
EspaÒola Mayor Richard Lucero and developer Demetrios Delleportastook part in a groundbreaking ceremony marking the start of construc-tion of a 175,000-square-foot shopping center on Riverside Drive.The new center will have a Home Depot as its anchor store. Whenopened in July 2004, the Home Depot will provide about 300 jobs.
Bernalillo Area, Sandoval County:
Construction of a new Walgreenís drug store is underway at thecorner of NM 550 and Camino del Pueblo. The 20,000-square-footWalgreenís is the anchor store for a 40,000-square-foot shoppingcenter. The center will also include a combination Baskin-Robbinsand Dunkin Donuts store and a Movie Gallery video rental store. TheWalgreenís is expected to open later this spring.
Rio Rancho Area, Sandoval County:
Sparton Electronics is closing its Rio Rancho manufacturing plant at4901 Rockaway and moving to Albuquerque. The company had beenin Rio Rancho for 27 years and employs about 130 people. The110,000-square-foot former Honeywell manufacturing plant, locatedat 8500 Bluewater, will be remodeled as Spartonís new facility.
Construction of Rio Ranchoís first big box store, a 137,000-square-foot Home Depot, started in January. The new store is expected toopen later this year and will employ over 100 people. The new storewill feature Home Depotís largest New Mexico garden center.
Santa Fe Area, Santa Fe County:
The College Plaza Shopping Center has been selected as the home fora new Ace Hardware Store. The store is in half of the long-vacantformer Albertsonís supermarket at the corner of St. Michaelís Driveand Cerrillos Road. The hardware store will carry paint, tools,plumbing and electrical supplies and some housewares. About 30 fulland part-time workers will be needed to staff the store.
Mountainair Area, Torrance County:
Mountainair is home to T-Shirt King, selected as one of the top 50apparel sites on the Internet. The company operates exclusively as anonline business and employs 18 workers. The companyís web site,www.tshirtking.com,has over a million visitors each month.

-18-
High Tech Employers / Job Seekers
www.nmtechjobs.org
Technology Jobs for the Third Millennium
Visit the FreeNew Mexico
High-Tech Job Site
www.techventures.org

-19-
Economic Impact Summary ofPhilips Semiconductor Closing in Bernalillo County
1.) This analysis assumes a peak employment at Philips Semiconductors of 1,200 employees,which is the level that has been reported in the press. The analysis assumes that the Philipsplant closed in 2003. All monetary amounts have been adjusted to reflect the 2004 pricelevel.
2.) After the initial employment impact of 1,200, there would be an indirect impact of 940 andan induced impact of 970 for a total employment impact of 3,110. Indirect effects are theeffects of the initial change in employment on other industries. Induced effects are theimpacts of the initial and indirect effects on household expenditures. The employmentmultiplier would be about 2.6, meaning that there would be a very significant additionalemployment impact past the initial impact of 1,200.
3.) The total value-added impact of closure of the Philips Semiconductor plant would be$220.8 million in 2004 dollars. The direct impact would be $122.1 million, indirect impact$52.6 million and induced impact $46.1 million. Value added is defined as the paymentsmade by industry to workers, interest, profits and indirect business taxes.
4.) The labor income impact from the closure of the Philips Semiconductor plant in Albuquer-que would be $138.6 million, with a direct impact of $75.6 million, indirect impact of$36.1 million and an induced impact of $27.1 million. Labor income represents all formsof income from employment: the sum of employee compensation and proprietorís income.
5.) Labor income impact is composed of employee compensation and proprietorís income.The employee compensation impact would be $130.3 million. The proprietorís incomeimpact would be $8.3 million.
6.) The closure of Philips Semiconductors in Albuquerque would also result in an impact of$71.9 million in ëother property incomeí and generate indirect businesses taxes of $10.2million. ëOther property incomeí consists of payments for rents, royalties, and dividends.Indirect business taxes consist of excise taxes, property taxes, fees, licenses, and salestaxes paid by businesses. These taxes do not include taxes on profits or income.
7.) The total industry output impact of the Philips Semiconductors plant in Albuquerquewould be $420.7 million. Total industry output is the value of production by industry for agiven time period.
8.) The total tax impact effects of the closure of the Philips Semiconductors plant are esti-mated to be $47.3 million, with indirect business taxes of $10.2 million.
Prepared by: Gerry Bradley, Economic Research & Analysis Bureau [email protected]

New Mexico Department of LaborEconomic Research and Analysis (CC6097)P.O. Box 1928Albuquerque, New Mexico 87103
Official BusinessPenalty for Private Use, $300
To be placed on our mailing list, orif your address has changed, or ifyou do NOT desire to continue re-ceiving this publication, please callor write to:
New Mexico Labor Market Reportis a monthly publication from the New MexicoDepartment of Labor
Gerry Bradley, ER&A Manager Economic Research and Analysis Bureau
Major Contributors: Mark Boyd, Economist Susan Beard, Economist Karl Romero, Graphic Artist
Other Contributors: Herb Greenwall, Economist Supervisor Theresa Sandoval, Economist Rachel Moskowitz, Economist
PRSRT STDUS POSTAGEPAIDALBUQUERQUE, NMPERMIT No. G-12
New MexicoDepartment of LaborEconomic Research & AnalysisP.O. Box 1928Albuquerque, NM 87103Phone: (505) 841-8673Fax: (505) 841-9007
Attention!Employment data revised to the 2003
Benchmark will be released next month.The next Labor Market Report will be
issued mid-March 2004.