new jersey geological survey - nj
TRANSCRIPT

NEW JERSEY GEOLOGICAL SURVEY

NEW JERSEY GEOLOGICAL SURVEY

NEW JERSEY GEOLOGICAL SURVEY
NEW JERSEY GEOLOGICAL SURVEY

REPORTS OF THE DEPARTMENT OF CONSERVATION AND DEVELOPMENT
STATE OF NEW JERSEY
In cooperation with the United States Geological Survey--
Division of Ground Water--0. E. ME~NZER, Geologist in Charge
BULLETIN 35
GROUND WATER SUPPLIES in the VICINITY of ASBURY PARK
BY
DAVID G. THOMPSON
Published, 1930
NEW JERSEY GEOLOGICAL SURVEY

Board of Conservation and Development
STATE HOUSE ANNEX, TRENTON, N. J.
. . . . . . . . . . . . HENRY M. MOF:LI.HR, P I - P S ~ ~ P I I ~ . Weehawken . . . . . . . . . . . . . . . . . . . . . . PERCIVAL CHKYSTIE High Bridge . . . . . . . . . . . . . . . . . . . . . . A:.nen,r W. D ~ n r i ~ . .Plainfidd
Wrr,r,rn\r R. F1.m IYFI: . . . . . . . . .Few Brunswick . . . . . . . . . . . . . . . . . . . . . . . . J O H N I,. K'sER.. .Bordentown
. . . . . . . . . . . . . . . . . . ROWARE I?. McCrrs..r~ir.i.. Moi~tclair . . . . . . . . . . . . . . . . . . . . . . . . . WALTER E. Iiolt~. Burlingto11 . . . . . . . . . . . . . . . . . . . . C~IVEX \VI x s ~ o s %iclldham Twp.
/P. O. Gladstone)
F E X R Y R. K'OiilliEL, Director nrtd Clzirf, nic,ision of
Geology n~rd Tepogrnphj..
CHARLES P. WILBER. State ~orc . r ter and Chief, Di- vfsio11 of Poresrs Q I I ~ Parks.
NEW JERSEY GEOLOGICAL SURVEY

CONTENTS
FACE
. . . . . . . . . . . . . . . . . . . . . . . . . . . . . . . . . . . . . . . . . . . . . . . . . . . . . . Introduction 9 Water suppIies of the region . . . . . . . . . . . . . . . . . . . . . . . . . . . . . . . . . . . . . 9 Water Horizons . . . . . . . . . . . . . . . . . . . . . . . . . . . . . . . . . . . . . . . . . . . . . . 12
. . . . . . . . . . . . . . . . . . . . . . . . . . . . . . . . . . . . . . . . . . . . . . . . . . . Consumption 14
. . . . . . . . . . . . . . . . . . . . . . . . . . . . . . . . . . . . . . . . . . . . . . . . Quality of water 19
Water-bearing capacity of formations . . . . . . . . . . . . . . . . . . . . . . . . . . . . . 22
General statement . . . . . . . . . . . . . . . . . . . . . . . . . . . . . . . . . . . . . . . . 22 Mount Laurel-Wenonah formation . . . . . . . . . . . . . . . . . . . . . . . . . 22
Pumping testa of Avon wells . . . . . . . . . . . . . . . . . . . . . . . . . . . . . 22 . . . . . . . . . . . . . . . . . . . . . . . . . . . . . . Descsiption of the tests 22
. . . . . . . . . . . . . . . . . . . . . . . . . . . . . . . . . . . . . . . . . . Conclusiona 25
Effect of seasonal changes in pumping . . . . . . . . . . . . . . . . . . . 28
Fluctuations of head . . . . . . . . . . . . . . . . . . . . . . . . . . . . . . . . . . ?S
. . . . . . . . . . . . . . . . . . . . . . FIuctuations of yield of wells 32
. . . . . . . . . . . . . . . . . . . . . . . . . . . . . . . . . . Testa on sand samples 36
EEect of future increases in pumpage . . . . . . . . . . . . . . . . 38
Eaglishtown formation 41
Details . . . . . . . . . . . . . . . . . . . . . . . . . . . . . . . . . . . . . . . . . . . . . . . . 41
Summary . . . . . . . . . . . . . . . . . . . . . . . . . . . . . . . . . . . . . . . . . . . . . . . . 42
. . . . . . . . . . . . . . . . . . . . . . . . . . . . . . . . . . . . . . . . . . . . Rayitan formation 42
Possibility of contaminatjon of weIls by salt water . . . . . . . . . . . . . . . 44
General summary and conclusions . . . . . . . . . . . . . . . . . . . . . . . . . . . . 47
Recommendations for future work . . . . . . . . . . . . . . . . . . . . . . . . . . . . . . . 48
Index . . . . . . . . . . . . . . . . . . . . . . . . . . . . . . . . . . . . . . . . . . . . . . . . . . . . . . . . . 49
NEW JERSEY GEOLOGICAL SURVEY

LIST OF ILLUSTRATIONS
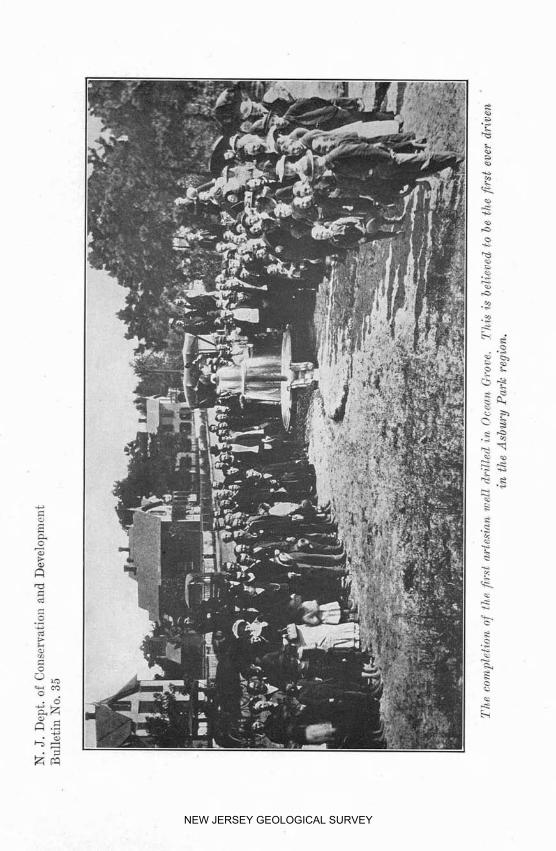
PAGE Completion of the first artesian well clrilled in Ocean Grove. .Frontispiece Fig. 1.-Grap showing the movement of the water Ievel fn Avon
well KO. 1 during the test of well No. 2, November 12,
................................................. 1924 23
Fig. 2.-Graph shewing the fluctuation of the water level in Avon well No. 1, Riggs and Casino wells, the yield of Avon well
. . . . So. 1 and daily pumpage of the Avon welIs, 1924-1925 29
Fig. 3.-Typical Venturi chart, showing decrease In yield of the we11
Auring pumping period . . . . . . . . . . . . . . . . . . . . . . . . . . . . . . . . . 33
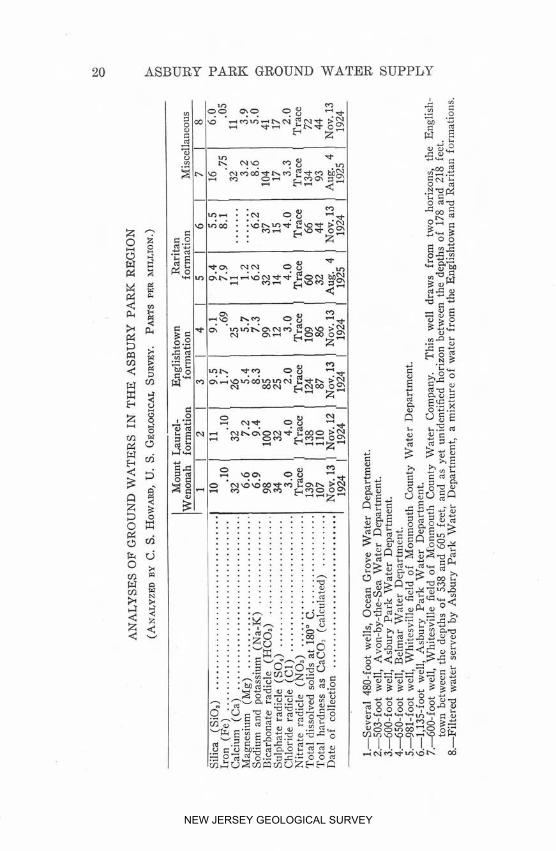
Fig. 4.-Graph showing seasonal fluctuation in the yield of Avon
welIs No. 1 and No. 2 . . . . . . . . . . . . . . . . . . . . . . . . . . . . . . . . . 55
NEW JERSEY GEOLOGICAL SURVEY
FOREWORD
This is one of several reports on the underground water resources of selected areas of New Jersey, made in cooperation with the United States Geo'logical Survey, by the Division of TITaters, 8. T. Critchlon., Chief.
The report was prepared by David G. Thompson of the Federal Survey, but its publication has been somewhat delayed. In July, 1929, the work and personnel of the Division of Waters mas transferred from the Department of Conservation and Development to the Btate Water Policy Commission, but since the investigations covered by this report were completed and the report written before this transfer, it is puh- lished as a report of the Department of Conservation and Develop- ment.
Other repo.rts on the Camden area and the Canoe Brook area will be
published shedly. HESRP B. KUHNEL,
3laCo Geologist and Director. March 1, 1930.
NEW JERSEY GEOLOGICAL SURVEY

NEW JERSEY GEOLOGICAL SURVEY

GROUND WATER SUPPLIES IN THE VICINITY OF MBURY PARK
INTRODUCTION
Observations on ground water conditions in t h e vicinity of Asbuxy Park have been made by the writer since September, 1924. The study has involved prixleipdly the formation which supplies the wells of the Avon-by-the-Sea, Water Department, but some information has been obtained in regard to other water-bearing formations in the region. In collecting the field data the writer has enjoyed the cooperation
of officida and employees of the water departments of Asbury Park, the Ocean Grove Association, Avon-by-the-Sea, and Belmar, of the Monmouth County Water Company, of Mr. Addison H. Eiggs and
' the Casino Ice Compmy, owners of private wellg and o f the Lagne- New York Company which installed weIls for the Borough of Avon and Monmouth County Water Company.
WATER SUPPLIES OF THE REGION
Asbuw~ Park.-The Water Department of Asbury Parlr supplies part of the City oi Asbury Park and the portion of Neptune Township which adjoins it. The water is obtained from eight wells situated in an area of only about 150 by 150 feet. Three of the wells are 600 feet deep, with casings from 4% to 6 inches in diameter and screens 3Y2 tO 4 inches in diameter. The other five mells are from 1,050 t o 1,135 feet deep, with c a s i n ~ rmpng in diameter from 6 to 10 inches and screens from 3% to 8 inches. The wells are pumped by air lift. The water from the deeper mells contains so much iron that it must be filtered, and the use of the air lift aids in the process of aeration to precipihte the iron. For this purpose the water is pumped into an open concrete reservoir. It is distributed by direct pumpage into the mains, passing through pressure filters in the process. The sys- tem has no storage reservoirs or standpipe except the aerating reser- voir, the capacity of vhich is 203,000 gallons. I t is therefore neces- sary that the well capacity be sufficient to meet the peak l o d s . I n April, 1926, the Board of Consemation and Development granted the City the right to d i ~ e r t an ~dditional two million gallons from the deep horizon. The system has an emergency connection with the Mon- mouth County Water Company.
19)
NEW JERSEY GEOLOGICAL SURVEY

10 ASB1JR.Y PARK GROUND WATER SUPPLY
jllbnrno*llth 00un-t~ Wuter Company.-The Monmouth County Water Comp&y, a subsidiary of the American Water %rks and Elec- tric Company, supplies part of Asbury Park, Ocean and Neptune Townships, and the boroughs of Bradley Beach, Neptune City, and Interlaken. It obtains water from trra :ocalities designated respec- tively as the Jumping Broolr and Whitesville pumping station. The Jumping Brook station is located on the stream of that name, about three miles southvesterly froin Asbury Park. A large part of tl1e supply is surface water pumped from Jumping Brook. At this sta- tion there are also two &inch \rells 1,000 feet deep. The minimum +Id of the stream is cstimatetl a t 900,000 gallons a day and of the ~ W O wells a t 1,G00,000 gallons a day. At the Whitesville station, located on the western outskirts of Asbury Park, the water is obtaincd entirely from wells. At present the water is obtained from two Layne ~vells. One is 610 feet deep with 40 feet of 13-inch screen between the deptlns of 15'8 and 218 feet and 67 feet of 8-inch screen between the depths of 538 and 605 feet. The yield of this well is approximately 300 gallons x minute. The other well is 981 feet deep with 60 feet of $-inch screen from 910 to 970 feet. This well yields about 900 gal- lons a minute. The two wells are pumped with Layne turbine pumps. At the Whitesville field there are also six old GOO-foot wells and one 1,000-foot well which are no longer used. The water from the deep horizon, as at Asbury Park, has considerable iron and is aerated and filtered before being pumped into the mains. This treatment is not necessary for the water from the shallo~ver well. Recently the Board of Consewation and Development granted the Monmouth Counly Water Company the right to obtain water from Swimming Rirer through mains of the Tintern Manor Water Company, which is also o subsidiary ef the American Water Works md Electric Company. Sincs some economz will result from using this source i t is probable that the consumption from the we118 of the Monrnouth Water Company will be greatly reduced and they will be used principally in periods of peak consumption.
Ocean Grove.-The water suppIy for the Ocean Grore Camp Meet- ing Association is furnished by the Eastern Kew Jersey Power Com- pany, which recently purchased the plant formerly operated by the Association. The water is a11 obtained in a well field the northeastern limits of which are only between 500 and 1,000 feet southwest of the Asbury Park well field. The we11 field contains 20 or more wells, but in 3924 only 16 were being used. The wells are scattered over an area about 500 feet wide and 1,000 feet long- Most of them are old, having been drilled in the early nineties. According to a report of
NEW JERSEY GEOLOGICAL SURVEY

WATER SUPPLIES OF THE REQION
the Camp Meeting Association for 1894 at that time there were 21 wells 450 feet deep and two wells 565 feet deep. In 1924 only 14 of these were in use, but the records of the Superintendcnt did not show whether these included the two deeper wells. These old wells are only four inches in diameter and the screens are perhaps even smaller. In 1894 a well was drilled to a depth of 1,134 feet, but for unknown rea- sons it was abandoned. In 1924 two wells, with 8-inch casing and 6-inch screen, mere completed to a deptb of about 650 feet. These yield about 125 to 150 gallons a minute each. The yield of lllc old weIls in service is not known. By subtracting the yield of t he new wells from the maximum pumpage in August, 1924, which probably represents nearIy the capacity of the field it is estimated that the yield of all 14 old wells is only about 750 gallons a minute or about 45 gal- lons a minute for each well. All of the wells are pumped by air lift into reservoirs at the elevation of the surface. In the summer of 1926 a concrete reservoir with a capacity of 635,000 gallons was added. A standpipe is also used an the distribution system.
Aum-By-the-Xsa-Frior to January, 1925, the water supply for Avon-by-the-Sea was furnished by the Monmouth County Water Com- pany through distribution mains owned by the Borough. Because of inadequate service in the summer of 1924 the Borough undertook the development of its own supplies. During t h e fall of the year t r o me115 were drilled by the Layne-New York Company. The first was put into a c t i ~ e service in January, 1925, and the- second in April. The wells are situated near the Borough Hall and are about 200 feet apart. The No. 1 well is 506 feet deep and the No. 2 we11 is 503 feet deep. Both are 18 inchea in diameter at the top with 80 feet of 8-inch screen at the bottom. Each well is pumped with a L q n e deep-well turbine set at a depth of about 180 feet. The yield of the weIls during a test on ApriI 4, 1925, mas about 325 gallons a minute for No. 1 and 215 gallons a minute far No. 2, when each well mas operating done. But when both were pumped simultaneousIy, the combined ~ i e l d was 556 gallons a minute. During the summer of 1925 the yield of the wells decreased very greatly (p. 34), but later increased t o about the original yield. The well pumps put the water direidly into the distribution main, with an elevated tank to equalize pressure.
Be1mar.-The water supply fo r Belmsr is obhined from nine weUs scattered over an area that is approximately 500 by 500 feet. The wells are alI about 650 feet deep. Five of them are six inches in diam- eter to a depth of about I50 feet and 4Y2-inch casing below that, with atrainers of the same diameter. Three of the ells sre eight inches in
NEW JERSEY GEOLOGICAL SURVEY

12 df3BUR.Y P A N GROUND WATER SUPPLY
diameter at the top with 4%-inch strainer. A new well, completed in 1924, is 16 inches in diameter t o a depth of 132 feet, 1 2 inchw f ~ o m 132 feet to tlie top of the water-bearing sand at a depth of about 590 feet, and the strailler is eight inches in diameter. The length of strainer in each tvell is about GO feet. All of the wells are pumped by air lift except the new rvell which is pumped by an American Well Works turbine pump. The water is pumped to a small concrete reser- voir and thence into the mains, with a standpipe for storage.
Otksr muaictpalities.-North of Asbury Park the water supply for Allenhurst is obtained from mells. The meil field was not pisited dur- ing the present investigation and no d a b are available in regard t o it except that there are five wells, each about 550 feet deep. Until the fall of 1925 the water supply of Deal Beach was obtained from weIIs. At that time the system was purchased by the Tietern Manor Water Company and water from Swimming River is now furnished.
The water supply for the numerous shore resorts south of Belmar for many miIes is obtained from wells. No study baa been made of any of these suppIies during the present investigation.
PGat s welb.--In past years a number of private wells hare been drilled in the Asbury Park region. Man? of these have been aban- doned and the writer has been able to find very fern now in use. The Casino Ice Company> on the south bank ~f Shark River in Belmar, has two mells. They are reported to be about 500 feet deep, with 8-inch casings and 6-inch screens. The wells are said to yield a t d of .about 400 gallons a. minute. In summer they are pumped prac- tically 24 hours a day, but from October 1. to May 1 they are pumped for onIy a fex hours at intervals of a week or two. At the gas plant well in BeImar there are seven shallow wells about 25 or 30 feet deep. These are pumped at the rake of only about 500 gallons an hour or less than 1 0 gallons a, minute. At the boathouse of Addison H. Eiggs, on an island in Shark River, there is a well that has not been used for several yearn. It is said to be about 490 feet deep. I nqu iy from water works ~Ec ia l s failed to reveal any other private wells in the region, but others may be found by a more careful search.
I n the Asbury Park region three important water-bearing forma- tions are recognized. These are, in order from top to bottom, the Mount Laurel-Wenonah, the Englishtom, and the Raritan. Some water is also obtained in sand beds lying above the Mount Laurel-
NEW JERSEY GEOLOGICAL SURVEY

Wenonah formation, but little water is taken from them and no further consideration is given to them. The water-bearing sands are separated by he& of a more clayey nature which do not peld water freely.
The Mount Laurel-Wenonah formation is d r a m upon by the mells of the Avon Water Department and the Casino Ice Company in Bel- mar, and by some of the mells of the Ocean Grove Water Department. The depth to t11~ top of the lfount Laurel-IVsnonah in the Avon wells is about 420 feet and the bottom about 500 feet. The Ocean Grove mells utilizing this horizon are 450 feet deep.
The Englishtown formation supplies the wdls of the Allenhurst and Belmar Water departments, and some 01 those in the IVhitesville, Asbury Park and Ocean Grove well fields. Dr. M. W. TwitcheIl states that in the Asbury Park region the top of the Englishtown sand lies about T5 feet below the base of the Mount Laurel-Wenonah formation. In general the depth to it in the Asbury Park region is about 600 feet.
The Itwitan formation, which comprfses a, series of water-bearing sands, is the principaI source of supply in the Asbury Park well field and the Whitesville field of the Monmouth County Water Company and also supplies the Jumping Brook wells of that company. I n the Asbury Park field the beds utilized lie between a depth of about 1,000 to 1,135 feet, but in the Whitesville field the depth is somewhat less. I t is possible that water-bearing sands lie below 1,135 feet, but a well drilled at Asbury Park revealed none between 1,135 feet and its bottom at 1,321 feet.1
The strata in the Asbury Park region rise toward the surface in a northwesterly direction and outcrop some miles distant. The nearest outcrop of the Mount Laurel-Wenanah formation is nbout three miles nodhwest of Freehold or about 16 miles from Asbury Park. The Englishtown formation outcrops near the tewn of that name about 21 miles northwest of Asbury Park. The necrest outcrop of the Rar- itan formation is near Jamesburg, about 26 miles from Asbury Park.
T h e depth of the different water-bearing horizons in the Asbury Park region varies somewhat from place to place, due in part. to dif- ferences in elevation and in part to the location at points relatively up or d o n the dip of the formation. In general t he depth to a given formation j s less at points in the northern and northwestern parts of the region than at points farther south or southeast. Thus the depth of wells which draw on the Englishtown formation is &out 550 feet at AIlenhurst, 600 feet at Asbury Park and WhitesvilIe, md 650 feet
"Annual report of State Geologist for 1895, pp. 72-74.
NEW JERSEY GEOLOGICAL SURVEY

14 ASBURY PARE GROUND WATER SUPPLY
at Belmar. However, when drilling new wells, in order to be sure that a selected horizon is reached it is desirable that a careful study of the sand samplel; and well log be made by a competent geologist. The im- portance of making such a, careful study was emphasized recently. In drilling a well operations were stopped in a sand which on casual in- spwtion appeared to be from a formation that had yielded a good supply of water about two miles distanh Subsequent study of t h e well log and a. few samples showed that instead of being in that forma- tion the well actually was drawing on a formation, whose water- bearing capacity is not as good as that of the first-mentioned smd.
The three water-bearing horizons presumabIy extend some distance out beneath the ocean. Whether they outcrop under water or whether t b e salt water has no access t o them is uncertain. Considering the depth to the formations along t h e coast and assuming that the dip of the beds beneath the ocean is the same as on Iand, the charts of the U. S. C m t and Geodetic Survey show that if the horizons mentioned do outcrop it must be roughly a t least 100 miles off shore; for i t i~ only at such a distance that the ocean bottom lies a t a depth p a t enough to intersect the formations. However, each of the three for- mations is beveled off below sea level in New Pork harbor and sea water can enter them in that region.
, CONSUMPTION
In the present report it is not necessary to give detailed considem- tion to the consumption of water in the Asbury Park region. The fol- lowing tabla gives the werage daily consumption for the years 1917 and 1925; also the average ddaiIy consumption in August of the two yem, that being in genera1 the month of maximum consumption.
NEW JERSEY GEOLOGICAL SURVEY

~302
,733
gall
ons
of s
urfa
ce w
ater
and
580
,526
gal
lons
of
grou
nd w
ater
. $1
,070
,000
gal
lons
of
surf
ace
wat
er a
nd 3
85,0
00 ~
!lo
ns
of
gr
ound
wat
er.
c Su
ppli
ed b
y M
onm
auth
Cou
nty
Wat
er C
ompa
ny i
n 19
17.
a T
ht
incr
ease
in
cons
nmpt
ion
in A
von-
by-t
he-S
ca
cann
ot b
e de
term
ined
sep
arat
ely.
The to
tal
incr
ease
pl
ied
by ?
he h
fvio
nmou
th C
ount
y W
ater
Com
pany
, in
clud
ing
Avo
n-by
-the
-Sea
was
691
,000
ga
llous
or
78 p
er
@ R
ecor
d in
com
plet
e.
Con
sum
ptio
n gl
ven
IS f
or
1924
and
inc
reas
e IS
com
pute
d on
bas
is o
f 19
24 f
igur
es.
f Increase in
ter
rito
ry o
rigi
nall
y se
rved
by
Mon
mou
th C
ount
y W
atcr
Cor
nany
was
948
,000
gal
lons
or
58
g D
ecre
ase.
AV
ER
AG
E D
AIL
Y C
ON
SU
MP
TIO
N O
F W
AT
ER
IN
AS
BU
RY
PA
RK
RE
GIO
N I
N 1
917
AN
D 1
925,
IN
TH
OU
SA
ND
S
OF
GA
LL
ON
S
in t
erri
to~
ce
nt.
per
cent
.
Q 0 z -4 6 z
.y o
rigi
nall
y su
p-
A~
GE
FOR Y
EA
R
1 18
7
1925
In
crea
se in 8 Y
ears
A
Y~
GE
FOB M
ON
TE
I OP A
UC
UG
T
Gal
lons
G
allo
ns
1,211
1,45
3b
418
121
439
17
9
-
3,817
1917
G
allo
ns
1,47
4
1,640
1,14
9 c
681
242 -
5,18
6
Asb
ury
Par
k W
ater
Dep
t.
Mon
mou
th
Cou
nty
Wat
er
Co .
....
....
....
....
...
Ocr
an G
rove
Cam
p M
eet-
in
g A
ssoc
iati
on .
......
. A
von-
by-t
he-S
ea
Wat
er
Dep
artm
ent
....
....
...
Bel
rnar
Wat
er D
ept.
..
...
Hlle
nl.lu
rst
Wat
er D
ept..
..
Tot
al
....
....
....
.
1925
G
allo
ns
2,32
1
2,348
1,11
2
240
955
386e
-
7,36
2
Incr
ease
in 8
Yea
rs
812
883*
379 c
288
117 -
2,47
9
Gal
lons
39
9
570 39
121
151 58% -
1,338
Gal
lons
84
7
TO8
-37
s
240
274
144e
-
2,17
6
Per
cen
t 44
6&d
10 d
52
50
~
-
56
Per
cen
t 57
431
-3s
r 40
60
e
41
NEW JERSEY GEOLOGICAL SURVEY

I 6 A8BVR-Y P A W GROUND WATER SUPPLY
As shown by the ta.blc the present average daily consumption for the entire year i s not quite 4 million gallons a day. The increase since 1917 has equaled a little more than half o' the consumption in that year. This increase from year to year has been somewhat irregular with decreases in certain years, but there has been no great boom period with a rapid increase nor is there n,lw any indication of such in the near future. The greatest increase in consumption has been in the territory originally supplied by the Nonmouth County Water Company, part of which in 1925 was suprrlied by the Avon Water Department.
Judging from past years, it may be expected that the consumption in the Asbury Park region will not shorn any marked acceleration in the rate of increase from year to gear, at least for some time to come. The average increase in the territory in the eight years following 1911 was about 17'5,000 gdIons a year (p. 15). If this rate were main- tained, in 1935 the average daily consumption in the territory extend- ing from Allenhurst to Belmar would be a little more than 5,500,000 gallons, and in 1950 it mould be about 8,250,000 gallons. The tendency of water consumption as a whale during the past has been for the per mpita consumption to increase gradually and it is probable th t the= will be some further increase in the future. Therefore the estimate just given is perhaps too low. If the average increase each year is double that of $he past eight years the total consumption in the region in 1950 will be about 12,500,000 gallons a day.
As is usual in the resort cities along the coast of New Jersey the summer consumption is mu& greater than that in winter. In Feb- ruary, 1925, the average daily coasnmption in the region, excluding AZIenhurst for which figures are not available, was 2,284,000 gallons a day, and in August of the same year it mas 6,976,000 gallons a day, an increase of 306 per cent. The greatest increase, 484 per cent, occurred in Ocean Grove, but in Avon it was almost as p a t . The smallest increase, 227 per cent, nras in the territory served by the Monrnouth County Water Company, and the next smallest in Asbury Park. The greatest increases occurred in sections that are practically entirely residential, in which the seaanal fluctuation is probably greatest, and the smallest increases were in t h e sections that contain a larger proportion of the population which handIe the year-round needs of the resorts, The table shows that the increase in consumption in August from 1917 to 1925 mas not as great as the increase far the entire year, except in the territory supplied by the Asbury Park and Allenhurst Wakr Departments. However, this may be due only to
NEW JERSEY GEOLOGICAL SURVEY

CONSUMPTION 17
conditions prevailing during the years considered and a more careful analysis of the statistics for dl years may disprove it as a. general fa&. In 1925 the average daily consumption in Lk~gust mas about 190 per cent of the average for the entire year. On this basis the consumption in Aupst , 1950, would be about 15.5 million gallons if the average increase from year to year is only 1Y5,000 gallons n day or nearly twenty-four million gallons if it is double that rate as estimated above. Considering the figures given here, the present; indications are that ithe demand for water in the future will be much less in the Asbury Park region than in other important areas in South Jersey which are now largely depenndel~t lipoil ground rmter, such as the Camden and Atlantic City repons. In the Asbury Park region there are three important water-bearing
horizons, namely, the Mount Laurel-Wenonzh, the Englishbm, and the Raritan formations (p. 12). In considering the d e e t of pump- ing on these formations (see pages 28 to 44) it is desirable to h o w the relative changes in consumption from each formation from winter to summer. Therefore the following table is inserted showing the average daily consumption in the region according to sources for the months 01 February and August, 1923, and for the entire year. These figure8 represent approximately the pumpage in the months of mini- mum and maximum consumption respectively, although the least and greatest consumption did not always occur in these months.
ESTIMATED DAILY AVERAGE CONSUMPTION OF WATER I N ASEUXY PARK REGION FOR FEBRUARY, AUGUST AKD
TI-IE ENTIRE YEAR 1925, ACCORDING TO SOURCE, 1N THOUSASDS OF GALLONS
SURFACE WATER Moi~mouth County Water Company.
Total surface water . . . . . . . . . . . . - . . . . - - .
GROUND WATER Sltallow Aoriecns nbow Motrstt Laawe!-
Wanonalt f o w t z a f i Monmouth County Water Company. . Gas Company, Belmar . . . . . . . . . . .
Total, shallow formations
M o ~ n t Lourcl-Wenonah formation . . . . Ocean Grove Water Department.
Avon Water Department ........... Casino Ice Company (private wells).
Total, Mount Laurel-Wenonah for- mation .........................
February 786 - 786
August 1,364
Year 1,070 - 1,070
NEW JERSEY GEOLOGICAL SURVEY

18 ASI3ER.Y PARK GROUND WATER SUPPLY
Englishbrrm formation Monrnouth County Water Company.. 0 200 49b Asbury Park Water Department ... 79 321 121
... Ocean Grove Water Department.. 60 279 105 Belmar Water Department ......... 228 955 439 ..... Allel~hurst Water Department. 9 1 C 3 8Gc 1 7 3 - - -
Total, Englishtown formation ..... 458 2,140 889
Roritm f u r n t i o n Monrnouth County Water Company. . 236 508 284 Asbury Park Water Departmetit.. . 67.5 2,000 1,090 - - -
Total, Raritan formation ......... 911 2,508 1,374 TohI g rwnd water ........................ 1,525 6,123 2,873 TotaIallsources ........................... 2,311 7,487 3,943
=Operation of plant begun February 6, 1925. Average for February is for 23 days and average for year is for 329 days.
b (hnsumption practicalIy entirely in summer months. @Record for 1925 inwmpIete. Figures given are for 1924 which are probably
not greatly different from 1925 consumption.
The above data are at best only a rough estimate. In only three cases is the consuinpiion of pubIic systems as reported to the D e p a h ment of Consemation and Development obtained wholly from a single source. These are the wrface wate~ consumption of the Monmouth County Water Company and the consumpLion of the Avon and BeLmar Water Depa3ments. The private supplies of the Casino Ice Company and the Gas Company in BeImar are from single sourcea but the water is not measured nor is any definite record kept of the pumpage. The supply ?or the other systems is obtained from two or more forma- tions in such a may that it cannot be reported separately. The figures given, are based on statements of the owners as to yield of we118 during tests, hours of pumping each well, or whatever other data furnished some clue as to the relative amount was obtained from each source. The signiicant facts shown by the table are: The pumpage is least
from the Mount Laurel-Wenonah forma5on at all times of the year and greatest from the Raritan formation. Except in the summer months the difference between the pumpage from t h e Mount LaureI- Wenonah and the Englishtown formations is not great, and if more accurate data were available the difference might be found to be even Iess than reported. The pumpage from other formations is almost negligible. There may be some private welIs not listed which draw on any one of the formations, but if so t he consumption from them is probably not great. There is a very great increase in the pnmpage from wells between February and August. Excluding the unimpor- tant shallow horizons the increase is greatest for the Mount Laurel-
NEW JERSEY GEOLOGICAL SURVEY

QUALITY OF WATER 19
Wenonah formation, being TO0 per cent, and least for the Raritan, being 275 per cent. For t h e Knglishtown formation it is 467' per cent.
The Monmouth County Water Company is now serving surface water from Swimming River, and its wells will probably be used to a much less extent. The effect of this will be to cut down considerably the consumption from the Raritan formation a t all times of the year and to a less extent the consumption from the Englishtown formation in the warmer months.
It is important to note that the data pven in the table do not cover the entire consumption from the formations named, but o d y in a datively narrow zone extending from AIlenhurst ta Eelmar. Water is pumped from the Englishto~m Iormatios and perhaps from the Mount Laurel-Wenonah a,t points further south along the coast;, and at points inland. The Raritan formation is not drawn on elsewhere dong the coast except possibly at Lavalette, but it is utilized idand, notably ~t the Runyon water works of the Perth -1mboy Water Depaxt- ment.
QUALITY OF WATER
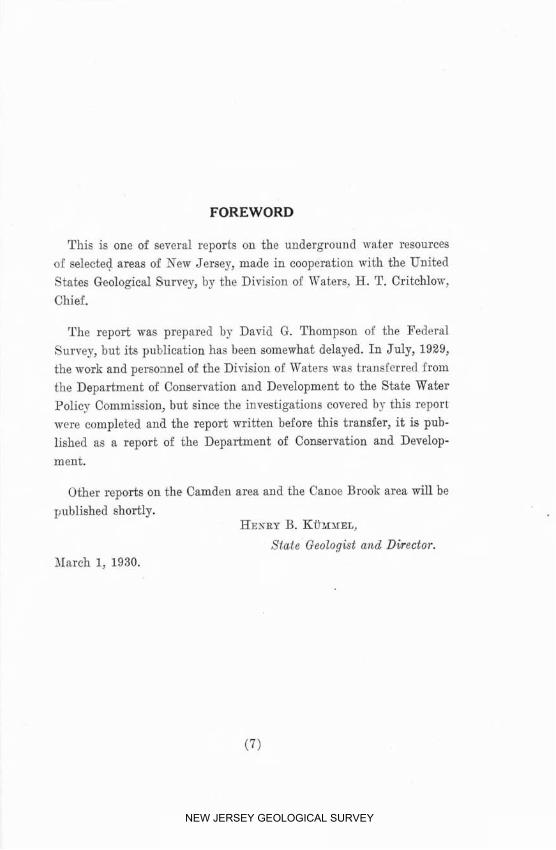
The quality of water obtained E~om the Mount Laurel-Wenonah, Englishtown, and Baritan formations is shown by the following table of analyses in which the samples from each separate formation are grouped together.
NEW JERSEY GEOLOGICAL SURVEY
NEW JERSEY GEOLOGICAL SURVEY

QUALITY OF JITATER 21
In commenting on the analyses, W. D. Collins, Chemist in charge of the quality of water division of the U. S. Geological Sumey, states: "It is interesting to note how nearly identical are the samples from Ocean Grove [No. 11 and ~lvon-by-the-Xea [No. 21. The analyses are almost as much alike as would be expected of two samples taken from the same bottle. The analysis of the Belmw well [No. 4J is very much like that of the water from the same level at Asbury Park [No. 33, although the Asbury Park water has a little more sulphate and more iron than the sample from Belmar." The similarity in the character of the two samples from the Raritan formation is also note- worthy, for the difference between any of the constituents in either sample is not great.
It mill be noted that both the total solids and total hardness are greatest in the samples from the uppermost of the three formations and least in the deepest. On the basis of these constituents alone the Raritan water would be most satisfactorjr. However, the hardness of the water from the Mount Laurel-Wenonah is not great enough to cause any disagreeable results from its use. The water from the Raritm fornation is so high in iron that it must be aerated and filtered and this increases somewhat the cost of production. Sample No. 8 shorn the reduction in iron in the water served in Asbury Park after filtration. The filtered water is a mixture from the Englishtcrwn and Raritan formati~ns and the quantities of most of the constituents in the filtered smple are intermediate between those of the samples from the two horizons, but the iron is less than in either. When analyzed, the sample from the Belmar well (No. 4 ) contained some iron which was precipitated after eolledion. It seems probable that the iron would be precipitated in the basin in which it is collected before being pumped into the distribution system, but actually it was so sIight as not to be noticeable.
The differences in f i e quality of the water from the three horizons are not great enough to furnish any strong basis for choice in, develop- ing public supples, except perhaps the cost involved in filtering the water from the Raritan formation. More important than quality of the water are the factors of difference in initid cost of drilling to different depths, and differences in the relative water-bea~ing capacities of the formations which are discussed on subsequent pages.
NEW JERSEY GEOLOGICAL SURVEY

22 ASBURY PARK GROUND WATER SUPPLY
WATER-BEARING CAPACITY OF FORMATIONS
GENERAL STATEMENT
Some data have been obtained which indicate t h e relative water- bearing capacity of the Mount Laurel-Wenonah, Englishtown, and Raritan formations in the Asbury Park region, and their value as sources of water supply. These obsemations relate principally to the effect of pumping during short tests and of seasonal changes in pump- ing. The conditions for obtaining good data have been most favorable f o r the wells that; dram from the Mount Laurel-Wenonah formation and the discussion relating to that formation is more detailed than for the other horizons.
MOUNT LAUEL-WENONAH FOBMATION
P't~mpiag Tests of Avo~e T d l s
Deseviptioa of the Tests.-The effect of pumping has been deter- mined to a certain extent by ohsenations during pumping tests of the wells at Avon and by measurements ~f those and other wells in the regions at intervals of about a month for more than a gear.
A prdiminary test of the Avon No. 1 well on A u p s i 25, 1924, was not witnessed by the writer, but a report of the driller shows that in eight hours' pumping the discharge decreased gadually from about 380 gallons a minute at the end of the first hour to 325 gallons a minute at the and of the test.
More detailed observations mere made during a 10-hour test on well No. 2 on November 12, 1924. At the en< of the first hour the dis- charge was approximately 320 gallons a minute. At the end of five hours it had decreased to xbout 310 gallons and at the end of eight hours it had decreased to about 300 gallons a minute. The discharge apparently cortinued to decrease during the entire test, but in the last few hours t h e rate of decrease mas so sio~v that an actual change could be noticed only in observations two or three hours apart. The draw- down or number of feet the mater mas lowered in me11 No. 2 durivg pumping was estimated to be about 100 feet. The water level in No. 1 well dropped during the entire period that No. 8 was pumped. This is shown graphically in Fig. 1. The rate of lowering was very rapid a t first, being about five feet during the second hour; but it became Iess and less, and in the last hour the water dropped about four-tenths of a. foot. The drop in the No. 1 well during the period of observation
NEW JERSEY GEOLOGICAL SURVEY

WATER-REARThrC* CAPACITY O F FORMATIONS 23
NEW JERSEY GEOLOGICAL SURVEY

24 A8SURY PARE GROUND WATER SUPPLY
was 23.6 feet and judging from the level to which the water rose the day after the test, the total drop was at least 30 feet. From the graph it is evident that the water level would have continued t o drop for at. least several hours more if pumping had continued, although the subsequent drop would h a w been ody a few feet.
During the find test of the two Avon wells on April 2, 1925, each well was pumped alone for two and a half hours and both were run together for three and a half hours, but these periods were probably not long enough for completely stable conditions to be reached. Also it wxs not possible to make as accurate measurements of water l e d as in the preliminary test.
The average yield of well No. 1, when pumped alone for two md one-half hours, was 325 galIons a minute, and the drawdown near the end of the period was a b m t 108 feet. The average yield of we11 No. 2, when pumped alone for a like period, mas 275 gallons a minute, and the drawdoan was about 113 feet. The tests of the wells running separately was made, following the three-hour period in which the two wells had been run together and this doubtless caused a slight decrease in the yield of each well from what it mould h a ~ e been if only one well at a time had been run since the head had been unduly lowered. The combined yield of the two weIIs running together for three and one-half hours was 556 gallons a minute or 44 gallons Iess than the sum of the yield of the wells when each mas running alone, a decrease of Y per cent. The drawdown in well No. I when both wella were running mas about 115 feet. The drawdown in well No, 2 a t this time mas not determined, but there is reason to believe that it was at least 120 feet. Thus mhen both wells mere running the specific capacity (p. 25) was cut to 2.4 gallons per minute per foot of drawdawn.
During the test on April 2 frequent measurements were made on the water leveI in the Riggs well and one of the Casino: Jce Company wells to determine whether the pumping of the Avon wells affect these wells. At; the end o f the test the mater in the R i g s well was 1.25 feet lower and in the Casino well 0.42 of a foot lower than befor? pumping began. Because of a possible slight but unproved tide effect in the .rvells it cannot be definitely statad that this lowering of the mater level was caused entirely by the Avon wells. Eomeser, by reducing the elevation of the mater level to a common datum by means of spirit levels there was found Go be a very definite gradient of the static head of the water from the Casino well toward the Riggs and A ~ o n welk. It ?is therefore concluded that the pumping of the
NEW JERSEY GEOLOGICAL SURVEY

WATEJ%BEBRING CAPACITY OF FORMATIONS 25
Avon wells affected both the Riggs well, half a mile away, and the Casino well 800 feet farther. This is an. unusually great distance for the eflect of one o r two pumping wells to be felt in other wells, especially in view of the small yield of the wells.
Conclm*ons.-The signiscant facts revealed by the tests just de- scribed are: (1) f i e comparatively smaZI yield of the wells, and the fact that it apparently dedines for some time after pumping is begun; (2) the very great drawdown created by the comparatively low rate of pumpage; ( 3 ) the great lowering of the water in well No. 1 when No. 2 mas pumped; and (4) the great distance to m h c h the effect of pumping mas transmitted from the wells. These fads suggest that the Mount Laurel-Wenonah formation in the vicinity of Avon is a relatively poor water-yielder. This is also shown by the following comparison with wells in other localities. The value of a well as a water yielder is shown to some extent by
its specific capacity or yield per unit of dramdown. This is deter- mined by hviding the tes ted yield by t h e drawdowa during the test. POT the No. 2 well the specific capadty du~ ing the test of November 2 was only a little more than three gallons per foot of dramdown. The specific capacity of wells in other formations fo r which data are avail- able is given in the following table. These wells mere a11 drilled by the Layne-New York Company which put down the Avon weIls, and accordingly should be as nearly comparable from the constructiand standpoint as is possible. Differences in the specific capacity, there- fore, may be ascribed largely to the differences in the water-yielding capacities of the formations or diflerences in the length and diameter of the screen. The diameter of the s c m is the same in alI the wells except those of the Camden Water Department and the Mer- chmhille Water Company, but the lengths of the screen are different in some wells. To put the results on ri more comparabIe basis a column is added showing the yield per square foot of screen in the well and specific capacity per square foot of screen (yield di6ded by dramdown divided by square feet of scfeen).
NEW JERSEY GEOLOGICAL SURVEY

T!n C
OM
PA
RIS
ON
OF Y
IE;L
D OF C
ER
TA
IN W
EL
LS
IN F
OR
MA
TIO
NS OF N
EW
JE
RSE
Y COASTAL P
LA
IN
5
Loc
alit
y an
d L
engt
h D
iam
eter
w
ell
desi
gnat
ion
Form
atio
n of
sc
reen
_of
scre
en
Yie
Id
Dra
wdo
wn.
--
Arm
No.
2 ..
......
......
....
Whi
tesv
iIIe
, 981 f
oot
wel
l ...
.. M
erch
antv
illc
W
ater
Co.
near
F
ish
Hou
se ..
......
......
.. C
amde
n.
Puc
hack
fid
d.
Wel
l
Spec
ific
Y
ield
per
C
apac
ity
Spec
ific
sq.
foot
pe
r sq
. ft
. C
apac
ity
of s
cree
n of
scr
een
per
foot
8. p
.m.
g. P. m.
i I
I
Xo.
1 ..
....
....
....
....
...
Cam
den,
Pu
chac
k fie
ld,
Wel
l No.
4 ...
......
......
......
M
arga
te C
ity
....
....
....
....
A
tlan
tic
Cit
y, A
bbot
t's D
airy
.. I
I I
I
a &
timat
ed
by d
rill
er.
3 M
Mou
nt L
aure
l- W
enon
ah ..
......
R
arit
an ...
......
.. R
arita
n ...
......
.. h
rita
n ...
......
.. R
arita
n ...
......
.. ...
......
K
irkw
ood
Kir
kwoo
d ...
......
101)"
76
47
32
SO
61
60
300
950
1,05
0
80
66
32.5
8 8 26
26
26 8 8
I,3U
)
1,67
5 700
630
38
25
37
40
NEW JERSEY GEOLOGICAL SURVEY

WATERBEARING CAPACITY OF FORMATIONS 27
The table shows that the A ~ o n wells have the lowest yield of any of those listed, the other wells affording from four to eight times as much water. No unusual dificulty wns encountered in the constmc- tion of the Awn wells and there is no reason t o ascribe their low yield to any other cause than the physical character of the Mount Laurel-Wenonah formation which results in low permeability. This is what is to be expected from the testure of the formation where it; outcrops on the surface. It is there a fine, meaIy sand, with very minute pore-spaces,
Brief consideration may be given to certain conditions observed during the tests on the Avon wells, namely, the dedine in head in well No. 1 when well No. 2 was pumped which continued during the entire test, and the decline in the yield of the wells as pumping continued.
The first condition has been found in tests of other wells drawing from other formations and appears to be characteristic of water- bearing formations. The head in the pumping welI and also in the surrounding water-bearing formation, as indicated by the water level in adjacent wells, drops rapidly as soon as pumping is begun. Although the maximum discharge of the pump i s reached within a few minutes after starting, the head continues to drop for some time -that is, there is a lag in the establishing of a stable condition. The lowering of head continues at a slower and slower rate until there is no further decline. Water is entering the well through the screen as rapidly as it is being withdrawn. The typical cuwe representing the movement of the water leael with respect to time when a well is pumped drops almost vertically, then CUrVe6 gradually until it is pmctically horizontal. When pumping is stopped the curve rises steeply and then curves gadualIy until it is horizontal-that is, it is essentially the reverse of the pumping curve. The curves shown in Fig. 1 are typical except that the pumping period was so short that the stabIe condition was far from being reached. The time required to reach the stable condition differs with different water-bearing for- mations. In some it is reached in a few minutes or at most a few hours. In others it may not be reached for several days although the decline in head after a day or two may be almost imperceptible. In general, the stable condition is reached most quickly in fosmations that are good water-bearing materials and most slowly in poor mater- bearing materials. The exact cause of the lag of the head reaching a stable condition is not known but it seems to be dependent upon the physical Ghnracteristics of the water-bearing materials which govern their permeabi1i"c;v and porosity.
NEW JERSEY GEOLOGICAL SURVEY

The second condition results in part from the first condition and in part from the type of pump used. As the water level drops lower and lower the pump must raise the water a greater and greater dis- stance and for a given quantity of mater a greater amount of power is required. However, when a we11 is equipped with the type of motor and pump used in the Avon wells the power a~ailable cannot be increased. The result is that since more power ia required to lift a unit quantity of water the tots1 quantity that can be pumped ia autw matically decreased gradualIy as long as the water level recedes ia the weII. If, instead of the type of pump used in the Avon wells, any other type of pump is used by which more power may be applied as the head drops the discharge may be kept up, for the ability of the well t~ yield water 'has not been impaired merely by the lowering of the head.
Effect of Semwzd Chamgss in, Pumpage
Pluetuatiam of Head.-In addition to the tests on the Avon wells described above measurements were made on the Avon, Riggs, Casino, and Ocean Grove wells at intervals of about once a month between September, 1924, and December, 1925. The measurements of the Avon No. 1 well, the Riggs well, and the Casino well are shown on t h e accompanying graph, Fig. 2, which also shows the daily pumpage from the Avon wells. No measurements could be made on the Biggs and Casino wells during the summer months, in the first case because the water Ievel dropped below an obstruction in the well and in the second case because the well was in continuous operation.
Two series of measurements are given for the A ~ o n No. 1 well, indicated respectively by + and X . The upper series (+) shows the mater ler-el in the No. 1 d l when the No. 2 mell mas not pumping and the lower series (X ) shows the matar level when the No. 2 mell was pumping.
I t will be noted that after April 28 in several instances for the Avon well there are measurements of the non-pumping leveI on suo cessive days. In sue11 cases the Erst of the two measurements mas made in the late afternoon only two o r threc hours after one or the other of the wells had been pumped and the mater in the well mas still rising fairly rapidly from the low level during pumping. The second measurement was generally made during the morning of the succeed- ing day before either mell mas pumped and the water level had risen to a, greater height. During July and August and September one or the other of the Avon wells was pumped for 18 t~ 20 hours each day and
NEW JERSEY GEOLOGICAL SURVEY

NEW JERSEY GEOLOGICAL SURVEY

30 ASBURY PARK GROUND WATER SUPPLY
the period of complete rest occurred only in the very early morning hours. The higher of the two measurements shown on successive days mas made between 8 and 9 o'clock in the morning before pumping for the day was started. The lower measurement shows the depth to water between 4 and 6 o'clock in tlie afternoon with No. 2 well pump- ing The difference between the pumping and non-pumping level is much less in summer than in the rest of the year. This is because in summer the wells are pumped for many hours and the period of recovev is so much sllorter that the water level cannot rise to a posi- tion comparable to that in the other months.
The graph ~ h o ~ v s that the static level in the No. 1 well was more than 70 feet below the top of the casing during most of September, 1924, and thereafter it rose during the fa11 months to a level of about 45 feet in January, 1925. This level, with a variation of a few feet, depending upan the conditions a t the time of measurement, mas main- tained until about tlie middle of April. Thereafter the water leveI dropped rather rapidly and en August 28 it was 96 feet below the reference point when both wells were idle, a, drop of more than 50 feet since the high point of April 1. On August 28 it was about 113 feet below the reference point when No. 2 was pumping. After the period of heavy pumping ended the water level rose again, as in the fall of 1934.
Since measurements are lacking for August, 1924, it is not possible to compare accurately the static head at its low point in 1924 and 1923. Howerer, on September 19, 1925, after the water had begun t o rise it was more than 10 feet Iower than at the time of measurement tmo weeks earlier in 1924 and therefore at its low point was presum- abIy considerably lower than in 1934. On Februmy 12, 1926, the depth t o water in the k o n No. 1 well was 48.64 feet or at about the same level as at the corresponding time in 1925.
The measurements of water level in the Eiggs and Casino wells, so far as they are a~ailable, s h m fluctuations in harmony with those in the Avon wdl, although the change from one time to another is not always the same in all three wells. Measurements in observation wells a t the Oceail Grove Natcr Works show similar seasonal iluctua- tions, the obsemed range from April I to August 28, 1925, being more than 50 feet.
The great fluctuation in the static head in the wells between minter and summer is undoubtedly due principally if not wholIy to fluctua- tions i n the pumpage. As shown by the preliminary test on the Avon No, 2 we11 the wnter level dropped generally during the entire period of t h e test and evidentIj7 mould ham continued to drop for some time
NEW JERSEY GEOLOGICAL SURVEY

WATER-BEARING CAPACITY O F FORMATIONS 31
iE pumping had continued. Under ordinary conditions in winter the Avon wells are pumped for only two or three hours and during t h e rcst of the day the water has an opportunity to recowT to the level at which i t stood before pumping. But as pumpage incibeaacs iu sumrncr, during pumping the head on the formation drops to a lower level, the recovery period is shorter and in some wells, as the Casino Ice Cornpan? wells, this period is eliminated entirely. Since the pumpage from each field increases in summer and, as shown abo~e, the areas of influence of the A ~ o n and Casino rvelh overlap, the decrease in heed in the Avon wells is due not. only to pumpage from them. but also from the Casino wells. The area of influence of the Ocean Grove wells may aIso overlap that of the Avon wells. In brief, the condition is that the static level varies in accordance with the pumpage. Sufficient data are not avaihble t o permit of a positive statement but it is probable that the great lowering of the head found in the rvelh under observation is not eonhed to their immediate locality but extends several miles from the wells.
It has been shown on page 24 that when there is a changc in the rate of pumping from a well the static head does not immediately become adjusted to the new condition but there is a considerable lag before a stabIe condition is reached. There is undoubtedIy such a lag when the pumpage from the Vaunt Laurel-Wenonah formation increases greatly in summer. Figure 2 shons that the pumpage at Avon, and doubtless also from the other wells drawing on the same horizon, was hjghest during the latter pnrb of August and the first few days of September. Prebably the lag following the increase to the m h ~ i m u m pnmpage had not completely mn its course and iP pumping at that rate had been continued the head would have dropped somewhat farther. As it was, after &he first meek in September the pumpage tlecreased so rapidly that not only was the downward mvve- ment stopped but the hend began to rise. Support for the belief that the lowest lcvcl that would result from the high pumping rate had not been rexchecl is nfforded by the rvater-level mensurcments on ~vcl l No. 1 shown on Fig. 2. These show that the head hat1 declined at an almost uniform :ate during the summer months, whereas if the stable condition were being approached it ~vould be expected that the decline in head woulrl tneeome less and Iess-in other words, that the curre rrould becomc nearly horizontd.
The summer of 1925 was d q , with rainfall below the normal, and it has been suggcstcd that the great lowering or the static head during Ule snmmer of 1925 r~-w.as due to the deficiency in rainfall. It is the opinion af the writer that the greater part of the drop in head is
NEW JERSEY GEOLOGICAL SURVEY

32 ASBURY PARK GROUND WATER SUPPLY
not due to this condition, however, but to the seasonal increase in pumpage as described above. The most convincing argument in sup- port of this opinior: is a comparison with conditions in the fall of 1924. As shown by the graph, when the first well at Avon mas completed in September, 1924, the static head n-as ahout 75 feet beIow the surface and thereafter duriug the fa11 it rase. In other words, it was low at the end of the summer season, although not as low as in 1925 when the Avon wells were pumping, and it rose as the pumpagE decreased. It happened that the months of October and November, 1924, mere unusudly dry and yet during that period the static head rose except during the first 10 days of November when the Avon No. 2 we11 was being pumped considerably by the drillers. If the drop in head in 1985 mere due to a deficiency in rainfal: a drop in head should also have occurred in October and November, 1984. In further support of the writer'a opinion i t may be said that according to hydraulic principles the most natural thing to be expected is a drop in head as the movement of water to n, we11 increases and a rise in head aa it decreases. The increase in draft occurred principally in the Avon field which was not in use in 1924. It cannot be definitely proven that none of the drop in head in the summer of 1925 was due to deficient rainfall, but if some of i t was due to this cause it is the writer's belief that i t mas only a relatively smdI part of the total drop in head.
Pluctwlfions of Yie ld of Weas at Auo7c.-As the static b e d on the Mount Laurel-Wenonah formation fell during the summer of 1925, the yield of both meIIs of the Avan Water Department decreased con- siderably as shown by the charts from the Venturi meter on the discharge line from the wells, A11 of the charts have not been exam- ined critically but the following data are suflicient to show the trend of the conditions.
It is not feasible to present as complete an analysis of the charts as might be desired, for seme of them are obviously inaccurate, since the meter clock did not always keep correct time. After some study the method was adopted of reading from the charts the rate of yield at the end of two hours7 pumping. A longer period could not be used for in winter the pumps are run only 2 or 3 hours. In the summer months, howevel; after a run of several hours the rate of yield is generally somewhat less than that at the end of two hours' run. On many daya the mte of yield declined gadually during the entire pumping period of 18 to 24 hours, as shown by a typical chart in Fig. 3.
NEW JERSEY GEOLOGICAL SURVEY

WATERBEARING CAPACITY O F FORMATIONS 33
A W Y3d *S IVO AVO U3d TqV'3
NEW JERSEY GEOLOGICAL SURVEY

34 ASBURY PARK GROUND WATER SUPPLY
This condition is due in part to ktro things. The sudden drop in yieId immediately after pumping beans is part11 due to the rapid decrease in head in the well in the first few minutes of operation, becoming less as pumping continues. As shown in the pumping tests it is probable that the head declines for at least several hours after pumping is begnn. The pumps operate at practically a constant speed and therefore do only a constant amount of work. Accordingly as the distance to the surface increases the quantity of water pumped must decrease The decline in yield is also due in part to the fact; that the pressure in the standpipe, against which the pumps work generally is l ~ w when the pump is started and increases as pumping continues. Hence the pump is working against an increasing pressure. Consegucntljt, the quantity that the pump can raise diminishes for this reason ato. The trvo factors noted combine to produce the same effect, namely+ a rather rapid decline in yield at first, which continues at s slower and slower rate as pumping continues.
The rate of yield of well NO. I. on certain days is shorn on Fig. 2 and the same data together with the rate of ~ i e l d of ell No. 2 pump- ing alone, and wells No. 1 and No. 2 pumping topther are shown in Fig. 4. The days for which data are shewn have been chosen so far as p ~ ~ ~ i h l e to show both the general trend and variations from it. Although the method used for determining the yield of the wells at diffe~ent times is rather unsntisfactory the graphs shorn certain sig- nificant facts.
The most important fact shown is the p a t decrease in the yield from the end of May to September 9, and thereafter just as marked an increase in the yield during the fall and early winter. The decrease in yield mas very rapid during the last half of August and first week of September, when the daily pumpage was the greatest. The increase mas even more rapid after thc first meek in September, following a rapid decline in the daily pumpage. By the end of January, 1926, the yield of the wells mas back to practically what it WBS a year previous.
The average rate of xield of well No. 3 from February to 3Iay, inclu- aive, Was about 315 gallons f t minute. On September 7 this had dropped to 184 gallons a minute. Neglecting this low rate of yield the decrease from May 30 to Septem'ber 7 mas I10 gallons a minute or 35 per cent of the original yield. The rate of yield of well No. 2 declined from about 281 ,@Xons a minute on May 29 to I39 gallons on August 31, a drop of 50 per cent. The Venturi chart for September 2 shows a rate of yield even Iower-only 115 gallons a minute, but
NEW JERSEY GEOLOGICAL SURVEY
WATERBEARING CAPACITY O F FORMATIONS 3.5
NEW JERSEY GEOLOGICAL SURVEY

36 ASBURY PARK QROVND WATER SUPPLY
certain peculiar features on it raise a question as to its accuracy. The rate of yield of wells No. 1 and 2 pumping together declined from a maximum of 655 gallons per minute on ApriI 2 to 368 gallons per minute on September 3, o r a drop of 34 per cent.
A comparison of the decrease in rate of yield with the lowering of the water-level in the wells (or head in the formation) leads to the conclusion that the decrease is without doubt due to the drop in the water leveI, which in hrm, as has been shown above, is due to the increased pumpage in the summer months. Since during the winter of 1925-1926 the yield of the wells increased to about their original yield it is obvions t h a t the marked decrease during the summer was not due either to any decrease in the efficiency of the pumping equip- ment or sanding up of the wells.
Tests rn 8and Samples
Two samples of sand from the Avon well No. 2 were tested in the Laboratory @f the TJ. S. h1ogical Survey, The tests included me- chanical analyses and determination, of the porosity and coefficient of permeability. The results of the tests are given in the following table, which shows that the coefficient of permeability is 566 and 88T re- spectively, and the porosity is 34 and 30 per cent.
NEW JERSEY GEOLOGICAL SURVEY

WATER-BEARING CAPACITY OF FORMATIONS
NEW JERSEY GEOLOGICAL SURVEY

38 ASBURY PARK GROUND WATER SUPPLY
The results of the tests are mainly of value in comparing the water- bearing qualities of the Mount Laurel-Wenonah sand with thme of some of the other principal water-bearing formations in the State. For this psrpose the coefficient of permeahiIity is useful. Tests have been made on about 23 samples from the so-called 800-foot sand of the Kirkmood formation which supplies a large quantity of ground water in the Atlantic City region. The results of these tests and the meaning and use of the coefficient of permeability are discussed in a report on that region. The lowest coeRcient in 17 samples from the Atlantic City region was 688, the highest was 10,464, and the next highest, 4,362. The average for the 17 samples was approximately 3,000. The coefficient of nearly two-thirds of the samples was more than 2,000, whereas that of the sand of the A ~ o n well is only 556 and 887. In brief, these results indicate that the 800-foot sand in the Atlantic City region will yield approximately at least three to five times as much water under a given head as will the Mount Laurel- Wenonah sand at Avon. In this way the tests en the sand ~amplcs support the other evidence presented above which indicates that the Mount Laurel-Wenonah is a relatively poor water-bearing form~tion.
From the data afforded by the observations in the Avon area and from similar observations in other regions it is concluded that if the pumpage from the 3lount Laurel-Wenonah formation is increased- whether from the well fields now in use or in new localities in the region-the static head wiU drop still lower. On the other hand, if the pumpage remains about the same as in 1925 it is probable that the head will not go much lower than in the summer of that year. Haw- ever, since there is probabIy some lag in adjustment of the head to a given rate of pumping it is IikeIy that if the maximum rate obtained during the aummer of 1925 is maintained for a longer period the head may drop somewhat below the low point of that pperid before a stable condition is reached.
It is not possible with the availabIe data to make any accumte esti- mate as to the lowering of head that wouId result from a. &en increase in pumping, but the following may give some indication as to what may be expected. F ~ o m April to September, 1925, the static head in the A ~ o n No. 1 well was lowered about 50 feet. The increase in pumpage in the same period is estimated to be abont 1.4 million gallons a day. Thia ia a lowering of about one foot for every 28,000
NEW JERSEY GEOLOGICAL SURVEY

WATEIG'BEARING CAPACITY OF FORMATIONS 39
gallons increase in the daily pumpage. However, as indicated on page 30, it is prohble that if pumping at the same rate had continued for a longer period the head might have dropped even lower.
That the drop might have been considerable before a stable condition would have been reached is suggested by a comparison with the lomer- ing of head prior t o 1925. Information as to the original head is found in the record of a weU drilled in 1884 on the property of Eben C. J a p e at the corner of Ocean and Sixth Avenues, Ocean Beach (now Belmar).' The well was 485 feet deep and cased to a depth of 471 feet. The report states that when finished the water rose "verti- cally 34 feet above the ground, and about 50 feet above low-water mark of the ocean." About the same year, in a well drilled to a depth of about 420 feet a t Ocean Grove, the head was 28 feet above the sur- fam2 The surface elevation is estimated to be about 15 feet. above sea. h e 1 and the head therefore mas about 43 Zeet above sea level. It seems certain that these wells were drawing from the Mount Laurel- Wenonah formation,--the Ocean Grove me11 from the upper part of the horizon and the J a p e well from the lower part. In the winter of 1924-35 the water level in the Avon wells at its highest point mas about 45 feet below the surface or about 15 feet below mean low tide. Since 1884 the head had declined about 65 feet. This is to be attrib- uted largely i1 not wholly to pumping in the region. So far as the records of the Department of Conservation and Development indicate there is practically no pumpage from the Mount LaureI-Wenonah formation other than at the localities mentioned on page 13. The estimated pumpage from the farmation in the winter of 1924-26 was about 236,000 gallons a day. On this basis the decline in head had been about one foot for each 4,000 gallons per day; that is, t h ~ quantity of water obtained per foot drop in head was only about one-serenth that obtained when the wnter was lowered 50 feet during the summer of 1925. If the conditions nre comparable the data must iadicntc that if pumping had been maintained at thc high rake of August, namely, 1,630,000 gnllons day, the head would have dropped very much farther. I f the decrease in head mere directly propodional to the increase in pumpage on the basis of the most conservative figures, x further increase in draft of one miIlion gallons above the r ~ t e of August, 1925, would lower the static heat1 some 35 feet below the low point of 1025 or about 130 feet below the surface. On the other hand, if the lower yield per foot decrense of head over a Iwg
'Annual report of the State Geologist for 1884, p. 214. "nnual report oi the State Geologist for 1855, p. 129.
NEW JERSEY GEOLOGICAL SURVEY

40 ASBURY l'ARIC GROTJND WATER SUPPLY
period is more nearly correct an inercasc in pumpage of one million gallons would cause the head to drop about 650 feet below the surfaxe. I t cannot be said definitely that the decline in head is directly propor- tional to the Increase in pumpage. h'evertheless, the periodic measuw- ments since September, 1924, sufier: to shorn that the effect of any large increase in pumpage is to eausc a co~isider.ablc lowering of the head in the Mount Laurel-Wenonah formation.
As in the consideration above of the yield of the Avon weIla a com- parison of the seasonal fluctuation of the head on the Mount LsureI- Wenonah sand with that of the head on other water-bearing sands shows that it is not as good a matcr-bearing formation as the others. The seasonal fluctuation in a well t~ the Raritm formation at the Whitesville statim of the Monmouth County Water Company was only about 15 feet from August 27, 1925, to January 9, 1926, although at the time of the measurement on August 27' a mcll not over 250 feet distant was pumping about 900 grtll~ns a minute from the formation, whereas it was idle on January 9. As shown by the table on page 18, the diflerence in pumpage in minter and summer from the Raritan formation in the region, is fully as great as from the Mount Laurel- Wenonah sand, but the effect on the static o r nun-pumping head is considerably less. Less definite okservationa on wells to the Xnglish- t o m sand indicate that the seasonal flnctuation of the head on it is probably less than on the Mount Laurel-Wenonah sand, although per- haps not much less, whereas the purnpap is probabIy greater. The seasonal fluctuation of the head on the Kirkwood sand at Atlantic City during 1925 was only 20 to 23 feet for a seasonal change in pump- age estimate6 to be nearly five million gallons a day or about 200,000 gdons a clay for each foot of decIine in head. The seasonal fluctua- tion in the head on the Raritan formation at Camden appears to be at most only about 10 feet for a change in pumpage of 3.5 million gallons a day, or 350,000 gdlons a day for each foot decline in head. As compared to the fluctuation in all these formations, that in the Mount LaureI-Wenonah sand is ratker great,
The most direct ultimate effect of a great lowering of the head if the pumpage is increased will be an increase in the cost of pumping. This may result no t merely from the increased power consumption necessary to raise the water from a. greater depth but d s o from expen- ditures necessary for changing the pump installations to suit the new conclitions. The Avon pump bowls are set at a depth of about 180 feet. Observations how that the pumping level in the summer of 1925 was at least 180 feet below the surface. The puniping level probably i s
NEW JERSEY GEOLOGICAL SURVEY

WATER-BEARING CAPACITY OF FORMATIONS 41
not lolvered relatively as much as the non-pcmping le-vel for a g i ~ e n increase in pumpzge. Nelrertheless, a considerable increase in pump- age mny cause tbe pumping level to fall below the pump bowls and i t mould be necessary to lower them. The bourls are 15 inches in diameter, and are set in 18-inch casing which reaches to a depth of 210 feet. Below that the casing is only 12 inches in diameter. If it were necessuy. to lower the bowls to a greater depth than 210 feet i t would be necessary to install a pump with smaller bowls.
Another possible result of a lowering of the head with increased pumpage may be the drawing in of salt water from beneath the ocean. This problem ia considered on pages 44 to 47.
The increase in consumption from the Mount Laurel-Wenonah for- mation in recent years has been rather srnaIl and it is not anticipated that the head will be lowered to such an extent that any important pump changes will be needed in the near future or that salt water con- tamination is especidy imminent. Nevertheless, in view of possible unexpected increases in consumption, it is important to watch the fluctuations of the static head to determine more accurately, if possible, what change;ea mav be expected in the future.
ENGLISHTOWN FORMATION
l)eba&.-Comparatively few data are available in regard to the permeability of the Englishtown formation. No reliable pumping data have been obtained. Uncertain data in regard to a well at t he Belmar Watm Works seem to indicate a drawdown of about 55 feet when pumping 200 gallons a minute. The static l e ~ e l is reported to have been DO feet. A vacuum gage connected with the pump bowls at. a depth of 114 feet by a long tube showed a vacuum of 28% inches, presumably indicating that the water level was 31 feet below the bowls or 145 feet from t h e surface. On the basis of this data the specific yield was about three and w half gallons per minute per foot of draw- down or somewhat more than that of the Avcn well No. 2. (See page 2 6 However, there is said to be less screen in t h e Belmar well and the specific capacity per foot of screen is about .030 or somewhat greater than in Avan we11 No. 2. Since the well was put in service the yieId has declined and there is some reason to believe that the first test may not have been severe enough to indicate the true water-bearing capacity of the formation which may be lower than the test data seem to indicate.
NEW JERSEY GEOLOGICAL SURVEY

42 ASBURP PARK CTROUND WATER SUPPLY
No test data are available for the wells that draw from the English- town formation in the Ocean G~ove field. On August 27, 1925, the pumping level in one well mas 154 feet below the top of the casing. Since the wells were in operation almost 24 hours a day a non-pumping level could not be determined. The pumping level on that day was 116 feet bekw the highest non-pumping level observed during the present investigation, namelh 3Y.94 feet on April 1, 1925. As com- pared to this the difference between the non-pumping level in the Avon No. 2 well on April I and the non-pumping level on August 27 was 122 feet. The actual yield of the Avon me11 on August 2'1 was less than 200 gallons a minute.. The reported yield of the Ocean Grove well is about 300 gallons a minute. Actually it was probably less although perhaps not as low as the yield of the Avon well.
In an obsemation well in tlie ElngIishtc.wn formation at the Whites- ville station of the Monmouth County ra te r Company the range in water level from its low point on Aups t 2T, 1925, to April 10, 1926, was 38.89 feet. On the former date a well not oper 300 feet distant was pumping from the same horizon. As compared to thia, the range in water level on the Mount Laurel-Wenonah formation in the Avon No. 1 well between the same dates was 50 feet. In this connection it shouZd be borne in mind that, as shown in the table on page 18, f i e increase in pumpage from minter to summer ma9 probably a little greater from the Englishtown than that from the Mount Laurel- Wenonah, and yet the effect was not as geat. The WhitesviIle well draws water from two horizons, st, it daes not afEord a very precise basis for comparison.
No data have been found to show what the original static head was in the EnglisMown horizon in the area between Asbury Park and Belmar. In 1896, at Mantoloking, 10 miles south of Belmar, the water level in a well to what is beIieved to be the Englishtown rme nine feet higher than in a well drilled to what is probably the Mount Laurel-Wenonah formatiorr.l If the same relation existed in the Asbury Park region the originaI head on the Englishtown was probably at least 60 feet above sea le~el. In the winter of 1924-1985 t h e hrad on the Engljshtom at Ocean Grol-e at its highest point was a1jIJpru.x;- rnately 25 feet below ma. Ievel, or about 85 feet below the estimated original head. The total lowering of head at that time was somewhat greater than for the Mount Laurel-Wenonah formation, but tlie draft from the Englishtown formation in the Asbury Park regon was nearly double. ln addition there was some cons-aption from the English- town at several places south of Belrnar.
'Annual report of State Geologist for 1896, p. 152.
NEW JERSEY GEOLOGICAL SURVEY

WATER-BEARIXG CAPACITY O F FOR.MATIONS 43
8urnmry.-A41though the data are inadequate for close comparisons, such as tbcy are, they seem to indicate that the Englishto~vn formation in tbc Xsbury Park region yields water somewhat more freely than. the Uount Laurel-Wenonah. Compared to the Kirk~vood and Raritan formntions, pages 38 and 43, it ie a mnch poorer water-bearer than the other two sands. ~tlthough the Englishto~iln does seem to be a better rvatcr producer thau the Xount Laurel-Wenonah, the decline in head that has already occurretl in it indicates that a further considerable decline ma>- be expected if there is any great increase in pumpage.
THE R.\RITAN FOB&I,I.iTIOS
Data in regard to the water-bearing capacit:: of the Raritan Fornla- tion are even mmc mcager than those relating t o the Englishtown. The Itaritan is used at orlly three localities in the region-the Asbury Park well field, and the Whitesville and Jumping Erook Stations of the Monmouth County Water Company. The llsbury Park wells are so arranged that mexsurerncnts emnot be obtained easily. Observa- tions have been made o n l ~ on wells at the WhitesvilIe field.
The specific capacity of nn 8-inch L a p e well at the WhitesvilIe station was 12.5 gallons per foot of drawdown or fully four times as great as that of the Avon well No: 1 drawing from the Mount Laurel- Wenonah formation (p. 26). The mtio between the specific capacitr per foot of screen for the two wells was also abolit the same. In the Asbury Park wel; field two wells mith 6-inch screen yield 6.50 to 750 gallons n minute each from the Raritxn and a weIl mith $-inch screen yields about 1,000 gallons a minute. The drawdown in these wells is believed to be about 55 feet, but no measurements have been made for some time. On this basis, however, the rninimnm specific capacity ail1 be I1 ar 1 2 gallons per foot of drawdown. There i s litfde doubt that the wells in the Raritan yield much more water than those in either the Mount Laurel-Wenonah or Englishtown formntions.
A few monthly measurements on a well at the Jl%itesville station show that thc seasonal fluctuation in head on the Rnritan is slight as compared to the fluctuation on the other two formations. At its lowest obserred point on August 27, 1925, the ~r-ater stood or~ly 16.88 feet below the top of the casing dtkough a we11 not over 250 feet distant was pumping about 900 gallons a minute. During the spring of 1926 the matcr stood practically at the top of the casing. The maximum seasonal fluctuation xvas about 16 feet as compared to 38 feet in a well to the Englishtown at TiVhitesville and more than 60 feet in a
NEW JERSEY GEOLOGICAL SURVEY

4 4 ASBURY PARK GROUND WATER SUPPLY
well to the Mount Laurel-Wenonah at Avon under comparable con- ditions.
The original head on the Raritan sand in a 1,321-foot well a t Asbury Park was about 12 feet above the surface or about 22 feet above sea. 1evel.l The head on the formation a t Whitesville during the winter of 1925-1926 is estimated to Iravc been a t least 15 feet. above sea level or less than 10 feet below its original level. .At its lowest in August, 1925, the head was near sea Ievel. The maximum decline in bead on the liaritan formation, therefore, has been much less than the decline in head on either the Mount Laurel-Wenonah or the Englishtown for- mations, although the draft from it in both summer and winter G greater than from either of the other sands (p. 18).
In brief, all indie~~tions show that the Raritan sand is the best water-bearing fornation in the Asbury Park region. The data avail- abIe are hardIy sufficient to permit careful comparisons with the Raritan elsewhere in the State or with the Kirkwood. On the bmia of the speciec capacities per square foot of screen (p, 261, the Rm-i- ,
tan a t Asburr Park compares favorably with the same formation at Camden and with the 800-foot sand at Atlantic City. However, be- cause of the greater distance from the outcrop it is probable that z large draft on the Raritan at A~sbury Park mould cause a greater lowering of the head than the great draft at Camden has produced.
The head on the Rnritan may be expected to decline as the pumpage increases, but the decline for a given increase will be much less than for either the 3lount Laurel-Wenonah or Englishtown formations. All indications are that a t least severd million gallons additional can be drawn from the Raritan before the head has dropped so low as to require important changes in pumping equipment or cause a possible invasion, of salt water (p. 46).
POSSIBILITY O F CQPiTTAMINATIOK O F WELLS BY SALT 'IVATER
C-eaeral 8latsmrat.-ln many localities near the ocean where the head on wa.ter-bearing formations has been lowered by pumping, salt water has been drawn in. In view of the situation of the wells in the Asbury Park region nen-r the ocean and especially of the great lowering of the head on thc Mount Laurel-Wenanah and Englishtown farma- tions it is pertinent to consider this danger. Unfortunately, no definite information is available and it is necessary to resort to conjecture.
Annual report of State Geologist for 1895, p, 74.
NEW JERSEY GEOLOGICAL SURVEY

POSSIBLLITT OF CONTAMINATION BY SALT WATER 45
Coladitions in I he Mount Laurel-Wenonah and ~ n g l ~ h t o w ? i . - A t its lowest point dl~ri11g the summer of 1925 the non-pumping head on the Mount Laurel-Wenonah formation was about 65 feet below sea level in the Avon mells and about 10 feet lower in thc Ocean Grove observn- tion wells. The head on the Englishtown was probably about 40 feet below sea level. No data are available to show over how largc an area this great lowering of the head extended. Judging from conditions in the Atlantic City region, where more information rras obtained, it is probable that the hexcl on the Nount Laurel-Wenonah formation in the Asbury Park region is below sen Ier~el for severaI miles inland and doubtless fo r a nearly equal distance out beneath the ocean. The area in which the head on the Englishtom formation is below sea Ievel perhaps is not quite as extensive seaward, but undoubtedly reaches out for some distance offshore.
Both of these formations were originally deposited beneath the, ocean and must have nt one time contained salt water. Without discussing the method by which fresh water came to bc in the formations it may be stated that the danger of future contamination depends upon whether salt water is a n > ~ h e r e present in the formations oflshore and if so how near it is to the pumping wells, If it is within the area in which the head has been lowered there will be a tendency for the salt water to move toward the wells. If the salt water is only near the border of the area of influence of the mells the sate of movement landward mill be slow and it may take many rears for the salt water to reach them. Flovever, the rate of movenent will increase as the salt water approaches the wells. Furthermore, it will increase if the consumption increases. 11: the salt water is now just beyond the area of influence of the nfell8, an increase in consumption, with conseqllent further lowering of hend, will start the salt-ri7nter movement toward the land.
No informatinn is a~~xilnble to show whether salt water nctnally is anywhere presel~t in cither the >Count Laurel-Wenonah or English- town formntione. Thc analyscs on pagc 20 show that thc chloride content, which is the best indication of the presence of salt water, is exceedingly lor . If the formations outcrop beneath the ocean it must be either at a distance of about 100 miles offshore, or in Sandy Hook Bay about 15 miles north of Asbury Park. Eren though the nearest of these points of access is probably beyond the lirriit of the area in n-liich the head on the formations has been lowered, it is entirely possible tha t salt anter may be present in the formation much nearer to the wells in t n ~ Asbury Park region. Some of the factors bearing
NEW JERSEY GEOLOGICAL SURVEY

46 ASBURY PARK GROUND WATER SUPPLY
on the problem of possibIe invasion of fresh-water horizons by salt water have h e n considered in a report on the so-called 800-foot sand in the Atlantic City region. The evidence given in that report led to the conclusion that salt water may eventually be dmmn into the St- lantic City wells. In comparing the conditions in the two regions the only factor of value is the elevation of the original static head. In tlie Atlantic City region the head on the 800-foot horizon mas ahout 20 feet above sen lerel. For the Asbury Park region the original head on the Mount Laurel-Wenonah formation mas about 50 feet above sea level and on the Englishtonm possibly even higher. The greater head on these formations is to be attributed to a greater ele~atioii of water in the ilitakc arca c.f the formations up the dip from the pumping wells. 111 this condition there is a suggestion that there may be less danger from salt water contamination of the Mount Laurel-ll'enonxh and EngIishto~vn formations than of such contamirration of the $00-foot sand at Atlantic City. On the other hand, since a given increase in. pumpxge exuses a greater lowering of head on the Mount LaureI- Wenonah and Englishton-n loimatioiis than on the 800-foot sand, the apparentfactor of safety dnc to the difference in original head may eventually be more tlian offset by a considerable increase in pumpage from the Mount Laurel-Wenonnh. There are no other data that fur- nish nil>- basis for consideration as to the possibility of salt water coiltamiliation of these horizons.
Colzdftioas in the Badan Formtion.-In considering the possi- bility of contamination of the Raritan formation the most important fact is that even in tlre summer of 1925 the head on the formation apparently was at most on1p n fen- feet below SPR level. If the head was belom sea level offshore such depression probably did not extend re? far out. Although it is impossible to say whether salt water is present in thc lormatioil offshore and if so how far out, other condi- tions being equal there is muck less danger of salt water contamination of the Raritan in the Asbury Park region than of the 3fount Laurel- Wenonxh or Englishtown formations.
ConcEzlsdowa.-In riew of the possibility of contamination it is desir- able that occasional analyses of water from each formation be made and x watch kept for conditions that may give information on this problem.
In the Atlantic City region some wells have been contaminated by salt water entering the casing through holes in the upper horizons which are salty. The upper horizons in the Asbury Park region do
NEW JERSEY GEOLOGICAL SURVEY

GENERAL SUMMARY AKD CONCLUSIONS 47
not bear salt water except perhaps right a t the ocean's edge. There- fore, Iwal contamination of wells in the Asbury Park region does not seem likely.
GENERAL SUMMARY RED CONCLUSIONS
In the Asbury Park region there are three principal water-bearing horizons, namelj-, in descending order, the Mount Laurel-Wenonah, the Englishtom, and the Raxitrtn. The largest quantity of water is obtained from the Raritan and the smallest from the Mount L a u d Wenonah. The quality of water from all three formations is good except that the water from the Rnritan formation contains much iron and must be aerated and filtered. The choice of formation to be used in developing a water supply should be based on other factors which relate to the water-bearing capacities of the t h e e sands.
The yield of ;he wells that draw from the Raritan formation is relatively large while that of wells from the other two formations is comparatively small and the drawdown is great. The summer increase in pumpage cauPes a very considerable decline of the head on these trro formations, and the head has been lowered many feet below its original position. Any further large increase in pumping will cause the hcad to clecline much farther with consequent increase in pumping cost nnd the possible drawing in of salt water from beneath the ocean. On the other hand, pumping from the Rantan formation has caused but little lowering of the head.
In view of the already considerable pumping lift in wells drawing from the Mount Ln~rrel-Wenonah and Englishtomn formntions, i t is desirable that further decline be limited. It i s therefore recommended that so far as possible additional supplies be developed from the Rari- tan formation. This miH require a greater initinl cost for drilling to a greater depth ~ n d installing filters, but since the pumping lift will not be so great, at least for some time to come, this plan of derelop- ment may be more ~conornical in the long run.
If the incrense in 11-nter consumption in the ;Isbur;* Park re,nion continues at the snme rate as during the period from lnlr to 1925 it is estimated that in 1950 the consumption ~r-ill be n little more than 81000,000 gallone a day. On the other hand, iF the average increase each year is double that of the past eight years thc consumption in 1950 will be about 12,500,000 gallons a day. Although the data are inadequate to pel-mit specific predictions it seems probable that even the larger q n a ~ ~ t i t y o l water can be obtnined from wells without over-
NEW JERSEY GEOLOGICAL SURVEY

48 ASBURY PARK GROUND WATER SUPPLY
drawing the supply or lo~vering the head inordinately. However, the draft mag- increase at a greater rate than indicated, especially by the development of ground water supplies in nearby communities south of the Asbury Parlr region. Therefore, it will be a wise precaution to continue observations on the three horizons in order that a more definite basis may be a~vailable for a determination of the effect of future increases in purnpage.
RECOMNENDATIONS FOR FUTURE WORK
If more definite data is to be obtained bearing on the ultimate safe yield of the water-bearing formations ir_ the Asbury Park region the observations now being made should be continued and additional obser- vations shonld bc made as follows:
1. The study shouId be extended to include all wells drawing from any of the three principal horizons which may affect the head in the Bsbuqr Park region. This would indude mainly public suppIy wells southward along the coast for some miles, but might also include private wells.
2. If possible, periodic observations should be made to determine the seasonal fluctuations of head on the Englishtown and Raritan for- mations. Adequate opportunities for such observations are now lack- ing but wells may subsequently become available for measurement.
3. Pumping tests with observations on several wells should be made on wells drawing froin the Englishtown and Raritan formations to obtain data as to their yields for comparative purposes. Tests on the Englishtorrm can perhaps be made in the Belrnar we11 field and on the Raritan in the Asbury Park.
4. Sand samples should be obtained from new wells for laboratory tests.
NEW JERSEY GEOLOGICAL SURVEY

INDEX
k. PAGE
Allenhurst, water supply ....... briefly described.. 1 2 . consumption of water in.. 16 .. Analyses of ground waters. 20 Annual reports of the State ....... Geologist. .15, 29, 42, 44 Asbury Park, water a u p p l ~
described ............... 9 original head of water.. ... 44
. consumption of water in.. 15 Avon-by-theSea, water supply ............... described 11 pumping teats of wells. ... . 2 6 2 4 consumption of water in . . . 15
Belmar, water supply ............... deecribed 11-12 .. consumption of water in. 15
Casino Ice Company, descrip- ........... tion of wells.. 12 measurements of atatic bvel 24 static level fluctuates in har-
mony with &on wells. .. 30 area of influence extends to
Avon wells .............. 33 Coeffief ent of permeabiIity
of sand from Avon well No. 2 .................... 3637
meaning and use explained in repart on Atlantic City 38
............... Collins, IVY. D.. 21 Consumption of water in the .... Asburg Park region. .l5-19 Cooperation with water d e
partments and individuals 9 Cost of pumpfng, will increase .. with Powering of head.. 40
Deal Beach, source of water .............. supply at.. 12 . . . . . . . . . . . . . . Dip or strata.. 13
Eight-hundred-foot sand, refer- ........ ence to.. .38, 40, 4 4 , 8 Englishtown water - b e a r i n g
formation, wells drawing ................... from 13 ............ yield of wells.. 18 ......... quality of water.. 21 detailed data concerning.. .41-42 .... conclusions concerning. 43 fluctuations of static level.. 40
Jumping Brook pumping sta- .................... tion 10
Kirkwood formation, specific capacity of wells drawing .................... from 26
coefficieat of perrneabilfty . . 38 fluctuations of atatic level. . 40
Mantoloking, static level in ..... wall drilled in 1896. 42 Mechanical analyses of sand .. from hvon well No. 2.. 37 Monrnouth County Water Com-
pany, emergency connec- ............. tions with.. 9 sources of water supply ds- ................. scribed 10 variations In water consump-
tion in territory served by 16 surface water consumption ..... reported separately. 18 now serving surface water .. from Swimming River.. $9
Mount Laurel-Wenonah water- bearing formation, wells ........... drawing from. 13 ............ yield of wells.. 17 .......... quality of water.. 21 ............. pumping tests 23-25
specific capacity of wells at ................... Avon 26
NEW JERSEY GEOLOGICAL SURVEY

INDEX
description of sand at out- .................... crop 27 .................. poroaity 36-37
coefficient cf permeability . .3 6-38 effects of future increases in
pnmpage ................ 3841 ..... concIusions concerning 41 fluctuations of static level . .2 8-52 yield .................... .3 2-36
Ocean Grove . water supply ............... described 10-11
yjeld of wells .............. 11 static level and yield of in-
............ dividual ells 42 consumption of water in ... 16
Porosity of sand from Avon ............. . well No 2 . 3 6-37 Private wells in Asbury Park
.... region. description of 1 2 Pumpage. effects of seasonal
............. changes in -28-32 effects of future increases a t
Avon ................... 3 8 4 0
Raritan water-bearing forma- tion. welIs drawing from 18
.............. yield of wells 18 ........... quality of water 2 1 specific capacity of weus ............ drawing from 26 detailed data concerning ... 43-44 conclusionsregarding ...... 44 ff uctuations fn static Ievel . . 40
Recommendations for future water supply studies in the Asbury Park region .. 48
Riggs. Addison H., description of well belonging to ...... 12
measurements of static level 24 static level flactnations in
harmony with Avon wells 30
S . PAGE
Salt water. possibility of con- tamination of wells by 41.4 4-47
factors on problem consid- ered in report on Atlantic City region .............. 46
Sand samples. tests on ....... 36 Specific capacity defined ..... 25 ....... conditions affecting -27-28
of wells drawing from dif- ferent formations ........ 26 ........ of a we11 at Belmar 4 1
IVhitesvilIe ... 43 Static leveI conditions affect-
ing ..................... 27 in wells at Avon ....... .ZS-ZZ. 39 in wells drawing from the
EngIishtown formation.'. . 4 5 4 2 in wells drawing from the
Raritan formation ...... .4 3-44 ......... Summary of report -47-48
U . S . Geological Survey. water analyses made in la'bo- ................ ratory af 20
sand samples tested in labo- ................ ratory of 36
Water horizons. description of ..................... .12-1 3 ...... outcrop under the sea 14 ........... Water. quality of -19-21
Water supply. at Allenhunt .. 1 2 Asbury Park ............... 9
........... Avon-by-thesea 11 ................... Belmar 11-12
................ Deal Beach 12 ............... Ocean Grove 10-11 Whitesville. pumping station
...................... at 10
Y . ...... Yield of wells a t Avon . 2 2-28
W h i t e h o u a e . near Fish House. Camden. Margate ... Clty. and Atlantic City 26
...... fluctuations at Avon -82-36 decline due to drop in water
................... level 36
NEW JERSEY GEOLOGICAL SURVEY

NEW JERSEY GEOLOGICAL SURVEY

NEW JERSEY GEOLOGICAL SURVEY