new issue rating: s&p aaa book-entry only see “bond …book-entry only see “bond rating”...
TRANSCRIPT

NEW ISSUE Rating: S&P AAA BOOK-ENTRY ONLY See “BOND RATING” herein. In the opinion of Gilmore & Bell, P.C., Bond Counsel, under existing law and assuming continued compliance with certain requirements of the Internal Revenue Code of 1986, as amended (the “Code”), (1) the interest on the Bonds is excludable from gross income for federal income tax purposes and is not an item of tax preference for purposes of the federal alternative minimum tax imposed on individuals and corporations, (2) the interest on the Bonds is exempt from Missouri income taxation by the State of Missouri, and (3) the Bonds have not been designated as “qualified tax-exempt obligations” within the meaning of Section 265(b)(3) of the Internal Revenue Code of 1986, as amended. See “TAX MATTERS” herein.
$9,905,000 ROCKWOOD R-6 SCHOOL DISTRICT
ST. LOUIS COUNTY, MISSOURI GENERAL OBLIGATION REFUNDING BONDS
SERIES 2011 Dated: Date of Delivery Due: February 1, as shown on the inside cover
The General Obligation Refunding Bonds, Series 2011 (the “Bonds”) will be issued by the Rockwood R-6 School District, St. Louis County, Missouri (the “District”) for the purposes of providing funds to (1) crossover refund certain maturities of the District’s General Obligation Bonds, Series 2006 as further described herein under the section captioned “PLAN OF FINANCING – Refunding of the Refunded Bonds,” (2) pay a portion of the interest on the Bonds and (3) pay costs of issuance related to the Bonds. The Bonds will be issued as fully registered bonds without coupons in the denomination of $5,000 or integral multiples thereof. Principal on the Bonds will be payable annually on February 1, commencing on February 1, 2015. Interest on the Bonds is payable semiannually on each February 1 and August 1, commencing February 1, 2012, by check or draft mailed (or by wire transfer in certain circumstances as described herein) to the persons who are the registered owners of the Bonds as of the close of business on the 15th day of the month preceding the applicable interest payment date.
The Bonds will not be subject to optional redemption.
THE BONDS AND INTEREST THEREON WILL CONSTITUTE GENERAL OBLIGATIONS OF THE DISTRICT, PAYABLE FROM AD VALOREM TAXES WHICH MAY BE LEVIED WITHOUT LIMITATION AS TO RATE OR AMOUNT UPON ALL OF THE TAXABLE TANGIBLE PROPERTY, REAL AND PERSONAL, WITHIN THE TERRITORIAL LIMITS OF THE DISTRICT. The Bonds are offered when, as and if issued by the District and accepted by the Underwriter, subject to the approval of validity by Gilmore & Bell, P.C., St. Louis, Missouri, Bond Counsel, and subject to certain other conditions. It is expected that the Bonds will be available for delivery through the facilities of The Depository Trust Company in New York, New York on or about July 27, 2011.
The date of this Official Statement is July 14, 2011.

$9,905,000 ROCKWOOD R-6 SCHOOL DISTRICT
ST. LOUIS COUNTY, MISSOURI GENERAL OBLIGATION REFUNDING BONDS
SERIES 2011
MATURITY SCHEDULE
Due
(February 1)
Principal Amount
Interest Rate
Yield
Price
CUSIP
2015 $1,520,000 2.00% 1.00% 103.441% 791434 WC3 2015 1,500,000 4.00 1.00 110.325 791434 WE9 2016 6,885,000 4.00 1.25 112.025 791434 WD1

ROCKWOOD R-6 SCHOOL DISTRICT ST. LOUIS COUNTY, MISSOURI
111 East North Street
Eureka, Missouri 63025 (636) 458-7337
BOARD OF EDUCATION
Steve Smith, President
Janet Strate, Vice President Stephen Banton, Director Peggy Devoy, Director
Matt Doell, Director Matthew Fitzpatrick, Director
Keith Kinder, Director Kathy M. Chitwood, Secretary of the Board of Education
DISTRICT ADMINISTRATION
Dr. Bruce T. Borchers, Superintendent
Mr. Randall Smasal, Associate Superintendent of Learning Ms. Shirley Broz, CPA, Chief Financial and Legislative Affairs Officer
Mr. Steven Beatty, Chief Information Officer Mr. Dennis F. Griffith, Assistant Superintendent - Administrative Services
Dr. Kelvin McMillin, Assistant Superintendent - Human Resources Ms. Kim Cranston, Chief Communications Officer
PAYING AGENT
UMB Bank, N.A. St. Louis, Missouri
BOND COUNSEL
Gilmore & Bell, P.C. St. Louis, Missouri
UNDERWRITER
Piper Jaffray & Co. St. Louis, Missouri

REGARDING USE OF THIS OFFICIAL STATEMENT
____________________________
THE BONDS HAVE NOT BEEN REGISTERED WITH THE SECURITIES AND EXCHANGE COMMISSION UNDER THE SECURITIES ACT OF 1933, AS AMENDED, IN RELIANCE UPON THE EXEMPTION CONTAINED IN SECTION 3(a)(2) OF SUCH ACT. The information set forth herein has been obtained from the District and other sources which are deemed to be reliable, but is not guaranteed as to accuracy or completeness by, and is not to be construed as a representation by, the District. The Underwriter has provided the following sentence for inclusion in this Official Statement. The Underwriter has reviewed the information in this Official Statement in accordance with, and as part of, its responsibilities to investors under the federal securities laws as applied to the facts and circumstances of this transaction, but the Underwriter does not guarantee the accuracy or completeness of such information. No dealer, broker, salesperson or any other person has been authorized by the District to give any information or make any representations, other than those contained in this Official Statement, in connection with the offering of the Bonds, and if given or made, such other information or representations must not be relied upon as having been authorized by the foregoing. This Official Statement does not constitute an offer to sell or the solicitation of an offer to buy, nor shall there be any sale of the Bonds by any person in any state in which it is unlawful for such person to make such offer, solicitation or sale. The information herein is subject to change without notice, and neither the delivery of this Official Statement nor the sale of any of the Bonds hereunder shall under any circumstances create any implication that there has been no change in the affairs of the District or the other matters described herein since the date hereof. IN CONNECTION WITH THE OFFERING OF THE BONDS, THE UNDERWRITER MAY OVER-ALLOT OR EFFECT TRANSACTIONS WHICH STABILIZE OR MAINTAIN THE MARKET PRICE OF SUCH BONDS AT A LEVEL ABOVE THAT WHICH MIGHT OTHERWISE PREVAIL IN THE OPEN MARKET. SUCH STABILIZING, IF COMMENCED, MAY BE DISCONTINUED AT ANY TIME.

(i)
TABLE OF CONTENTS Page Page INTRODUCTION ................................................. 1
General .............................................................. 1 Purpose of the Bonds ........................................ 1 Security for the Bonds....................................... 1 Continuing Disclosure ....................................... 1
THE BONDS .......................................................... 2 General .............................................................. 2 Book-Entry Only System .................................. 2 Registration, Transfer and Exchange of Bonds
Upon Discontinuance of Book-Entry Only System ........................................................ 4
No Redemption of Bonds .................................. 4 SECURITY FOR THE BONDS ........................... 5
General .............................................................. 5 Sources and Uses of Funds ............................... 6
VERIFICATION OF MATHEMATICAL COMPUTATIONS ......................................... 6
THE DISTRICT ..................................................... 6 LEGAL MATTERS ............................................... 7
BOND RATING ..................................................... 7 TAX MATTERS ..................................................... 7
Opinion of Bond Counsel .................................. 8 Other Tax Consequences ................................... 8
CONTINUING DISCLOSURE UNDERTAKING ............................................. 9
ABSENCE OF LITIGATION ............................. 10 UNDERWRITING ............................................... 10 CERTAIN RELATIONSHIPS ............................ 11 MISCELLANEOUS ............................................. 11 APPENDIX A - INFORMATION REGARDING
THE DISTRICT APPENDIX B - INDEPENDENT AUDITORS’ REPORT AND AUDITED FINANCIAL STATEMENTS OF THE DISTRICT FOR THE FISCAL YEAR ENDED JUNE 30, 2010

(THIS PAGE LEFT BLANK INTENTIONALLY)

OFFICIAL STATEMENT
$9,905,000 ROCKWOOD R-6 SCHOOL DISTRICT
ST. LOUIS COUNTY, MISSOURI GENERAL OBLIGATION REFUNDING BONDS
SERIES 2011
INTRODUCTION The following introductory information is subject in all respects to more complete information contained elsewhere in this Official Statement. The order and placement of materials in this Official Statement, including the appendices hereto, are not to be deemed to be a determination of relevance, materiality or relative importance, and this Official Statement, including the cover page and appendices should be considered in its entirety. The offering of the Bonds to potential investors is made only by means of the entire Official Statement. General This Official Statement, including the cover page and appendices hereto, is furnished to prospective purchasers in connection with the offering and sale of $9,905,000 aggregate principal amount of General Obligation Refunding Bonds, Series 2011 (the “Bonds”) by the Rockwood R-6 School District, St. Louis County, Missouri (the “District”). The issuance and sale of the Bonds is authorized by a resolution of the Board of Education of the District adopted on July 14, 2011 (the “Resolution”). All capitalized terms used herein and not otherwise defined herein have the meanings assigned to those terms in the Resolution. Purpose of the Bonds The Bonds are being issued for the purposes of providing funds to (1) crossover refund the District’s General Obligation Bonds, Series 2006 maturing in the years 2015 and 2016, outstanding in the aggregate principal amount of $10,100,000 (the “Refunded Bonds”), (2) pay interest on the Bonds to and including February 1, 2014 (the “Crossover Date”) and (3) pay the costs of issuing the Bonds. See the section herein captioned “PLAN OF FINANCING.” Security for the Bonds The Bonds will constitute general obligations of the District and will be payable as to both principal and interest from ad valorem taxes, which may be levied without limitation as to rate or amount upon all the taxable tangible property, real and personal, within the territorial limits of the District. See the section herein captioned “SECURITY FOR THE BONDS - General.” Continuing Disclosure The District has covenanted in a Continuing Disclosure Undertaking to provide certain financial information and to provide notices of material events with the Municipal Securities Rulemaking Board, all in compliance with Rule 15c2-12 promulgated by the Securities and Exchange Commission. See the caption “CONTINUING DISCLOSURE UNDERTAKING” herein.

-2-
THE BONDS General The Bonds are being issued in the aggregate principal amount of $9,905,000. The Bonds are dated as of the date of original delivery of and payment for such Bonds and the principal is payable on February 1 in the years and in the principal amounts set forth on the inside cover page. Interest on the Bonds is calculated at the rates per annum set forth on the inside cover page, computed on the basis of a 360-day year of twelve 30-day months. The Bonds shall consist of fully registered bonds without coupons in denominations of $5,000 or any integral multiple thereof and shall be numbered from 1 consecutively upward, with the number on each Bond preceded by the letter “R.” Interest on the Bonds is payable from the date thereof or the most recent date to which said interest has been paid and is payable semiannually on February 1 and August 1 in each year, beginning February 1, 2012. Payment of the interest on the Bonds will be made to the person in whose name such Bond is registered on the registration books (the “Bond Register”) at the close of business on the 15th day (whether or not a Business Day) of the calendar month next preceding an interest payment date (the “Record Date”). Interest on the Bonds will be paid to the Registered Owners thereof by check or draft mailed by UMB Bank, N.A. (the “Paying Agent”) to each Owner at the address shown on the Bond Register or at such other address as is furnished to the Paying Agent in writing by such Registered Owner, or in the case of an interest payment to any Registered Owner of $500,000 or more in aggregate principal amount of Bonds, by electronic transfer to such Registered Owner upon written notice signed by such Registered Owner and given to the Paying Agent not less than 15 days prior to the Record Date for such interest payment, containing the electronic transfer instructions including the name and address of the bank (which shall be in the continental United States), the ABA routing number and the account number to which such Owner wishes to have such transfer directed. Principal of the Bonds will be paid by check or draft to the Registered Owner of such Bond at the maturity of such Bond or otherwise, upon presentation and surrender of such Bond at the payment office of the Paying Agent in St. Louis, Missouri or at such other payment office as designated by the Paying Agent. Book-Entry Only System
General. The Bonds are available in book-entry only form. Purchasers of the Bonds will not receive certificates representing their interests in the Bonds. Ownership interests in the Bonds will be available to purchasers only through a book-entry system (the “Book-Entry System”) maintained by The Depository Trust Company (“DTC”), New York, New York. The following information concerning DTC and DTC’s book-entry system has been obtained from DTC. The District takes no responsibility for the accuracy or completeness thereof, and neither the Indirect Participants nor the Beneficial Owners should rely on the following information with respect to such matters, but should instead confirm the same with DTC or the Direct Participants, as the case may be. There can be no assurance that DTC will abide by its procedures or that such procedures will not be changed from time to time. DTC will act as securities depository for the Bonds. The Bonds will be issued as fully-registered securities registered in the name of Cede & Co. (DTC’s partnership nominee) or such other name as may be requested by an authorized representative of DTC. One fully-registered Bond will be issued for each maturity of the Bonds, each in the aggregate principal amount of such maturity and will be deposited with DTC. DTC and its Participants. DTC, the world’s largest securities depository, is a limited-purpose trust company organized under the New York Banking Law, a “banking organization” within the meaning of the New York Banking Law, a member of the Federal Reserve System, a “clearing corporation” within the

-3-
meaning of the New York Uniform Commercial Code, and a “clearing agency” registered pursuant to the provisions of Section 17A of the Securities Exchange Act of 1934. DTC holds and provides asset servicing for over 3.5 million issues of U.S. and non-U.S. equity issues, corporate and municipal debt issues, and money market instruments (from over 100 countries) that DTC’s participants (“Direct Participants”) deposit with DTC. DTC also facilitates the post-trade settlement among Direct Participants of sales and other securities transactions in deposited securities, through electronic computerized book-entry transfers and pledges between Direct Participants’ accounts. This eliminates the need for physical movement of securities certificates. Direct Participants include both U.S. and non-U.S. securities brokers and dealers, banks, trust companies, clearing corporations, and certain other organizations. DTC is a wholly-owned subsidiary of The Depository Trust & Clearing Corporation (“DTCC”). DTCC is the holding company for DTC, National Securities Clearing Corporation and Fixed Income Clearing Corporation, all of which are registered clearing agencies. DTCC is owned by the users of its regulated subsidiaries. Access to the DTC system is also available to others such as both U.S. and non-U.S. securities brokers and dealers, banks, trust companies, and clearing corporations that clear through or maintain a custodial relationship with a Direct Participant, either directly or indirectly (“Indirect Participants”). DTC has Standard & Poor’s highest rating: AAA. The DTC Rules applicable to its Participants are on file with the Securities and Exchange Commission. More information about DTC can be found at www.dtcc.com and www.dtc.org. Purchases of Ownership Interests. Purchases of Bonds under the DTC system must be made by or through Direct Participants, which will receive a credit for the Bonds on DTC’s records. The ownership interest of each actual purchaser of each Bond (“Beneficial Owner”) is in turn to be recorded on the Direct and Indirect Participants’ records. Beneficial Owners will not receive written confirmation from DTC of their purchase. Beneficial Owners are, however, expected to receive written confirmations providing details of the transaction, as well as periodic statements of their holdings, from the Direct or Indirect Participant through which the Beneficial Owner entered into the transaction. Transfers of ownership interests in the Bonds are to be accomplished by entries made on the books of Direct and Indirect Participants acting on behalf of Beneficial Owners. Beneficial Owners will not receive certificates representing their ownership interests in the Bonds, except in the event that use of the book-entry system for the Bonds is discontinued. Transfers. To facilitate subsequent transfers, all Bonds deposited by Direct Participants with DTC are registered in the name of DTC’s partnership nominee, Cede & Co., or such other name as may be requested by an authorized representative of DTC. The deposit of Bonds with DTC and their registration in the name of Cede & Co. or such other DTC nominee do not effect any change in beneficial ownership. DTC has no knowledge of the actual Beneficial Owners of the Bonds; DTC’s records reflect only the identity of the Direct Participants to whose accounts such Bonds are credited, which may or may not be the Beneficial Owners. The Direct and Indirect Participants will remain responsible for keeping account of their holdings on behalf of their customers. Notices. Conveyance of notices and other communications by DTC to Direct Participants, by Direct Participants to Indirect Participants, and by Direct Participants and Indirect Participants to Beneficial Owners will be governed by arrangements among them, subject to any statutory or regulatory requirements as may be in effect from time to time. Beneficial Owners of Bonds may wish to take certain steps to augment the transmission to them of notices of significant events with respect to the Bonds, such as tenders, defaults, and proposed amendments to the Bond documents. For example, Beneficial Owners of Bonds may wish to ascertain that the nominee holding the Bonds for their benefit has agreed to obtain and transmit notices to Beneficial Owners. In the alternative, Beneficial Owners may wish to provide their names and addresses to the registrar and request that copies of notices be provided directly to them. Voting. Neither DTC nor Cede & Co. (nor any other DTC nominee) will consent or vote with respect to Bonds unless authorized by a Direct Participant in accordance with DTC’s MMI Procedures. Under its usual procedures, DTC mails an Omnibus Proxy to the District as soon as possible after the record date. The

-4-
Omnibus Proxy assigns Cede & Co.’s consenting or voting rights to those Direct Participants to whose accounts Bonds are credited on the record date (identified in a listing attached to the Omnibus Proxy). Payments of Principal and Interest. Payment of principal of and interest on the Bonds will be made to Cede & Co., or such other nominee as may be requested by an authorized representative of DTC. DTC’s practice is to credit Direct Participants’ accounts upon DTC’s receipt of funds and corresponding detail information from the District or the Paying Agent, on the payment date in accordance with their respective holdings shown on DTC’s records. Payments by Participants to Beneficial Owners will be governed by standing instructions and customary practices, as is the case with securities held for the accounts of customers in bearer form or registered in “street name,” and will be the responsibility of such Participant and not of DTC, the Paying Agent or District, subject to any statutory or regulatory requirements as may be in effect from time to time. Payment of principal of and interest on the Bonds to Cede & Co. (or such other nominee as may be requested by an authorized representative of DTC) is the responsibility of the District or Paying Agent, disbursement of such payments to Direct Participants will be the responsibility of DTC, and disbursement of such payments to the Beneficial Owners will be the responsibility of Direct and Indirect Participants. Discontinuation of Book-Entry System. DTC may discontinue providing its services as depository with respect to the Bonds at any time by giving reasonable notice to the District or the Paying Agent. Under such circumstances, in the event that a successor depository is not obtained, Bond certificates are required to be printed and delivered. The Direct Participants holding a majority position in the Bonds may decide to discontinue use of the system of book-entry only transfers through DTC (or a successor securities depository). In that event, Bond certificates will be printed, registered in the name of DTC’s partnership nominee, Cede & Co. (or such other name as may be requested by an authorized representative of DTC), and delivered to DTC (or a successor securities depository), to be held by it as securities depository for Direct Participants. If, however, the system of book-entry only transfers has been discontinued and a Direct Participant has elected to withdraw its Bonds from DTC (or such successor securities depository), Bond certificates may be delivered to Beneficial Owners in the manner described in the Resolution. Registration, Transfer and Exchange of Bonds Upon Discontinuance of Book-Entry Only System The Paying Agent will keep or cause to be kept the Bond Register at its principal payment office or such other office designated by the Paying Agent. Upon surrender of any Bond at the principal payment office of the Paying Agent, the Paying Agent shall transfer or exchange Bonds as provided in the Resolution. Any Bond may be transferred upon the Bond Register by the person in whose name it is registered and shall be accompanied by a written instrument or instruments of transfer or authorization for exchange, in a form and with guarantee of signature satisfactory to the Paying Agent, duly executed by the Registered Owner thereof or by the Registered Owner’s duly authorized agent. The Owner requesting such transfer or exchange will be required to pay any additional costs or fees that might be incurred in the secondary market with respect to such exchange. In the event any Registered Owner fails to provide a correct taxpayer identification number to the Paying Agent, the Paying Agent may make a charge against such Registered Owner sufficient to pay any governmental charge required to be paid as a result of such failure. No Redemption of Bonds The Bonds are not subject to optional redemption prior to maturity.
-5-
SECURITY FOR THE BONDS General Pledge of Full Faith and Credit. The Bonds will constitute general obligations of the District and will be payable as to both principal and interest from ad valorem taxes, which may be levied without limitation as to rate or amount upon all the taxable tangible property, real and personal, within the territorial limits of the District. Levy and Collection of Annual Tax. Under the Resolution, there is levied upon all of the taxable tangible property within the District a direct annual tax sufficient to produce the amounts necessary for the payment of the principal of and interest on the Bonds as the same become due and payable in each year. Such taxes shall be extended upon the tax rolls in each year, and shall be levied and collected at the same time and in the same manner as the other ad valorem taxes of the District are levied and collected. The proceeds derived from said taxes shall be deposited in the Debt Service Fund, shall be kept separate and apart from all other funds of the District and shall be used solely for the payment of the principal of and interest on the Bonds as and when the same become due and the fees and expenses of the Paying Agent.
PLAN OF FINANCING
Refunding of the Refunded Bonds A portion of the proceeds of the Bonds will be used for the purposes of (a) paying interest on the
Bonds to and including the Crossover Date and (b) redeeming and paying the Refunded Bonds on the Crossover Date at a redemption price of 100% of the principal amount thereof.
The District will enter into an Escrow Trust Agreement dated as of July 1, 2011 (the “Escrow Trust
Agreement”), with UMB Bank, N.A., St. Louis, Missouri, as escrow agent (the “Escrow Agent”). Pursuant to the Escrow Trust Agreement, the District will transfer a portion of the proceeds of the Bonds to the Escrow Agent for deposit in the Escrow Fund (the “Escrow Fund”) established under the Escrow Trust Agreement to purchase direct obligations of, or obligations the principal of and interest on which are unconditionally guaranteed by, the United States of America (the “Escrowed Securities”). The Escrowed Securities will mature in such amounts and at such times as shall be sufficient, together with interest to accrue thereon and any cash deposit to the Escrow Fund, to (a) pay interest on the Bonds to and including the Crossover Date and (b) redeem and pay the principal of the Refunded Bonds on the Crossover Date.
Robert Thomas CPA, LLC, Shawnee Mission, Kansas (the “Escrow Verifier”), a firm of independent
certified public accountants, will provide a report to the effect that the principal of and interest income on the Escrowed Securities, together with any cash deposit in the Escrow Fund, will provide sufficient moneys to make the required payments in accordance with the District’s refunding plan as set forth herein. See the section herein captioned “VERIFICATION OF MATHEMATICAL COMPUTATIONS.”

-6-
Set forth below is a description of the Refunded Bonds being refunded pursuant to the Resolution:
Maturity Date (February 1)
Principal Amount
Interest Rate
CUSIP Number
Redemption Date
Redemption Price
2015 $3,100,000 4.125% 791434 TY9 February 1, 2014 100% 2016 7,000,000 4.125 791434 TZ6 February 1, 2014 100
$10,100,000
Sources and Uses of Funds
The sources and uses of the proceeds of the Bonds are as follows:
Sources of Funds: Par Amount of Bonds $9,905,000.00 Plus: Reoffering Premium 1,035,099.45 Total $10,940,099.45
Uses of Funds: Deposit to Escrow Fund $10,867,729.59 Underwriter’s Discount 39,620.00 Deposit to Costs of Issuance Fund 32,749.86 Total $10,940,099.45
VERIFICATION OF MATHEMATICAL COMPUTATIONS Upon delivery of the Bonds, the Escrow Verifier will deliver to the District and the Underwriter a report indicating that such firm has examined, in accordance with standards established by the American Institute of Certified Public Accountants, the information and assertions provided by the Underwriter and the District and its representatives. Included in the scope of its examination will be a verification of the mathematical accuracy of (a) the adequacy of the maturing principal amount of the Escrowed Securities held in the Escrow Fund, interest earned thereon and certain uninvested cash to (i) pay the interest on the Bonds to and including the Crossover Date and (ii) redeem and pay the principal of and redemption premium, if any, on the Refunded Bonds on the Crossover Date (as described under the caption “PLAN OF FINANCING – Refunding of the Refunded Bonds”), and (b) the mathematical computations supporting the conclusion that the Bonds are not “arbitrage bonds” under Section 148 of the Code. Such verification of the accuracy of the computations will be based upon information supplied by the Underwriter and on interpretations of the Internal Revenue Code of 1986, as amended, provided by Bond Counsel.
THE DISTRICT The District is located in the western portion of St. Louis County, Missouri and the northern portion of Jefferson County, Missouri and covers approximately 150 square miles. The District serves all or part of Ballwin, Chesterfield, Clarkson Valley, Ellisville, Eureka, Fenton, Manchester and Wildwood, Missouri. The District has a population of approximately 116,321. See “APPENDIX A - INFORMATION REGARDING THE DISTRICT” for further information regarding the District.

-7-
LEGAL MATTERS
Legal matters with respect to the authorization, execution and delivery of the Bonds are subject to the approval of Gilmore & Bell, P.C., St. Louis, Missouri, Bond Counsel, whose approving opinion will be available at the time of delivery of the Bonds. The various legal opinions to be delivered concurrently with the delivery of the Bonds express the professional judgment of the attorneys rendering the opinions as to the legal issues explicitly addressed therein. By rendering a legal opinion, the opinion giver does not become an insurer or guarantor of that expression of professional judgment, of the transactions opined upon, or of the future performance of parties to such transaction, nor does the rendering of an opinion guarantee the outcome of any legal dispute that may arise out of the transaction.
BOND RATING Standard & Poor’s, a Division of The McGraw-Hill Companies, Inc. (the “Rating Agency”) has assigned a rating to the Bonds of “AAA” based on the underlying credit of the District. The rating reflects only the view of the Rating Agency at the time such rating is given, and the Underwriter and the District make no representation as to the appropriateness of such rating. An explanation of the significance of such rating may be obtained from the Rating Agency. The District has furnished the Rating Agency with certain information and materials relating to the Bonds and the District that have not been included in this Official Statement. Generally, rating agencies base their ratings on the information and materials so furnished and on investigations, studies and assumptions made by the rating agencies. There is no assurance that a particular rating will be maintained for any given period of time or that it will not be lowered or withdrawn entirely if, in the judgment of the rating agency originally establishing such rating, circumstances so warrant. Neither the Underwriter nor the District has undertaken any responsibility to bring to the attention of the holders of the Bonds any proposed revision or withdrawal of the rating of the Bonds or to oppose any such proposed revision or withdrawal. Any such revision or withdrawal of the ratings could have an adverse effect on the market price and marketability of the Bonds.
TAX MATTERS The following is a summary of the material federal and State of Missouri income tax consequences of holding and disposing of the Bonds. This summary is based upon laws, regulations, rulings and judicial decisions now in effect, all of which are subject to change (possibly on a retroactive basis). This summary does not discuss all aspects of federal income taxation that may be relevant to investors in light of their personal investment circumstances or describe the tax consequences to certain types of owners subject to special treatment under the federal income tax laws (for example, dealers in securities or other persons who do not hold the Bonds as a capital asset, tax-exempt organizations, individual retirement accounts and other tax deferred accounts, and foreign taxpayers), and, except for the income tax laws of the State of Missouri, does not discuss the consequences to an owner under any state, local or foreign tax laws. The summary does not deal with the tax treatment of persons who purchase the Bonds in the secondary market. Prospective investors are advised to consult their own tax advisors regarding federal, state, local and other tax considerations of holding and disposing of the Bonds.

-8-
Opinion of Bond Counsel In the opinion of Gilmore & Bell, P.C., Bond Counsel, under the law existing as of the issue date of the Bonds: Federal and Missouri Tax Exemption. The interest on the Bonds is excludable from gross income for federal income tax purposes and is exempt from income taxation by the State of Missouri. Alternative Minimum Tax. Interest on the Bonds is not an item of tax preference for purposes of computing the federal alternative minimum tax imposed on individuals and corporations, but is taken into account in determining adjusted current earnings for the purpose of computing the alternative minimum tax imposed on certain corporations. Bank Qualification. The Bonds have not been designated as “qualified tax-exempt obligations” within the meaning of Section 265(b)(3) of the Internal Revenue Code of 1986, as amended (the “Code”).
Bond counsel’s opinions are provided as of the date of the original issue of the Bonds, subject to the condition that the District comply with all requirements of the Code that must be satisfied subsequent to the issuance of the Bonds in order that interest thereon be, or continue to be, excludable from gross income for federal income tax purposes. The District has covenanted to comply with all such requirements. Failure to comply with certain of such requirements may cause the inclusion of interest on the Bonds in gross income for federal and Missouri income tax purposes retroactive to the date of issuance of the Bonds. Bond Counsel is expressing no opinion regarding other federal, state or local tax consequences arising with respect to the Bonds but has reviewed the discussion under the heading “TAX MATTERS.” Other Tax Consequences Original Issue Premium. If a Bond is issued at a price that exceeds the stated redemption price at maturity of the Bond, the excess of the purchase price over the stated redemption price at maturity constitutes “premium” on that Bond. Under Section 171 of the Code, the purchaser of that Bond must amortize the premium over the term of the Bond using constant yield principles, based on the purchaser’s yield to maturity. As premium is amortized, the owner’s basis in the Bond and the amount of tax-exempt interest received will be reduced by the amount of amortizable premium properly allocable to the owner. This will result in an increase in the gain (or decrease in the loss) to be recognized for federal income tax purposes on sale or disposition of the Bond prior to its maturity. Even though the owner’s basis is reduced, no federal income tax deduction is allowed. Prospective investors should consult their own tax advisors concerning the calculation and accrual of bond premium.
Sale, Exchange or Retirement of Bonds. Upon the sale, exchange or retirement (including
redemption) of a Bond, an owner of the Bond generally will recognize gain or loss in an amount equal to the difference between the amount of cash and the fair market value of any property received on the sale, exchange or retirement of the Bond (other than in respect of accrued and unpaid interest) and such owner’s adjusted tax basis in the Bond. To the extent a Bond is held as a capital asset, such gain or loss will be capital gain or loss and will be long-term capital gain or loss if the Bond has been held for more than 12 months at the time of sale, exchange or retirement.
Reporting Requirements. In general, information reporting requirements will apply to certain
payments of principal, interest and premium paid on the Bonds, and to the proceeds paid on the sale of the Bonds, other than certain exempt recipients (such as corporations and foreign entities). A backup withholding tax will apply to such payments if the owner fails to provide a taxpayer identification number or certification of foreign or other exempt status or fails to report in full dividend and interest income. The amount of any

-9-
backup withholding from a payment to an owner will be allowed as a credit against the owner’s federal income tax liability.
Collateral Federal Income Tax Consequences. Prospective purchasers of the Bonds should be aware that ownership of the Bonds may result in collateral federal income tax consequences to certain taxpayers, including, without limitation, financial institutions, property and casualty insurance companies, individual recipients of Social Security or Railroad Retirement benefits, certain S corporations with “excess net passive income,” foreign corporations subject to the branch profits tax, life insurance companies, and taxpayers who may be deemed to have incurred or continued indebtedness to purchase or carry or have paid or incurred certain expenses allocable to the Bonds. Bond Counsel expresses no opinion regarding these tax consequences. Purchasers of Bonds should consult their tax advisors as to the applicability of these tax consequences and other federal income tax consequences of the purchase, ownership and disposition of the Bonds, including the possible application of state, local, foreign and other tax laws.
CONTINUING DISCLOSURE UNDERTAKING
The District will covenant in the Continuing Disclosure Undertaking to file certain financial information and operating data relating to the District (updated within not later than 180 days following the end of its fiscal year, which currently ends June 30) (the “Annual Report”) commencing with the Annual Report for the fiscal year ending June 30, 2011, and to file notices of the occurrence of certain enumerated events, if material. The Annual Report shall be filed by or on behalf of the District with the Municipal Securities Rulemaking Board (the “MSRB”) through the Electronic Municipal Market Access system (“EMMA”). The Annual Report shall include:
(a) The audited financial statements of the District for the prior fiscal year, prepared in accordance with general accounting principles.
(b) Information relating to the District and its operations set forth in the tables under the
following sections in Appendix A of this Official Statement: “THE DISTRICT – History of Enrollment” and “PROPERTY TAX INFORMATION – Property Valuations,” “– Tax Rates” “– Tax Collections” and “– Major Taxpayers” and information with respect to litigation if, in the judgment of the District, such litigation would have a material adverse affect on the financial condition of the District.
Within 10 business days after the occurrence of any of the following events, the District shall give, or
cause to be given to the MSRB through EMMA, notice of the occurrence of any of the following events with respect to the Bonds (“Material Events”):
(1) principal and interest payment delinquencies; (2) non-payment related defaults, if material; (3) unscheduled draws on debt service reserves reflecting financial difficulties; (4) unscheduled draws on credit enhancements reflecting financial difficulties; (5) substitution of credit or liquidity providers, or their failure to perform; (6) adverse tax opinions; the issuance by the Internal Revenue Service of proposed or final
determinations of taxability, Notices of Proposed Issue (IRS Form 570-TEB) or other material notices or determinations with respect to the tax status of the Bonds, or other material events affecting the tax status of the Bonds;
(7) modifications to rights of bondholders, if material; (8) bond calls, if material, and tender offers; (9) defeasances;

-10-
(10) release, substitution or sale of property securing repayment of the Bonds, if material; (11) rating changes; (12) bankruptcy, insolvency, receivership or similar event of the District; (13) the consummation of a merger, consolidation, or acquisition involving the District or the sale
of all or substantially all of the assets of the District, other than in the ordinary course of business, the entry into a definitive agreement to undertake such an action or the termination of a definitive agreement relating to any such actions, other than pursuant to its terms, if material; and
(14) appointment of a successor or additional trustee or the change of name of the Paying Agent, if material.
Nothing in the Continuing Disclosure Undertaking shall be deemed to prevent the District from disseminating any other information using the means of dissemination set forth in the Continuing Disclosure Undertaking, or any other means of communication, or including any other information in any Annual Report or notice of occurrence of a Material Event, in addition to that which is required by the Continuing Disclosure Undertaking. If the District chooses to include any information in any Annual Report or notice of occurrence of a Material Event in addition to that which is specifically required, the District shall have no obligation to update such information or include it in any future Annual Report or notice of occurrence of a Material Event. These covenants have been made in order to assist the Underwriter in complying with Rule 15c2-12 promulgated by the Securities and Exchange Commission.
The District has made a similar undertaking with respect to its outstanding general obligation bonds to file an Annual Report for each fiscal year of the District. The District covenanted to include in its Annual Report the District’s audited financial statements for the previous year in addition to updated information relating to the District and its operations. The District is not now and has never been in default with respect to any continuing disclosure obligation of the District under Rule 15c2-12.
ABSENCE OF LITIGATION
As of the date hereof, there is no controversy, suit or other proceeding of any kind pending or, to the
District’s knowledge, threatened wherein or whereby any question is raised or may be raised, questioning, disputing or affecting in any way the legal organization of the District or its boundaries, or the right or title of any of its officers to their respective offices, or the legality of any official act in connection with the authorization, issuance and sale of the Bonds, or the constitutionality or validity of the Bonds or any of the proceedings had in relation to the authorization, issuance or sale thereof, or the levy and collection of a tax to pay the principal and interest thereof, or which might affect the District’s ability to meet its obligations to pay the Bonds.
UNDERWRITING Piper Jaffray & Co. Incorporated (the “Underwriter”), has agreed to purchase the Bonds at a price of $10,900,479.45 (which is equal to the aggregate original principal amount of the Bonds, less an underwriting discount of $39,620.00 plus original issue premium of $1,035,099.45). The Underwriter is purchasing the Bonds for resale in the normal course of the Underwriter’s business activities. The Underwriter reserves the right to offer any of the Bonds to one or more purchasers on such terms and conditions and at such price or prices as the Underwriter, in its discretion, shall determine.

-11-
The Underwriter has entered into an agreement (the “Distribution Agreement”) with Advisors Asset Management, Inc. (“AAM”) for the distribution of certain municipal securities offerings allocated to the Underwriter at the original offering prices. Under the Distribution Agreement, if applicable to the Bonds, the Underwriter will share with AAM a portion of the fee or commission, exclusive of management fees, paid to the Underwriter.
CERTAIN RELATIONSHIPS
Gilmore & Bell, P.C., Bond Counsel, has represented the Underwriter and the Paying Agent in
transactions unrelated to the issuance of the Bonds, but is not representing the Underwriter or the Paying Agent in connection with the issuance of the Bonds.
MISCELLANEOUS The references, excerpts and summaries of all documents referred to herein do not purport to be complete statements of the provisions of such documents, and reference is made to all such documents for full and complete statements of all matters of fact relating to the Bonds, the security for the payment of the Bonds and the rights of the Owners thereof. During the period of the offering, copies of drafts of such documents may be examined at the offices of the Underwriter; following delivery of the Bonds, copies of such documents may be examined at the principal payment office of the Paying Agent. The information contained in this Official Statement has been compiled from official and other sources that are deemed to be reliable, and while not guaranteed as to completeness or accuracy, is believed to be correct as of this date. Any statement made in this Official Statement involving matters of opinion or of estimates, whether or not expressly so stated, are set forth as such and not as representations of fact, and no representation is made that any of the estimates will be realized. The information and expressions of opinion herein are subject to change without notice and neither the delivery of this Official Statement nor any sale made hereunder shall, under any circumstances, create any implication that there has been no change in the information presented herein since the date hereof. This Official Statement is not to be construed as a contract or agreement between the District, the Paying Agent, or the Underwriter and the purchasers or Owners of any Bonds. The District has duly authorized the delivery of this Official Statement.
ROCKWOOD R-6 SCHOOL DISTRICT, ST. LOUIS COUNTY, MISSOURI By: /s/Steve Smith President of the Board of Education

(THIS PAGE LEFT BLANK INTENTIONALLY)

APPENDIX A
INFORMATION REGARDING THE DISTRICT

TABLE OF CONTENTS PAGE
THE DISTRICT .............................................................................................................................................. A-1
General ....................................................................................................................................................... A-1 Board of Education .................................................................................................................................... A-1 Administration ........................................................................................................................................... A-1 Professional Staff ....................................................................................................................................... A-2 Employee Relations ................................................................................................................................... A-2 History of Enrollment ................................................................................................................................ A-3 School Rating and Accreditation ............................................................................................................... A-3 Educational Programs and Services ........................................................................................................... A-4 Educational Facilities ................................................................................................................................. A-4
ECONOMIC INFORMATION CONCERNING THE DISTRICT ........................................................... A-7 Commerce, Industry and Employment ...................................................................................................... A-7 Population and Other Statistics .................................................................................................................. A-9
FINANCIAL INFORMATION CONCERNING THE DISTRICT ......................................................... A-11 Accounting, Budgeting and Auditing Procedures .................................................................................... A-11 Sources of Revenue .................................................................................................................................. A-12 Local Revenue ......................................................................................................................................... A-13 State Revenue ........................................................................................................................................... A-14 Federal Revenue ....................................................................................................................................... A-15 Tax Limitation Provisions ........................................................................................................................ A-15 Fund Placement and Expenditure Restrictions ......................................................................................... A-16 Summary of Revenues, Expenditures and Fund Balances ....................................................................... A-18 Property and Liability Insurance .............................................................................................................. A-18 Pension and Employee Retirement Plans ................................................................................................. A-19
PROPERTY TAX INFORMATION .......................................................................................................... A-19 Property Valuations ................................................................................................................................. A-19 Tax Rates ................................................................................................................................................. A-20 Tax Collections ........................................................................................................................................ A-21 Major Property Taxpayers ....................................................................................................................... A-22 Tax Abatement and Tax Increment Financing ......................................................................................... A-23
DEBT STRUCTURE OF THE DISTRICT ................................................................................................ A-23 Debt Ratios and Related Information ....................................................................................................... A-23 General ..................................................................................................................................................... A-24 General Obligation Indebtedness ............................................................................................................. A-24 Overlapping General Obligation Indebtedness ........................................................................................ A-25 Legal Debt Capacity................................................................................................................................. A-25 Debt Service Requirements for General Obligation Bonds Outstanding ................................................. A-26 Operating Leases ...................................................................................................................................... A-26 No Prior Defaults ..................................................................................................................................... A-27 Future Plans ............................................................................................................................................. A-27
THE DISTRICT
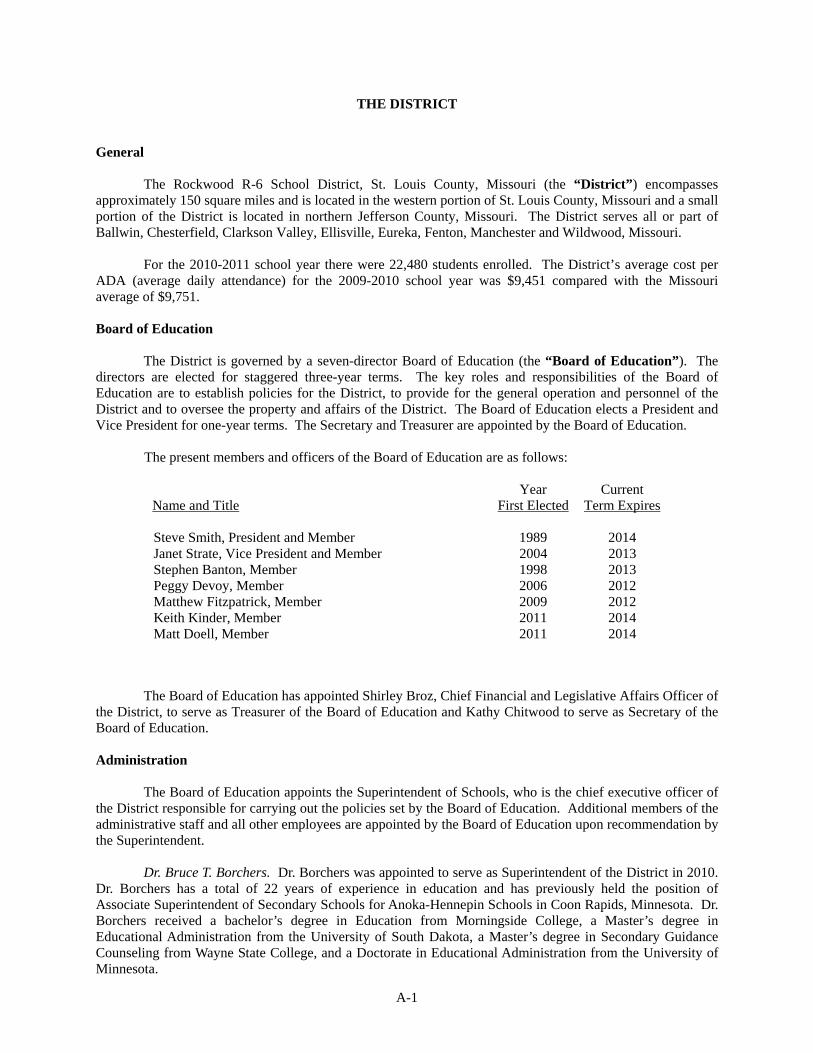
General The Rockwood R-6 School District, St. Louis County, Missouri (the “District”) encompasses approximately 150 square miles and is located in the western portion of St. Louis County, Missouri and a small portion of the District is located in northern Jefferson County, Missouri. The District serves all or part of Ballwin, Chesterfield, Clarkson Valley, Ellisville, Eureka, Fenton, Manchester and Wildwood, Missouri. For the 2010-2011 school year there were 22,480 students enrolled. The District’s average cost per ADA (average daily attendance) for the 2009-2010 school year was $9,451 compared with the Missouri average of $9,751. Board of Education The District is governed by a seven-director Board of Education (the “Board of Education”). The directors are elected for staggered three-year terms. The key roles and responsibilities of the Board of Education are to establish policies for the District, to provide for the general operation and personnel of the District and to oversee the property and affairs of the District. The Board of Education elects a President and Vice President for one-year terms. The Secretary and Treasurer are appointed by the Board of Education.
The present members and officers of the Board of Education are as follows:
Year Current
Name and Title First Elected Term Expires Steve Smith, President and Member 1989 2014 Janet Strate, Vice President and Member 2004 2013 Stephen Banton, Member 1998 2013 Peggy Devoy, Member 2006 2012 Matthew Fitzpatrick, Member 2009 2012 Keith Kinder, Member 2011 2014 Matt Doell, Member 2011 2014
The Board of Education has appointed Shirley Broz, Chief Financial and Legislative Affairs Officer of the District, to serve as Treasurer of the Board of Education and Kathy Chitwood to serve as Secretary of the Board of Education. Administration
The Board of Education appoints the Superintendent of Schools, who is the chief executive officer of the District responsible for carrying out the policies set by the Board of Education. Additional members of the administrative staff and all other employees are appointed by the Board of Education upon recommendation by the Superintendent.
Dr. Bruce T. Borchers. Dr. Borchers was appointed to serve as Superintendent of the District in 2010.
Dr. Borchers has a total of 22 years of experience in education and has previously held the position of Associate Superintendent of Secondary Schools for Anoka-Hennepin Schools in Coon Rapids, Minnesota. Dr. Borchers received a bachelor’s degree in Education from Morningside College, a Master’s degree in Educational Administration from the University of South Dakota, a Master’s degree in Secondary Guidance Counseling from Wayne State College, and a Doctorate in Educational Administration from the University of Minnesota.
A-1

Ms. Shirley Broz. Ms. Broz was appointed to serve as Chief Financial and Legislative Affairs Officer
of the District in 2009 and has been with the District since 1996. Ms. Broz is a certified public accountant, and received a bachelor’s degree in Business Administration from Lindenwood University and a Master’s degree in Business Administration from Webster University.
Professional Staff
The District has 3,316 employees, including 118 administrative personnel, 1,590 teachers, librarians and counselors and 1,608 support staff. The average years of teaching experience for the 2009-10 school year was 12.5 years. Approximately 73% of the teaching staff have master’s degrees. Approximately 80% of the staff is tenured.
The starting teacher’s salary for the 2009-10 school year is $38,250 with an average teacher salary of $52,828.
The District has a maximum class size goal of 23 students for grades K-2, 25 students for grades 3-5, 28 students for grades 6-8 and 30 students for grades 9-12. The current average student-teacher ratio for the District is 18 to 1.
Employee Relations Teaching staff are reviewed after the first year of employment, and thereafter on an annual basis until they achieve tenure. Thereafter, tenured teachers are reviewed every third year. During the initial five years of employment, teaching staff are retained on a probationary basis. Teaching staff may join professional groups or associations. The District, pursuant to State law, conducts a meet and confer process with the representative teacher organization. The Superintendent of the District believes that employee relations are excellent.
[Remainder of Page Intentionally Left Blank.]
A-2

History of Enrollment Listed below are the District’s Fall enrollment figures for the preceding three school years and the current school year:
Grade 2006-07 2007-08 2008-09 2009-10
K 1,427 1,442 1,381 1,390 1st 1,605 1,495 1,504 1,479 2nd 1,578 1,658 1,504 1,571 3rd 1,628 1,633 1,691 1,554 4th 1,662 1,692 1,676 1,753 5th 1,641 1,724 1,696 1,698 6th 1,797 1,710 1,777 1,748 7th 1,716 1,844 1,735 1,778 8th 1,817 1,742 1,836 1,760 9th 1,984 1,958 1,944 2,048
10th 1,848 1,969 1,928 1,868 11th 1,775 1,716 1,887 1,837 12th 1,685 1,749 1,670 1,834
Total 22,163 22,332 22,229 22,318
Source: District’s reports of Fall enrollment data filed with Missouri Department of Elementary and Secondary Education and
the District. School Rating and Accreditation Missouri law requires the Department of Elementary and Secondary Education (“DESE”) to regularly evaluate each public school district. DESE has assigned the District “accredited” status, the highest accreditation status given by DESE. The process of accrediting school districts is mandated by State law, and the specific responsibilities are outlined both by rules of the State Board of Education and in Section 161.092 of the Revised Statutes of Missouri, as amended. Under DESE’s current accreditation system, school districts are evaluated every five years based on DESE standards in three areas: resource standards, educational process standards and performance standards. Districts receive an evaluation judgment for each of the three sets of standards and an overall evaluation, which evaluations are in one of three categories: “accredited,” “provisionally accredited” or “unaccredited.” As of July 2008, 513 (97.9%) of all school districts in the State were “accredited,” 7 (1.3%) were “provisionally accredited,” 1 (0.2%) was “interim” credited and 3 (0.6%) were “unaccredited” under the Missouri School Improvement Program (“MSIP”) rating system. The District’s 2009-10 MSIP review resulted in accreditation once again. Annually, DESE gives special recognition to certain school districts that have demonstrated outstanding academic performance and consistent progress in the areas that are measured by the State’s school-accreditation standards. For the 2009-2010 school year, DESE awarded the District the prestigious “Distinction in Performance Award” for the eighth consecutive year. The award is based on the same 14 academic standards used in the accreditation review process. To receive the award, a school district must meet 13 out of the 14 standards, including all of the Missouri Assessment Program based measures. The District met all 14 standards and received the “High Achievement” level of Distinction in Performance Award.
A-3

Educational Programs and Services The District is proud of the programs and services it provides and the quality of students it educates. Outlined in the following paragraphs are selected programs and activities offered by the District. Early Childhood Development The District operates a comprehensive Early Childhood Development program designed to assist parents and children from birth through five years of age. The Parents As Teachers program is a free parent education and support program for new and expecting parents in skills related to child development and parenting. The Early Childhood Special Education program provides services to preschool children who have significant development delays. The District also provides developmental screening which measures a child’s development in the areas of speech and language skills, motor skills, general knowledge, hearing and vision. The District also offers Preschool and Mini-Preschool to children three to five years of age. Accelerated Programs The Center for Creative Learning (grades K-5), Academic Stretch (grades 6-8), and the Secondary Gifted Program (grades 9-12) comprise the District’s program for academically gifted students. All students involved in this program meet criteria set forth by the District and approved by the Missouri Department of Elementary and Secondary Education. The District’s high schools offer numerous Advanced Placement and college credit courses. Special Education Programs The District is a component district of the Special School District of St. Louis County. The District’s special education for its students is supplied by the Special School District of St. Louis County. Extracurricular Activities The District has a full program of extracurricular activities for high school students. The athletic program includes fall, winter and spring sports for both boys and girls. Some interscholastic teams include both underclass and varsity level competition. An intramural program offers recreational opportunities for students interested in exercise and leisure time pursuits. Clubs and organizations ranging from athletic support groups to music, journalism, drama, yearbook and student council are also available. At the intermediate schools, students have the opportunity to participate in intramurals, student council, drama and music. The District is committed to encouraging students to take advantage of the opportunities offered by its program of extracurricular activities. Voluntary Transfer Student The District participates in a Voluntary Transfer Student program in which St. Louis City resident African-American students volunteer to transfer to the District’s schools. As of September 2010, this K-12 program represented approximately 8.6% of the District’s population. Educational Facilities
The District currently operates 33 schools, including 2 preschools, 19 elementary schools, 6 middle schools, 4 high schools, 2 Centers for Creative Learning (gifted K-5) and the Individualized Learning Center located at the District’s Administrative Center for students at risk of not graduating high school.
A-4

Information about the District’s school facilities is listed below:
Schools
Location
Grades
Approx. Enrollment
Eureka Senior High School 4525 Highway 109
Eureka, Missouri 63025 9-12 1,918
Lafayette Senior High School 17050 Clayton Road
Ballwin, Missouri 63011 9-12 2,013
Marquette Senior High School 2351 Clarkson Road
Chesterfield, Missouri 63017 9-12 2,215
Rockwood Summit Senior High School 1780 Hawkins Road
Fenton, Missouri 63026 9-12 1,301
Crestview Middle School 16025 Clayton Road
Ellisville, Missouri 63011 6-8 1,211
LaSalle Springs Middle School 3300 Highway 109
Wildwood, Missouri 63038 6-8 929
Rockwood South Middle School 1628 Hawkins Road
Fenton, Missouri 63026 6-8 1,006
Rockwood Valley Middle School 1220 Babler Park Drive
Wildwood, Missouri 63038 6-8 768
Selvidge Middle School 235 New Ballwin Road
Ballwin, Missouri 63021 6-8 691
Wildwood Middle School 17401 Manchester Road
Wildwood, Missouri 63038 6-8 764
Babler Elementary School 1955 Shepard Road
Wildwood, Missouri 63038 K-5 573
Ballwin Elementary School 400 Jefferson
Ballwin, Missouri 63021 K-5 558
Blevins Elementary School 25 E. North Street
Eureka, Missouri 63025 K-5 497
Bowles Elementary School 501 Bowles Avenue
Fenton, Missouri 63026 K-5 327
Chesterfield Elementary School 17700 Wild Horse Creek Road
Chesterfield, Missouri 63005 K-5 540
Ellisville Elementary School 1425 Froesel
Ellisville, Missouri 63011 K-5 570
A-5

Eureka Elementary School 442 W. Fourth Street Eureka, Missouri 63025
K-5 308
Fairway Elementary School 480 Old Fairway Drive Wildwood, Missouri 63040
K-5 556
Geggie Elementary School 430 Bald Hill Road
Eureka, Missouri 63025 K-5 555
Green Pines Elementary School 16543 Green Pines Drive
Ellisville, Missouri 63011 K-5 472
Kehrs Mill Elementary School 2650 Kehrs Mill Road
Chesterfield, Missouri 63017 K-5 622
Kellison Elementary School 1626 Hawkins Road
Fenton, Missouri 63026 K-5 461
Pond Elementary School 17200 Manchester Road
Wildwood, Missouri 63040 K-5 449
Ridge Meadows Elementary School 777 Ridge Road
Ellisville, Missouri 63021 K-5 503
Stanton Elementary School 1430 Flora Del Drive
Fenton, Missouri 63026 K-5 539
Uthoff Valley Elementary School 1600 Uthoff Drive
Fenton, Missouri 63026 K-5 531
Westridge Elementary School 908 Crestland
Ballwin, Missouri 63011 K-5 421
Wild Horse Elementary School 16695 Wild Horse Creek Road
Chesterfield, Missouri 63005 K-5 573
Woerther Elementary School 314 New Ballwin Road
Ballwin, Missouri 63021 K-5 565
Center for Creative Learning 1401 Froesel
Ellisville, Missouri 63011 1-2 N/A(1)
Center for Creative Learning 265 Old State Road
Ellisville, Missouri 63021 K, 3-5 N/A(1)
Early Childhood – Clarkson Valley 2730 Valley Road
Chesterfield, Missouri 63005 PK 43/193(2)
Early Childhood – Vandover Campus 1900 Hawkins Road
Fenton, Missouri 63026 PK 25/136(2)
(1) The Center for Creative Learning offers programs for academically gifted students in grades K-5 whose enrollment is counted in their respective elementary school. (2) Enrollment in full-day program/half-day program.
A-6

ECONOMIC INFORMATION CONCERNING THE DISTRICT
Commerce, Industry and Employment Major Employers. Listed below are the major employers located in the St. Louis metropolitan area and the approximate number of employees employed by each: Name Product or Service Employment 1. Boeing Integrated Defense Systems Space and Defense Production 15,500 2. SSM Health Care Health Care 11,951 3. Schnucks Markets Inc. Grocery Store 10,800 4. St. John’s Mercy Health Care Health Care 8,042 5. Special School District Education 5,789 6. Dierberg’s Markets Grocery Store 5,000 7. Edward Jones Financial Services 4,844 8. Enterprise Rent-A-Car Auto Rental and Leasing 3,500 9. Washington University Education 3,175 10. St. Louis County Government Government 4,114 Source: St. Louis Regional Chamber and Growth Association. Unemployment. The following table sets forth estimates of the unemployment rates for St. Louis County, the State of Missouri and the United States for 2002 through 2010:
Unemployment Rates
St. Louis
County ** State of Missouri
United States
4.8% 5.2% 5.8% 5.2 5.6 6.0 5.5 5.8 5.5 5.1 5.4 5.1 4.7 4.8 4.6 4.9 5.1 4.6 5.9 6.1 5.8 9.0 9.3 9.7 9.4 9.6 9.6
Source: U.S. Department of Labor, Bureau of Labor Statistics. *Figures are averages for the year
A-7

The following table represents workforce by occupation in the District, St. Louis County and the State of Missouri according to the 2000 Census:
District St. Louis County State of Missouri Occupation Number Percent Number Percent Number Percent Management, professional and related occupations 26,807 48.1% 210,366 41.6% 836,005 31.4% Service 5,677 10.2 63,158 12.5 399,052 15.0 Sales and office 16,253 29.2 148,738 29.4 714,303 26.9 Farming, fishing and forestry 83 0.1 513 0.1 17,240 0.6 Construction, extraction and maintenance 3,361 6.0 32,105 6.4 259,266 9.8 Production, transportation and material moving 3,556 6.4 50,370 10.0 432,058 16.3 Total 55,737 100.0% 505,250 100.0% 2,657,924 100.0%
Source: U.S. Bureau of the Census (2000 Census). The following table represents employees by industry in St. Louis County and the State of Missouri according to the 2000 Census
St. Louis County
State of Missouri
Industry Number Percent Number Percent Agriculture, forestry, fishing, hunting and mining 1,146 0.2% 58,415 2.2% Construction 24,817 4.9 182,858 6.9 Manufacturing 64,212 12.7 393,440 14.8 Wholesale trade 21,290 4.2 97,021 3.7 Retail trade 57,061 11.3 315,872 11.9 Transportation and warehousing and utilities 27,141 5.4 150,641 5.7 Information 19,021 3.8 80,623 3.0 Finance, insurance, real estate, and rental and leasing 45,603 9.0 177,651 6.7 Professional, scientific, management, administrative and waste management services 56,101 11.1 198,547 7.5 Educational, health and social services 109,440 21.7 541,715 20.4 Arts, entertainment, recreation, accommodation and food services 38,345 7.6 206,295 7.8 Other services (except public administration) 24,398 4.8 132,940 5.0 Public administration 16,675 3.3 121,906 4.6 Total 505,250 100.0% 2,657,924 100.0%
Source: U.S. Bureau of the Census (2000 Census).
A-8
Population and Other Statistics
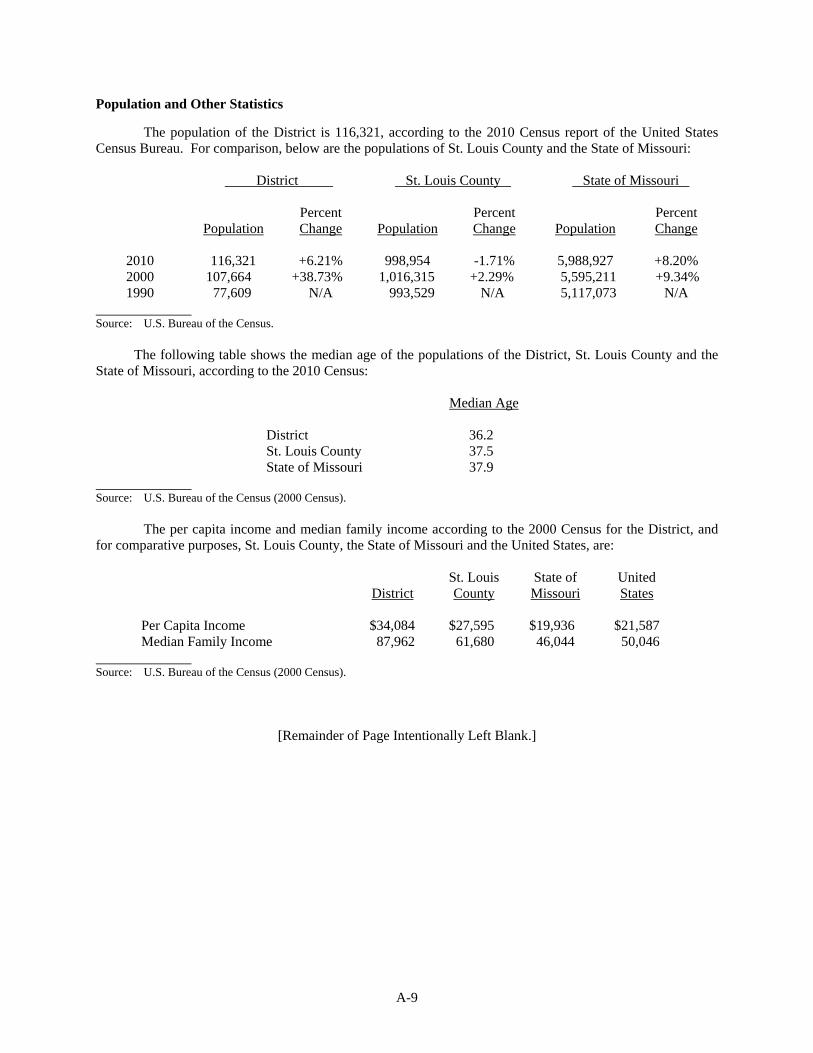
The population of the District is 116,321, according to the 2010 Census report of the United States Census Bureau. For comparison, below are the populations of St. Louis County and the State of Missouri:
District St. Louis County State of Missouri
Population Percent Change
Population
Percent Change
Population
Percent Change
2010 116,321 +6.21% 998,954 -1.71% 5,988,927 +8.20% 2000 107,664 +38.73% 1,016,315 +2.29% 5,595,211 +9.34% 1990 77,609 N/A 993,529 N/A 5,117,073 N/A
Source: U.S. Bureau of the Census.
The following table shows the median age of the populations of the District, St. Louis County and the
State of Missouri, according to the 2010 Census:
Median Age
District 36.2 St. Louis County 37.5 State of Missouri 37.9
Source: U.S. Bureau of the Census (2000 Census).
The per capita income and median family income according to the 2000 Census for the District, and for comparative purposes, St. Louis County, the State of Missouri and the United States, are:
District
St. Louis County
State of Missouri
United States
Per Capita Income $34,084 $27,595 $19,936 $21,587 Median Family Income 87,962 61,680 46,044 50,046
Source: U.S. Bureau of the Census (2000 Census).
[Remainder of Page Intentionally Left Blank.]
A-9

The following table represents the distribution of household income for the District, St. Louis County and the State of Missouri according to the 2000 Census:
District St. Louis County State of Missouri Income
Number
Percent
Number
Percent
Number
Percent
Under $10,000 1,040 2.8% 23,049 5.7% 221,242 10.1% $10,000 to $14,999 651 1.7 18,211 4.5 154,370 7.0 $15,000 to $24,999 1,890 5.1 43,402 10.7 319,986 14.6 $25,000 to $34,999 2,358 6.3 49,378 12.2 314,611 14.3 $35,000 to $49,999 4,091 11.0 65,737 16.2 385,315 17.5 $50,000 to $74,999 7,673 20.5 85,179 21.1 415,772 18.9 $75,000 to $99,999 6,575 17.6 48,720 12.0 193,561 8.8 $100,000 to $149,999 7,415 19.9 42,141 10.4 125,566 5.7 $150,000 or more 5,634 15.1 28,790 7.1 66,791 3.0 Total 37,327 100.0% 404,607 100.0% 2,197,214 100.0%
Source: U.S. Bureau of the Census (2000 Census).
The following table sets forth per capita personal income for St. Louis County and the State of
Missouri for 2001 through 2008, the most recent years for which figures are available:
St. Louis County
State of Missouri
Year
Per Capita Personal Income(1)
% Change
Per Capita Personal Income(1)
% Change
2001 $40,031 N/A $27,816 N/A 2002 41,760 4.32% 28,385 2.05% 2003 43,075 3.15 29,122 2.60 2004 44,888 4.21 30,283 3.99 2005 2006
46,361 48,848
3.28 5.36
31,202 32,514
3.03 4.20
2007 51,710 5.86 33,964 4.46 2008 No Data 35,228 3.72
(1) Per Capita Personal Income is the annual total Personal Income of residents divided by resident population as of July 1.
“Personal Income” is the sum of Net Earnings by place of residence, rental income of persons, personal dividend income, personal interest income, and transfer payments. “Net Earnings” is earnings by place of work — the sum of wage and salary disbursements (payrolls), other labor income, and proprietors’ income — less personal contributions for social insurance, plus an adjustment to convert earnings by place of work to a place-of-residence basis. Personal income is measured before the deduction of personal income taxes and other personal taxes and is reported in current dollars (no adjustment is made for price changes).
Source: U.S. Department of Commerce - Bureau of Economic Analysis.
A-10

Set forth below are the median (owner-occupied) house values according to the 2000 Census for the District, and for comparative purposes, St. Louis County, the State of Missouri and the United States.
Median House Value District $191,485 St. Louis County 116,600 State of Missouri 89,900 United States 119,600
Source: U.S. Bureau of the Census (2000 Census). The value of specified owner-occupied housing units of the District, St. Louis County and the State of Missouri was, according the 2000 Census, as follows: District St. Louis County State of Missouri Value
Number
Percent
Number
Percent
Number
Percent
Under $50,000 209 0.7% 20,167 7.2% 198,814 16.7% $50,000 to $99,999 3,061 10.1 97,337 34.8 491,675 41.4 $100,000 to $149,999 6,516 21.5 64,418 23.1 262,103 22.1 $150,000 to $199,999 6,336 21.0 38,491 13.8 117,791 9.9 $200,000 to $299,999 8,034 26.6 32,423 11.6 74,880 6.3 $300,000 or more 6,075 20.1 26,505 9.5 43,179 3.6 Total 30,231 100.0% 279,341 100.0% 1,188,442 100.0% Source: U.S. Census Bureau (2000 Census).
FINANCIAL INFORMATION CONCERNING THE DISTRICT Accounting, Budgeting and Auditing Procedures General. The District’s financial statements include all funds, account groups, departments, agencies, boards, commissions and other organizations over which the District is financially accountable.
Accounts are organized on the basis of funds or groups of accounts, each of which is considered to be a separate set of self-balancing accounts which comprise its assets, liabilities, fund balances, revenues, expenditures and expenses. Following are the funds and account groups used by the District:
General (Incidental) Fund – This fund is used to account for general activities of the District, including expenditures for noncertified employees, pupil transportation costs, plant operation, fringe benefits, student body activities, community services, food service and any expenditures not required or permitted to be accounted for in other funds.
Special Revenue (Teachers’) Fund – This fund is used to account for expenditures for certified employees involved in administration and instruction. It includes revenues restricted by the State and the local tax levy for the payment of teacher salaries and certain employee benefits.
Debt Service Fund – This fund is used to account for the accumulation of resources for, and the payment of, principal, interest and fiscal charges on long-term debt.
Capital Projects Fund – This fund is used to account for the proceeds of long-term debt, taxes and other revenues to be used for the acquisition or construction of major capital assets.
A-11

Basis of Accounting. Basis of accounting refers to when revenues and expenditures are recognized in the accounts and reported in the financial statements. The District’s accounting system for governmental funds reflect the modified accrual basis of accounting. At the end of the year, the governmental funds are converted from the modified accrual basis to the accrual basis for presentation in District-wide financial statements. Under the accrual basis of accounting, the current year’s revenues and expenses are recognized regardless of when cash is received or paid.
Budgets and Budgetary Accounting. The District follows these procedures in establishing the budgetary data reflected in the financial statements: 1. In accordance with Chapter 67 of the Revised Statutes of Missouri, as amended, the District
adopts a budget for each fund. 2. Prior to July, the Chief Financial Officer, who serves as the budget officer, submits to the
Board of Education a proposed budget for the fiscal year beginning on the following July 1. The proposed budget includes estimated revenues and proposed expenditures for all District funds. Budgeted expenditures cannot exceed beginning available monies plus estimated revenues for the year.
3. A public hearing is conducted to obtain taxpayer comments. Prior to its approval by the
Board of Education, the budget document is available for public inspection. 4. Prior to July 1, the budget is approved by a vote of the Board of Education. 5. Subsequent to its formal approval of the budget, the Board of Education has the authority to
make necessary adjustments to the budget by formal vote of the Board. Adjustments made during the year are reflected in the budget information included in the financial statements.
The financial records of the District are audited annually by an independent public accountant in accordance with generally accepted auditing standards. The most recent annual audit has been performed by Kerber, Eck & Braeckel LLP, Certified Public Accountants, St. Louis, Missouri. A copy of the audit for the fiscal year ended June 30, 2010, is included in this Official Statement as Appendix B. A summary of significant accounting policies of the District is contained in this Official Statement in the Notes accompanying the financial statements in Appendix B. Sources of Revenue
Missouri school districts finance their operations through the local property tax levy, State sales tax, State Aid, federal grant programs and miscellaneous sources including State Aid for Transportation, State Aid for Handicapped Students, a State sales tax on cigarettes (“fair share revenues”) and a pro rata share of interest income from the counties in which each school district operates. Debt service is financed primarily through local property taxes.
A-12

The following table shows the allocation of the District’s revenue from the various sources for the fiscal year ended June 30, 2010.
Revenue Source % of Total Local Revenue 81.56% County Revenue 1.26 State Revenue 11.93 Federal Revenue 4.95 Other Revenue 2.90
Total 100.00% Source: Comprehensive Annual Financial Report for the Fiscal Year ended June 30, 2010.
The following table shows the District’s sources of revenues for the five fiscal years shown:
Fiscal
Year Ended
June 30
Property
Taxes
Other Local
County
Revenue
State
Revenue
Federal Revenue
Other
Revenue
Total
Revenue
2006 $123,859,355 $59,450,075 $2,478,229 $23,046,005 $ 5,255,067 $ 10,572 $214,099,303.98 2007 125,884,804 63,635,207 2,898,674 25,369,682 5,170,614 442,706 223,401,687.00 2008 134,683,975 73,206,002 2,920,465 28,742,867 5,642,010 601,773 245,797,092.00 2009 142,218,514 66,473,286 2,859,875 30,822,501 6,847,041 532,605 249,753,822.00 2010 137,515,532 63,824,656 3,117,999 29,459,257 12,229,485 715,216 246,862,145.00
Source: Comprehensive Annual Financial Report for the Fiscal Year ended June 30, 2010.
Local Revenue The primary sources of “local revenue” are (1) taxes upon real and personal property within a district, excluding railroad and utility property taxes, which are more fully described below under the caption “PROPERTY TAX INFORMATION,” (2) fines and forfeitures collected as a result of violations within a district’s boundaries, (3) a district’s allocable portion of state assessed railroad and utility property taxes collected and distributed by the county or counties in which it is located, and (4) receipts from a 1% state sales tax (commonly referred to as “Proposition C revenues”). For school taxation purposes, all state assessed railroad and utility property within a county is taxed uniformly at a rate determined by averaging the tax rates of all school districts in the county. No determination is made of the assessed value of the railroad and utility property that is physically located within the boundaries of each school district. Such tax collections for each county are distributed to the school districts within that county according to a formula, based in part on total student enrollment in each district and in part on the taxes levied by each district. Proposition C revenues are generated by a 1-cent state sales tax that was approved by the voters in 1982. The sales tax proceeds are deemed to be “local” revenues for school district accounting purposes. Under prior law, every school district in the State received a flat amount of Proposition C revenue for each eligible pupil. Effective July 1, 2006 such revenue is being distributed under the provisions of a revised state aid formula using weighted average daily attendance (see the section below captioned “FINANCIAL INFORMATION CONCERNING THE DISTRICT – State Revenue”). The following table shows the amounts of Proposition C revenue per pupil distributed for each of the fiscal years shown below:
A-13

Fiscal Year Ended June 30
Proposition C Revenue
2002 $779.34 2003 757.87 2004 792.14 2005 812.74 2006 857.07 2007 856.93(1) 2008 850.98(1) 2009 804.07 2010 758.00
(1) Per weighted average daily attendance. Under Proposition C, after determining its budget and the levy rate needed to produce required revenues to fund the budget, a school district must reduce the operating levy by an amount sufficient to decrease the revenues it would have received therefrom by an amount equal to approximately one-half of the estimated revenues to be received through Proposition C during the year. School districts may submit propositions to voters to forego some or all of the reduction in the operating levy that is otherwise required under terms of Proposition C. The voters within the District approved the elimination of the sales tax reduction requirement in February 1994. State Revenue The primary source of state revenue is provided under a formula enacted by Sections 163.011 through 163.071, Revised Statutes of Missouri, as amended. In its 2005 regular session, the Missouri General Assembly approved significant changes to the formula by adoption of Senate Bill 287 (“SB 287”), which became effective July 1, 2006 (other than certain changes to special education policies, which became effective August 28, 2005). SB 287 is intended to transition the State away from the prior local tax rate based formula, to a formula that is primarily student-needs based. The new formula is being phased in over a seven-year period, starting with the 2006-07 fiscal year. For the phase-in period, generally speaking, state aid for each school district will be calculated based on the following percentages of state aid paid to the district in the 2005-06 fiscal year and state aid payable to the new formula established under SB 287:
Phase-In Year
Percentage of 2005-06
State Aid Payment
Percentage of SB 287
Formula
2006-07 85% 15% 2007-08 70 30 2008-09 56 44 2009-10 42 58 2010-11 28 72 2011-12 14 86 2012-13 0 100
Effective for the 2006-07 school year, the basic formula for distribution of state aid to Missouri school districts is calculated pursuant to a formula that is primarily affected by a district’s weighted average daily attendance (“ADA”). Weighted ADA, under the new formula, is based upon regular term ADA plus summer school ADA, with additional weight assigned for students who qualify for free and reduced lunch, receive special education services, or possess limited English language proficiency. The amount of a school district’s basic state aid is determined under the new formula by multiplying a school district’s ADA by the “state adequacy target,” which is an amount calculated by DESE every two years as the minimum amount of funds a
A-14

school district needs in order to educate each student, and then reducing that figure by the school district’s “local effort,” further described in the next paragraph. For the 2006-07 school year, DESE set the state adequacy target at $6,117. The law provides that the recalculation by DESE can never result in a decrease from the previous state adequacy target amount. The adequacy target for 2011 will be $6,124 and for 2012 and beyond will be $6,131. For the 2006-07 fiscal year, the “local effort” figure utilized in a school district’s state aid calculation is the amount of locally generated revenue that the district would have received in the 2004-05 fiscal year if its operating levy was set at $3.43. The $3.43 amount is called the “performance levy.” After the 2006-07 fiscal year, a school district’s “local effort” amount will be frozen at the 2006-07 amount, except for adjustments due to increased locally collected fines or decreased assessed valuation in the district. Future growth in assessed valuation and operating levy increases above $3.43 will result in additional local revenue to the district, without affecting state aid payments. Similarly, a district’s inability or failure to impose an operating levy of at least $3.43 will result in lower amounts of local revenue, but will not impact future state aid payments. A “hold harmless” provision in SB 287 provides that no school district will receive less state aid, calculated on a per weighted ADA basis than it received in the 2005-06 fiscal year. To receive increases of state aid above this level requires that the total of a district’s local property tax levies in its Incidental and Teachers’ Funds must be at least $2.75 per $100 assessed valuation. Levy reductions required as a result of a “Hancock rollback” will not affect a district’s eligibility for state aid increases. Notwithstanding the table above regarding phase-in percentages, the District has experienced a 2% withholding of its basic formula funding for fiscal 2010 and is budgeting a 4-6% withholding for 2011 due to state budget constraints. In addition to state aid distributed pursuant to the basic formula described above, SB 287 provides for distribution of certain categorical sources of state aid to school districts. These include (1) 75% of allowable transportation costs, (2) the career ladder entitlement, (3) the vocational education entitlement, and (4) educational and screening program entitlements. SB 287 also provides for a separate distribution of that portion of the State’s gambling revenues, which state law requires be distributed to school districts on the basis of average daily attendance (versus weighted ADA, which applies to the basic formula distribution). These categorical sources of state aid and gambling revenue distributions had historically been included in basic formula state aid. Federal Revenue
School districts receive certain grants and other revenue from the federal government, which are usually required to be used for the specified purposes of the grant or funding program.
The federal “No Child Left Behind” law requires that every public school student must score at a
“proficient” level or higher in math and reading by 2014. Each state establishes its own proficiency levels. Federal sanctions for school districts that fail to meet established proficiency standards include providing parents and students from underperforming schools within a district the right to request a transfer to a school within the district that meets proficiency standards. In addition, schools that continue to fail to meet proficiency standards must, in addition to transfers and tutoring, make additional changes in staffing, curriculum and management. Federal sanctions apply only to public schools that receive Title I federal money. The District has been notified that some of its schools failed to meet the applicable proficiency standards. Tax Limitation Provisions The operating levy of a school district (consisting of all ad valorem taxes levied except the debt service levy) cannot exceed the “tax rate ceiling” for the current year without voter approval. The tax rate ceiling, determined annually, is the rate of levy which, when charged against the district’s assessed valuation for the current year, excluding new construction and improvements, will produce an amount of tax revenues
A-15

equal to tax revenues for the previous year increased by 5% or the Consumer Price Index, whichever is lower. Without the required percentage of voter approval, the tax rate ceiling cannot at any time exceed the greater of the tax rate in effect in 1980 or the most recent voter-approved tax rate (as adjusted pursuant to the provisions of the Hancock Amendment, more fully explained below). Under Article X, Section 11(b) of the Missouri Constitution, a school district may increase its operating levy up to $2.75 per $100 assessed valuation without voter approval. Any increase above $2.75, however, must be approved by a majority of the voters voting on the proposition. Further, pursuant to Article X, Section 11(c) of the Missouri Constitution, any increase above $6.00 must be approved by two-thirds of the voters voting on the proposition. The tax levy for debt service on a school district’s general obligation bonds is exempt from these limitations upon the tax rate ceiling. Article X, Section 22(a) of the Missouri Constitution (popularly known as the “Hancock Amendment”), approved in 1980, places limitations on total state revenues and the levying or increasing of taxes without voter approval. The Missouri Supreme Court has interpreted the definition of “total state revenues” to exclude voter-approved tax increases. The Hancock Amendment also includes provisions for rolling back tax rates. If the assessed valuation of property, excluding the value of new construction and improvements, increases by a larger percentage than the increase in the Consumer Price Index from the previous year (or 5%, if greater), the maximum authorized current levy must be reduced to yield the same gross revenue from existing property, adjusted for changes in the Consumer Price Index, as could have been collected at the existing authorized levy on the prior assessed value. This reduction is often referred to as a “Hancock rollback.” The limitation on local governmental units does not apply to taxes levied in the Debt Service Fund for the payment of principal and interest on general obligation bonds. Fund Placement and Expenditure Restrictions General. With few exceptions, revenues of school districts are required to be deposited, at the board of education’s discretion, in the Incidental or Teachers’ Funds. Money required to be deposited in the Incidental Fund includes money received from other districts for transportation and 25% of basic formula state aid, excluding state aid distributed from the Classroom Trust Fund (gaming revenues). The proceeds of property tax levies must be placed in the fund for which the levy was extended. Money donated to the school districts is to be deposited in the fund where it can be expended to meet the purpose for which it was donated and accepted. Money received from any other source whatsoever may be placed to the credit of the fund or funds designated by the school board. Mandatory Deposit and Expenditures of Certain Amounts in the Teachers’ Fund. Under SB 287, commencing with the 2006-07 fiscal year, the following state and local revenues must be deposited in the Teachers’ Fund each year: (1) 75% of basic formula state aid, excluding state aid distributed from the Classroom Trust Fund (gaming revenues); (2) 75% of one-half of the district’s local share of Proposition C revenues; (3) 100% of the career ladder state matching payments; and (4) 100% of local revenue from fines and escheats based on violations or abandoned property within the district’s boundaries. SB 287 provides that certificated staff compensation includes the costs of public school retirement and Medicare for those staff members. Commencing with the 2006-07 fiscal year, those costs will, therefore, be paid from the Teachers’ Fund, rather than the Incidental Fund. Commencing with the 2006-07 fiscal year, school districts are required to spend for certificated staff compensation and tuition expenditures each year the amounts described in clauses (1) and (2) of the preceding paragraph. Beginning in the 2007-08 fiscal year, school districts are further required to spend for certificated staff compensation and tuition expenditures each year, per the second preceding year’s weighted ADA, as much as was spent in the previous year from local and county tax revenues deposited in the Teachers’ Fund, plus the amount of any transfers from the Incidental Fund to the Teachers’ Fund that are calculated to be local and county tax sources. This amount is to be determined by dividing local and county tax sources in the Incidental Fund by total revenue in the Incidental Fund.
A-16

Failure to satisfy the deposit and expenditure requirements applicable to the Teachers’ Fund will result in a deduction of the amount of the expenditure shortfall from a district’s basic formula state aid for the following year, unless the district receives an exemption from the State Board of Education. A school board may transfer any portion of the unrestricted balance remaining in the Incidental Fund to the Teachers’ Fund. Under SB 287, beginning with the 2006-07 fiscal year, any district that uses a transfer from the Incidental Fund to pay for more than 25% of the annual certificated compensation obligation of the district and has an Incidental Fund balance on June 30 in any year in excess of 50% of the combined Incidental and Teachers’ Fund expenditures for the fiscal year just ended, will be required to transfer the excess from the Incidental Fund to the Teachers’ Fund. Limited Sources of Funds for Capital Expenditures. School districts may only pay for capital outlays through either (1) the issuance of general obligation bonds (which are paid from a Debt Service Fund levy) or (2) amounts on deposit in the Capital Projects Fund. Sources of revenues in the Capital Projects Fund are generally limited to the school district’s local property tax levy for the Capital Projects Fund, transfers from the Incidental Fund, which are limited, and donations or payments in lieu of taxes, which are properly allocated to such fund. Commencing on July 1, 2006, pursuant to SB 287, a school district may also deposit in its Capital Projects Fund that portion of its state aid that represents the disbursement of the Classroom Trust Fund moneys (gaming revenues).
Prior to setting tax rates for the Teachers’ and Incidental Funds, each school district must annually set the tax rate for the Capital Projects Fund as necessary to meet the expenditures of the Capital Projects Fund for capital outlays, after all allowable transfers to the Capital Projects Fund. The tax rate set for the Capital Projects Fund may not, however, be set in an amount that would result in the reduction of the equalized combined tax rates for the Teachers’ and Incidental Funds to an amount below $2.75. Permitted transfers from the Teachers’ and Incidental Funds to the Capital Projects are limited in amount and pursuant to SB 287, beginning July 1, 2006, if a school district is in compliance with the provisions described above under the section captioned “Mandatory Deposit and Expenditures of Certain Amounts in the Teachers’ Fund,” then it may transfer from its Incidental Fund to the Capital Projects Fund the sum of the following amounts:
1. The amount to be expended for transportation equipment that is considered an allowable cost under state board of education rules for transportation reimbursements during the current year; plus
2. Any amount necessary to satisfy obligations of the capital projects fund for state-approved
area vocational-technical schools; plus 3. Current year obligations for lease-purchase obligations entered into prior to January 1, 1997;
plus 4. The amount necessary to repay costs of one or more guaranteed energy savings performance
contracts to renovate buildings in the school district, provided that the contract is only for “energy conservation measures” as defined in Section 640.651 of the Revised Statutes of Missouri, as amended, and provided that the contract otherwise satisfies applicable state law; plus
5. An amount not to exceed the greater of $162,326 or 7% of the state adequacy target
multiplied by the district’s weighted ADA (sometimes referred to as the “GTB/Line 1 transfer”).
Under SB 287, beginning July 1, 2006, amounts that have been lawfully deposited in or transferred to the Capital Projects Fund are generally available to pay lease-purchase obligations, unless otherwise restricted to another specific purpose.
A-17

Summary of Revenues, Expenditures and Fund Balances The following Summary of Revenues, Disbursements and Changes in Fund Balances for each of the fiscal years ending June 30 was prepared from the District’s audited financial statements. The summary set forth below should be read in conjunction with the other financial statements and notes set forth in Appendix B of this Official Statement and the financial statements on file at the District’s office.
SUMMARY OF REVENUES, DISBURSEMENTS AND CHANGES IN FUND BALANCES
2007 2008 2009 2010 General (Incidental) Fund: Beginning Balance $26,074,839 $33,577,820 $41,308,201 $45,664,344Revenues 87,179,239 92,591,562 93,741,941 89,598,007 Expenditures (78,834,369) (83,280,600) (87,928,688) (88,352,859) Transfers To (From) (841,889) (1,580,581) (1,457,110) (771,487) Ending Balance $33,577,820 $41,308,201 $45,664,344 $45,664,343 Special Revenue (Teachers’) Fund: Beginning Balance $ 16,645,139 $16,973,413 $17,983,126 $10,732,278Revenues 107,421,576 115,155,719 118,595,342 120,600,862Expenditures (107,093,302) (114,146,007) (125,846,189) (131,207,555)Transfers To (From) 0 0 0 0 Ending Balance $ 16,973,413 $17,983,125 $10,732,279 $ 4,125,585 Debt Service Fund: Beginning Balance $19,845,649 $21,329,873 $22,187,513 $25,258,210 Revenues 24,683,408 30,224,711 28,041,364 26,236,957 Expenditures (23,199,184) (29,991,255) (28,968,877) (27,841,578) Transfers To (From) 0 624,184 3,998,210 26,445,761 Ending Balance $21,329,873 $22,187,513 $25,258,210 $50,099,350 Capital Projects (Building) Fund: Beginning Balance $45,726,656 $23,837,417 $79,924,874 $43,584,807 Revenues 4,117,464 7,825,100 9,375,176 6,426,319 Expenditures (28,848,592) (30,339,441) (47,172,353) (42,420,450) Transfers To (From) 2,841,889 78,601,798 1,457,110 771,487 Ending Balance $23,837,417 $79,924,874 $43,584,807 $42,267,163 Total Funds: Beginning Balance $108,292,283 $ 95,718,523 $161,403,714 $125,239,640 Revenues 223,401,687 223,401,687 249,753,823 246,862,145 Expenditures (237,975,447) (237,975,447) (289,916,107) (289,822,442) Transfers To (From) 2,000,000 2,000,000 3,998,210 60,350,761 Ending Balance $ 95,718,523 $161,403,713 $125,239,640 $142,630,102
Source: District’s Audited Financial Statements for the fiscal years ended June 30, 2007 - 2010 Property and Liability Insurance The District’s insurance needs are covered by the Missouri United School Insurance Council (“MUSIC”), a self-insured pool of over 450 separate Missouri school districts. MUSIC is a public entity risk pool currently operating as a common risk management and insurance program. The District has coverage for property, liability and worker’s compensation insurance through MUSIC.
A-18

Pension and Employee Retirement Plans
The District contributes to the state-wide retirement systems created by Chapter 169 of the Revised Statutes of Missouri to provide retirement allowances for substantially all of its employees. Teachers are covered by the Public School Retirement System of Missouri, and beginning with the fiscal year ended June 30, 2006 non-teachers are covered by the Public Education Employees Retirement System of Missouri (collectively, the “Systems”). The Systems include most of the school districts in Missouri, and are administered by a Board of Trustees. Both Systems are advance funded plans, which are required by statute to remain in actuarial balance.
The District’s annual contributions are based upon amounts recommended by a consulting actuary not to exceed rates established by statute. For the fiscal year ended June 30, 2009, pursuant to applicable State law, the maximum contributions that could be required of the District were 13% of teacher’s salaries and 6.25% of non-teacher’s salaries. The actual contribution rates for those years were, in fact, 13% and 6.25% of salaries, respectively, with the cost to the District for the fiscal year ended June 30, 2009, being approximately $14,093,059 and $1,909,012, respectively.
PROPERTY TAX INFORMATION
Property Valuations
All taxable real and personal property within the District is assessed annually by the County Assessor. Missouri law requires that personal property be assessed at 33-1/3% of true value and that real property be assessed at the following percentages of true value:
Residential real property ..................................................................... 19% Agricultural and horticultural real property ........................................ 12% Utility, industrial, commercial, railroad and all other real property ................................................................. 32%
In order to maintain equalized assessed valuations, Missouri law requires that each County Assessor,
on January 1 of every odd-numbered year, must adjust the assessed valuation of all real property located within the county in accordance with a two-year assessment and equalization maintenance plan approved by the State Tax Commission.
The County Assessor is responsible for preparing the tax roll each year and for submitting the tax roll to the Board of Equalization. The County Board of Equalization has the authority to adjust and equalize the values of individual properties appearing on the tax rolls.
Certain properties, such as those used for charitable, educational and religious purposes, are excluded from both the real estate ad valorem tax and the personal property tax.
A-19

Current Assessed Valuation. The following table shows the total assessed valuation and the estimated actual valuation by category, of all taxable tangible property (excluding amounts allocated for tax increment financing) situated in the District according to the assessment before the Board of Equalization in August 2010.
Category
St. Louis County
Jefferson County
Total Assessed Valuation
Assessment Rate
Estimated Actual
Valuation Real estate: Residential $2,190,156,880 $33,650,900 $2,223,807,780 19% $11,704,251,474 Commercial 706,720,150 707,400 707,427,550 32% 2,210,711,094 Agricultural 2,578,130 115,700 2,693,830 12% 22,448,583 Sub-Total $2,899,455,160 $34,474,000 $2,933,929,160 $13,937,411,151 Personal property(1) $ 465,131,270 $ 6,031,090 $ 471,162,360 33-1/3% $ 1,413,501,215 Less TIF (20,034,700) (20,034,700) Total
$3,344,551,730
$40,505,090
$3,385,056,820
$15,350,912,366
(1) Assumes all personal property is assessed at 33-1/3%; because certain subclasses of tangible personal property are
assessed at less than 33-1/3%, the estimated actual valuation for personal property would likely be greater than that shown above. See “Assessment Procedure” above.
Source: St. Louis County Department of Revenue and Jefferson County Clerk’s Office.
History of Property Valuations. The total assessed valuation of all taxable tangible property situated in the District, excluding amounts allocated for tax increment financing, according to the assessments as of January 1, in the calendar years shown, has been as follows:
Calendar Year
St. Louis County Assessed Valuation
Jefferson County Assessed Valuation
Total Assessed Valuation
% Change
2004 $2,521,167,640 $22,400,860 $2,543,568,500 N/A 2005 2,798,571,660 25,276,560 2,823,848,220 +11.02% 2006 2,866,219,330 26,716,670 2,892,936,000 +2.45 2007 3,402,109,800 29,371,135 3,431,480,935 +18.62 2008 3,655,739,190 32,756,082 3,688,495,272 +7.49 2009 3,463,104,070 35,465,593 3,498,569,663 -5.15 2010 3,344,551,730 40,505,090 3,385,056,820 -0.57
Source: St. Louis County Department of Revenue and Jefferson County Clerk’s Office. Tax Rates
Operating Levy. The operating levy (consisting of all the taxes levied, except those allocated to the debt service fund) cannot exceed the “tax rate ceiling” for the current year without voter approval. The tax rate ceiling, determined annually, is the rate of levy which, when charged against the newly-received assessed valuation of the District for the current year, excluding new construction and improvements, will produce an amount of tax revenues equal to tax revenues for the previous year increased by 5% or the Consumer Price Index, whichever is lower. Without the required percentage of voter approval, the tax rate ceiling cannot at any time exceed the greater of the tax rate in effect in 1984 or the most recent voter-approved tax rate (as adjusted pursuant to the provisions of the Hancock Amendment, more fully explained above under the caption “FINANCIAL INFORMATION CONCERNING THE DISTRICT – Tax Limitation Provisions”). The tax levy for debt service on the District’s general obligation bonds is exempt from the calculations of and limitations upon the tax rate ceiling. Under Article X, Section 11 (c) of the Missouri Constitution, any
A-20

increase in the District’s operating levy above $6.00 must be approved by two-thirds of the voters voting on the proposition.
The current tax rate ceiling for the District’s operating levy is $3.3283. Debt Service Levy. The District is required under Article VI, Section 26(f) of the Missouri Constitution to levy an annual tax on all taxable tangible property therein sufficient to pay the interest and principal of the indebtedness as they fall due and to retire the same within 20 years from the date of issue. The Board of Education may set the tax rate for debt service, without limitation as to the rate or amount, at the level required to make such payments. Section 137.073.6(2), RSMo, provides that the amount of the debt service levy will be prima facie valid if, after making the payment for which the tax is levied, general obligation bonds remain outstanding and the amount remaining in the Debt Service Fund does not exceed the following year’s payments.
Tax Rates – Allocation by Fund. The following table shows the District’s adjusted tax levies (per
$100 of assessed valuation) for each of the fiscal years shown:
Fiscal Year Ended
June 30
General (Incidental) Fund
Special Revenue (Teachers’) Fund
Capital Projects (Building) Fund
Debt
Service Fund
Total Levy
2005 $1.5075 $2.1859 $0.1900 $0.7500 $4.6334 2006 1.5713 2.1861 0.0000 0.7500 4.5074 2007 1.5045 2.0932 0.0700 0.7500 4.4177 2008 1.2874 1.7913 0.1700 0.7500 3.9987 2009 1.2768 1.7764 0.1900 0.6800 3.9232 2010 1.333 1.8550 0.1400 0.6800 4.0083
Source: Tax Rate Report published by the Missouri Department of Elementary and Secondary Education. Tax Collections Tax Collection Procedure. Property taxes are levied and collected for the District by St. Louis and Jefferson Counties, for which each County receives a collection fee of 1.5% of the gross tax collections. The Board of Education annually prepares an estimate of the amount of money to be raised by taxation for the ensuing school year and the tax rate required to produce such amount, and the rate necessary to sustain the school or schools of the District for the ensuing school year, to meet principal and interest payments on any bonded debt of the District and to provide the funds to meet other legitimate District purposes. Such estimates are based on the annual budget for the coming year and the assessed figures provided by each County Clerk. The Board of Education forwards the estimated tax rate to each County Clerk on or before July 15 and must certify a final tax rate by October 1. Each County Clerk receives the county tax books from the respective County Assessor, which set forth the assessments of real and personal property. Each County Clerk enters the tax rates certified to him or her by the local taxing bodies in the tax books and assesses such rates against all taxable property in the District as shown in the books. By October 31, each County Clerk forwards the tax books to the respective County Collector who is charged with levying and collecting taxes as shown therein. Each County Collector extends the taxes on the tax rolls and issues the tax statements in early December. Taxes are due by December 31 and become delinquent if not paid to the respective County Collector by that time. All tracts of land and lots on which delinquent taxes are due are charged with a penalty of 18% of each year’s delinquency. Each County Collector of Revenue is required to make disbursements of collected taxes to the District each month. Because of the tax collection procedure described above, the District receives the bulk of its moneys from local property taxes in the months of December, January and February.
A-21

Tax Collection Record. The following table sets forth tax collection information for the District for
the fiscal years shown:
Fiscal
Total Levy (per $100 of
Assessed Value)
Assessed Valuation
Total Taxes Levied
Current Taxes Collected
Current and Delinquent Taxes Collected
Year Amount % Amount %
2005-06 $4.5074 $2,823,848,220 $127,282,135 $123,001,842 96.6% $123,859,355 97.3% 2006-07 4.4177 2,892,936,000 127,801,234 124,303,208 97.3 125,884,805 98.5 2007-08 3.9987 3,431,480,935 137,214,628 132,989,301 97.4 137,196,335 100.00 2008-09 3.9230 3,687,732,422 144,669,743 139,699,137 96.6 142,248,515 98.3 2009-10 4.0083 3,515,636,323 140,917,251 136,123,241 96.6 137,515,532 97.6
Source: District’s Comprehensive Annual Financial Report, 2009.
District’s Rights in the Event of Tax Delinquencies. Taxes on real estate become delinquent on January 1 and the collector is required to enforce the state’s lien by offering the property for sale on the fourth Monday in August. If the offering does not produce a bid equal to the delinquent taxes plus interest, penalty, and costs, the property is offered for sale again the following year. If the second offering also does not produce a bid adequate to cover the amount due, the property is sold the following year to the highest bidder. Tax sales at the first or second offerings are subject to the owner’s redemption rights. Delinquent personal property taxes constitute a debt of the person assessed with the taxes, and a personal judgment can be rendered for such taxes against the debtor. Personal property taxes become delinquent on January 1. Collection suits may be commenced on or after February 1 and must be commenced within three years. Major Property Taxpayers
The following table sets forth major property taxpayers in the District for calendar year 2010:
Taxpayer
Assessed Valuation
% of District’s 2010 Total Assessed
Valuation
Chrysler Corporation* $55,948,170 3.94% THF Development LLC 28,898,570 1.16 Maritz, Inc. 25,403,590 0.66 Unigroup/Vanliner Insurance/United Van Line 11,886,480 0.36 Six Flags Theme Parks, Inc. 11,080,080 0.33 Monsanto Co. 9,251,610 0.31 Laclede Gas Company 9,049,270 0.26 Altus Corporate 44 Partners LLC 8,297,970 0.24 Missouri American Water Company 8,203,140 0.23 Baxter Crossings Apartments Assoc. 7,768,190 0.22 TOTAL $175,787,070 7.45%
Source: St. Louis County Department of Revenue. * In the fall of 2008, Chrysler announced that it would be idling the plant which manufactures vans and reducing production in the truck manufacturing plant. Chrysler represented approximately 1.6% of the District’s operating budget and approximately 4% of its assessed valuation at 6/30/09. The District estimates that the direct impact of the idling will be felt beginning in the fiscal year 2009-10. Chrysler has closed both manufacturing plants and will be seeing all equipment immediately. Chrysler’s assessed valuation is projected to be reduced by 90% to $14 million for 2009.
A-22

Tax Abatement and Tax Increment Financing Under Missouri law, tax abatement is available for redevelopers of areas determined by the governing body of a city to be “blighted”. The Land Clearance for Redevelopment Authority Law authorizes ten year tax abatement pursuant to Sections 99.700 to 99.715, Revised Statutes of Missouri, as amended. In lieu of ten year tax abatement, a redeveloper which is an urban redevelopment corporation formed pursuant to Chapter 353, Revised Statutes of Missouri, as amended, may seek real property tax abatement for a total period of 25 years. In addition, the Real Property Tax Increment Allocation Redevelopment Act, Sections 99.800 to 99.865, Revised Statutes of Missouri, as amended, makes available tax increment financing for redevelopment projects in certain areas determined by the governing body of a city to be a “blighted area”, “conservation area”, or “economic development area”, each as defined in such Act. Neither tax abatement nor tax increment financing would diminish the amount of property tax revenues currently collected by the District in the affected areas, but instead would act to freeze such revenues at current levels and would deprive the District of future increases in ad valorem property tax revenues which would otherwise have resulted from increases in assessed valuation in such areas until the tax increment financing obligations issued are repaid and the tax abatement period terminates.
In December 2007, the City of Chesterfield, Missouri announced that all tax increment financing obligations in connection with the Chesterfield Valley redevelopment area, fully located within the District, have been paid in full or funds have been set aside for their payment in full. Therefore, the District will receive a portion of any future increases in ad valorem property tax revenues which result from an increase in assessed valuation in the redevelopment area.
DEBT STRUCTURE OF THE DISTRICT
Debt Ratios and Related Information District Population, 2010 116,321 Assessed Valuation, 2010 $3,385,056,820 Estimated Actual Value, 2010 $15,350,912,366 Outstanding Direct General Obligation Debt $206,815,000 Overlapping General Obligation Debt $27,673,742 Total Direct and Overlapping General Obligation Debt $234,488,742 Per Capita Direct Debt $1,777.97 Per Capita Direct and Overlapping General Obligation Debt $2,015.88 Ratio of Direct Debt to Assessed Valuation 6.11% Ratio of Direct Debt to Estimated Actual Value 1.35% Ratio of Direct and Overlapping General Obligation Debt to Assessed Valuation 6.93% Ratio of Direct and Overlapping General Obligation Debt to Estimated Actual Value(1) 1.53%
A-23

General
Under Missouri law, refunding bonds and obligations payable from annual appropriations do not require voter approval. Any general obligation bonds, other than refunding bonds, require voter approval for issuance. Pursuant to the Missouri Constitution, the District is authorized to issue general obligation bonds payable from unlimited ad valorem taxes upon a two-thirds or, at elections held on general municipal election days or state primary or general election days, a four-sevenths majority vote of the qualified voters voting on the specific proposition. General Obligation Indebtedness
The purposes for which general obligation bonds may be issued by a school district are governed by Section 164.121 of the Revised Statutes of Missouri, and include purchasing, constructing, improving, extending, repairing, furnishing and equipping new and existing schoolhouse sites, buildings and related facilities for school purposes.
The following table shows the general obligation bonded indebtedness of the District that will be
outstanding after the issuance of the Bonds.
Date of Bonds
Original Amount
Final Maturity
Currently Outstanding
05/15/2003 $44,470,000 02/01/2013 $15,850,000 05/24/2006 44,400,000 02/01/2020 4,100,000* 06/24/2008 70,000,000 02/01/2022 66,450,000 02/24/2009 32,945,000 02/01/2015 32,945,000 01/28/2010 24,465,000 02/01/2020 24,465,000 06/29/2010 33,905,000 02/01/2024 33,905,000 09/14/2010 7,295,000 02/01/2027 7,295,000 09/29/2010 13,800,000 02/01/2018 11,900,000 07/27/2011 9,905,000 02/01/2016 9,905,000
Total $281,185,000 $206,815,000 *After issuance of Series 2011 Bonds
A-24

Overlapping General Obligation Indebtedness(1) (As of June 30, 2010) Taxing Body
General Obligation Debt
Percent Applicable
Amount Overlapping
St. Louis County $37,990,000 15.03% $5,709,897 City of Ballwin 2,820,000 65.39 1,843,998 City of Chesterfield 19,325,000 37.18 7,185,035 City of Wildwood 2,165,000 99.94 2,163,701 Eureka Fire Protection District 3,955,000 98.83 3,908,727 Metro West Fire Protection District 7,780,000 81.87 6,377,266 Monarch (Chesterfield) Fire Protection District 1,122,959 43.20 485,118 Total Overlapping Debt $75,157,959 $27,673,742 (1) Overlapping bonded indebtedness excludes neighborhood improvement district general obligation bonds, which are paid from special assessments. Source: District’s Audited Financial Statements for the fiscal year ended June 30, 2010. Legal Debt Capacity
Under Article VI, Section 26(b) of the Missouri Constitution, the District may incur indebtedness not to exceed 15% of the valuation of taxable tangible property in the District (excluding State assessed railroad and utilities). Based on the 2010 assessed valuation of $3,385,056,820 (which excludes State and locally assessed railroad and utilities), the District’s legal debt limit is $507,758,523. After the issuance of the Bonds, the District’s current total outstanding indebtedness will be $206,815,000, which will leave a legal debt margin of $300,943,523.
[Remainder of Page Intentionally Left Blank.]
A-25

Debt Service Requirements for General Obligation Bonds Outstanding
The following schedule shows the yearly principal and interest requirements for all outstanding general obligation bonds of the District:
The Bonds Fiscal Year
Ended June 30
Prior Principal and Interest
Requirements
Principal
Interest(1)
Total
Total
Outstanding
2012 $26,824,247.44 $ 26,824,247.442013 23,444,497.44 23,444,497.442014 25,291,747.44 25,291,747.442015 19,699,597.44 $3,020,000.00 $365,800.00 $ 3,385,800.00 23,085,397.442016 14,308,847.44 6,885,000.00 275,400.00 7,160,400.00 21,469,247.442017 18,422,722.44 18,422,722.442018 17,641,522.44 17,641,522.442019 17,340,972.44 17,340,972.442020 20,332,817.44 20,332,817.442021 18,854,394.20 18,854,394.202022 19,484,601.56 19,484,601.562023 7,889,475.32 7,889,475.322024 9,087,163.12 9,087,163.122025 0.00 0.002026 0.00 0.002027 7,295,000.00 $ 7,295,000.00
Total $245,917,606.16 $ 9,905,000.00 $641,200.00 $10,546,200.00 $256,463,806.16
(1) Interest on the Bonds will be paid from the Escrow Fund to and including the Crossover Date. Operating Leases In 2002, the District formed the Rockwood School District Educational Facilities Authority (the “Authority”) to acquire, construct, improve, extend, repair, remodel, renovate, furnish and equip buildings and facilities of the District. The Authority issued Leasehold Revenue Bonds, Series 2002 in the principal amount of $8,210,000. As of June 30, 2010, the outstanding principal amount of Series 2002 Bonds was $660,000.
In 2004, the District received a loan from First National Bank of St. Louis for an energy savings lighting project in the amount of $268,000. This loan will be repaid in ten years with savings generated by the energy-efficient projects. The principal balance as of June 30, 2010, was $114,000. In 2006, the District entered into a lease purchase agreement with Regions Bank. Proceeds are being used for an energy conservation lighting project which encompasses most school campuses. As of June 30, 2010, the outstanding principal balance on this loan was $1,473,131. In 2008, the District entered into a $600,000 lease purchase agreement with Bank of America. Proceeds are being used for an energy conservation lighting project to be completed in 2009. The principal balance as of June 30, 2010 was $491,717.
A-26

A-27
No Prior Defaults
The District has never in its history defaulted on the payment of any of its debt obligations.
Future Plans The District has continuing capital projects needs and will likely have sizeable bond issues in 2012 and 2014.
* * *

(THIS PAGE LEFT BLANK INTENTIONALLY)

APPENDIX B
INDEPENDENT AUDITORS’ REPORT AND AUDITED FINANCIAL STATEMENTS OF THE DISTRICT FOR THE FISCAL YEAR ENDED JUNE 30, 2010

(THIS PAGE LEFT BLANK INTENTIONALLY)

www.rockwood.k12.mo.us
For fiscal year ended June 30, 2010
2010
Sa in t Lou i s Count y, M i s sou r i
Comprehensive Annual
Financial Report
Rockwood R-VI School District

ROCKWOOD R-VI SCHOOL DISTRICT Saint Louis County, Missouri
Comprehensive Annual Financial Report For the year ended June 30, 2010
Submitted by:
K. Scott Tate, CPA, Director of Finance Ms. Shirley Broz, CPA, Chief Financial and Legislative Officer
http://www.rockwood.k12.mo.us

IntroductorySection

ROCKWOOD R-VI SCHOOL DISTRICT
TABLE OF CONTENTS Page
I. INTRODUCTORY SECTION - UNAUDITED
Transmittal Letter i – vii Board of Education viii Superintendent’s Cabinet ix Organizational Chart Superintendent’s Cabinet x District Locations xi ASBO Certificate of Excellence in Financial Reporting xii GFOA Certificate of Achievement for Excellence in Financial Reporting xiii
II. FINANCIAL SECTION
Independent Auditors' Report 1 - 2
Management’s Discussion and Analysis - Unaudited 3 - 14
Basic Financial Statements: Government-Wide Financial Statements:
Statements of Net Assets 15 Statements of Activities 16 - 17
Fund Financial Statements:
Balance Sheets – Governmental Funds 18
Reconciliation of the Balance Sheet of Governmental Funds to the Statement of Net Assets 19
Statements of Revenues, Expenditures and Changes in Fund Balances - Governmental Funds 20
Reconciliation of the Statement of Revenues, Expenditures and Changes in Fund Balances of Governmental Funds with the Statement of Activities 21
Statements of Net Assets – Proprietary Fund 22 Statements of Revenues, Expenses and Changes in Net Assets – Proprietary Fund 23

ROCKWOOD R-VI SCHOOL DISTRICT
TABLE OF CONTENTS (CONTINUED)
Page II. FINANCIAL SECTION (concluded)
Statements of Cash Flows – Proprietary Fund 24
Notes to the Basic Financial Statements 25 – 55
III. REQUIRED SUPPLEMENTAL INFORMATION - UNAUDITED Schedule of Revenues, Expenditures and Changes in Fund Balance – Budget and Actual
General Fund 56 Teachers Fund 57
Notes to Required Supplemental Information 58
Schedule of Funding Progress 59
IV. SUPPLEMENTAL INFORMATION Schedule of Revenues, Expenditures and Changes in Fund Balance – Budget and Actual
Debt Service Fund 60 Capital Projects Fund 61 All Funds 62
V. STATISTICAL SECTION - UNAUDITED
Summary of Statistical Information 63
Net Assets by Component 64
Expenses, Program Revenues and Net (Expense)/Revenue 65
General Revenues and Total Change in Net Assets 66
Fund Balances – Governmental Funds 67
Governmental Funds Revenues 68
Governmental Funds Expenditures and Debt Service Ratio 69
Other Financing Sources and Net Change in Fund Balances –
Governmental Funds 70

ROCKWOOD R-VI SCHOOL DISTRICT
TABLE OF CONTENTS (CONTINUED)
Page V. STATISTICAL SECTION - UNAUDITED (concluded)
Assessed Value and Actual Value of Taxable Property 71
Direct and Overlapping Property Taxes 72
Principal Property Taxpayers 73 Assessed Value and Estimated Actual Value of Taxable Property 74 Property Tax Levies and Collections – St. Louis County 75 Outstanding Debt by Type 76 Direct and Overlapping Governmental Debt 77 Legal Debt Margin Information 78 Pledged-Revenue Coverage 79 Demographic and Economic Statistics – St. Louis County Only 80 Principal Employers 81 Employee Counts 82 Operating Statistics 83 Teacher Base Salaries 84 School Building Information 85 - 87
VI. STATE COMPLIANCE SECTION
Independent Accountants’ Report on Management’s Assertions About
Compliance with Specified Requirements of Missouri State Laws and Regulations 88
Schedule of Selected Statistics - Unaudited 89 - 93

ROCKWOOD R-VI SCHOOL DISTRICT
TABLE OF CONTENTS (CONCLUDED)
Page
VII. FEDERAL COMPLIANCE SECTION
Independent Auditors’ Report on Internal Control Over Financial
Reporting and On Compliance and Other Matters Based on an Audit of Financial Statements Performed in Accordance with Government Auditing Standards 94 - 95
Independent Auditors’ Report on Compliance with Requirements
That Could Have a Direct And Material Effect on Each Major Program and on Internal Control over Compliance in Accordance with OMB Circular A-133 96 - 97
Schedule of Expenditures of Federal Awards 98 Notes to the Schedule of Expenditures of Federal Awards 99 Schedule of Findings and Questioned Costs 100 - 101

November 3, 2010 Members, Board of Education and Citizens Rockwood School District St. Louis County, Missouri The Comprehensive Annual Financial Report (CAFR) of the Rockwood R-VI School District (the District), St. Louis County, Missouri, for the fiscal year ended June 30, 2010, is presented on the following pages. The District is governed by an elected seven member Board of Education (the Board). The Board is the basic level of government, which has financial accountability and control over all activities related to K-12 public school education within the District. The Board is not included in any other governmental reporting entity, as defined by Governmental Accounting Standards Board (GASB) pronouncements, since Board members are elected by the public and have decision making authority and primary accountability for fiscal matters. Responsibility for the accuracy of the data presented and the completeness and fairness of the presentation, including all disclosures, rests with the District. We believe that data, as presented, is accurate in all material aspects; that it is presented in a manner designed to fairly set forth the financial position and results of operations of the District as shown by the disclosure of all financial activity of its various funds; and that all disclosures necessary to enable the reader of the statements to gain a full understanding of the District’s financial status have been incorporated in the Report. The report has been prepared by the District’s Finance Department following the requirements and guidelines contained in the GASB Codification of Governmental Accounting and Financial Reporting Standards. The District’s activities and funds are all presented in this report and have been audited by the District’s Certified Public Accountants, Kerber, Eck & Braeckel LLP, who rendered an unqualified opinion for the District again this year. Generally Accepted Accounting Principles (GAAP) requires that management provide a narrative introduction, overview and analysis to accompany the basic financial statements in the form of Managements’ Discussion and Analysis (MD&A). This letter of transmittal is designed to complement the MD&A and should be read in conjunction with it. The District’s MD&A follows the independent accountant’s report.
Administrative Center K. Scott Tate, CPA 111 East North Street Director of Finance Eureka, MO 63025-1229 (636) 938-2258
(636) 938-2265 Fax
Growing Together, Learning for Life
i

The District History The District began with the opening of Eureka High School in 1908. It was the first four-year high school in St. Louis County west of Kirkwood. The District, in its present form, was created on October 29, 1949 by a merger of 26 districts. The name was changed from Reorganized School District No. R-VI of St. Louis County, Missouri to Rockwood R-VI School District, St. Louis County, Missouri in April 1964. The District includes 150-square miles located in southwest St. Louis County and a small section of northern Jefferson County. Geographically, the District represents approximately 30% of St. Louis County. It encompasses all or parts of twenty communities including Ballwin, Chesterfield, Ellisville, Eureka, Fenton, Manchester and Wildwood. According to the 2000 Census, this represents approximately 108,000 residents in 37,000 homes. General The District continues to be a leader in the field of public education. The U. S. Department of Education’s “Blue Ribbon List” includes ten District schools and Missouri’s “Gold Star” list includes fourteen District schools. Rockwood schools are more frequently included in Missouri’s listing of “Top 10” academic test scores than any other district. In addition, the District has again received the highest recognition provided by Missouri for academic achievement – “Distinction in Performance”. Rockwood provides information for interested parties, including the current state required “Report Card”, on the Internet at www.rockwood.k12.mo.us. Rockwood has been one of Missouri’s and St. Louis County’s fastest growing school districts. There were 22,402 students enrolled as of January 2010 including our Special School District students. This represents nearly 7,700 or a 50% increase in students served since the 1989-90 term. The District serves this student body in twenty elementary facilities (including two Centers for Creative Learning), six middle schools (grades 6-8) and four high schools. The current pattern of growth is to be slow to no growth, year upon year, for the 2011 term and beyond. The District’s entire staff of administrators, teachers, nurses, office personnel, custodians and maintenance and cafeteria workers are dedicated to the same mission: We do whatever it takes to ensure all students realize their potential. Approximately 70% of the District’s teachers hold advanced degrees. The District encourages its staff to further their education by offering college class tuition reimbursement. The current budget includes $329,389 for teacher assistance and $5,908 to assist support staff including the newly added assistance for nursing staff. The District is governed by the Board of Education, whose membership is elected for staggered three-year terms of office. The Board is a policy-making body whose primary function is to establish policies for the District, provide for the general operation and personnel of the District and to safeguard the assets of the District. The District’s programs cover the spectrum from birth to senior citizens. A Parents as Teachers program offers services to prospective and new parents in skills related to child development and better parenting. Special programs exist at all levels for students with special needs ranging from talented and gifted to modified programs and special instruction. Rockwood, like the other districts of St. Louis County, has intervention for its students with special needs from the Special School District of St. Louis County (SSD). The majority of the special needs children are served on the District’s campuses while certain limited cases are served on the SSD campus.
ii

The District responds to the needs of students who are culturally different, at risk of educational failure, bilingual or have special needs by providing a broad spectrum of programs, services and resources. The District has received national recognition for both the successful Talented and Gifted program and the exemplary Community Education program. Also recognized is the Partners in Education program with local corporate sponsors. The District’s high schools offer numerous Advanced Placement and College Credit courses to prepare the graduating student to enter either college or the working world. The Individualized Learning Center (ILC) educates students who are in danger of dropping out of school because of difficulty faced in a regular school setting. Finally, a highly successful reading initiative for grades K-5 and 6-10, in its ninth year, ensures that all students read at grade level. These initiatives and investments in enrichment of the full curriculum with emphasis on acceleration and differentiation result in the District’s students experiencing a high level of achievement. Students continue to score above state and national norms on achievement tests, placing the District in the top 5% of U.S. school districts. The percentage of District students going on to post-secondary education is 85% (2007-2008). To ensure that District students receive the individualized educational experiences necessary, the average building level pupil-teacher ratios are: Elementary Schools: 21 to 1; Middle Schools: 22 to 1; and High Schools: 22 to 1. In order to assure the continued excellence of the programs offered, the Board has appointed a citizen’s committee to assess and evaluate the curriculum on a continuing basis. Rockwood contracts with First Student Transportation to provide transportation for resident students to and from school and on school district sponsored activity trips. Approximately 12,000 resident students are transported on a daily basis. In 2002, the District formed the Rockwood School District Educational Facilities Authority to acquire, construct, improve, extend, repair, remodel, renovate, furnish and equip buildings and facilities for the District. The Facility issued Leasehold Revenue Bonds Series 2002 in order to pay off the existing G. E. Capital energy note and to finance the construction of an Early Childhood Center. The equipment financed and the Early Childhood Center is being leased to the District for the amount of principal and interest due on the leasehold revenue bonds. The District participates in a Voluntary Transfer Student (VTS) program in which St. Louis City resident African-American students volunteer to transfer to the District’s schools. As of January 2009, this K-12 program represents 1,744 of 22,402 students or about 7.9% of the population. Accounting System and Budgetary Control The District’s accounting system for governmental funds reflects the modified accrual basis of accounting. At the end of the year, the governmental funds are converted from the modified accrual basis to the accrual basis for presentation in district-wide financial statements. In developing the accounting system, consideration has been given to the adequacy of internal accounting controls. We believe the District’s internal accounting controls adequately safeguard assets and provide reasonable assurance of proper recording of transactions. As management, we assert that, to the best of our knowledge and belief, the financial report is complete and reliable in all material respects. The District’s accounting system is organized on the basis of funds, each of which is considered its own entity. The District follows Missouri State Statutes in establishing budgetary data (Chapter 67, RSMo) for each major fund of the political subdivision. The District considers all four funds (General, Special Revenue-Teachers’, Debt Service and Capital Projects) as major. Changes in the overall revenue and expenditure of a fund’s budget require full disclosure and Board resolution for approval. Budgetary variances at the function and object level are reported to the Board at the monthly business meeting. The District is not a component unit of another report entity, but has a component unit, the Rockwood School District Facility Authority.
iii

The budget process is a yearly cycle: In September, Missouri Statute requires an official count of enrolled students on the last Wednesday of the month (this begins the process of the budget). From that data and other significant information, the projections of future enrollment are calculated for the budget year and four years beyond. This enrollment projection becomes the basis for hiring personnel and establishing the school-level allocation budgets. By December, the school, department and district revenue and expenditure budgets must be finalized. During January and February, administrators compile district needs based on all budget requests received including personnel and capital. During March and April, revenue budgets are finalized and salary negotiations with bargaining units are completed. In April and May, work sessions are held with the Board in public hearings. In June, the Board is presented the final budget document, in a public meeting, for vote and final approval of the budget for the following year beginning July 1. The governing body of each political subdivision may revise, alter, increase or decrease the items contained in the proposed budget, subject to such limitations as may be provided by law or charter; provided, that in no event shall the total authorized expenditures from any fund exceed the estimated revenues to be received plus any unencumbered balance or less any deficit estimated for the beginning of the budget year. After any political subdivision has approved the budget for any year and has approved or adopted the orders, motions, resolutions, or ordinances required to authorize the expenditures proposed in the budget, the political subdivision shall not increase the total amount authorized for expenditure from any fund, unless the governing body adopts a resolution setting forth the facts and reasons making the increase necessary and approves or adopts an order, motion, resolution or ordinance to authorize the expenditures. Throughout the year, budgets are reviewed daily in connection with purchase order and payroll processing. Revenue budgets are reviewed monthly. Budget adjustments can, and will, be made on a regular basis as additional information becomes available, especially in regard to title programs, grant approvals and changes in assessed valuations and required changes in related expenditures. Management may make budget adjustments between objects within a fund without pre-approval from the Board. Any additions to or redirections from the approved budget at the fund level must be pre-approved. Also, any movement between funds must have Board approval. The Board of Education has final approval for the original budget and for budget adjustments made throughout the year. Economic Condition St. Louis County is the largest county in the State of Missouri and the major contributor to the economy of the state and the twelve-county metropolitan area with one million residents. According to the United States Department of Labor, St. Louis County’s 2009 annual labor force averaged 516,614, down 1% from 2008. The service sector continues to show the largest job growth in the County. The areas of medical, bio-technical, business and technology services are expected to provide long term employment growth in the County as manufacturing jobs continue to decline. The District is located in Southwest St. Louis County and residents have full access to the large and diverse employment base in the AAA rated St. Louis County. St. Louis County’s 2009 unemployment rate of 9.9% is somewhat worse than the State (9.3%) and the U.S. as a whole (9.3%). The District is primarily a bedroom community with a limited amount of commercial base and a comparatively low assessed valuation per pupil for St. Louis County. Of that small commercial presence, Chrysler is the largest taxpayer and currently represents 4.5% of the District’s total tax base (assessed valuation) of $3.5 billion.
iv

Current Initiatives The Rockwood Board strongly supports the process of long-range planning in making important decisions about the future of the District’s schools and the District as a whole. The State of Missouri requires all school districts to conduct an in-depth public engagement program to set goals for the next five years. This requirement of the Missouri Department of Elementary and Secondary Education is governed by the Department’s Missouri School Improvement Program (MSIP) document. MSIP specifies that each Missouri school district have a Comprehensive School Improvement Plan (CSIP) as one of the major components of the MSIP. The main thrust of the CSIP was to engage a cross section of the District’s public to assist in assessing the District’s current structure and planning for the future by determining a ubiquitous set of goals to be used across the District for the next five years. Rockwood is an exemplary school district in part because of the strength and complexity of its planning efforts. The results of this long-range planning effort have resulted in the following six key goals that will guide the District over the next five years:
Develop and enhance quality educational/instructional programs to improve performance and enable students to meet their personal, academic and career goals.
Provide curriculum and instructional approaches that prepare students for an increasingly diverse
and global society.
Recruit, attract, develop and retain highly qualified staff to carry out the District’s mission, goals and objectives.
Promote, facilitate and enhance parent, student and community involvement in the District’s
education programs.
Provide and maintain appropriate instructional resources, support services and functional and safe facilities.
Govern the District in an efficient and effective manner, providing leadership and representation to
benefit the students, staff and patrons of the district. In conjunction with the CSIP, the Board of Education and Superintendent have created Standing Committee to continue the implementation, review and adjustment process of the CSIP. In this structure, Board members will serve as liaisons to specific committees and will report progress or issues to the full Board of Education on an on-going basis. The Standing Committees include:
Calendar Communications Coordinated School Health Council Curriculum Advisory Council Drug Free Coalition Finance Highly Qualified Staff Parent and Family Involvement/School Climate Policy, Regulations, Procedures and Consequences Professional Development Recognitions and Awards Program Standards Based Grading and Reporting
v

Strategic Planning and Measurement Technology Testing and Assessment
Finance Rockwood remains in good financial condition with positive changes in assessed valuation which drive local tax generated revenue (62.8% of operating revenue), positive changes to the state funding formula dollars (11.0% of operating revenue) and steady revenue from the voluntary transfer students (6.4% of operating revenue). While revenue growth is modest, expenses increase, especially in the area of salaries and benefits (medical insurance), which constitute approximately 86.0% of the total operating expenditures. During 2009-10 and in planning for FY2011, the District did considerable work to review all revenue sources and expenditure requirements to identify areas of saving for the 2011 school year. Major effort has been exercised across the District to hold the line on expenditures in all areas. Because of these efforts, and positive changes in revenue, the District ended the FY2010 year with a decrease of $7.0 million in operating fund balances. The District enjoys a bond rating among the highest in the nation – AAA. Significant Board Policies The District has entered into agreements with the Rockwood National Education Association, the Rockwood Custodial Education Association, and the Rockwood Association of Nurses. Each of these agreements dictate the work environment and compensation for the member’s of each organization. The 2009-10 salary expenses were governed by these agreements. The Rockwood National Education Association agreement is a two year agreement that will encompass 2008-09 and 2009-10. The Rockwood Custodial Education Association agreement is a three year agreement covering the 2008-09, 2009-10 and 2010-11 fiscal years. During February 2009, the Rockwood Association of Nurses agreement was renewed for an additional two years to cover the school years 2009-10 and 2010-11. The Board has an approved policy of maintaining operating fund balances at 18% of the subsequent year’s expenditure with an additional 4% of expenditures for a stabilization plan. The District had 20.9% as of June 30, 2010, slightly below the target set by the Board of Education. Independent Audit The Revised Statutes of the State of Missouri and the Board policies of the District require an audit of the books of accounts, financial records and transactions of all funds of the District. The audit is performed by independent certified public accountants who are selected by the District’s Board of Education. This requirement has been complied with and the auditor’s unqualified opinion is included in this report. Financial Reporting Awards The Government Finance Officers Association of the United States and Canada (GFOA) awarded a Certificate of Achievement for Excellence in Financial Reporting to Rockwood School District for its comprehensive annual financial report for the fiscal year ended June 30, 2009. This was the fifth year that the government has achieved this prestigious award. In order to be awarded a Certificate of Achievement, a government must publish an easily readable and efficiently organized comprehensive annual financial report. This report must satisfy both generally accepted accounting principles and applicable legal requirements.
vi

A Certificate of Achievement is valid for a period of one year only. We believe that our current comprehensive annual financial report continues to meet the Certificate of Achievement Program’s requirements and we are submitting it to the GFOA to determine its eligibility for another certificate. The District has been awarded the Association of School Business Officials International (ASBOi) Certificate of Excellence in Financial Reporting (CAFR) for the years ended June 30, 2004 – 2009. The District will also submit this 2010 financial report for that coveted award. The District also participates in ASBO International’s Meritorious Budget Award (MBA) Program. For the past ten years, the District has applied for and received the prestigious award for excellence in budgeting. Closing Statement It is the District’s intention that this Comprehensive Annual Financial Report will provide the District’s management, parents and other interested patrons, outside investors and the local business community with the most meaningful financial presentation possible. In this report we intend to provide all readers a clear and concise picture of the District’s financial condition as of June 30, 2010. We want to express our appreciation to all staff members who assisted and contributed to the preparation of this report especially the members of the Finance Department. We would like to thank the Board of Education for their wisdom and continued support in planning and conducting the financial operations of the District in a responsible and progressive manner. Respectfully submitted,
Dr. Bruce Borchers Superintendent
Mrs. Shirley A. Broz, CPA Chief Financial and Legislative Officer
Mr. K. Scott Tate, CPA Director of Finance
vii

Ms. Peggy DevoyVice President
Rockwood R-VI School DistrictBoard of Education 2010-2011
Ms. Kim McGuinessDirector
Mr. Stephen BantonPresident
Mr. Matthew FitspatrickDirector
Ms. Darla BakerDirector
Mr. Steve SmithDirector
Ms. Janet StrateDirector
viii

Mr. Michael Barla . . . . . . . . . . . . . . . . . . . . . . . . . . . . . . . . . . . . . . . . . . . . . . . . . . . . . . . . . . . .Director of Early Childhood EducationMr. Will Blaylock . . . . . . . . . . . . . . . . . . . . . . . . . . . . . . . . . . . . . . . . . . . . . . . . . . . . . . . . . . . . . . .Director of Instructional TechnologyMr. David Blickenstaff . . . . . . . . . . . . . . . . . . . . . . . . . . . . . . . . . . . . . . . . . . . . . . . . . . . . . . . . .Director, Facilities Services, WarehouseMs. Carmen Fischer . . . . . . . . . . . . . . . . . . . . . . . . . . . . . . . . . . . . . . . . . . . . . . . . . . . . . . . . . . . . . .Director, Child Nutrition ServicesMr. Erik Graham . . . . . . . . . . . . . . . . . . . . . . . . . . . . . . . . . . . . . . . . . . . . . . . . . . .Director of Data Analysis and Quality ManagementMs. Roxanna Mechem . . . . . . . . . . . . . . . . . . . . . . . . . . . . . . . . . . .Director of K-12 Social Studies, Character Education and AssessmentMs. Katherine Reboulet . . . . . . . . . . . . . . . . . . . . . . . . . . . . . . . . . . . . . . . . . . . . . . . . . . . . . . . . . . . . . . . . .Director, Human ResourcesMr. Michael Seppi . . . . . . . . . . . . . . . . . . . . . . . . . . . . . . . . . . . . . . . . . . . . . . . . . . . . . . . . . . . . . . .Director of Community EducationDr. Shari Sevier . . . . . . . . . . . . . . . . . . . . . . . . . . . . . . . . . . . . . . . . . . . . . . . . . . . . . . . . . . . . . . .Director of Guidance and CounselingMr. Bill Sloan . . . . . . . . . . . . . . . . . . . . . . . . . . . . . . . . . . . . . . . . . . . . . . . . . . . . . . . . . . . . .Director of Purchasing and TransportationDr. Linda Smith . . . . . . . . . . . . . . . . . . . . . . . . . . . . . . . . . . . . . . . . . . . . . . . . . . . . . . . . . . . . . . . . . . . . . . .Director, Gifted EducationMr. Scott Tate . . . . . . . . . . . . . . . . . . . . . . . . . . . . . . . . . . . . . . . . . . . . . . . . . . . . . . . . . . . . . . . . . . . . . . . . . . . . . .Director of Finance
Dr. Bruce BorchersSuperintendent of Schools
SSuuppeerriinntteennddeenntt’’ss CCaabbiinneett
DDiissttrriicctt DDiirreeccttoorrss
Dr. Kelvin McMillinAsst. Superintendent, Human Resources
Mr. Steven BeattyChief Information
Officer
Ms. Shirley BrozChief Financial
and Legislative Officer
Dr. Carrie LuttrellExecutive Director
Curriculum, Instruction and Assessment
Mr. Dennis GriffithAsst. Superintendent,Administrative Services
Ms. Kim Cranston, APRChief Communications
Officer
ix

RO
CK
WO
OD
SC
HO
OL
DIS
TR
ICT
O
RG
AN
IZA
TIO
NA
L C
HA
RT
SU
PER
INT
EN
DE
NT
’S C
AB
INE
T
2010
-11
Step
hen
Ban
ton
Pres
iden
t B
oard
of E
duca
tion
Peg
gy D
evoy
V
ice
Pres
iden
tB
oard
of E
duca
tion
Stev
e Sm
ithD
irect
orB
oard
of E
duca
tion
Jane
t Str
ate
Dire
ctor
Boa
rd o
f Edu
catio
n
Mat
thew
Fitz
patr
ick
Dire
ctor
Boa
rd o
f Edu
catio
n
Kim
McG
uine
ssD
irect
orB
oard
of E
duca
tion
Dar
la B
aker
Dire
ctor
Boa
rd o
f Edu
catio
n
E/S
& M
/S P
rinci
pals
and
Staf
fing
Ass
essm
ent
Cur
ricul
um, P
re-K
-12
Car
rie L
uttre
ll Ex
ec. D
ir. C
ur In
str.
& A
sses
smen
t
Stud
ent D
isci
plin
e
Tran
spor
tatio
n
Faci
litie
san
d M
aint
enan
ce
Den
nis G
riffit
hA
sst.
Supt
.A
dmin
. Ser
vice
s
Tech
Sup
port
Dat
a Pr
oces
sing
Inst
ruct
. Tec
hnol
ogy
Stev
e B
eatty
Chi
e fIn
form
atio
nO
ffic
er
Food
Ser
vice
& C
omm
. Ed
Purc
hasi
ng D
epar
tmen
t
Fina
nce
Dep
artm
ent
Shirl
ey B
roz
Chi
ef F
inan
cial
Off
icer
Ben
efits
VIC
C
Cer
tifie
d an
d Su
ppor
tSt
aff H
iring
Kel
vin
McM
illin
Ass
t. Su
pt.
Hum
an R
esou
rces
Prin
t Com
mun
icat
ions
Com
mun
ity R
elat
ions
Med
ia R
elat
ions
Kim
Cra
nsto
nC
hie f
C
omm
unic
atio
nsO
ffic
er
Dr.
Bru
ce B
orch
ers
Supe
rinte
nden
t
x
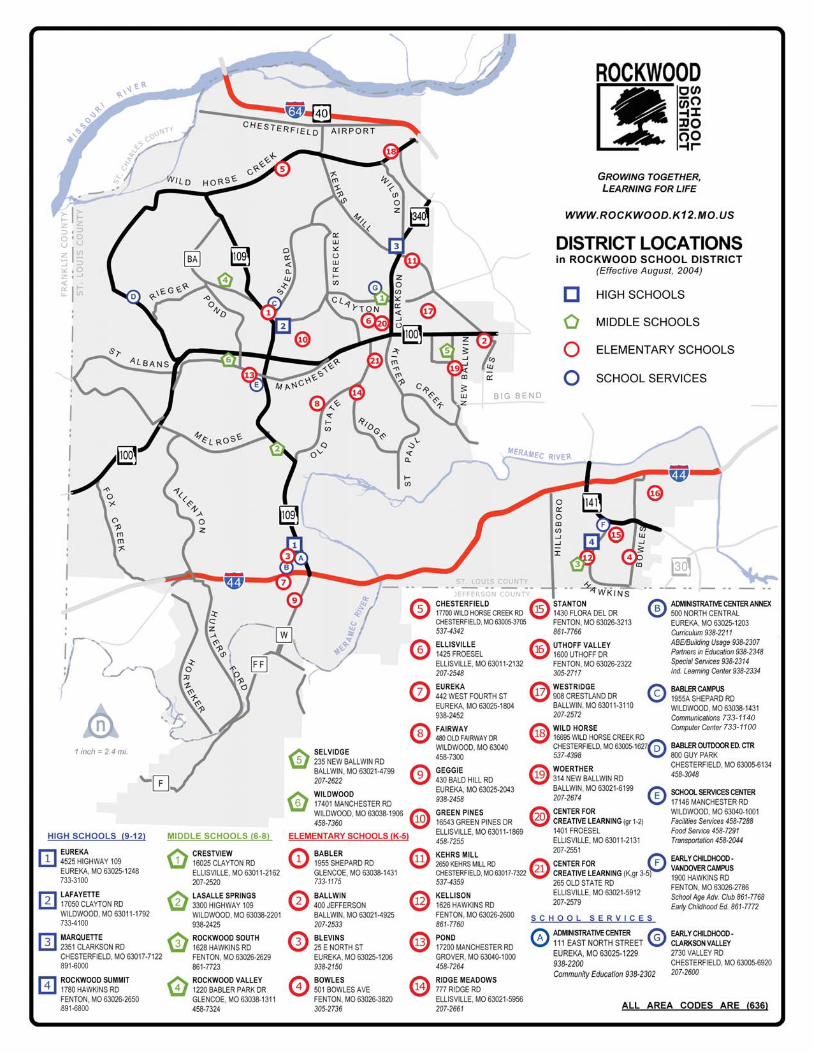
733-4100
733-3100
891-6000
891-6800
733-1175
733-1140733-1100


Certificate of
Presented to
Rockwood R-VI School
For its Comprehensive Annual
June 30, 2009
President
Executive Director
Financial Reportfor the Fiscal Year Ended
Reportingin Financial
for ExcellenceAchievement
Text38: District, Missouri
A Certificate of Achievement for Excellence in FinancialReporting is presented by the Government Finance Officers
Association of the United States and Canada togovernment units and public employee retirement
systems whose comprehensive annual financialreports (CAFRs) achieve the higheststandards in government accounting
and financial reporting.
xiii
FinancialSection


Other Locations
Belleville, IL • Carbondale, IL • Springfield, IL • Jacksonville, IL • Cape Girardeau, MO • Milwaukee, WI
CPAs and Management Consultants
One South Memorial Drive, Ste. 950 St. Louis, MO 63102-2439 ph 314.231.6232 fax 314.231.0079 www.kebcpa.com
Independent Auditors' Report Board of Education Rockwood R-VI School District We have audited the accompanying financial statements of the governmental activities and each major fund of Rockwood R-VI School District as of and for the year ended June 30, 2010, which collectively comprise the District’s basic financial statements as listed in the table of contents. These financial statements are the responsibility of the District's management. Our responsibility is to express opinions on these financial statements based on our audit. We conducted our audit in accordance with auditing standards generally accepted in the United States of America and the standards applicable to financial audits contained in Government Auditing Standards, issued by the Comptroller General of the United States. Those standards require that we plan and perform the audit to obtain reasonable assurance about whether the financial statements are free of material misstatement. An audit includes examining, on a test basis, evidence supporting the amounts and disclosures in the financial statements. An audit also includes assessing the accounting principles used and significant estimates made by management, as well as evaluating the overall financial statement presentation. We believe that our audit provides a reasonable basis for our opinions. In our opinion, the financial statements referred to above present fairly, in all material respects, the respective financial position of the governmental activities and each major fund of Rockwood R-VI School District as of June 30, 2010, and the respective changes in financial position and cash flows, where applicable, thereof for the year then ended in conformity with accounting principles generally accepted in the United States of America. In accordance with Government Auditing Standards, we have also issued our report dated November 3, 2010 on our consideration of Rockwood R-VI School District’s internal control over financial reporting and on our tests of its compliance with certain provisions of laws, regulations, contracts and grant agreements and other matters. The purpose of that report is to describe the scope of our testing of internal control over financial reporting and compliance and the results of that testing, and not to provide an opinion on the internal control over financial reporting or on compliance. That report is an integral part of an audit performed in accordance with Government Auditing Standards and should be read in conjunction with this report in considering the results of our audit.
1
Accounting principles generally accepted in the United States of America require that the management’s discussion and analysis on pages 3 through 14 and the budgetary comparison information on pages 56 and 57 and the Schedule of Funding Progress on page 59 be presented to supplement the basic financial statements. Such information, although not a part of the basic financial statements, is required by the Governmental Accounting Standards Board, who considers it to be an essential part of financial reporting for placing the basic financial statements in an appropriate operational, economic, or historical context. We have applied certain limited procedures to the required supplementary information in accordance with auditing standards generally accepted in the United States of America, which consisted of inquiries of management about the methods of preparing the information and comparing the information for consistency with management’s responses to our inquiries, the basic financial statements, and other knowledge we obtained during our audit of the basic financial statements. We do not express an opinion or provide any assurance on the information because the limited procedures do not provide us with sufficient evidence to express an opinion or provide any assurance. Our audit was conducted for the purpose of forming opinions on the financial statements that collectively comprise the Rockwood R-VI School District’s basic financial statements. The introductory section, budgetary comparison information on pages 60 through 62, the statistical information on pages 63 through 87 and the schedule of selected statistics on pages 89 through 93 are presented for purposes of additional analysis and are not a required part of the basic financial statements. The accompanying schedule of expenditures of federal awards is presented for the purposes of additional analysis as required by the U.S. Office of Management and Budget Circular A-133, Audits of States, Local Governments, and Non-Profit Organizations, and is also not a required part of the basic financial statements of Rockwood R-VI School District. The budgetary comparison information and the schedule of expenditures of federal awards have been subjected to the auditing procedures applied in the audit of the basic financial statements and, in our opinion, are fairly stated in all material respects in relation to the basic financial statements taken as a whole. The introductory section, statistical section and schedule of selected statistics, which is of a nonaccounting nature, have not been subjected to the auditing procedures applied in the audit of the basic financial statements and, accordingly, we express no opinion on them. St. Louis, Missouri November 3, 2010
2


ROCKWOOD SCHOOL DISTRICT St. Louis County, Missouri
MANAGEMENT DISCUSSION AND ANALYSIS THE YEAR ENDED JUNE 30, 2010
(UNAUDITED) The discussion and analysis of Rockwood School District’s financial performance provides a comprehensive overview of the District’s financial activities and the results of operations for the fiscal year ended June 30, 2010. The District has implemented the Governmental Accounting Standards Board (GASB) Statement No. 34 for State and Local Governments as of 2002. Readers of the District statements, including this discussion and analysis, are encouraged to review the notes to the basic financial statements to enhance their understanding of the District’s financial performance. The Management’s discussion and analysis is provided at the beginning of the audit to communicate the past and current position of the District’s financial condition. Financial Highlights The key government-wide financial highlights for FY2010 are as follows: In total, net assets decreased approximately $1.0 million in the current year, primarily due to a
increase in the cash and temporary investments of the 2010 Bond Issues, offset by the related increase in long-term bond obligation. The 2010A Bond Issue was approved and sold in January for $24.5 million and will retire debt in 2014. The 2010B Bond Issue was approved in April and sold in June for $33.9 million and will be spent primarily in 2010-11 and 2011-12. The temporary investments will continue to decrease as the Bond Issue projects are completed. Liabilities decreased in the current obligations as the current maturities were decreased in 2009-10. Long-term obligations increased as a result of the decrease in the current amounts payable and the new issuance of debt. The self-funded insurance account balances in cash and current liabilities changed in response to the favorable plan changes.
General Revenues accounted for $206.9 million or 83.9% of the District’s $246.7 million total
revenue under GASB34 accounting rules. Of this general revenue, $177.3 million or 85.7% was from local effort including all taxes and the revenue from the Voluntary Transfer Student program. Program specific revenue in the form of charges for services, operating grants and contributions and capital grants accounted for approximately $39.7 million or 16.1% of the total revenue.
At the government-wide level, the District had $247.6 million in education related expenses. Of
these expenses approximately $39.7 million were offset by program specific charges for services, grants or contributions. General revenues were adequate to provide for the District’s programs in FY10.
Administrative Center K. Scott Tate, CPA 111 East North Street Director of Finance Eureka, MO 63025-1229
(636) 733-2058
(636) 938-2265 Fax
Growing Together, Learning for Life
3

ROCKWOOD SCHOOL DISTRICT St. Louis County, Missouri
MANAGEMENT DISCUSSION AND ANALYSIS FOR THE YEAR ENDED JUNE 30, 2010
(UNAUDITED) (continued)
At the government-wide level, the net assets were $257.0 million compared to $258.0 million
at the end of FY09. The decrease in Invested in Capital Assets, Net of Related Debt was due to spending approximately $32 million of prior year bond issue proceeds for purchase of capital assets, an increase in depreciation of $12 million, payments made on general obligation bonds, and the issuance of new debt.
The fund balances, at the fund level were $142.6 million for all funds combined. Of that
total, $43.4 million were operating fund balances from the Incidental, Teacher’s and Non-Capital Building Funds (Fund 110, Fund 200 and Fund 450). Board of Education policy requires the District to maintain operating fund balances equal to 18% of the budgeted level of expenditures plus 4% of expenditures as a stabilization fund for emergency situations. Our ending operating fund balances are slightly below that goal at 20.9%.
The District enjoys a AAA bond rating. Enrollment The District served a student body of 22,402 students which included 20,295 residential students, 1,744 Volunteer Transfer Students and 363 Special School District (273 resident and 90 VTS) students as of the January 2010 official enrollment. Historically, the District’s enrollment has experienced growth of 322 or 1.5% over the past five years. It is anticipated that enrollment will decline slightly over the next several years to 21,437 by 2014-15. The overall picture beyond that is a slightly declining pattern with no anticipated residential growth and maintaining the proportionate number of voluntary transfer students from the City of St. Louis schools. Using This Annual Report The District’s annual report consists of a series of financial statements that show information for the District as a whole including the Rockwood School District Educational Facilities Authority (a component unit) and its individual funds. The Statements of Net Assets on page 15 and the Statements of Activities on pages 16 and 17 provide information about the activities of the Government as a whole, based on full-accrual basis of accounting, and present a longer-term view of the District’s finances. The Fund Financial Statements, the Fund Balance Sheets and Statements of Revenue, Expenditures and Changes in Fund Balances, provide the next level of detail about the District’s four required funds; the General Fund, the Special (Teacher’s) Fund, the Debt Service Fund and the Capital Fund. These statements tell how the District financed program services in the short-term, as well as what remains for future spending. The fund level statements are prepared on the modified accrual basis of accounting and include a bridge schedule to reconcile them to the government level statements. These statements provide a comparative look at FY2010 versus the prior year.
4

ROCKWOOD SCHOOL DISTRICT St. Louis County, Missouri
MANAGEMENT DISCUSSION AND ANALYSIS FOR THE YEAR ENDED JUNE 30, 2010
(UNAUDITED) (continued)
The annual report also includes the notes to the basic financial statements. The user of the annual report should read the independent auditor’s report, as well as the notes to the basic financial statements to gain a clear picture of the financial position of the District. This reporting model was adopted by the Government Accounting Standards Board (GASB) in their statement No. 34, Basic Financial Statements – and Management’s Discussion and Analysis – for State and Local Governments in June, 1999. The implementation timetable for this financial reporting model, as applied to the District, was for years beginning after June 15, 2001 or for the year ended June 30, 2002. The District fit the classification for the earliest implementation schedule (Phase I) as the total annual revenues exceed $100 million. In preparation for this implementation, the District restated the general purpose financial statements for the year ended June 30, 2001, in order to provide for adequate comparative analysis to understand the changes in the financial position of the District in the years beyond. The District’s financial statements for the years since 2001 have been prepared in compliance with this GASB model. Reporting The District As A Whole The District adheres to Missouri State requirements for school districts and uses four major funds to account for the revenues, programs and activities each fiscal year. These statements provide information on these funds individually, and the view of the District as a whole answers the question of how well did the District do financially during the year in the Statement of Activities. This statement explains the types of resources: revenues, charges for services, grants and contributions and the uses of resources; instructional and support services expenses. In addition, the Statement of Net Assets reports the District’s net assets and changes in those assets and liabilities or claims against those assets. This statement tells the reader that, for the District as a whole, the financial position during the current year has either improved or diminished. These statements report revenues and expenses, and assets, liabilities and fund balances using the full accrual basis of accounting similar to the accounting used by most private-sector entities. This basis of accounting recognizes all of the current year’s revenues and expenses regardless of when cash is received or paid. In the Statement of Net Assets and the Statement of Activities, the District reports governmental activities including instruction, support services, operation and maintenance of plant, pupil transportation and extracurricular and miscellaneous activities. The District does not have any business type activities. The Rockwood School District Facility Authority activities are reported as a blended component unit and shown with the District activities. See Note 1 for further information. The District shows the Internal Service Fund – Self Insurance Fund statements separately as required by GASB 34.
5

ROCKWOOD SCHOOL DISTRICT St. Louis County, Missouri
MANAGEMENT DISCUSSION AND ANALYSIS FOR THE YEAR ENDED JUNE 30, 2010
(UNAUDITED) (continued)
The District As A Whole Table 1 provides a summary of the District’s net assets as of June 30, 2010 compared to June 30, 2009.
Increase2010 2009 (decrease)
Current and other assets 173,843,601$ 154,424,342$ 19,419,259$ Capital assets - net 363,364,261 343,411,828 19,952,433
Total assets 537,207,862$ 497,836,170$ 39,371,692$
Current and other liabilities 46,207,695$ 48,286,929$ (2,079,234)$ Noncurrent liabilities 234,026,139 191,591,641 42,434,498
Total liabilities 280,233,834 239,878,570 40,355,264
Net assetsInvested in capital assets, net of related debt 173,045,211 192,550,322 (19,505,111) Restricted 42,536,770 23,698,379 18,838,391 Unrestricted 41,392,047 41,708,899 (316,852)
Total net assets 256,974,028 257,957,600 (983,572)
Total liabilities and net assets 537,207,862$ 497,836,170$ 39,371,692$
Table 1Condensed Statements of Net Assets - Governmental Activities
June 30,
6

ROCKWOOD SCHOOL DISTRICT St. Louis County, Missouri
MANAGEMENT DISCUSSION AND ANALYSIS FOR THE YEAR ENDED JUNE 30, 2010
(UNAUDITED) (continued)
Total net assets decreased $1.0 million in the current year. Cash and temporary investments increased nearly $14.9 million due to the issuance of the 2010A and 2010B Bond Issues in the amount of $64.3 million and payments made for projects associated with the 2008 Bond Issue of $49.4 million, and net capital assets (less depreciation) increased over $19.9 million. All of these changes are primarily attributable to Bond Issue activities. The District sold a General Obligation Bond Issue of $33.9 million in June, 2010. The expenditures related to this bond issue in FY2011 and beyond will provide improvements or additions to nearly every location in the District. The District accounts for partially completed capital projects as construction in progress and adds these to the fixed assets as the projects are put into service. Noncurrent liabilities accounted for the majority of the $40.4 million increase in liabilities. This was due primarily to the bond issue principal payments on the new Bond Issues and existing long-term debt. Of the $257.0 million of net assets (assets less liabilities), $131.9 million are restricted for capital asset investment net of related debt and unspent bond proceeds. Another $42.5 million is restricted by Missouri Statute for: Debt Service Fund ($37.2 million), Teacher’s Fund ($4.1 million), and Capital Projects ($1.2 million). The remaining $41.4 million is unrestricted and may be used to finance day-to-day activities without constraints established by Federal or State statutes. As the capital projects are completed and are added to the fixed asset system, the capital asset investment will increase to balance the amount of related outstanding debt. Total net assets decreased $1.0 million from FY2009, and the unrestricted balance decreased $.3 million from $41.7 million to $41.4 million.
7

ROCKWOOD SCHOOL DISTRICT St. Louis County, Missouri
MANAGEMENT DISCUSSION AND ANALYSIS FOR THE YEAR ENDED JUNE 30, 2010
(UNAUDITED) (continued)
Table 2 shows the sources of the changes in net assets for the year ended June 30, 2010 compared to the year ended June 30, 2009.
Increase2010 2009 (decrease) %
RevenuesProgram revenues:
Charges for services 21,805,930$ 21,067,955$ 737,975$ 3.5%Operating grants and contributions 17,919,259 17,440,559 478,700 2.7%Capital grants and contributions - - - 0.0%
General revenue - taxes 177,323,376 179,879,480 (2,556,104) -1.4%Federal, State and County Aid
Not restricted to programs 27,886,662 24,517,542 3,369,120 13.7%Other 1,722,128 8,057,072 (6,334,944) -78.6%
Total revenue 246,657,355 250,962,608 (4,305,253) -1.7%
Program expensesInstruction 134,654,265 129,906,095 4,748,170 3.7%Pupil and instructional staff 25,161,147 24,926,252 234,895 0.9%Board and executive administration service 22,262,176 23,168,659 (906,483) -3.9%Operation of plant 29,250,163 25,883,783 3,366,380 13.0%Pupil transportation 10,390,547 10,129,427 261,120 2.6%Central services 2,976,633 2,809,541 167,092 5.9%Non-instructional services (food) 7,369,456 8,162,386 (792,930) -9.7%Community education 9,352,662 9,251,162 101,500 1.1%Interest and fiscal charges 6,223,878 11,463,349 (5,239,471) -45.7%
Total expenses 247,640,927 245,700,654 1,940,273 0.8%
Increase (decrease) in net assets (983,572) 5,261,954 (6,245,526)$ -118.7%
Net assets at beginning of year 257,957,600 252,695,646
Net assets at end of year 256,974,028$ 257,957,600$
Table 2Changes in Net Assets for Government-Wide Activities
For the years ended June 30,
Revenue for FY2010 decreased by $4.3 million versus FY2009. This decrease was primarily from errors in the establishment of the tax rate last year after the Missouri legislature passed a bill (SB711) requiring school districts to establish their 2009 tax rates before final assessment results were available. To comply with the new law, the District established its 2009 rate using preliminary assessment data from St. Louis and Jefferson Counties. In addition, the District saw increases in the state funding formula.
8
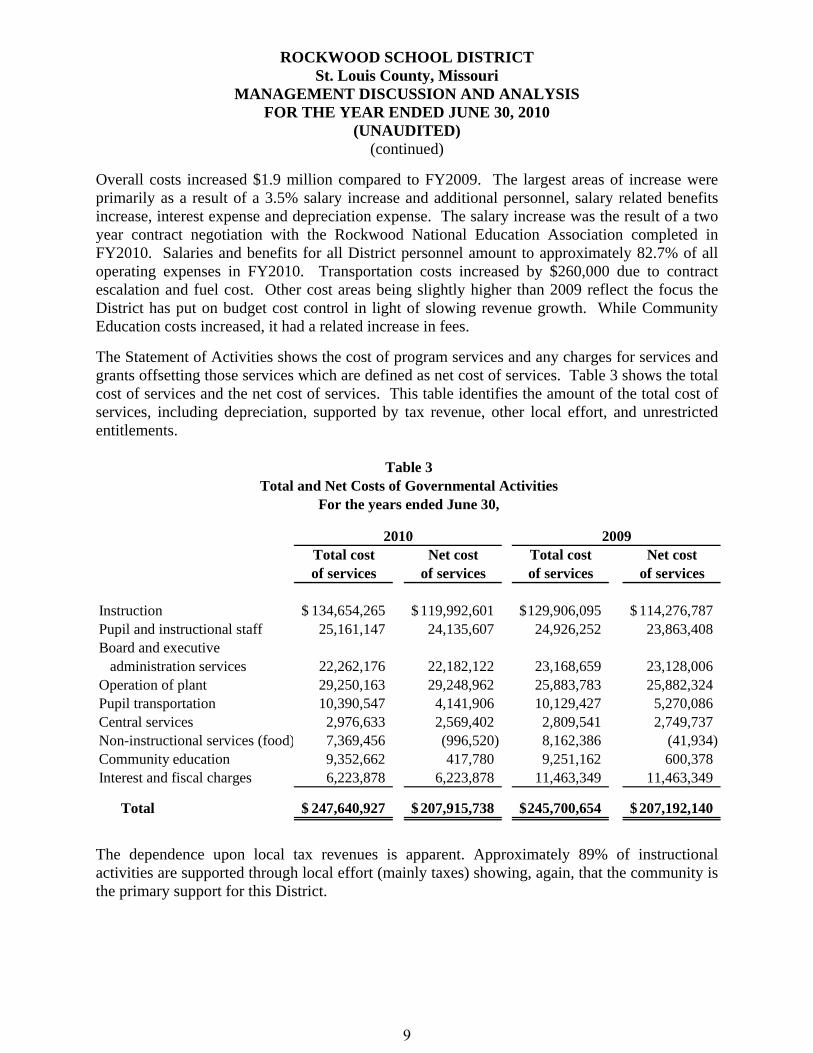
ROCKWOOD SCHOOL DISTRICT St. Louis County, Missouri
MANAGEMENT DISCUSSION AND ANALYSIS FOR THE YEAR ENDED JUNE 30, 2010
(UNAUDITED) (continued)
Overall costs increased $1.9 million compared to FY2009. The largest areas of increase were primarily as a result of a 3.5% salary increase and additional personnel, salary related benefits increase, interest expense and depreciation expense. The salary increase was the result of a two year contract negotiation with the Rockwood National Education Association completed in FY2010. Salaries and benefits for all District personnel amount to approximately 82.7% of all operating expenses in FY2010. Transportation costs increased by $260,000 due to contract escalation and fuel cost. Other cost areas being slightly higher than 2009 reflect the focus the District has put on budget cost control in light of slowing revenue growth. While Community Education costs increased, it had a related increase in fees. The Statement of Activities shows the cost of program services and any charges for services and grants offsetting those services which are defined as net cost of services. Table 3 shows the total cost of services and the net cost of services. This table identifies the amount of the total cost of services, including depreciation, supported by tax revenue, other local effort, and unrestricted entitlements.
Total cost Net cost Total cost Net costof services of services of services of services
Instruction 134,654,265$ 119,992,601$ 129,906,095$ 114,276,787$ Pupil and instructional staff 25,161,147 24,135,607 24,926,252 23,863,408 Board and executive
administration services 22,262,176 22,182,122 23,168,659 23,128,006 Operation of plant 29,250,163 29,248,962 25,883,783 25,882,324 Pupil transportation 10,390,547 4,141,906 10,129,427 5,270,086 Central services 2,976,633 2,569,402 2,809,541 2,749,737 Non-instructional services (food) 7,369,456 (996,520) 8,162,386 (41,934) Community education 9,352,662 417,780 9,251,162 600,378 Interest and fiscal charges 6,223,878 6,223,878 11,463,349 11,463,349
Total 247,640,927$ 207,915,738$ 245,700,654$ 207,192,140$
2010 2009
Table 3Total and Net Costs of Governmental Activities
For the years ended June 30,
The dependence upon local tax revenues is apparent. Approximately 89% of instructional activities are supported through local effort (mainly taxes) showing, again, that the community is the primary support for this District.
9

ROCKWOOD SCHOOL DISTRICT St. Louis County, Missouri
MANAGEMENT DISCUSSION AND ANALYSIS FOR THE YEAR ENDED JUNE 30, 2010
(UNAUDITED) (continued)
Capital Assets At the end of FY2010, the District had $515,605,192 invested in capital assets at the gross level with $363,364,261 net of depreciation. Table 4 shows June 30, 2010 compared to June 30, 2009.
Increase2010 2009 (decrease)
Land and land improvements 21,691,816$ 21,674,409$ 17,407$ Buildings and building improvements 461,765,894 430,808,998 30,956,896 Machinery and equipment 29,551,779 29,362,689 189,090 Licensed vehicles 2,595,703 2,474,836 120,867
Totals 515,605,192$ 484,320,932$ 31,284,260$
Table 4Capital Assets
June 30,
Overall capital assets increased $31.3 million from June 30, 2009, primarily in the building area when construction in progress items from the bond issues were added to the capital asset records. Further information may be found in the Notes to the Financial Statements found in this document; Note IV Changes in Capital Assets. Debt Administration At June 30, 2010, the District had outstanding General Obligation debt of $228,680,000 and other debt of $2,738,848. The District has built four new schools in the past ten years and made major additions and renovations on other campuses including classrooms, labs, gymnasiums, and theaters additions. The Bond Issue sold in September 2001 added another grade school and made additions to a high school campus plus several other renovations of existing facilities. The Bond Issue(a) sold in 2003 was for major renovations in a number of campuses, including a theatre at one of our four high schools. The other 2003(b) Bond Issue was sold to refund a portion of the 1996 Bond Issue maturities and save interest expense of approximately $350,000 for the District. In May, 2006 the District sold a $44.4 million Bond Issue which provided funds for additions or renovations. In June 2008, an issue for $74.5 million was sold for additions and renovations for most of the District’s 36 sites. Also, in March 2008 the District refunded and reissued $17.2 million of maturities on prior bond issues for savings in future interest cost. In February 2009 the District refunded and reissued $32.9 million of maturities on bond issues for a savings of future interest costs of $845,388.
10

ROCKWOOD SCHOOL DISTRICT St. Louis County, Missouri
MANAGEMENT DISCUSSION AND ANALYSIS FOR THE YEAR ENDED JUNE 30, 2010
(UNAUDITED) (continued)
In January 2010, the District refunded and reissued $24.5 million of maturities on bond issues for a savings of future interest costs of $941,435. An additional Bond Issue was sold in June 2010 in the amount of $33.9 million for additions and renovations for many of the District’s 36 sites. Table 5 shows June 30, 2010 compared to June 30, 2009.
Increase2010 2009 (decrease)
Bond issue 2001 5,700,000$ 9,700,000$ (4,000,000)$ Bond issue 2003 20,960,000 24,040,000 (3,080,000) Bond Issue 2006 39,000,000 40,800,000 (1,800,000) Bond Issue 2008 71,705,000 82,195,000 (10,490,000) Bond Issue 2009 32,945,000 32,945,000 - Bond Issue 2010 58,370,000 - 58,370,000
Total bonded debt 228,680,000 189,680,000 39,000,000
Energy Financing 2,078,848 2,338,054 (259,206) Capital Leases 660,000 1,185,000 (525,000)
Total other 2,738,848 3,523,054 (784,206)
Total all obligations 231,418,848$ 193,203,054$ 38,215,794$
June 30,
Table 5Outstanding Obligations
Other long-term obligations include obligations under capital leases, energy financing for lighting project, accrued compensated absences and liability for other Post Employment Benefits. Further information may be found in the Notes to the Financial Statements found in this document; Note V Changes in Long-Term Obligations. Missouri statute allows school districts to incur debt up to an amount equal to 15% of the most current assessed valuation. The District’s allowable debt level ceiling was $527 million at June 30, 2010, far above the District’s current level of debt. Missouri law also requires school districts to set a tax levy adequate to service the outstanding debt. The District’s Debt Service levy for FY2010 was $ .68 on each $100 of assessed valuation. The Debt Service Fund balance at June 30, 2010, was $50.1 million and equal to nearly 180% of the annual debt service expense. The District now enjoys an AAA bond rating.
11

ROCKWOOD SCHOOL DISTRICT St. Louis County, Missouri
MANAGEMENT DISCUSSION AND ANALYSIS FOR THE YEAR ENDED JUNE 30, 2010
(UNAUDITED) (continued)
Reporting the District’s Most Significant Funds The District’s Funds The General Fund balance increased $.5 million. Revenue from the Foundation Formula phase in contributed the increase in the overall fund balance. Costs related to transportation, operation of plant, child nutrition and community service increased $0.4 million in total. Overall fund balances increased by $17.4 million to $142.6 million from 2009. The total District had actual revenues of $246.9 million and expenditures of $289.8 million and $60.4 million from other sources and uses, with the resultant increase in fund balances for 2010 of $17.4 million. The largest increase was $24.8 million in the Debt Service Fund due to FY2010 refunding Bond Issue proceeds which will be held in escrow until 2014. The Teachers Fund decreased $6.6 million in response to the increase in salary and benefit costs. The Capital Projects Fund decreased $1.3 million as a result of the expenditures associated with the 2008 Bond Issue projects and the sale of the 2010B Bond Issue in the amount of $33.9 million. Statements showing the District’s original and final budget compared with actual operating results are provided in the CAFR on page 56 and 57 for the General Fund and Teachers (Special) Fund, and on pages 60 to 62 for the Debt Service Fund, Capital Projects Fund and all government funds. The District’s budget and reporting structure follow the statutes of the State of Missouri and as such consists of four major funds; the General Fund, the Teachers (Special) Fund, the Debt Service Fund and the Capital Projects Fund. At the fund level, the District accounts for the annual activities and prepares the budget using the modified accrual basis of accounting. Revenues are recognized in the accounting period in which they become measurable and available or collectible within sixty days after the end of the current period (June 30). Expenditures are recognized in the accounting period in which the liability is incurred, if measurable, except for unmatured interest on general long-term debt, which is recognized when due. During FY2010, the District amended its original approved budget regularly to reflect current knowledge of revenues and expenditures. These changes in the General Fund budget amounted to over $4.8 million in reduced revenue from the original. This revenue is primarily related to the error in establishing the local tax rate. The actual revenue for the General Fund was approximately $844,500 less than the final budget.
12

ROCKWOOD SCHOOL DISTRICT St. Louis County, Missouri
MANAGEMENT DISCUSSION AND ANALYSIS FOR THE YEAR ENDED JUNE 30, 2010
(UNAUDITED) (continued)
Budgeted expenditures in the General Fund were increased $540,900 from the original budget of $93.2 million, but the actual expenditures were $4.3 million less than the final budget due primarily to salary and benefits savings. The Teachers (Special) Fund had actual revenues of $124.6 million and $131.2 million expenditures resulting in a fund decrease of $6.6 million to $4.1 million. The Debt Service Fund had revenues of $26.2 million plus other financing sources of $26.4 million and $27.8 million of expenditures to increase the fund balance by $24.8 million to $50.1 million. The Capital Projects Fund revenue was $6.4 million plus other financing sources of $34.7 million against expenditure of $42.4 million. The inequity was due to expenditures related to the 2008 Bond Issue revenue being recognized in FY2010, and the end of year sale of the 2010B Bond Issue. The fund balance, as a result, decreased by $1.3 million to $42.3 million. Included in the other financing sources were fund transfers from the General Fund to meet state accounting requirements. For the Future Rockwood School District continues to be in excellent financial health and is committed to wise financial management. The growth of the District’s enrollment has slowed to a level that has produced relatively flat enrollment numbers when paired with maintaining a proportionate number of voluntary transfer students. The budgeting process continues to guide the District in a fiscally sound and responsible direction. Operating Fund balances have grown over the past ten years to 20.9% of the subsequent year’s expenditures, nearing the Board of Education’s expectations. The current Board of Education policy is to ensure year-end operating fund balances equal to 18% of the subsequent annual operating expenditures plus an additional 4% of expenditures for a stabilization fund. In conclusion, the Rockwood School District has committed itself to scholastic as well as financial excellence for many years. The District’s systems for financial planning, budgeting and internal control are well regarded. The District will continue to be prudent in financial management in order to meet the challenges of the future.
13

ROCKWOOD SCHOOL DISTRICT St. Louis County, Missouri
MANAGEMENT DISCUSSION AND ANALYSIS FOR THE YEAR ENDED JUNE 30, 2010
(UNAUDITED) (continued)
Contacting the District’s Financial Management: This report is designed to give an overview of the financial conditions of the Rockwood School District. If you desire additional information, you may contact the following persons: Shirley A. Broz, CPA
Chief Financial and Legislative Officer 636-733-2020 K. Scott Tate, CPA Director of Finance 636-733-2058
14


2010 2009ASSETS
Current assetsCash and temporary investments 158,882,472$ 144,008,839$ Taxes receivable - net 10,146,951 7,497,509 Other receivables 2,905,459 1,404,705 Inventory 795,046 458,351 Prepaid items 1,113,673 1,054,938
Total current assets 173,843,601 154,424,342
Noncurrent assetsUndepreciated capital assets 13,659,234 13,659,234 Construction in progress 58,056,103 32,067,188 Depreciated capital assets 443,889,855 438,594,510 Less accumulated depreciation (152,240,931) (140,909,104)
Total noncurrent assets 363,364,261 343,411,828
TOTAL ASSETS 537,207,862$ 497,836,170$
LIABILITIESCurrent liabilities
Accounts payable and other current liabilities 13,614,306$ 11,914,321$ Self-funded insurance 11,844,510 11,647,597 Unearned revenue 207,598 118,749 Current portion of long-term obligations 20,541,281 24,606,262
Total current liabilities 46,207,695 48,286,929
Noncurrent liabilitiesNoncurrent portion of long-term obligations 224,102,378 182,617,961 Other payables 9,923,761 8,973,680
Total noncurrent liabilities 234,026,139 191,591,641
Total liabilities 280,233,834 239,878,570
NET ASSETSInvested in capital assets, net of related debt 173,045,211 192,550,322 Restricted for
Debt service 37,243,820 11,722,842 Certified employees compensation and benefits 4,125,585 10,732,278 Capital projects 1,167,365 1,243,259
Unrestricted 41,392,047 41,708,899 Total net assets 256,974,028 257,957,600
TOTAL LIABILITIES AND NET ASSETS 537,207,862$ 497,836,170$
ROCKWOOD R-VI SCHOOL DISTRICT
STATEMENTS OF NET ASSETSJUNE 30,
Governmental activities
The notes to the basic financial statements are an integral part of these statements.
15

Net (expense)revenue andchanges in
net assetsCharges Operating Capital Total
for grants and grants and governmentalFunction/Program Expenses services contributions contributions activities
Governmental activitiesInstruction
Elementary 44,890,395$ 1,719,034$ 225,576$ -$ (42,945,785)$ Middle 26,911,453 - - - (26,911,453) High 39,945,924 115,234 123,949 - (39,706,741) TAG/title/special 7,921,610 - 2,256,435 - (5,665,175) Early childhood special education 5,726,284 - 5,109,544 - (616,740) Student ath/athl act/spons act 8,665,345 4,869,856 12,645 - (3,782,844) Other instruction 593,254 - 229,391 - (363,863)
Total instruction 134,654,265 6,704,124 7,957,540 - (119,992,601)
Support servicesAttendance 1,485,541 - 153,463 - (1,332,078) Guidance 6,151,889 - 206,141 - (5,945,748) Health, psych, speech and audio 2,447,080 - 199,101 - (2,247,979) Improvement of instruction 8,999,165 423 444,058 - (8,554,684) Professional development 378,315 - 22,355 - (355,960) Media services (library) 5,699,157 - - - (5,699,157) Board of education services 902,285 - - - (902,285) Executive administration 4,635,913 - 3,255 - (4,632,658) Building level administration 13,998,535 - 24,946 - (13,973,589) Business central service 2,075,087 - 51,853 - (2,023,234) Security services 29,250,163 - 1,200 - (29,248,963) Operation of plant 650,356 - - - (650,356) Pupil transportation 10,390,547 185,579 6,063,062 - (4,141,906) Food services 7,369,456 6,497,566 1,868,410 - 996,520 Central office support services 2,976,633 390,617 16,614 - (2,569,402) Adult education 350,910 20,708 338,361 - 8,159 Community services 9,001,752 8,006,913 568,900 - (425,939) Debt service
Interest and fiscal charges 6,223,878 - - - (6,223,878) Total support services 112,986,662 15,101,806 9,961,719 - (87,923,137)
Total governmental activities 247,640,927$ 21,805,930$ 17,919,259$ -$ (207,915,738)
General revenues Taxes
114,186,899 23,329,284 14,433,669 12,175,961
90,995 13,106,568 27,886,662 1,675,140
46,988
206,932,166
(983,572)
Net assets at July 1, 2009 257,957,600
Net assets at June 30, 2010 256,974,028$
Federal, State and County aid not restricted to specific purposesInterest and investment earningsMiscellaneous
Total general revenues
Change in net assets
Property taxes, levied for general purposesProperty taxes, levied for debt serviceSales taxM & M surtaxOther taxesTaxes - VICC
ROCKWOOD R-VI SCHOOL DISTRICT
STATEMENT OF ACTIVITIES FOR THE YEAR ENDED JUNE 30, 2010
Program revenues
The notes to the basic financial statements are an integral part of this statement.
16

Net (expense)revenue andchanges in
net assetsCharges Operating Capital Total
for grants and grants and governmentalFunction/Program Expenses services contributions contributions activities
Governmental activitiesInstruction
Elementary 45,316,184$ 1,582,733$ 987,003$ -$ (42,746,448)$ Middle 24,812,145 - - - (24,812,145) High 37,648,365 143,392 151,537 - (37,353,436) TAG/title/special 7,849,714 - 2,297,150 - (5,552,564) Early childhood special education 4,995,947 - 4,692,935 - (303,012) Student ath/athl act/spons act 8,698,341 5,067,344 13,612 - (3,617,385) Other instruction 585,399 - 693,602 - 108,203
Total instruction 129,906,095 6,793,469 8,835,839 - (114,276,787)
Support servicesAttendance 1,510,275 - 172,603 - (1,337,672) Guidance 5,976,929 - 230,445 - (5,746,484) Health, psych, speech and audio 2,326,520 - 229,904 - (2,096,616) Improvement of instruction 8,672,894 55,200 373,894 - (8,243,800) Professional development 538,370 - 799 - (537,571) Media services (library) 5,901,264 - - - (5,901,264) Board of education services 518,130 - - - (518,130) Executive administration 6,111,954 - 1,506 - (6,110,448) Building level administration 13,755,297 - 25,515 - (13,729,782) Business central service 2,125,317 - 13,632 - (2,111,685) Security services 657,961 - - - (657,961) Operation of plant 25,883,783 - 1,459 - (25,882,324) Pupil transportation 10,129,427 173,776 4,685,565 - (5,270,086) Food services 8,162,386 6,511,218 1,693,102 - 41,934 Central office support services 2,809,541 576 59,228 - (2,749,737) Adult education 331,702 10,886 366,139 - 45,323 Community services 8,919,460 7,522,830 750,929 - (645,701) Debt service
Interest and fiscal charges 11,463,349 - - - (11,463,349) Total support services 115,794,559 14,274,486 8,604,720 - (92,915,353)
Total governmental activities 245,700,654$ 21,067,955$ 17,440,559$ -$ (207,192,140)
General revenues Taxes
115,416,190 23,774,719 14,844,928 11,926,730
506,164 13,410,749 24,517,542 7,756,920
300,152
212,454,094
5,261,954
Net assets at July 1, 2008 252,695,646
Net assets at June 30, 2009 257,957,600$
FOR THE YEAR ENDED JUNE 30, 2009STATEMENT OF ACTIVITIES - CONTINUED
ROCKWOOD R-VI SCHOOL DISTRICT
Program revenues
Property taxes, levied for general purposesProperty taxes, levied for debt service
Other taxes
Sales taxM & M surtax
Total general revenues
Change in net assets
Taxes - VICCFederal, State and County aid not restricted to specific purposesInterest and investment earningsMiscellaneous
The notes to the basic financial statements are an integral part of this statement.
17

CapitalGeneral Teachers' Debt Service Projects
Fund Fund Fund Fund 2010 2009ASSETS
Cash and temporary investments 46,194,427$ 6,140,726$ 49,571,829$ 45,130,979$ 147,037,961$ 132,361,242$ Property taxes receivable
less allowance for uncollectible taxes 2,520,585 3,506,849 1,285,530 264,670 7,577,634 5,051,175 Sales tax receivable - 2,569,317 - - 2,569,317 2,446,334 Accrued interest 8,671 2,486 8,700 122 19,979 437,650 Other receivables 2,212,506 651,786 - 1,445 2,865,737 741,863 Prepaid items 1,113,673 - - - 1,113,673 1,054,938
Total assets 52,049,862$ 12,871,164$ 50,866,059$ 45,397,216$ 161,184,301$ 142,093,202$
LIABILITIES
Accounts payable and accrued liabilities 4,135,055$ 6,507,049$ -$ 2,972,201$ 13,614,305$ 11,914,321$ Deferred revenue 1,776,803 2,238,530 766,709 157,852 4,939,894 4,939,243
Total liabilities 5,911,858 8,745,579 766,709 3,130,053 18,554,199 16,853,564
FUND BALANCES
Reserved for Prepaid items 1,113,673 - - - 1,113,673 1,054,938 Retirement of debt - - 50,099,350 - 50,099,350 25,258,210
UnreservedDesignated - 4,125,585 - 42,267,163 46,392,748 54,317,085 Undesignated 45,024,331 - - - 45,024,331 44,609,405
Total fund balances 46,138,004 4,125,585 50,099,350 42,267,163 142,630,102 125,239,638
Total liabilities and fund balances 52,049,862$ 12,871,164$ 50,866,059$ 45,397,216$ 161,184,301$ 142,093,202$
ROCKWOOD R-VI SCHOOL DISTRICT
BALANCE SHEETS - GOVERNMENTAL FUNDSJUNE 30,
Total Governmental Funds
The notes to the basic financial statements are an integral part of these statements.
18

Amounts reported for governmental activities in the statement of net assets are different because:
Total fund balance - governmental funds 142,630,102$
The cost of capital assets is 515,605,192$ Accumulated depreciation is (152,240,931)
363,364,261
4,939,895
19,742
795,046 (207,598)
Bonds payable (228,680,000) Accrued interest payable (3,177,588) Other debt (2,738,848) Vacation payable (889,803) Sick pay payable (5,125,561) Postemployment benefits other than pensions (4,798,200) G/O bond premium - unamortized (10,312,487) G/O bond discount - unamortized 1,155,067 (254,567,420)
Total net assets - governmental activities 256,974,028$
Property taxes receivable will be collected this year, but are not available soon enough topay for the current period's expenditures, and therefore are deferred in the funds statements.
Some interest receivable will be collected this year, but is not available soon enough topay for the current period's expenditures, and therefore is not accrued in the funds statements.
These liabilities consist of:
Inventory of food service items is added as an asset in the statement of net assets each year.A portion of this inventory is considered a donated commodity and unearned revenue.
Current and long-term liabilities, including bonds payable, are not due and payable in the current period (net of retirements) and therefore are not reported as liabilities in the funds.
Capital assets reported in District activities are not financial resources and therefore arenot reported as assets in the funds statements.
ROCKWOOD R-VI SCHOOL DISTRICT
RECONCILIATION OF THE BALANCE SHEET OFGOVERNMENTAL FUNDS TO THE STATEMENT OF NET ASSETS
JUNE 30, 2010
The notes to the basic financial statements are an integral part of this statement.
19

CapitalGeneral Teachers' Debt Service Projects Fund Fund Fund Fund 2010 2009
RevenuesProperty taxes 45,742,537$ 63,640,541$ 23,329,284$ 4,803,169$ 137,515,531$ 142,218,514$ Other local sources 30,039,903 30,032,970 2,424,385 1,327,398 63,824,656 66,473,287 Intermediate sources 954,029 1,607,947 483,288 72,735 3,117,999 2,859,875 State sources 4,985,190 24,409,310 - 64,757 29,459,257 30,822,501 Federal sources 7,197,346 4,910,094 - 122,044 12,229,484 6,847,041 Other sources 679,002 - - 36,216 715,218 532,605
Total revenues 89,598,007 124,600,862 26,236,957 6,426,319 246,862,145 249,753,823
ExpendituresInstruction
Elementary 2,220,771 39,032,128 - 454,665 41,707,564 42,635,006 Middle 1,814,216 22,178,660 - 192,604 24,185,480 22,891,926 High 2,688,512 32,933,958 - 355,656 35,978,126 34,251,675 TAG/title/special 684,619 6,859,788 - 300,970 7,845,377 7,794,836 Early childhood special education 2,509,492 3,131,894 - 9,180 5,650,566 4,924,471 Student act/athl/act/spons act 6,076,770 2,420,281 - 168,295 8,665,346 8,698,341 Other instruction 125,948 467,306 - - 593,254 585,399
Total instruction 16,120,328 107,024,015 - 1,481,370 124,625,713 121,781,654
Support servicesAttendance 1,442,394 37,080 - 6,066 1,485,540 1,510,275 Guidance 693,343 5,458,546 - - 6,151,889 5,976,929 Health, psych, speech and audio 2,082,557 340,897 - 23,626 2,447,080 2,326,520 Improvement of instruction 4,294,926 3,307,742 - 1,396,497 8,999,165 8,672,894 Professional development 276,787 101,528 - - 378,315 538,370 Media services (library) 1,989,294 3,517,270 - 192,593 5,699,157 5,901,264 Board of Education services 560,785 - - 5,431 566,216 415,442 Executive administration 1,481,094 2,257,386 - 31,528 3,770,008 3,813,398 Building level administration 5,013,095 8,985,440 - - 13,998,535 13,755,297 Business central services 2,047,116 - - 27,971 2,075,087 2,125,317 Operation of plant 22,474,003 - - 298,402 22,772,405 23,747,102 Security services 649,917 438 - - 650,355 657,961 Pupil transportation 10,390,547 - - - 10,390,547 10,129,427 Food services 7,099,161 - - 419,299 7,518,460 8,087,804 Central office support services 2,738,878 141,501 - 96,253 2,976,632 2,765,035 Adult education 348,143 - - 2,768 350,911 331,702 Community services 8,650,491 35,712 - 266,439 8,952,642 8,874,678
Capital outlayCapital outlay - - - 36,942,757 36,942,757 37,772,844
Debt servicePrincipal retirement - - 19,370,000 784,206 20,154,206 18,063,295 Interest and fiscal charges - - 8,471,578 445,244 8,916,822 12,668,900
72,232,531 24,183,540 27,841,578 40,939,080 165,196,729 168,134,454 Total expenditures 88,352,859 131,207,555 27,841,578 42,420,450 289,822,442 289,916,108
Excess of revenues over (under) expenditures 1,245,148 (6,606,693) (1,604,621) (35,994,131) (42,960,297) (40,162,285)
Other financing sources (uses)
Transfers (771,487) - - 771,487 - - Bond issuance - - - 33,905,000 33,905,000 - Refunding bonds issued - - 24,465,000 - 24,465,000 32,945,000 Payment to refunded bond escrow agent - - - - - (33,030,000) Premium on issuance of bonds - - 1,980,761 - 1,980,761 4,083,210 Total other financing sources (uses) (771,487) - 26,445,761 34,676,487 60,350,761 3,998,210
NET CHANGE IN FUND BALANCE 473,661 (6,606,693) 24,841,140 (1,317,644) 17,390,464 (36,164,075)
Fund balance at beginning of year 45,664,343 10,732,278 25,258,210 43,584,807 125,239,638 161,403,713
Fund balance at end of year 46,138,004$ 4,125,585$ 50,099,350$ 42,267,163$ 142,630,102$ 125,239,638$
ROCKWOOD R-VI SCHOOL DISTRICT
STATEMENTS OF REVENUES, EXPENDITURES AND CHANGES IN FUND BALANCE -GOVERNMENTAL FUNDS
FOR THE YEARS ENDED JUNE 30,
Total Governmental Funds
The notes to the basic financial statements are an integral part of these statements.
20

Total net change in fund balances - total governmental funds 17,390,464$
Capital asset purchases 31,284,260$ Depreciation expense (11,331,827) 19,952,433
659 (205,449)
The governmental funds report debt (e.g. bond) proceeds as an other financing source of funds in thefund financial statements, but is reclassified as a long-term obligations on the Statement of Activities. (58,370,000)
Bond premiums, discounts and deferred costs are recognized in the fund financial statements but arereclassified to liabilities and amortized over the life of the bonds on the Statement of Activities. (1,980,761)
20,154,206
196,894
247,841
300,490
The fund financial statements do not recognize the liability related to postemployment benefits otherthan pensions. This liability is recognized in the Statement of Activities. (1,062,800)
2,392,451
Change in net assets of governmental activities. (983,572)$
of issuance on the G.O. Bonds or other debt outstanding.
THE STATEMENT OF ACTIVITIES
reported in the Statement of Activities is inclusive of both accrued interest and the interestaccreted on the District's "capital appreciation" bonds.
The fund statements do not recognize the establishment or amortization of premium, discount or cost
Interest on long-term obligations in the Statement of Activities differs from the amount reported in thegovernmental funds because interest is recorded as an expenditure in the funds when it is due, andthus requires the use of current financial resources. In the Statement of Activities, however, interestexpense is recognized as the interest accrues, regardless of when it is due. The additional interest
These liabilities are not recognized in the fund statements.
Repayment of long-term obligations is an expenditure in the governmental funds, but it reduces long-term
Also included herein is the change in unamortized accrued interest premium.
Inventory on hand, including donated commodities from government sources, is included as a cost in thegovernmental fund statements but is considered an asset in the Statement of Activities. This portionrepresents the change in inventory.
obligations in the Statement of Net Assets and does not affect the Statement of Activities in the government-wide statements.
The changes in liabilities for compensated absences and early retirement payable are recorded inStatement of Activities and are based on actual days outstanding and estimated employees who are affected.
are instead counted as deferred tax revenues. They are, however, recorded as revenues in the Statementof Activities. This includes the reversal of the prior year and the accrual of the current year.
Capital outlays to purchase or build capital assets are reported in governmental funds as expenditures.However, for government-wide activities those costs are shown in the Statement of Net Assets andallocated over their estimated useful lives as annual depreciation expenses in the Statement of Activities.This is the amount by which capital assets exceed depreciation in the period.
ROCKWOOD R-VI SCHOOL DISTRICT
RECONCILIATION OF THE STATEMENT OF REVENUES, EXPENDITURESAND CHANGES IN FUND BALANCE OF GOVERNMENTAL FUNDS WITH
FOR THE YEAR ENDED JUNE 30, 2010
Because some property taxes and interest income will not be collected for several months after the District's fiscal year ends, they are not considered as available revenues in the governmental funds, and
The notes to the basic financial statements are an integral part of this statement.
21

2010 2009
CURRENT ASSETSCash and cash equivalents 11,844,510$ 11,647,597$
LIABILITIESAccounts payable and accrued liabilities 11,844,510$ 11,647,597$
NET ASSETSUnrestricted - -
Total liabilities and net assets 11,844,510$ 11,647,597$
Governmental Activities -Internal Service Fund
ROCKWOOD R-VI SCHOOL DISTRICT
STATEMENTS OF NET ASSETS - PROPRIETARY FUNDJUNE 30,
The notes to the basic financial statements are an integral part of these statements.
22

2010 2009
Operating revenuesLocal and intermediate sources 21,747,807$ 19,800,466$
Operating expensesProfessional and contract services 21,764,982 19,884,744
Operating loss (17,175) (84,278)
Non-operating revenues Interest income 17,175 84,278
CHANGE IN NET ASSETS - -
Net assets at beginning of year - -
Net assets at end of year -$ -$
ROCKWOOD R-VI SCHOOL DISTRICT
CHANGES IN NET ASSETS - PROPRIETARY FUNDYEARS ENDED JUNE 30,
Governmental Activities -Internal Service Fund
STATEMENTS OF REVENUES, EXPENSES AND
The notes to the basic financial statements are an integral part of these statements.
23

2010 2009
Cash flows from operating activitiesCash received from local and intermediate sources 21,747,807$ 19,800,466$ Cash payments to suppliers for claims and services (21,568,068) (19,394,922)
Net cash provided by operating activities 179,739 405,544
Cash flows from investing activitiesInterest on investments 17,175 84,278
NET INCREASE IN CASH 196,914 489,822
Cash at beginning of year 11,647,597 11,157,775
Cash at end of year 11,844,511$ 11,647,597$
Reconciliation of operating loss to net cash providedby operating activities
Operating loss (17,175)$ (84,278)$ Change in accounts payable and accrued liabilities 196,914 489,822
Net cash provided by operating activities 179,739$ 405,544$
ROCKWOOD R-VI SCHOOL DISTRICT
STATEMENTS OF CASH FLOWS - PROPRIETARY FUNDYEARS ENDED JUNE 30,
Governmental Activities -Internal Service Fund
The notes to the basic financial statements are an integral part of these statements.
24

ROCKWOOD R-VI SCHOOL DISTRICT
NOTES TO THE BASIC FINANCIAL STATEMENTS JUNE 30, 2010 AND 2009
I. SUMMARY OF SIGNIFICANT ACCOUNTING POLICIES
The financial statements of Rockwood R-VI School District have been prepared in conformity with accounting principles generally accepted in the United States of America (GAAP) as applied to governmental units. The Governmental Accounting Standards Board (GASB) is the accepted standard-setting body for establishing governmental accounting and financial reporting principles. Following are the more significant accounting policies of the District. Rockwood R-VI School District (the District) was established under the Statutes of the State of Missouri. The District operates as a "six director" district (with seven members of the Board of Education) as described in RSMo Chapter 162. The District provides educational services to primarily pre-kindergarten through high school students. The Rockwood School District Board of Education (The Board) is the basic level of government that has financial accountability and control over all activities related to public education in the District.
Reporting Entity
These financial statements present the District (primary government) and its component unit, the Rockwood School District Educational Facilities Authority (the Authority). As defined by GASB No. 14 and amended by No. 39, component units are legally separate entities that are included in the District’s reporting entity because of the significance of their operating or financial relationship with the District. The District is not a component unit of another reporting entity.
The District created the Authority, a nonprofit corporation, to partially finance construction of an Early Childhood Center and to pay off existing HVAC indebtedness. Although legally separate, the Authority is blended as a governmental fund into the primary government. Separate financial statements for the Authority are not issued. Basis of Presentation The District’s basic financial statements consist of government-wide statements, including a Statement of Net Assets and a Statement of Activities, and fund financial statements which provide a more detailed level of financial information. The financial information for the year ended June 30, 2009, is presented for comparative purposes. Certain reclassifications have been made for consistency in presentation.
25

ROCKWOOD R-VI SCHOOL DISTRICT
NOTES TO THE BASIC FINANCIAL STATEMENTS JUNE 30, 2010 AND 2009
I. SUMMARY OF SIGNIFICANT ACCOUNTING POLICIES (CONTINUED)
Government-Wide Financial Statements
The Statement of Net Assets and the Statement of Activities display information about the District, the primary government, as a whole. These statements include the financial activities of the primary government. Internal service fund activity is eliminated to avoid ‘doubling up’ revenues and expenses. Governmental activities generally are financed through taxes, intergovernmental revenues and other non-exchange transactions.
The government-wide statements are prepared using the economic resources measurement focus and accrual basis of accounting. This is the same approach used in the preparation of proprietary fund financial statements but differs from the manner in which governmental fund financial statements are prepared. Governmental fund financial statements include a reconciliation with brief explanations to better identify the relationship between the government-wide statements and the statements for governmental funds.
The government-wide Statement of Net Assets presents the financial condition of the governmental activities at year end. The government-wide Statement of Activities presents a comparison between direct expenses and program revenues for each program of the District’s governmental activities. Direct expenses are those that are specifically associated with a service, program, or department and therefore clearly identifiable to a particular function. Amounts reported as program revenues include (a) charges paid by the recipient of the goods or services offered by the programs and (b) grants and contributions that are restricted to meeting the operational or capital requirements of a particular program. Revenues, which are not classified as program revenues, are presented as general revenues of the District, with certain limited exceptions. The comparison of direct expenses with program revenues identifies the extent to which each governmental function is self-financing or draws from the general revenues of the District.
Fund Financial Statements
The fund financial statements report detail information about the District’s funds. The District segregates transactions related to certain functions or activities into separate funds in order to aid financial management and to demonstrate legal compliance. Fund financial statements are designed to present financial information of the District at this more detailed level. The focus of governmental financial statements is on major funds. Each major fund is presented in a separate column. Non-major funds are aggregated and presented in a single column. The District considers each of its funds to be major. The internal service fund, which funds the District’s self-insured health benefits, is presented in a single column on the face of the proprietary fund statements.
26

ROCKWOOD R-VI SCHOOL DISTRICT
NOTES TO THE BASIC FINANCIAL STATEMENTS JUNE 30, 2010 AND 2009
I. SUMMARY OF SIGNIFICANT ACCOUNTING POLICIES (CONTINUED)
Fund Financial Statements (Concluded)
The accounting and financial reporting treatment applied to a fund is determined by its measurement focus. All governmental fund types are accounted for using a flow of current financial resources measurement focus. The financial statements for governmental funds are the balance sheet which generally includes only current assets and current liabilities, and a statement of revenues, expenditures and changes in fund balances, which reports on the sources (i.e., revenues and other financing sources) and uses (i.e., expenditures and other financing uses) of current financial resources.
Fund Accounting
The accounts of the District are organized on the basis of funds, each of which is considered to be a separate accounting entity. The operations of each fund are summarized by providing a separate set of self-balancing accounts which include its assets, liabilities, and fund balances arising from revenues and expenditures. The measurement focus is upon determination of changes in the financial position rather than upon net income determination. District resources are allocated to and accounted for, in individual funds based upon the purposes for which they are to be spent and the means by which spending activities are controlled. The following funds are the District’s governmental funds, each of which the District considers to be a major fund:
Governmental Funds
General Fund: This fund is the general operating fund of the District, and accounts for expenditures for non-certified employees, pupil transportation costs, operation of plant, fringe benefits, student body activities, community services, the food service program, and any expenditures not required or permitted to be accounted for in other funds. Special Revenue (Teachers) Fund: A special revenue fund is required to be established by state law which accounts for expenditures for certified employees involved in instruction and administration, and includes revenues restricted by the state and local tax levy allocations for the payment of teacher salaries and certain benefits.
Debt Service Fund: Accounts for the accumulation of resources for, and the payment of, principal, interest and fiscal charges on long-term obligations.
Capital Projects Fund: Accounts for the proceeds of long-term debt, taxes and other revenues designated for acquisition or construction of major capital assets.
27

ROCKWOOD R-VI SCHOOL DISTRICT
NOTES TO THE BASIC FINANCIAL STATEMENTS JUNE 30, 2010 AND 2009
I. SUMMARY OF SIGNIFICANT ACCOUNTING POLICIES (CONTINUED)
Fund Accounting (Concluded)
Proprietary Funds The Proprietary Fund focuses on the determination of changes in net assets, financial position, and cash flows and is classified as either enterprise or internal service. The District does not have any enterprise funds. The District’s Proprietary Fund is: Internal Service Fund – Accounts for the financing of services provided by one department or agency to other departments or agencies of the District on a cost-reimbursement basis. This fund was established to account for the District’s self-funded medical and dental insurance benefits for participating employees and their families. The revenues received by the internal service fund represent premiums withheld as payroll deductions from employees and interest earned on the deposited funds. Claims paid, direct insurance payments, and administrative costs are the only expenses of this fund. A liability for estimated claims incurred, but not reported, is recorded in this fund.
Basis of Accounting
Basis of accounting determines when transactions are recorded in the financial records and reported on the financial statements. Government-wide financial statements are prepared using the accrual basis of accounting. Governmental funds use the modified accrual basis of accounting. Proprietary funds also use the accrual basis of accounting at both reporting levels. Differences in the accrual and the modified accrual basis of accounting arise in the recognition of revenue (property and sales taxes), the recording of deferred revenue, and in the presentation of expenses versus expenditures.
Government-wide financial statements prepared on the accrual basis of accounting recognize and record revenues when earned and expenses are recorded when a liability is incurred, regardless of the timing of the related cash flow. Property taxes are recognized as revenues in the year they are levied. Grants and similar revenue are recognized as revenue as soon as all of the eligibility requirements have been met.
Government fund financial statements prepared on the modified accrual basis of accounting recognize revenues as soon as they are both measurable and available. The District considers available to mean collectible within sixty days after the end of the current period. Expenditures are recognized in the accounting period in which the fund liability is incurred, if measurable, except for unmatured interest on general long-term debt, which is recognized when due. Allocations of cost, such as depreciation and amortization, are not recognized in governmental funds at the fund reporting level.
28

ROCKWOOD R-VI SCHOOL DISTRICT
NOTES TO THE BASIC FINANCIAL STATEMENTS JUNE 30, 2010 AND 2009
I. SUMMARY OF SIGNIFICANT ACCOUNTING POLICIES (CONTINUED)
Basis of Accounting (Concluded)
Amounts reported as program revenues include 1) charges to users for goods, services, or privileges provided, 2) operating grants and contributions, 3) capital grants and contributions.
In the Statements of Net Assets and the Statements of Activities, the District reports governmental activities. The District does not have any business type activities. The Rockwood School District Facility Authority’s activities are reported as a blended component unit and shown with governmental activities.
Proprietary funds distinguish between operating and non-operating revenues and expenses. Operating revenues and expenses normally result from providing services and producing and delivering goods in connection with the fund’s principle function. The principal operating revenue in the internal service fund includes payroll withholdings or payments on insurance premiums. Operating expenses are related to providing insurance coverage and paying third party administrative fees. All revenues and expenses not meeting this definition are reported as non-operating revenues and expenses. The statement of cash flows provides information about how the District finances and meets the cash flow needs of its proprietary fund.
It is District policy to use restricted resources prior to unrestricted when both are available for use.
Revenues – Exchange and Non-Exchange Transactions
Revenues resulting from exchange transactions, in which each party receives essentially equal value, are recorded on the accrual basis when the exchange takes place. On the modified accrual basis, revenues are recorded in the fiscal year in which the resources are measurable and available. Available means that the resources will be collected within the current fiscal year or are expected to be collected soon enough thereafter to be used to pay liabilities of the current fiscal year. For the District, available means expected to be received within sixty days of the fiscal year-end.
29

ROCKWOOD R-VI SCHOOL DISTRICT
NOTES TO THE BASIC FINANCIAL STATEMENTS JUNE 30, 2010 AND 2009
I. SUMMARY OF SIGNIFICANT ACCOUNTING POLICIES (CONTINUED)
Revenues – Exchange and Non-Exchange Transactions (Concluded)
Non-exchange transactions, in which the District receives value without directly giving value in return, include property taxes, grants, entitlements and donations. On an accrual basis, revenue from property taxes is recognized in the fiscal year for which the taxes are levied. Revenue from grants, entitlements and donations is recognized in the fiscal year in which all eligibility requirements have been satisfied. Eligibility requirements include timing requirements, which specify the year when the resources are required to be used or the fiscal year when use is first permitted, matching requirements, in which the District must provide local resources to be used for a specified purpose, and expenditure requirements, in which the resources are provided to the District on a reimbursement basis. On a modified accrual basis, revenues from non-exchange transactions must also be available before they can be recognized.
Expenses/Expenditures
On the accrual basis of accounting, expenses are recognized at the time they are incurred.
The measurement focus of governmental fund accounting is on decreases in net financial resources (expenditures) rather than expenses. Expenditures are generally recognized in the accounting period in which the related fund liability is incurred, if measurable. Allocations of costs, such as depreciation and amortization, are not recognized in the governmental funds at the fund reporting level.
Pooled Cash and Temporary Investments
Cash resources are combined to form a pool of cash and temporary investments, which is managed by the District Treasurer, except resources from the Debt Service Fund, as state law requires these deposits to be separately maintained.
The District may invest in bonds of the State of Missouri, of the United States, or any wholly owned corporation of the United States; or in other short-term obligations of the United States.
Interest income earned is allocated to contributing funds based on each funds’ proportionate shares of funds invested.
For purposes of the statement of cash flows, the District’s internal service fund considers all highly liquid investments with an original maturity of three months or less when purchased to be cash equivalents.
30

ROCKWOOD R-VI SCHOOL DISTRICT
NOTES TO THE BASIC FINANCIAL STATEMENTS JUNE 30, 2010 AND 2009
I. SUMMARY OF SIGNIFICANT ACCOUNTING POLICIES (CONTINUED)
Restricted Cash and Investments
Restricted cash and investments represent amounts whose use is limited by legal requirements and consist of unexpended bond proceeds and amounts escrowed for future general obligation bond principal and interest payments, as discussed in Note II. Inventories and Prepaid Items Inventories are valued at cost and consist of purchased food and supplies of $587,446 and donated government commodities of $207,600. The cost is recorded as an expenditure at the time the inventory is purchased. Prepaid items of $1,113,673 consist of insurance premiums on policies that provide coverage past the current year-end. These premiums will be expensed through the balance of the policy terms within one year. A current asset for the prepaid amount is recorded at the time of the purchase and an expenditure/expense is reported in the year in which services are consumed. Receivables
Taxes receivable include property taxes and sales taxes. Property taxes receivable is reported net of an allowance for uncollectible calculated from historical collection rates. Other receivables include interest earned but not yet credited to the District’s accounts, amounts due the District from the State, amounts due to the District from federal grants, and some miscellaneous receivables from various local activities.
Deferred Revenue
Deferred revenue arises when assets are recognized before revenue recognition criteria have been satisfied.
Capital Assets
Capital assets, which include land, buildings, machinery and equipment, automobiles and other vehicles, and construction in progress, are reported in the governmental activities column of the government-wide financial statements. The District defines capital assets as assets with an initial, individual cost of more than $5,000. All land purchases are capitalized. Assets are recorded at historical cost or estimated historical cost if actual historical cost is not available and are updated for additions and retirements during the year. Donated assets are recorded at their fair market values as of the date received. The District does not own any infrastructure.
The cost of routine maintenance and repairs that do not add to the value of the asset or materially extend the asset life are not capitalized.
31

ROCKWOOD R-VI SCHOOL DISTRICT
NOTES TO THE BASIC FINANCIAL STATEMENTS JUNE 30, 2010 AND 2009
I. SUMMARY OF SIGNIFICANT ACCOUNTING POLICIES (CONTINUED) Capital Assets (Concluded) Capital assets under construction and not yet in use by the District as of the date of the financial statements are reported as construction in progress. Assets reported as construction in progress will include individual assets with a cost less than $5,000. All reported capital assets except land and construction in progress are depreciated using the straight-line method over the useful lives of the assets.
Estimateduseful life
Land improvements 20Buildings 50Machinery and equipment 15Technology (including machinery
and equipment) 5Automobiles and other vehicles 5
Capital asset type
Compensated Absences and Early Retirement
An accrual for certain salary related payments associated with vacation time and unused sick leave are included in the government-wide financial statements.
District employees earn vacation time throughout the fiscal year to be taken by the end of the subsequent fiscal year except administrative employees who are allowed to carry over vacation time earned in the current year through August 31 of the subsequent fiscal year. Unused vacation is payable to the employee upon termination. Employees who meet certain requirements may receive compensation for unused sick leave payable at time of retirement.
32

ROCKWOOD R-VI SCHOOL DISTRICT
NOTES TO THE BASIC FINANCIAL STATEMENTS JUNE 30, 2010 AND 2009
I. SUMMARY OF SIGNIFICANT ACCOUNTING POLICIES (CONTINUED)
Accrued Liabilities and Long-term Obligations All payables, accrued liabilities and long-term obligations are reported in the government-wide financial statements. In general, payables and accrued liabilities that will be paid from governmental funds are reported on the governmental fund financial statements regardless of whether they will be liquidated with current resources. However, special termination benefits, claims and judgments, and compensated absences that will be paid from governmental funds are reported as a liability in the fund financial statements only to the extent that they are due for payment. In general, liabilities that mature or come due for payment during the fiscal year are considered to have been made with current available financial resources. Bonds, capital leases and other long-term obligations that will be paid from governmental funds are not recognized as a liability in the fund financial statements until due.
Post Employment Benefits
COBRA Benefits - Under the Consolidated Omnibus Budget Reconciliation Act (COBRA), the District provides healthcare benefits to eligible former employees and eligible dependents. Certain requirements are outlined by the federal government for this coverage. The premium is paid in full by the insured on or before the tenth (10th) day of the month for the actual month covered. This program is offered for a duration of eighteen months after the termination date.
There is no associated cost to the District under this program. The District prepares the initial COBRA enrollment forms and the former employee makes the premium payments directly to a division of the third party administrator.
The District also offers continued healthcare benefits to retired employees who elect to participate. The retiree pays the premium. There is no additional charge to the District for this offered benefit.
33

ROCKWOOD R-VI SCHOOL DISTRICT
NOTES TO THE BASIC FINANCIAL STATEMENTS JUNE 30, 2010 AND 2009
I. SUMMARY OF SIGNIFICANT ACCOUNTING POLICIES (CONTINUED)
Fund Balance Classifications
The Special (Teachers’) Fund, by Missouri Statute, may not be used for any purpose other than payment of certificated salaries and related benefits. The Capital Projects Fund is, by state regulation, restricted to expenditures for lease purchase payments and all other capital outlay expenditures. The fund balance for these two funds have been reported as designated on the fund financial statements. Unreserved fund balance indicates that portion of fund equity that is available for appropriation in future periods. The District reserves those portions of fund equity legally segregated for a specific future use or which do not represent available expendable resources and therefore are not available for appropriation or expenditure. The Debt Service Fund may only be used for the payment of principal, interest and fiscal charges on long-term debt by state restrictions. Fund equity reserves have been established for prepaid items and retirement of long-term debt.
Net Assets
Net assets represent the difference between assets and liabilities. Net assets invested in capital assets, net of related debt consists of capital assets, net of accumulated depreciation, reduced by the outstanding balances of any borrowings used for the acquisition, construction, or improvement of those assets. Net assets are reported as restricted when there are limitations imposed on their use either through the enabling legislation adopted by the District or through external restrictions imposed by creditors, grantors or laws or regulations of other governments. All other net assets are reported as unrestricted. The District applies restricted resources first when an expense is incurred for purposes for which both restricted and unrestricted net assets are available.
Interfund Activity
Interfund transfers are reported as other financing sources/uses in governmental funds. Missouri statute requires the District to report all equipment purchases in the Capital Projects Fund. During the year the District accounts for certain capital outlay expenditures in the various General Fund sub-categories (Student Activity, Community Education and Child Nutrition). The District then records a transfer for these expenditures to the Capital Projects Fund at year end. For the year ended June 30, 2010, these transfers amounted to $771,487.
34

ROCKWOOD R-VI SCHOOL DISTRICT
NOTES TO THE BASIC FINANCIAL STATEMENTS JUNE 30, 2010 AND 2009
I. SUMMARY OF SIGNIFICANT ACCOUNTING POLICIES (CONCLUDED)
Use of Estimates In preparing financial statements in conformity with accounting principles generally accepted in the United States of America, management is required to make estimates and assumptions that affect the reported amounts of assets and liabilities and disclosures of contingent assets and liabilities at the date of the financial statements and the reported amounts of revenues and expenses during the reporting period. Actual results could differ from those estimates. However, it is management’s belief that the actual results will materially approximate the estimates used.
Teachers’ Salaries
The salary payment schedule of the District for the 2009-10 school year requires the payment of salaries over a twelve month period. Consequently, the final three teacher payrolls related to the 2009-10 school year are included in accounts payable on the basic financial statements. This practice has been consistently followed in previous years.
35

ROCKWOOD R-VI SCHOOL DISTRICT
NOTES TO THE BASIC FINANCIAL STATEMENTS JUNE 30, 2010 AND 2009
II. CASH AND TEMPORARY INVESTMENTS Cash balances from all funds, except the Debt Service Fund are combined and invested to the
extent available in short-term securities. State laws require that all deposits of the Debt Service Fund be kept separate and apart from all other funds of the District. Earnings from such investments are allocated to the General Fund, Teachers Fund and Capital Projects Fund on the basis of the applicable cash balance participation by each fund. Separate accounts are maintained for the Debt Service Fund and the Internal Service Fund. Interest is deposited directly into these accounts. State statutes authorize the District to invest in obligations of the United States government or any agency or instrumentality, including repurchase agreements; bonds of the State of Missouri, or the United States, or of any wholly owned corporation of the United States, and other short-term obligations of the United States; under limited circumstances, commercial paper and banker’s acceptances; and deposit accounts with insured financial institutions, provided the accounts are entirely insured by the Federal Deposit Insurance Corporation (FDIC) or collateralized with government securities that have a fair value exceeding the deposit amount. Investments with the Missouri Direct Deposit Program and escrow agents for refunding escrow accounts are regulated by investment contracts that only authorize investments in obligations of the United States government or any agency or instrumentality thereof.
The District’s investments are stated at fair value, which approximates cost as of June 30, 2010.
36
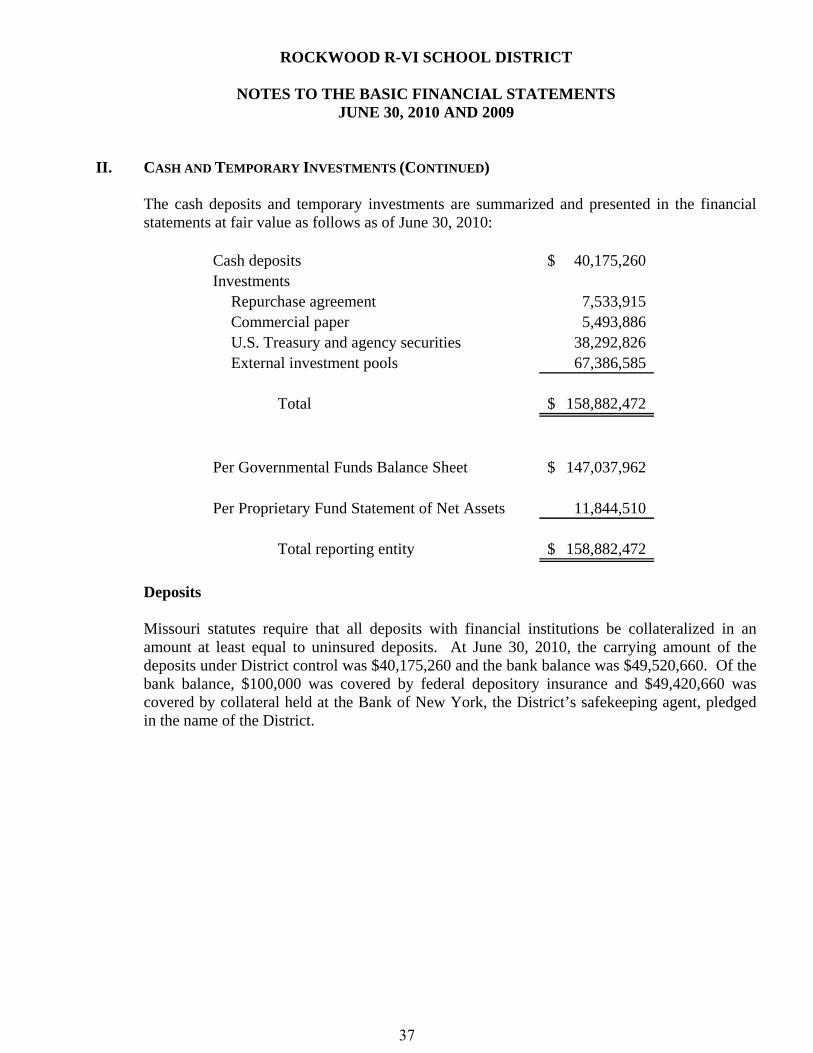
ROCKWOOD R-VI SCHOOL DISTRICT
NOTES TO THE BASIC FINANCIAL STATEMENTS JUNE 30, 2010 AND 2009
II. CASH AND TEMPORARY INVESTMENTS (CONTINUED)
The cash deposits and temporary investments are summarized and presented in the financial statements at fair value as follows as of June 30, 2010:
Cash deposits 40,175,260$ Investments
Repurchase agreement 7,533,915 Commercial paper 5,493,886 U.S. Treasury and agency securities 38,292,826 External investment pools 67,386,585
Total 158,882,472$
Per Governmental Funds Balance Sheet 147,037,962$
Per Proprietary Fund Statement of Net Assets 11,844,510
Total reporting entity 158,882,472$
Deposits Missouri statutes require that all deposits with financial institutions be collateralized in an amount at least equal to uninsured deposits. At June 30, 2010, the carrying amount of the deposits under District control was $40,175,260 and the bank balance was $49,520,660. Of the bank balance, $100,000 was covered by federal depository insurance and $49,420,660 was covered by collateral held at the Bank of New York, the District’s safekeeping agent, pledged in the name of the District.
37
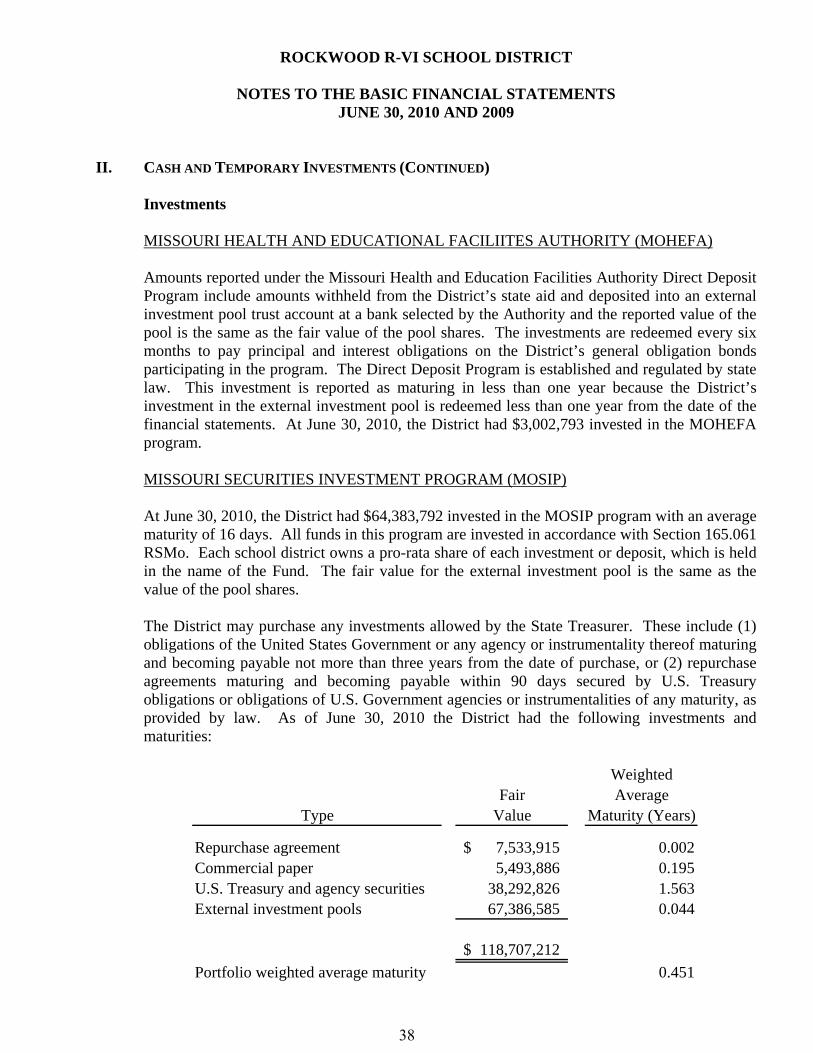
ROCKWOOD R-VI SCHOOL DISTRICT
NOTES TO THE BASIC FINANCIAL STATEMENTS JUNE 30, 2010 AND 2009
II. CASH AND TEMPORARY INVESTMENTS (CONTINUED) Investments MISSOURI HEALTH AND EDUCATIONAL FACILIITES AUTHORITY (MOHEFA) Amounts reported under the Missouri Health and Education Facilities Authority Direct Deposit Program include amounts withheld from the District’s state aid and deposited into an external investment pool trust account at a bank selected by the Authority and the reported value of the pool is the same as the fair value of the pool shares. The investments are redeemed every six months to pay principal and interest obligations on the District’s general obligation bonds participating in the program. The Direct Deposit Program is established and regulated by state law. This investment is reported as maturing in less than one year because the District’s investment in the external investment pool is redeemed less than one year from the date of the financial statements. At June 30, 2010, the District had $3,002,793 invested in the MOHEFA program.
MISSOURI SECURITIES INVESTMENT PROGRAM (MOSIP)
At June 30, 2010, the District had $64,383,792 invested in the MOSIP program with an average maturity of 16 days. All funds in this program are invested in accordance with Section 165.061 RSMo. Each school district owns a pro-rata share of each investment or deposit, which is held in the name of the Fund. The fair value for the external investment pool is the same as the value of the pool shares. The District may purchase any investments allowed by the State Treasurer. These include (1) obligations of the United States Government or any agency or instrumentality thereof maturing and becoming payable not more than three years from the date of purchase, or (2) repurchase agreements maturing and becoming payable within 90 days secured by U.S. Treasury obligations or obligations of U.S. Government agencies or instrumentalities of any maturity, as provided by law. As of June 30, 2010 the District had the following investments and maturities:
WeightedFair Average
Type Value Maturity (Years)
Repurchase agreement 7,533,915$ 0.002Commercial paper 5,493,886 0.195U.S. Treasury and agency securities 38,292,826 1.563External investment pools 67,386,585 0.044
118,707,212$ Portfolio weighted average maturity 0.451
38

ROCKWOOD R-VI SCHOOL DISTRICT
NOTES TO THE BASIC FINANCIAL STATEMENTS JUNE 30, 2010 AND 2009
II. CASH AND TEMPORARY INVESTMENTS (CONTINUED) Interest Rate Risk Interest rate risk is the risk that changes in market interest rates will adversely affect the fair value of an investment. Generally, the longer the maturity of an investment, the greater the sensitivity of its fair value to changes in market interest rates. The District has a formal investment policy that limits investment maturities as a means of managing its exposure to fair value losses arising from increasing interest rates. One of the ways the District manages its exposure to interest rate risk is by purchasing investments with short-term maturities to provide the cash flow and liquidity needed for operations, and by timing cash flows from maturities so a portion of the portfolio is maturing or coming close to maturity evenly over time as necessary to provide the cash flow and liquidity needed for operations. Credit Risk Credit risk is the risk that an issuer of an investment will not fulfill its obligation to the holder of the investment. State law limits investments that can be held by government agencies to safe high quality securities. The investments authorized under the investment policy are limited to federal government-backed securities, certificates of deposit, bankers’ acceptance, repurchase agreements (under certain conditions), local and state government bonds (limited to one of the highest three credit ratings) and District policy is also to use diversification to minimize credit risk. The District has a formal policy and supporting regulation which governs the investment funds. District administrators will be guided by the criteria of legality, safety, liquidity and yield. This is measured by the assignment of a rating by a nationally recognized statistical rating organization. The District’s investments in MOHEFA were not rated by a nationally recognized statistical rating organization. The District’s investments in MOSIP are rated AAA by Standard and Poor’s. Custodial Credit Risk Custodial credit risk is the risk that, in the event of the failure of the counterparty, the District will not be able to recover the value of its investment or collateral securities that are in possession of an outside party. The District’s investment policy states that the District will manage custodial credit risk by pre-qualifying the financial institutions and advisors with which the District will do business; and, diversifying the portfolio so that potential losses on individual securities will be minimized. The District’s investment policy further mandates that all securities purchased be perfected in the name of or for the account of the District and be held by a third-party custodian as evidenced by appropriate safekeeping receipts.
39

ROCKWOOD R-VI SCHOOL DISTRICT
NOTES TO THE BASIC FINANCIAL STATEMENTS JUNE 30, 2010 AND 2009
II. CASH AND TEMPORARY INVESTMENTS (CONCLUDED) Concentration of Credit Risk As a means of limiting its exposure to losses arising from concentration of investments, the District’s investment policy mandates that the portfolio not have a concentration of assets in specific maturity or specific class of securities. At a minimum, diversification standards by security type and issuer are established as (a) U.S. treasuries, securities issued by State of Missouri, and securities having principal and/or interest guaranteed by the U.S. Government – 100%; (b) collateralized time and demand deposits – 100%; (c) U.S. Government agencies, and government sponsored enterprises, no more than 60%; (d) collateralized repurchase agreements, no more than 50%; (e) U.S. Government callable securities, no more than 15%; (f) qualified commercial paper, no more than 25%; and (g) bankers’ acceptances, no more than 25%. The investment policy of the District contains no limitations on the amount that can be invested in any one issuer beyond what is provided by law. Investments in any one issuer representing 5% or more of total investments (excluding investments issued or explicitly guaranteed by the U.S. government, investments in mutual funds, external investment pools and other pooled investments) are as follows:
Investment Type Percentage
Federal Home Loan Mortgage Federal Agency Securities 24%
Bank of America Repurchase agreement 5%
Issuer
40

ROCKWOOD R-VI SCHOOL DISTRICT
NOTES TO THE BASIC FINANCIAL STATEMENTS JUNE 30, 2010 AND 2009
III. TAXES
Property taxes attach as an enforceable lien on property as of January 1. Taxes are levied on November 1 and are payable by December 31. All unpaid taxes become delinquent January 1 of the following year. The county collects the property taxes and remits them to the District on a monthly basis. An allowance for uncollectible taxes has been provided for delinquent taxes. At the fund reporting level, property tax revenues are recognized when they become measurable and available. Available includes those property tax receivables expected to be collected within sixty (60) days after year-end. Revenue recognition of delinquent property taxes not collected within sixty (60) days of fiscal year end is deferred. The District also receives sales tax collected by the State of Missouri and remitted to the District based on eligible pupil counts. The District is required to reduce its sales tax levy by one-half of the amount of sales tax estimated to be received in the subsequent calendar year, a prop C rollback. However, the District’s voters approved a full waiver of the Prop C rollback in the 1994/1995 school year, so sales taxes are not reduced to the District. The final assessed valuation of the tangible taxable property (excluding state assessed railroad and utilities) for the calendar year 2009 and 2008 for purposes of local taxation was:
2009 2008
Real estateResidential 2,208,816,180$ 2,381,860,240$ Agricultural 2,573,310 3,270,240 Commercial including locally assessed
railroad and utility 714,889,766 698,505,170 Personal property including locally assessed
railroad and utility 588,041,433 623,636,362 3,514,320,689 3,707,272,012
Less tax increment financing - 19,539,590
3,514,320,689$ 3,687,732,422$
Accounts receivable-property taxes at June 30, 2010, of $8,420,413 (less an allowance for uncollectible taxes of $842,779) represents uncollected taxes from the prior year's levy.
41

ROCKWOOD R-VI SCHOOL DISTRICT
NOTES TO THE BASIC FINANCIAL STATEMENTS JUNE 30, 2010 AND 2009
III. TAXES (CONCLUDED) Accounts receivable-property taxes at June 30, 2009, of $5,614,033 (less an allowance for uncollectible taxes of $562,859) represents uncollected taxes from the prior year’s levy. The tax levy per $100 of the assessed valuation of tangible taxable property for the fiscal years ending June 30 for purposes of local taxation was:
Unadjusted Adjusted Unadjusted Adjusted
General Fund 1.3333$ 1.3333$ 1.2768$ 1.2768$ Special Revenue Fund 1.8550 1.8550 1.7764 1.7764 Debt Service Fund 0.6800 0.6800 0.6800 0.6800 Capital Projects Fund 0.1400 0.1400 0.1900 0.1900
4.0083$ 4.0083$ 3.9232$ 3.9232$
2010 2009
The receipts of current and delinquent property taxes during the fiscal year ended June 30, 2010 and 2009, aggregated approximately 97.6% and 98.3%, respectively, of the current assessment computed on the basis of the levy as shown above.
42

ROCKWOOD R-VI SCHOOL DISTRICT
NOTES TO THE BASIC FINANCIAL STATEMENTS JUNE 30, 2010 AND 2009
IV. CHANGES IN CAPITAL ASSETS
Capital asset activity for the year ended June 30, 2010 was as follows:
Balance Balance
July 1, 2009 Transfers Additions Deletions June 30, 2010
Governmental activities
Capital assets that are not depreciated
Land 13,659,234$ -$ -$ -$ 13,659,234$
Construction in progress 32,067,188 (5,020,635) 31,009,550 - 58,056,103
Capital assets that are depreciated
Land improvements 8,015,175 17,407 - - 8,032,582
Buildings 398,741,810 4,967,981 - - 403,709,791
Machinery and equipment 29,362,689 - 189,092 - 29,551,781
Automobiles and other vehicles 2,474,836 35,247 85,618 - 2,595,701
Totals at estimated
historical cost 484,320,932 - 31,284,260 - 515,605,192
Accumulated depreciation
Land improvements 7,126,385 - 232,193 - 7,358,578
Buildings 109,563,281 - 8,339,540 - 117,902,821
Machinery and equipment 22,458,617 - 2,578,459 - 25,037,076
Automobiles and other vehicles 1,760,821 - 181,635 - 1,942,456
Total accumulated
depreciation 140,909,104 - 11,331,827 - 152,240,931
Governmental activities
capital assets, net 343,411,828$ -$ 19,952,433$ -$ 363,364,261$
Depreciation was charged to functions of the District as follows:Instruction
Elementary 3,149,469$ Middle 2,725,972 High school 3,967,799 Talented and Gifted 151,951
Board of Education services 336,069 Operation of plant 852,618 Food service 98,838 Community services 49,111
11,331,827$
43

ROCKWOOD R-VI SCHOOL DISTRICT
NOTES TO THE BASIC FINANCIAL STATEMENTS JUNE 30, 2010 AND 2009
V. CHANGES IN LONG-TERM OBLIGATIONS
The following is a summary of changes in long-term obligations for the year ended June 30, 2010:
Balance Balance Amounts due
July 1, June 30, within
2009 Additions Reductions 2010 one year
Governmental activities
Bonds payable
General obligation bonds 189,680,000$ 58,370,000$ (19,370,000)$ 228,680,000$ 16,065,000$
Deferred amounts for
issuance discounts and costs (861,776) (453,530) 160,239 (1,155,067) -
Deferred amounts on
issuance premiums 10,430,889 1,980,761 (2,099,163) 10,312,487 -
Total bonds payable, net 199,249,113 59,897,232 (21,308,924) 237,837,421 16,065,000
Obligations under
capital leases 1,185,000 - (525,000) 660,000 140,000
Energy financing 2,338,054 - (259,206) 2,078,848 268,890
Interest 3,478,078 3,177,588 (3,478,078) 3,177,588 3,177,588
Compensated absences 6,212,258 6,015,364 (6,212,258) 6,015,364 889,803
Other postemployment benefit
obligation 3,735,400 1,062,800 - 4,798,200 -
Total governmental
activity long-term
obligations 216,197,903$ 70,152,984$ (31,783,466)$ 254,567,420$ 20,541,281$
Payments on the general obligation bonds are made by the Debt Service Fund. The obligations under capital leases are paid by the Capital Projects Fund. The compensated absences and other postemployment benefit obligation will be liquidated by the General Fund or the Teachers Fund depending on which fund the employee’s salary was charged.
44
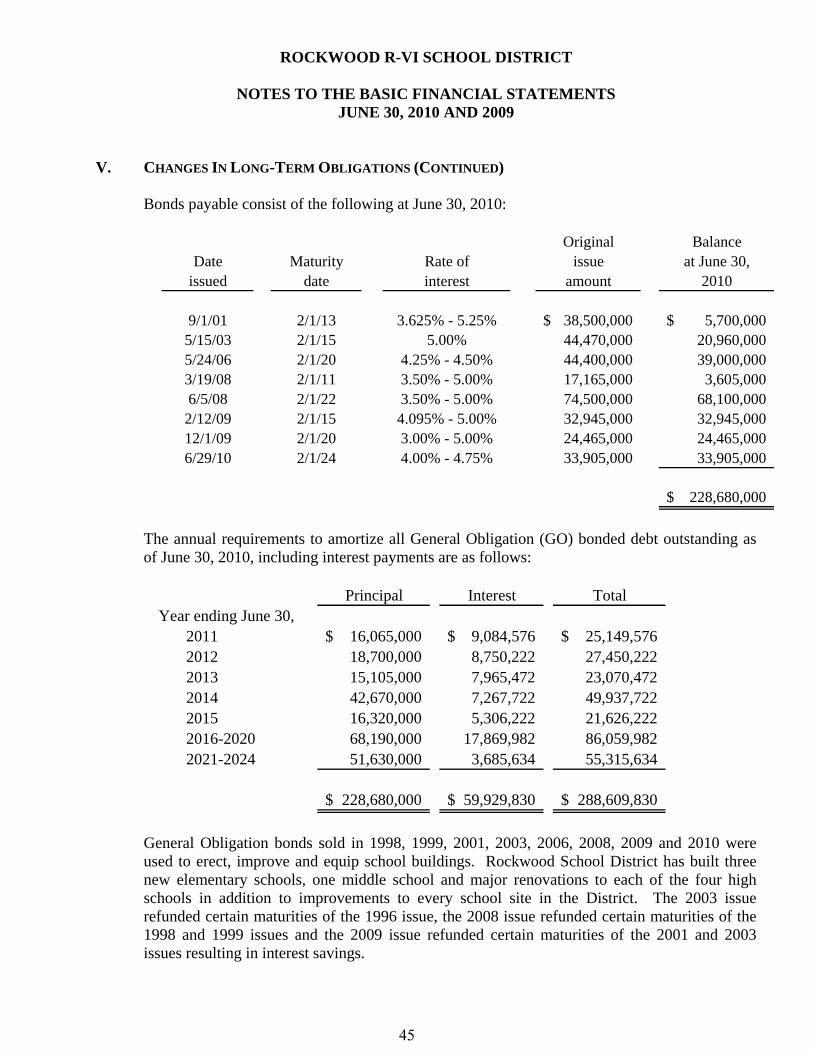
ROCKWOOD R-VI SCHOOL DISTRICT
NOTES TO THE BASIC FINANCIAL STATEMENTS JUNE 30, 2010 AND 2009
V. CHANGES IN LONG-TERM OBLIGATIONS (CONTINUED)
Bonds payable consist of the following at June 30, 2010:
Original BalanceDate Maturity Rate of issue at June 30,
issued date interest amount 2010
9/1/01 2/1/13 3.625% - 5.25% 38,500,000$ 5,700,000$ 5/15/03 2/1/15 5.00% 44,470,000 20,960,000 5/24/06 2/1/20 4.25% - 4.50% 44,400,000 39,000,000 3/19/08 2/1/11 3.50% - 5.00% 17,165,000 3,605,000 6/5/08 2/1/22 3.50% - 5.00% 74,500,000 68,100,000
2/12/09 2/1/15 4.095% - 5.00% 32,945,000 32,945,000 12/1/09 2/1/20 3.00% - 5.00% 24,465,000 24,465,000 6/29/10 2/1/24 4.00% - 4.75% 33,905,000 33,905,000
228,680,000$
The annual requirements to amortize all General Obligation (GO) bonded debt outstanding as of June 30, 2010, including interest payments are as follows:
Principal Interest TotalYear ending June 30,
2011 16,065,000$ 9,084,576$ 25,149,576$ 2012 18,700,000 8,750,222 27,450,222 2013 15,105,000 7,965,472 23,070,472 2014 42,670,000 7,267,722 49,937,722 2015 16,320,000 5,306,222 21,626,222 2016-2020 68,190,000 17,869,982 86,059,982 2021-2024 51,630,000 3,685,634 55,315,634
228,680,000$ 59,929,830$ 288,609,830$
General Obligation bonds sold in 1998, 1999, 2001, 2003, 2006, 2008, 2009 and 2010 were used to erect, improve and equip school buildings. Rockwood School District has built three new elementary schools, one middle school and major renovations to each of the four high schools in addition to improvements to every school site in the District. The 2003 issue refunded certain maturities of the 1996 issue, the 2008 issue refunded certain maturities of the 1998 and 1999 issues and the 2009 issue refunded certain maturities of the 2001 and 2003 issues resulting in interest savings.
45

ROCKWOOD R-VI SCHOOL DISTRICT
NOTES TO THE BASIC FINANCIAL STATEMENTS JUNE 30, 2010 AND 2009
V. CHANGES IN LONG-TERM OBLIGATIONS (CONTINUED) CROSSOVER REFUNDING In December 2009, the District issued $24,465,000 in Series 2010A general obligation refunding bonds with interest rates ranging from 3% to 5% to advance refund $24,800,000 of outstanding Series 2006 general obligations bonds maturing on February 1, 2017 through 2020 with interest rates ranging from 4.5% to 5.0%. Net proceeds from the issuance of the general obligation bonds were used to purchase U.S. government securities and those securities were deposited in an irrevocable trust with an escrow agent. The securities together with accrued interest will be sufficient to pay the principal on the bonds on February 1, 2014. As a result of the refunding, the District will reduce its total debt service requirements by $1,145,325, which results in an economic gain (difference between the present value of the debt service payments on the old and new debt) of $941,435. ADVANCE REFUNDING In February 2009, the District issued $32,945,000 in Series 2009A general obligation refunding bonds with interest rates ranging from 4.095% to 5% to advance refund $12,615,000 of outstanding Series 2001 general obligations bonds with interest rates ranging from 4.0% to 5.25% and $20,330,000 of outstanding Series 2003A general obligation bonds with an interest rate of 5.0%. Net proceeds from the issuance of the general obligation bonds were used to purchase U.S. government securities and those securities were deposited in an irrevocable trust with an escrow agent to provide debt service payments until the bonds mature on various dates through February 1, 2015. The advance refunding met the requirements of an in-substance debt defeasance and the general obligation bonds were removed from the District’s government-wide financial statements. As a result of the advance refunding, the District reduced its total debt service requirements by $845,388, which resulted in an economic gain (difference between the present value of the debt service payments on the old and new debt) of $803,688. On June 30, 2010, $33,030,000 of bonds outstanding are considered defeased. OTHER POSTEMPLOYMENT BENEFITS OBLIGATION In 2008, the District implemented GASB Statement No. 45, Accounting and Financial Reporting by Employers for Postemployment Benefits Other than Pensions. This pronouncement required the District to calculate and record a net other postemployment benefit obligation (OPEB) at June 30, 2010. The OPEB is, in general, the cumulative difference between the actuarial required contribution and the actual contributions since July 1, 2007.
46
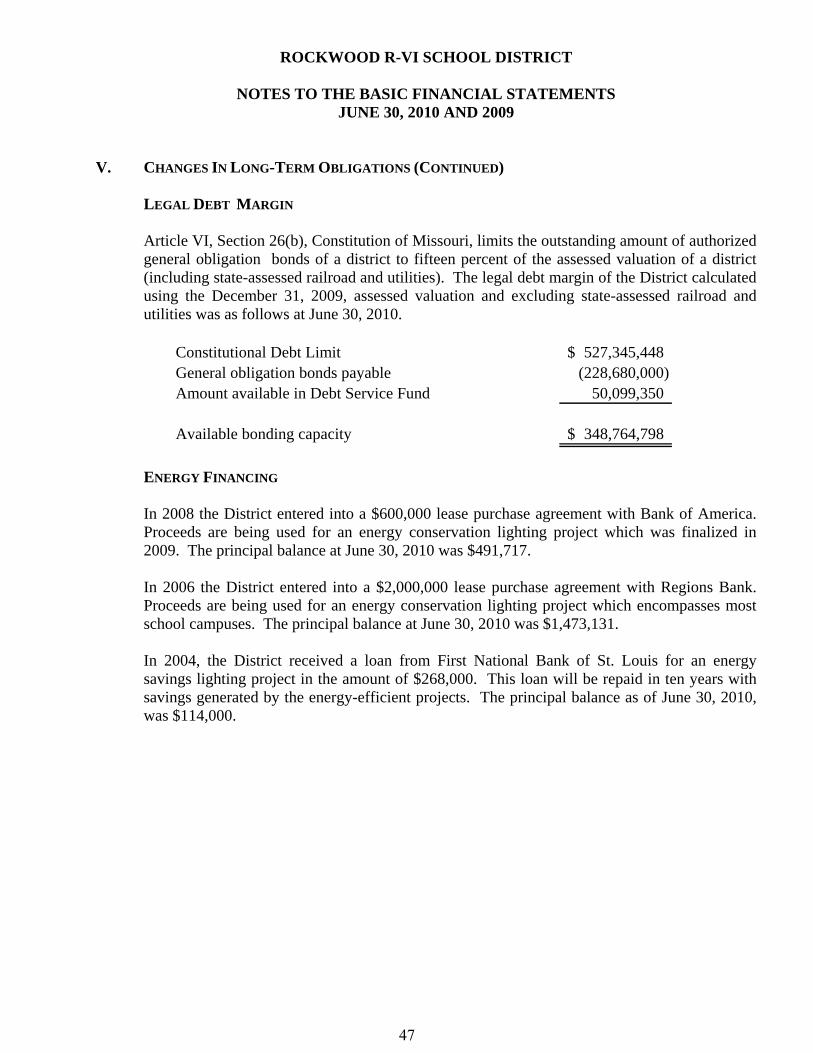
ROCKWOOD R-VI SCHOOL DISTRICT
NOTES TO THE BASIC FINANCIAL STATEMENTS JUNE 30, 2010 AND 2009
V. CHANGES IN LONG-TERM OBLIGATIONS (CONTINUED) LEGAL DEBT MARGIN Article VI, Section 26(b), Constitution of Missouri, limits the outstanding amount of authorized general obligation bonds of a district to fifteen percent of the assessed valuation of a district (including state-assessed railroad and utilities). The legal debt margin of the District calculated using the December 31, 2009, assessed valuation and excluding state-assessed railroad and utilities was as follows at June 30, 2010.
Constitutional Debt Limit 527,345,448$ General obligation bonds payable (228,680,000) Amount available in Debt Service Fund 50,099,350
Available bonding capacity 348,764,798$
ENERGY FINANCING
In 2008 the District entered into a $600,000 lease purchase agreement with Bank of America. Proceeds are being used for an energy conservation lighting project which was finalized in 2009. The principal balance at June 30, 2010 was $491,717. In 2006 the District entered into a $2,000,000 lease purchase agreement with Regions Bank. Proceeds are being used for an energy conservation lighting project which encompasses most school campuses. The principal balance at June 30, 2010 was $1,473,131. In 2004, the District received a loan from First National Bank of St. Louis for an energy savings lighting project in the amount of $268,000. This loan will be repaid in ten years with savings generated by the energy-efficient projects. The principal balance as of June 30, 2010, was $114,000.
47

ROCKWOOD R-VI SCHOOL DISTRICT
NOTES TO THE BASIC FINANCIAL STATEMENTS JUNE 30, 2010 AND 2009
V. CHANGES IN LONG-TERM OBLIGATIONS (CONTINUED) ENERGY FINANCING (CONCLUDED) The annual requirement to amortize the energy financing outstanding as of June 30, 2010, including interest payments are as follows:
Principal Interest TotalYear ending June 30,
2011 268,890$ 77,939$ 346,829$ 2012 278,897 67,933 346,830 2013 289,239 57,499 346,738 2014 299,931 46,618 346,549 2015 279,984 35,290 315,274 2016-2018 661,907 33,731 695,638
2,078,848$ 319,010$ 2,397,858$
48

ROCKWOOD R-VI SCHOOL DISTRICT
NOTES TO THE BASIC FINANCIAL STATEMENTS JUNE 30, 2010 AND 2009
V. CHANGES IN LONG-TERM OBLIGATIONS (CONCLUDED) CAPITAL LEASES
In 2002 the District formed the Rockwood School District Educational Facilities Authority to acquire, construct, improve, extend, repair, remodel, renovate, furnish and equip buildings and facilities for the District. The Facility issued $8,210,000 Leasehold Revenue Bonds Series 2002 in order to pay off the existing G.E. Capital energy note and to finance the construction of an Early Childhood Center. The Early Childhood Center is leased to the District for the amount of principal and interest due on the leasehold revenue bonds. The principal balance at June 30, 2010 was $660,000. The cost of the Early Childhood Center is $3,095,066. The following is a summary of the future minimum lease payments required under this capital lease and the present value of the net minimum lease payments as of June 30, 2010:
Year ending June 30,2011 168,714$ 2012 167,904 2013 171,741 2014 169,960 2015 62,759
Total future minimum lease payments 741,078
Less amount representing interest (81,078)
Present value of future minimumlease payments 660,000$
49

ROCKWOOD R-VI SCHOOL DISTRICT
NOTES TO THE BASIC FINANCIAL STATEMENTS JUNE 30, 2010 AND 2009
VI. PENSION PLANS
The District contributes to the Public School Retirement System of Missouri (PSRS), a cost-sharing multiple-employer defined benefit pension plan. PSRS provides retirement and disability benefits to certificated employees who work 17 or more hours per week and death benefits to members and beneficiaries. Positions covered by the PSRS are not covered by Social Security. PSRS benefit provisions are set forth in Chapter 169.010-.141 of the Missouri Revised Statutes. The statutes assign responsibility for the administration of the system to a seven-member Board of Trustees. PSRS issues a publicly available financial report that includes financial statements and required supplementary information. That report may be obtained by writing to: The Public School Retirement System of Missouri, P.O. Box 268, Jefferson City, Missouri 65102, or by calling 1-800-392-6848. PSRS members were required to contribute 13.5% of their annual covered salary and the District is required to contribute a matching amount. The contribution requirements of members and the District are established and may be amended by the PSRS Board of Trustees. The District's contributions to PSRS for the years ending June 30, 2010, 2009, and 2008 were $15,162,136, $14,093,059, and $12,533,934, respectively, equal to the required contributions.
The District also contributes to the Public Education Employee Retirement System of Missouri (PEERS), a cost-sharing multiple-employer defined benefit pension plan. PEERS provides retirement and disability benefits to employees of the District who work 20 or more hours per week and who do not contribute to the PSRS. Certain part-time certified employees may be covered by this plan. Positions covered by the PEERS are also covered by Social Security. Benefit provisions are set forth in Chapter 169.600-.715 of the Missouri Revised Statutes. The statutes assign responsibility for the administration of the system to the Board of Trustees of the PSRS. PEERS issues a publicly available financial report that includes financial statements and required supplementary information. That report may be obtained by writing to: The Public Education Employee Retirement System of Missouri, P.O. Box 268, Jefferson City, Missouri 65102 or by calling 1-800-392-6848. PEERS members were required to contribute 6.5% of their annual covered salary and the District is required to contribute a matching amount. The contribution requirements of members and the District are established and may be amended by the Board of Trustees. The District's contributions to PEERS for the years ending June 30, 2010, 2009 and 2008, were $2,091,609, $1,909,012, and $1,690,997, respectively, equal to the required contributions.
50
ROCKWOOD R-VI SCHOOL DISTRICT
NOTES TO THE BASIC FINANCIAL STATEMENTS JUNE 30, 2010 AND 2009
VII. DEFERRED COMPENSATION PLANS
The District offers its employees a choice of deferred compensation plans created in accordance with Internal Revenue Code Sections 403(b) or 457(b). These plans, available to all District employees, permit them to defer a portion of their salary until future years. The District makes these Plans available to its employees as an accommodation only. The District’s role in connection with the Plans is generally limited to processing the paperwork necessary to remit participant’s salary withholdings (deferrals) to annuity providers and custodians.
VIII. OTHER POST-EMPLOYMENT BENEFIT OBLIGATION PLAN DESCRIPTION
In addition to providing the pension benefits described above, the District (under the provisions of the Rockwood Self-insurance Plan) provides continuation of medical, dental and vision insurance coverage, including prescription drugs to employees who are eligible for normal or early retirement under a single employer plan. Retirees who elect to participate must pay the premium in effect for the current plan year or any subsequent year at the premium rates in effect at that time. Since the retirees pay the premium for each year, the District’s share of any premium cost is determined on the basis of a blended rate or implicit rate subsidy calculation. The plan is not accounted for as a trust fund since an irrevocable trust has not been established. A stand-alone financial report is not available for the plan. FUNDING POLICY The District currently pays for the implicit rate subsidy associated with these postemployment health care benefits on a pay-as-you-go basis. The District determines contribution requirements and may be amended by the District. As of June 30, 2010 no trust fund has been established for the funding of the plan’s postemployment benefit obligation, resulting in the classification of the entire liability as unfunded. The schedule of funding progress is presented as required supplementary information.
51

ROCKWOOD R-VI SCHOOL DISTRICT
NOTES TO THE BASIC FINANCIAL STATEMENTS JUNE 30, 2010 AND 2009
VIII. OTHER POST-EMPLOYMENT BENEFIT OBLIGATION (CONTINUED) ANNUAL OTHER POSTEMPLOYMENT BENEFIT COST The District’s annual OPEB cost (expense) is calculated based on the annual required contribution of the employer (ARC). The ARC represents a level of funding that, if paid on an ongoing basis, is projected to cover normal cost each year and to amortize any unfunded actuarial liabilities (or funding excess) over a period not to exceed thirty years. As of June 30, 2010 the schedule of employer contributions and net OPEB obligation is as follows:
Annual required contribution 2,240,000$ Interest on OPEB obligation 107,500 Adjustment to annual required contribution (107,500)
Annual OPEB cost (expense) 2,240,000 Contributions made 1,177,200
Increase in OPEB obligation 1,062,800 Net OPEB obligation at July 1, 2009 3,735,400
Net OPEB obligation at June 30, 2010 4,798,200$
As of June 30, 2010 the annual OPEB cost, the percentage of annual OPEB cost contributed to the plan and the net OPEB obligation were as follows:
Annual Percentage NetPlan Required Employer of ARC OPEBYear Contributions (ARC) Contribution* Contributed Obligation
2010 2,240,000$ 1,177,200$ 52.55% 1,062,800$ 2009 2,819,000 1,020,500 36.20% 1,798,500 2008 2,819,000 882,100 31.29% 1,936,900
4,798,200$
* Contribution related to implicit rate subsidy. The District implemented GASB Statement No. 45 for the year ended June 30, 2008 therefore information for prior years in not available.
52

ROCKWOOD R-VI SCHOOL DISTRICT
NOTES TO THE BASIC FINANCIAL STATEMENTS JUNE 30, 2010 AND 2009
VIII. OTHER POST-EMPLOYMENT BENEFIT OBLIGATION (CONCLUDED) FUNDED STATUS AND FUNDING PROGRESS The projection of future benefit payments for an ongoing plan involves estimates of the value of reported amounts and assumptions about the probability of occurrence of events far into the future. Examples include assumptions about future employment, mortality, and the healthcare cost trend. Amounts determined regarding the funded status of the plan and the annual required contributions of the employer are subject to continual revisions as actual results are compared with past expectations and new estimates are made about the future. The schedule of funding progress, presented as required supplementary information following the notes to the financial statements, presents multi-year trend information about whether the actuarial value of plan assets is increasing or decreasing over time relative to the actuarial accrued liabilities for benefits. ACTUARIAL METHODS AND ASSUMPTIONS Projections of benefits for financial reporting purposes are based on the substantive plan (the plan understood by the employer and the plan members) and include the types of benefits provided at the time of each valuation and the historical pattern to that point. The initial unfunded actuarial accrued liability is being amortized over 30 years. In the actuarial valuation, the liabilities were computed using the projected unit credit cost method. The actuarial assumptions utilized a 4.5% discount rate and the level annual payment approach. Because the plan is unfunded, reference to general assets, which are short-term in nature, was considered in the selection of the 4.50% rate.
IX. SELF-INSURED MEDICAL BENEFITS
The District is under a self-insured plan to provide medical and dental benefits to participating employees and their families. The participating employees contribute to the self-insurance fund through payroll deductions based on their coverage election. The District's maximum liability for each employee and in the aggregate for a one-year period is limited by insurance coverage. Transactions for the self-funded insurance are recorded in the Internal Service Fund. Liabilities of the fund are recorded when it is probable that a loss has occurred and the amount of loss can be reasonably estimated. Liabilities include an amount for claims that have been incurred but not reported (IBNR). Claim liabilities are calculated based upon recent claim settlement trends. The District considers the liability to all be payable in the current year due to the potential of significant claims to occur at any time that would deplete the insurance reserves.
53

ROCKWOOD R-VI SCHOOL DISTRICT
NOTES TO THE BASIC FINANCIAL STATEMENTS JUNE 30, 2010 AND 2009
IX. SELF INSURED MEDICAL BENEFITS (CONCLUDED) Changes in the balance of claims liabilities are as follows for the years ended June 30,:
2010 2009
Unpaid claims, beginning of year 11,647,597$ 11,157,775$ Incurred claims (including IBNRs) 21,764,982 19,884,744 Claim payments (21,568,069) (19,394,922)
Unpaid claims, end of year 11,844,510$ 11,647,597$
X. INSURANCE PROGRAM
The District, along with various other local school districts, participates in the Missouri United School Insurance Council (MUSIC), an insurance association for workers' compensation, general liability and property casualty insurance. The purpose of MUSIC is to distribute the cost of self-insurance over similar entities. MUSIC requires an annual premium payment to cover estimated claims payable and reserves for claims for each entity. Part of the assessment then goes to buy excess insurance contracts for the group as a whole. Should the contributions received by MUSIC be in excess or not be sufficient, rebates or special assessments can be made of the member Districts. There have been no significant changes in insurance coverage from the prior year.
XI. COMMITMENTS AND CONTINGENCIES
Litigation - Various claims and lawsuits are pending against the District. In the opinion of District management, the potential loss on all claims and lawsuits will not be significant to the District's financial statements taken as a whole. Grants – The District received financial assistance from federal and state agencies in the form of grants. The disbursements of funds received under these programs generally require compliance with terms and conditions specified in the grant agreements and are subject to audit by the grantor agencies. Any disallowed claims resulting from such audits could become a liability of the General Fund or other applicable funds. However, in the opinion of management, any such disallowed claims will not have a material effect on the overall financial position of the District at June 30, 2010. Construction – The District has entered into various contracts for building and grounds renovations and improvements which are included in the amount designated in the capital projects fund in the fund financial statements.
54

ROCKWOOD R-VI SCHOOL DISTRICT
NOTES TO THE BASIC FINANCIAL STATEMENTS JUNE 30, 2010 AND 2009
XII. ACCOUNTING PRONOUNCEMENT ISSUED BUT NOT YET ADOPTED
In March 2009, the Government Accounting Standards Board (GASB) issued Statement No. 54, Fund Balance Reporting and Governmental Type Fund Definitions. The objective of this Statement is to enhance the usefulness of fund balance information by providing clearer fund balance classifications that can be more consistently applied and by clarifying the existing governmental fund type definitions. This Statement establishes fund balance classifications that comprise a hierarchy based primarily on the extent to which a government is bound to observe. The requirements of this Statement will be effective for the District for the year ended June 30, 2011. The effect of this Statement on the District’s financial statements has not been determined.
55


Original FinalOriginal Final Actual to final to actual
RevenuesProperty taxes 46,233,000$ 45,413,898$ 45,742,537$ (819,102)$ 328,639$ Other local sources 37,551,137 31,815,345 30,039,903 (5,735,792) (1,775,442)Intermediate sources 874,000 910,373 954,029 36,373 43,656State sources 5,334,901 5,181,833 4,985,190 (153,068) (196,643)Federal sources 4,766,364 6,465,143 7,197,346 1,698,779 732,203Other sources 490,000 655,913.00 679,002 165,913 23,089
Total revenues 95,249,402 90,442,505 89,598,007 (4,806,897) (844,498)
ExpendituresInstruction
Elementary 2,943,117 2,538,172 2,220,771 404,945 317,401Middle 2,579,240 1,944,093 1,814,216 635,147 129,877High 2,996,170 2,720,240 2,688,512 275,930 31,728TAG/title/special 792,964 728,853 684,619 64,111 44,234Early childhood special education 2,517,469 2,458,559 2,509,492 58,910 (50,933)Student act/athl/act/spons act 7,611,072 7,504,152 6,076,770 106,920 1,427,382Other instruction 176,500 180,500 125,948 (4,000) 54,552
Total instruction 19,616,532 18,074,569 16,120,328 1,541,963 1,954,241
Support servicesAttendance 1,243,941 1,655,817 1,442,394 (411,876) 213,423Guidance 838,149 704,835 693,343 133,314 11,492Health, psych, speech and audio 2,158,095 2,146,037 2,082,557 12,058 63,480Improvement of instruction 4,810,110 4,377,980 4,294,926 432,130 83,054Professional development 543,217 314,930 276,787 228,287 38,143Media services (library) 2,534,990 2,021,834 1,989,294 513,156 32,540Board of Education services 581,150 662,914 560,785 (81,764) 102,129Executive administration 978,986 1,092,590 1,481,094 (113,604) (388,504)Building level administration 4,879,653 4,901,884 5,013,095 (22,231) (111,211)Business central services 2,224,067 2,167,697 2,047,116 56,370 120,581Operation of plant 21,090,127 22,302,440 22,474,003 (1,212,313) (171,563)Security services 790,500 756,950 649,917 33,550 107,033Pupil transportation 9,265,622 10,006,692 10,390,547 (741,070) (383,855)Food services 8,661,411 8,262,991 7,099,161 398,420 1,163,830Central office support services 2,869,229 3,089,109 2,738,878 (219,880) 350,231Adult education 364,778 386,009 348,143 (21,231) 37,866Community services 9,719,477 9,568,742 8,650,491 150,735 918,251
Debt serviceInterest and fiscal charges - 135,146 - (135,146) 135,146
Total support services 73,553,502 74,554,597 72,232,531 (1,001,095) 2,322,066Total expenditures 93,170,034 92,629,166 88,352,859 540,868 4,276,307
Excess of revenuesover expenditures 2,079,368 (2,186,661) 1,245,148 (4,266,029) 3,431,809
Other financing usesTransfers - - (771,487) - (771,487)
NET CHANGE IN FUND BALANCE 2,079,368$ (2,186,661)$ 473,661 (4,266,029)$ 2,660,322$
Fund balance at July 1, 2009 45,664,343
Fund balance at June 30, 2010 46,138,004$
positive (negative)Budgeted amounts
ROCKWOOD R-VI SCHOOL DISTRICT
SCHEDULE OF REVENUES, EXPENDITURES AND CHANGES IN
Variances--
FUND BALANCE - BUDGET AND ACTUAL - GENERAL FUND - UNAUDITEDFOR THE YEAR ENDED JUNE 30, 2010
The notes to the required supplementary information are an integral part of this schedule.
56

Original FinalOriginal Final Actual to final to actual
RevenuesProperty taxes 64,319,000$ 63,183,804$ 63,640,541$ (1,135,196)$ 456,737$ Other local sources 24,954,100 28,873,343 30,032,970 3,919,243 1,159,627 Intermediate sources 1,491,000 1,541,589 1,607,947 50,589 66,358 State sources 28,756,499 25,407,120 24,409,310 (3,349,379) (997,810) Federal sources 2,287,115 5,209,724 4,910,094 2,922,609 (299,630)
Total revenues 121,807,714 124,215,580 124,600,862 2,407,866 385,282
ExpendituresInstruction
Elementary 40,330,154 40,736,653 39,032,128 (406,499) 1,704,525 Middle 22,079,111 22,403,559 22,178,660 (324,448) 224,899 High 32,047,524 32,429,307 32,933,958 (381,783) (504,651) TAG/title/special 7,271,442 7,280,636 6,859,788 (9,194) 420,848 Early childhood special education 3,002,060 3,115,372 3,131,894 (113,312) (16,522) Student act/athl/act/spons act 2,187,035 2,200,432 2,420,281 (13,397) (219,849) Other instruction 345,000 435,376 467,306 (90,376) (31,930)
Total instruction 107,262,326 108,601,335 107,024,015 (1,339,009) 1,577,320
Support servicesAttendance 197,045 130,945 37,080 66,100 93,865 Guidance 5,586,960 5,719,000 5,458,546 (132,040) 260,454 Health, psych, speech and audio 332,059 342,097 340,897 (10,038) 1,200 Improvement of instruction 1,948,294 3,402,738 3,307,742 (1,454,444) 94,996 Professional development - 117,747 101,528 (117,747) 16,219 Media services (library) 3,295,791 3,296,280 3,517,270 (489) (220,990) Executive administration 1,566,090 1,448,376 2,257,386 117,714 (809,010) Building level administration 9,157,800 9,161,784 8,985,440 (3,984) 176,344 Security services - 9,000 438 (9,000) 8,562 Central office support services 140,514 145,256 141,501 (4,742) 3,755 Community services 32,110 34,761 35,712 (2,651) (951)
Total support services 22,256,663 23,807,984 24,183,540 (1,551,321) (375,556) Total expenditures 129,518,989 132,409,319 131,207,555 (2,890,330) 1,201,764
NET CHANGE IN FUND BALANCE (7,711,275)$ (8,193,739)$ (6,606,693) (482,464)$ 1,587,046$
Fund balance at July 1, 2009 10,732,278
Fund balance at June 30, 2010 4,125,585$
positive (negative)Budgeted amounts
ROCKWOOD R-VI SCHOOL DISTRICT
SCHEDULE OF REVENUES, EXPENDITURES AND CHANGES IN
Variances--
FUND BALANCE - BUDGET AND ACTUAL - TEACHERS' FUND - UNAUDITEDFOR THE YEAR ENDED JUNE 30, 2010
The notes to the required supplementary information are an integral part of this schedule.
57

ROCKWOOD R-VI SCHOOL DISTRICT
NOTES TO REQUIRED SUPPLEMENTARY INFORMATION JUNE 30, 2010
I. BUDGETS AND BUDGETARY ACCOUNTING
The district follows these procedures in establishing the budgetary data reflected in the financial statements: 1. In accordance with Chapter 67, RSMo, the District adopts a budget for
each major fund of the political subdivision.
2. Prior to July, the Chief Financial Officer, who serves as the budget officer, submits to the Board of Education a proposed modified accrual basis budget for the fiscal year beginning on the following July 1. The proposed budget includes estimated revenues and proposed expenditures for all funds. Budgeted expenditures cannot exceed available monies plus estimated reserves for the year.
3. A public hearing is conducted to obtain taxpayer comments. Prior to its
approval by the Board of Education, the budget document is available for public inspection.
4. In June, 2009 the budget was legally enacted by a vote of the Board of
Education.
5. Subsequent to its formal approval of the budget, the Board of Education has the authority to make necessary adjustments to the budget by formal vote of the board. Adjustments made during the year are reflected in the budget information included in the budgetary comparison schedules
6. Budgets are presented on the modified accrual basis of accounting for all
governmental funds.
58

UnfundedActuarial (UAAL)
Actuarial Actuarial Accrued PercentageActuarial Value of Accrued Liability Funded Covered of CoveredValuation Assets Liability (UAAL) Ratio Payroll Payroll
Date (a) (b) (b)-(a) (a/b) (c) ((b-a)/c)
July 1, 2009 -$ 24,150,000$ 24,150,000$ 0% 124,778,000$ 19.35%July 1, 2007 -$ 24,634,000$ 24,634,000$ 0% 124,778,000$ 19.74%
The District implemented GASB Statement No. 45 for the year ended June 30, 2008, therefore, information forprior year is not available.
ROCKWOOD R-VI SCHOOL DISTRICT
SCHEDULE OF FUNDING PROGESS - UNAUDITEDYEAR ENDED JUNE 30, 2010
59


Original FinalOriginal Final Actual to final to actual
RevenuesProperty taxes 24,030,000$ 23,156,871$ 23,329,284$ (873,129)$ 172,413$ Other local sources 2,553,600 2,284,600 2,424,385 (269,000) 139,785Intermediate sources (420,000) 457,146 483,288 877,146 26,142
Total revenues 26,163,600 25,898,617 26,236,957 (264,983) 338,340
ExpendituresDebt service
Principal retirement 19,370,000 19,370,000 19,370,000 - - Interest and fiscal charges 8,600,925 8,600,925 8,471,578 - 129,347
Total expenditures 27,970,925 27,970,925 27,841,578 - 129,347
Excess of revenues over(under) expenditures (1,807,325) (2,072,308) (1,604,621) (264,983) 467,687
Other financing sourcesRefunding bonds issued - 24,465,000 24,465,000 24,465,000 - Premium on issuance of bonds - 1,980,761 1,980,761 1,980,761 -
Total other financing sources - 26,445,761 26,445,761 26,445,761 -
NET CHANGE IN FUND BALANCE (1,807,325)$ 24,373,453$ 24,841,140 26,180,778$ 467,687$
Fund balance at July 1, 2009 25,258,210
Fund balance at June 30, 2010 50,099,350$
positive (negative)Budgeted amounts
ROCKWOOD R-VI SCHOOL DISTRICT
SCHEDULE OF REVENUES, EXPENDITURES AND CHANGES IN
Variances--
FUND BALANCE - BUDGET AND ACTUAL - DEBT SERVICE FUNDFOR THE YEAR ENDED JUNE 30, 2010
60

Original FinalOriginal Final Actual to final to actual
RevenuesProperty taxes 6,715,000$ 4,783,532$ 4,803,169$ (1,931,468)$ 19,637$ Other local sources 2,098,881 1,795,912 1,327,398 (302,969) (468,514) Intermediate sources 90,000 69,939 72,735 (20,061) 2,796 State sources 125,000 80,390 64,757 (44,610) (15,633) Federal sources 13,500 195,114 122,044 181,614 (73,070) Other sources 20,000 20,000 36,216 - 16,216
Total revenues 9,062,381 6,944,887 6,426,319 (2,117,494) (518,568)
ExpendituresInstruction
Elementary 561,010 513,883 454,665 47,127 59,218 Middle 207,407 199,058 192,604 8,349 6,454 High 407,221 371,184 355,656 36,037 15,528 TAG/title/special 257,713 301,948 300,970 (44,235) 978 Early childhood special education 6,344 9,200 9,180 (2,856) 20 Student act/athl/act/spons act 28,463 158,751 168,295 (130,288) (9,544)
Total instruction 1,468,158 1,554,024 1,481,370 (85,866) 72,654
Support servicesAttendance - 4,791 6,066 (4,791) (1,275) Guidance - - - - - Health, psych, speech and audio 28,052 28,052 23,626 - 4,426 Improvement of instruction 974,663 1,403,301 1,396,497 (428,638) 6,804 Media services (library) 183,258 207,362 192,593 (24,104) 14,769 Board of Education services 5,600 5,600 5,431 - 169 Executive administration 95,300 170,884 31,528 (75,584) 139,356 Business central services 32,963 46,224 27,971 (13,261) 18,253 Operation of plant 216,450 298,403 298,402 (81,953) 1 Security services 10,000 - - 10,000 - Food services 3,000 419,349 419,299 (416,349) 50 Central office support services 31,395 97,089 96,253 (65,694) 836 Adult education 6,800 3,800 2,768 3,000 1,032 Community services 27,600 268,516 266,439 (240,916) 2,077
Capital outlayCapital outlay 51,380,550 99,042,604 36,942,757 (47,662,054) 62,099,847
Debt servicePrincipal retirement 806,030 784,207 784,206 21,823 1 Interest and fiscal charges 117,186 139,009 445,244 (21,823) (306,235)
Total support services 53,918,847 102,919,191 40,939,080 (49,000,344) 61,980,111 Total expenditures 55,387,005 104,473,215 42,420,450 (49,086,210) 62,052,765
Excess of revenues over(under) expenditures (46,324,624) (97,528,328) (35,994,131) (51,203,704) 61,534,197
Other financing sourcesTransfers - - 771,487 - 771,487 Bond issuance 50,000,000 55,000,000 33,905,000 5,000,000 (21,095,000)
Total other financing sources (uses) 50,000,000 55,000,000 34,676,487 5,000,000 (20,323,513)
NET CHANGE IN FUND BALANCE 3,675,376$ (42,528,328)$ (1,317,644) (46,203,704)$ 41,210,684$
Fund balance at July 1, 2009 43,584,807
Fund balance at June 30, 2010 42,267,163$
positive (negative)Budgeted amounts
ROCKWOOD R-VI SCHOOL DISTRICT
SCHEDULE OF REVENUES, EXPENDITURES AND CHANGES IN
Variances--
FUND BALANCE - BUDGET AND ACTUAL - CAPITAL PROJECTS FUNDFOR THE YEAR ENDED JUNE 30, 2010
61

Original FinalOriginal Final Actual to final to actual
RevenuesProperty taxes 141,297,000$ 136,538,105$ 137,515,531$ (4,758,895)$ 977,426$ Other local sources 67,157,718 64,769,200 63,824,656 (2,388,518) (944,544) Intermediate sources 2,035,000 2,979,047 3,117,999 944,047 138,952 State sources 34,216,400 30,669,343 29,459,257 (3,547,057) (1,210,086) Federal sources 7,066,979 11,869,981 12,229,484 4,803,002 359,503 Other sources 510,000 675,913 715,218 165,913 39,305
Total revenues 252,283,097 247,501,589 246,862,145 (4,781,508) (639,444)
ExpendituresInstruction
Elementary 43,834,281 43,788,708 41,707,564 45,573 2,081,144 Middle 24,865,758 24,546,710 24,185,480 319,048 361,230 High 35,450,915 35,520,731 35,978,126 (69,816) (457,395) TAG/title/special 8,322,119 8,311,437 7,845,377 10,682 466,060 Early childhood special education 5,525,873 5,583,131 5,650,566 (57,258) (67,435) Student act/athl/act/spons act 9,826,570 9,863,335 8,665,346 (36,765) 1,197,989 Other instruction 521,500 615,876 593,254 (94,376) 22,622
Total instruction 128,347,016 128,229,928 124,625,713 117,088 3,604,215
Support servicesAttendance 1,440,986 1,791,553 1,485,540 (350,567) 306,013 Guidance 6,425,109 6,423,835 6,151,889 1,274 271,946 Health, psych, speech and audio 2,518,206 2,516,186 2,447,080 2,020 69,106 Improvement of instruction 7,733,067 9,184,019 8,999,165 (1,450,952) 184,854 Professional development 543,217 432,677 378,315 110,540 54,362 Media services (library) 6,014,039 5,525,476 5,699,157 488,563 (173,681) Board of education services 586,750 668,514 566,216 (81,764) 102,298 Executive administration 2,640,376 2,711,850 3,770,008 (71,474) (1,058,158) Building level administration 14,037,453 14,063,668 13,998,535 (26,215) 65,133 Business central services 2,257,030 2,213,921 2,075,087 43,109 138,834 Operation of plant 21,306,577 22,600,843 22,772,405 (1,294,266) (171,562) Security Services 800,500 765,950 650,355 34,550 115,595 Pupil transportation 9,265,622 10,006,692 10,390,547 (741,070) (383,855) Food services 8,664,411 8,682,340 7,518,460 (17,929) 1,163,880 Central office support services 3,041,138 3,331,454 2,976,632 (290,316) 354,822 Adult education 371,578 389,809 350,911 (18,231) 38,898 Community services 9,779,187 9,872,019 8,952,642 (92,832) 919,377
Capital outlayCapital outlay 51,380,550 99,042,604 36,942,757 (47,662,054) 62,099,847
Debt service Principal retirement 20,176,030 20,154,207 20,154,206 21,823 1 Interest and fiscal charges 8,718,111 8,875,080 8,916,822 (156,969) (41,742)
Total support services 177,699,937 229,252,697 165,196,729 (51,552,760) 64,055,968 Total expenditures 306,046,953 357,482,625 289,822,442 (51,435,672) 67,660,183
Excess of revenues over(under) expenditures (53,763,856) (109,981,036) (42,960,297) (56,217,180) 67,020,739
Other financing sources (uses)Bond issuance 50,000,000 55,000,000 33,905,000 5,000,000 (21,095,000) Refunding bonds issued - 24,465,000 24,465,000 24,465,000 - Premium on issuance of bonds - 1,980,761 1,980,761 1,980,761 -
Total other financing sources (uses) 50,000,000 81,445,761 60,350,761 31,445,761 (21,095,000)
NET CHANGE IN FUND BALANCE (3,763,856)$ (28,535,275)$ 17,390,464 (24,771,419)$ 45,925,739$
Fund balance at July 1, 2009 125,239,638
Fund balance at June 30, 2010 142,630,102$
positive (negative)Budgeted amounts
ROCKWOOD R-VI SCHOOL DISTRICT
SCHEDULE OF REVENUES, EXPENDITURES AND CHANGES IN
FOR THE YEAR ENDED JUNE 30, 2010Variances--
FUND BALANCE - BUDGET AND ACTUAL - ALL FUNDS
62

StatisticalSection

ROCKWOOD R-VI SCHOOL DISTRICT
SUMMARY OF STATISTICAL INFORMATION JUNE 30, 2010
This part of the District’s comprehensive annual financial report presents detailed information as a context for understanding what the information in the financial statements, note disclosures, and required supplementary information says about the District’s overall financial position.
Contents Page Continuing Disclosure Information 64-66
These schedules are required as part of the District’s ongoing general obligation bonded debt disclosures and give additional information to investors about the financial position of the District.
Financial Trends 67-70 These schedules contain trend information to help the reader understand how the District’s financial performance and position have changed over time.
Revenue Capacity 71-75 These schedules contain information to help the reader assess the District’s most significant local revenue source – the property tax.
Debt Capacity 76-79 These schedules present information to help the reader assess the affordability of the District’s current levels of outstanding debt and the District’s ability to issue additional debt in the future.
Demographic and Economic Information 80-81 These schedules offer demographic and economic indicators to help the reader understand the environment within which the District’s financial activities take place.
Operating Information 82-87 These schedules contain service and infrastructure data to help the reader understand how the information in the District’s financial report relates to the services the District provides and the activities it performs.
63

RO
CK
WO
OD
R-V
I SC
HO
OL
DIS
TR
ICT
LA
ST N
INE
FIS
CA
L Y
EA
RS
(acc
rual
bas
is o
f acc
ount
ing)
Net
Ass
ets
2010
2009
2008
2007
2006
2005
2004
2003
2002
Inve
sted
in c
apita
l ass
ets,
net o
f rel
ated
deb
t17
3,04
5,21
1$
19
2,55
0,32
2$
18
2,36
5,72
5$
16
4,91
8,58
1$
15
5,72
5,50
4$
13
6,74
7,78
8$
108,
612,
780
$
76,8
46,5
45$
10
0,49
1,64
1$
R
estri
cted
42,5
36,7
70
23
,698
,379
32,2
94,3
98
31,8
35,5
89
32,1
25,3
99
35,6
31,2
65
65,1
86,9
17
32,3
66,4
73
33
,317
,133
Unr
estri
cted
41,3
92,0
47
41
,708
,899
38,0
35,5
23
32,8
42,5
78
22,6
61,1
26
20,3
36,3
77
4,99
6,22
6
63,0
98,1
14
37
,003
,589
Tota
l Net
Ass
ets
256,
974,
028
$
257,
957,
600
$
252,
695,
646
$
229,
596,
748
$
210,
512,
029
$
192,
715,
430
$
17
8,79
5,92
3$
17
2,31
1,13
2$
17
0,81
2,36
3$
Sour
ce: R
ockw
ood
Scho
ol D
istric
t rec
ords
Not
e: T
he D
istric
t beg
an to
repo
rt fu
ll ac
cura
l inf
orm
atio
n w
hen
it im
plem
ente
d G
ASB
Sta
tem
ent 3
4 in
200
2. T
en y
ears
of d
ata
is no
t ava
ilabl
e.
NE
T A
SSE
TS
BY
CO
MPO
NE
NT
64

2010 2009 2008 2007 2006 2005 2004 2003 2002ExpensesGovernment Activities:
Total Instruction 134,654,265$ 129,906,095$ 121,031,515$ 112,783,245$ 107,502,035$ 102,048,072$ 98,704,013$ 96,222,384$ 92,256,709$
Support services:Attendance 1,485,541 1,510,275 1,297,090 1,090,051 934,329 751,665 1,409,289 1,418,504 844,663 Guidance 6,151,889 5,976,929 5,683,462 5,240,398 4,749,816 4,622,779 5,306,961 5,208,044 4,894,331 Health, Psych Speech and Audio 2,447,080 2,326,520 2,038,911 1,842,114 1,810,073 1,700,568 2,186,791 1,859,589 1,540,278 Improvement of Instruction 8,999,165 8,672,894 7,150,068 6,671,704 5,029,381 3,957,476 4,669,640 5,566,181 4,830,358 Professional Development 378,315 538,370 542,993 500,307 465,798 557,587 412,169 453,148 289,209 Media Services (Library) 5,699,157 5,901,264 4,998,844 4,536,168 4,694,900 4,660,440 5,058,537 4,980,878 4,895,739 Board of Education Services 902,285 518,130 756,993 821,767 346,998 701,329 417,927 2,617,347 3,048,508 Executive Administration 4,635,913 6,111,954 6,665,917 2,972,500 4,322,853 1,430,079 6,999,554 5,043,756 2,888,417 Building Level Administration 13,998,535 13,755,297 12,951,017 12,334,547 11,789,878 11,412,908 11,422,488 11,445,257 10,650,740 Business Central Service 2,075,087 2,125,317 2,207,562 2,113,600 2,090,096 2,036,123 2,012,764 2,036,528 1,962,333 Security Services 650,356 657,961 642,813 452,946 437,804 367,559 332,482 31,721 41,439 Operation of Plant 29,250,163 25,883,783 21,643,635 20,451,407 19,648,648 18,310,536 18,750,863 18,245,860 17,911,957 Pupil Transportation 10,390,547 10,129,427 9,870,745 8,903,381 8,094,718 8,221,071 6,942,942 6,204,025 5,088,046 Food Services 7,369,456 8,162,386 7,832,764 6,707,801 6,509,899 6,213,221 5,712,919 5,452,093 5,399,425 Central Office Support Services 2,976,633 2,809,541 2,574,063 2,405,317 2,140,718 2,283,053 2,389,316 2,197,724 2,413,506 Adult Education 350,910 331,702 282,909 264,244 242,466 269,569 246,836 219,040 237,191 Community Services 9,001,752 8,919,460 8,115,359 7,475,193 7,078,537 7,241,520 6,638,515 6,484,868 6,201,143 Capital Outlay - - - 1,400,945 2,014,838 - 1,569,205 4,644,930 522,526
Debt Service:Interest and Fiscal Charges 6,223,878 11,463,349 6,694,731 7,069,836 6,035,055 7,731,123 6,216,835 5,914,600 7,086,888
Total Primary Governement Expenses 247,640,927 245,700,654 222,981,391 206,037,471 195,938,840 184,516,678 187,400,046 186,246,477 173,003,406
Program RevenuesGovernment Activities:
Charges for servicesTotal Instruction 6,704,124 6,793,469 7,167,971 1,509,865 134,705 86,594 91,979 94,128 130,376 Support services:
Attendance - - 4,398 - - - - - - Guidance - - - 7,125 - - - - - Health, Psych Speech and Audio - - - 8,833 - - - - - Improvement of Instruction 423 55,200 597 97,891 - 525 45,142 3,338 4,490 Professional Development - - - - - - - - - Media Services (Library) - - - - - - - - - Board of Education Services - - - 5,028 - - - - - Executive Administration - - 4,808 - 5,188 - 5,456 6,077 5,347 Building Level Administration - - - 34,936 - - - - - Business Central Service - - 23,562 15,875 (33,942) 52,976 6,919 4,411 2,663 Security Services - - 8,279 4,228 4,362 - - - - Operation of Plant - - - - - 3,356 3,431 3,354 3,700 Pupil Transportation 185,579 173,776 16,273 - - 2,880 - - - Food Services 6,497,566 6,511,218 6,527,740 6,322,290 6,245,502 5,778,621 4,776,115 4,397,682 4,202,493 Central Office Support Services 390,617 576 10,277 18,928 19,796 30,262 44,286 41,607 92,133 Adult Education 20,708 10,886 22,601 5,100 6,575 23,992 84,095 101,748 96,073 Community Services 8,006,913 7,522,830 7,513,303 6,705,995 6,478,863 6,161,493 5,626,446 5,389,792 4,900,383
Debt Service:Interest and Fiscal Charges - - - - - - - - -
Operating Grants and Contributions 17,919,259 17,440,559 15,423,235 18,844,789 24,718,902 22,651,459 18,511,370 16,996,312 14,242,472 Capital Grants and Contributions - - - 1,371,177 286,839 596,444 620,378 593,008 2,614,469
Total Primary Government Program Revenue 39,725,189 38,508,514 36,723,044 34,952,060 37,866,790 35,388,602 29,815,617 27,631,457 26,294,599
Net (Expense)/RevenueTotal Primary Governement Net Expense (207,915,738)$ (207,192,140)$ (186,258,347)$ (171,085,411)$ (158,072,050)$ (149,128,076)$ (157,584,429)$ (158,615,019)$ (146,708,806)$
Note: The District began to report full accural information when it implemented GASB Statement 34 in 2002. Ten years of data is not available.
Source: Rockwood School District records
EXPENSES, PROGRAM REVENUES AND NET (EXPENSE)/REVENUELAST NINE FISCAL YEARS(accrual basis of accounting)
ROCKWOOD R-VI SCHOOL DISTRICT
65
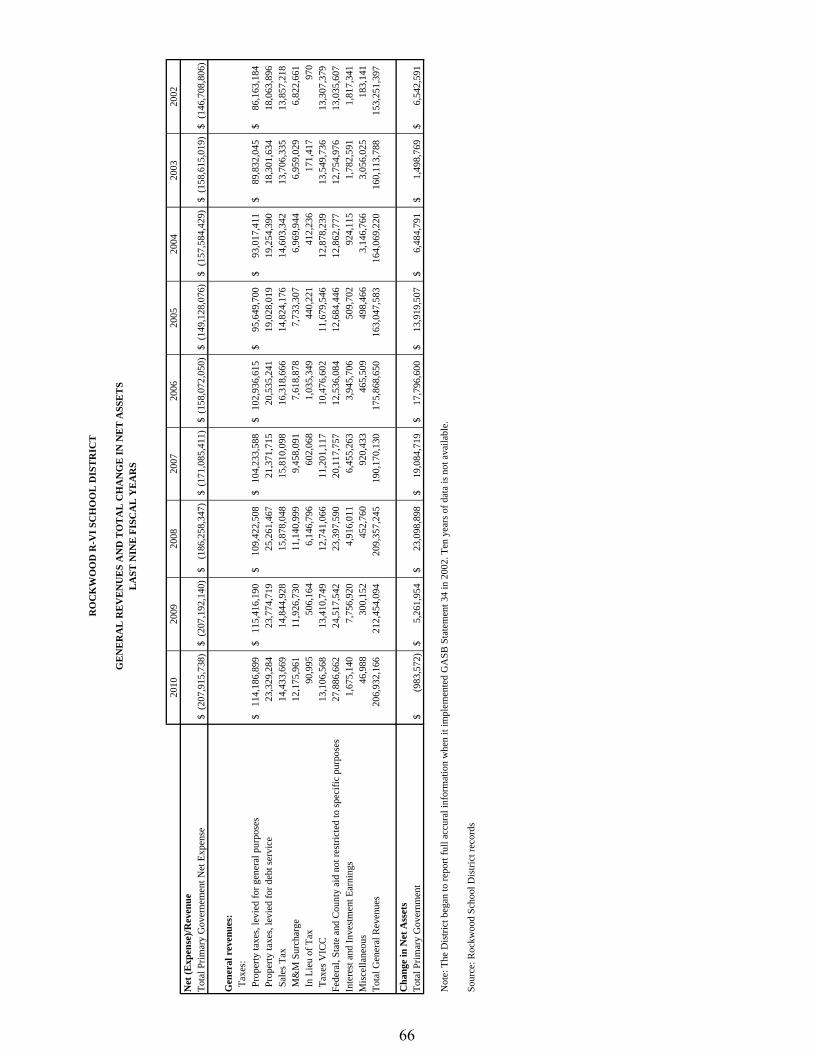
2010
2009
2008
2007
2006
2005
2004
2003
2002
Net
(Exp
ense
)/Rev
enue
Tota
l Prim
ary
Gov
erne
men
t Net
Exp
ense
(207
,915
,738
)$
(2
07,1
92,1
40)
$
(186
,258
,347
)$
(1
71,0
85,4
11)
$
(158
,072
,050
)$
(1
49,1
28,0
76)
$
(157
,584
,429
)$
(1
58,6
15,0
19)
$
(146
,708
,806
)$
Gen
eral
rev
enue
s: T
axes
: P
rope
rty ta
xes,
levi
ed fo
r gen
eral
pur
pose
s11
4,18
6,89
9$
11
5,41
6,19
0$
10
9,42
2,50
8$
104,
233,
588
$
102,
936,
615
$
95,6
49,7
00$
93,0
17,4
11$
89,8
32,0
45$
86,1
63,1
84$
Pro
perty
taxe
s, le
vied
for d
ebt s
ervi
ce23
,329
,284
23
,774
,719
25
,261
,467
21
,371
,715
20
,535
,241
19
,028
,019
19
,254
,390
18
,301
,634
18
,063
,896
S
ales
Tax
14,4
33,6
69
14,8
44,9
28
15,8
78,0
48
15,8
10,0
98
16,3
18,6
66
14,8
24,1
76
14,6
03,3
42
13,7
06,3
35
13,8
57,2
18
M&
M S
urch
arge
12,1
75,9
61
11,9
26,7
30
11,1
40,9
99
9,45
8,09
1
7,61
8,87
8
7,73
3,30
7
6,
969,
944
6,95
9,02
9
6,
822,
661
In
Lieu
of T
ax90
,995
50
6,16
4
6,14
6,79
6
60
2,06
8
1,
035,
349
44
0,22
1
412,
236
17
1,41
7
970
T
axes
VIC
C13
,106
,568
13
,410
,749
12
,741
,066
11
,201
,117
10
,476
,602
11
,679
,546
12
,878
,239
13
,549
,736
13
,307
,379
Fe
dera
l, St
ate
and
Cou
nty
aid
not r
estri
cted
to sp
ecifi
c pu
rpos
es27
,886
,662
24
,517
,542
23
,397
,590
20
,117
,757
12
,536
,084
12
,684
,446
12
,862
,777
12
,754
,976
13
,035
,607
In
tere
st a
nd In
vest
men
t Ear
ning
s1,
675,
140
7,75
6,92
0
4,
916,
011
6,45
5,26
3
3,94
5,70
6
509,
702
92
4,11
5
1,78
2,59
1
1,
817,
341
Mis
cella
neou
s46
,988
30
0,15
2
452,
760
92
0,43
3
46
5,50
9
49
8,46
6
3,14
6,76
6
3,
056,
025
183,
141
To
tal G
ener
al R
even
ues
206,
932,
166
212,
454,
094
209,
357,
245
19
0,17
0,13
0
17
5,86
8,65
0
16
3,04
7,58
3
16
4,06
9,22
0
16
0,11
3,78
8
15
3,25
1,39
7
Cha
nge
in N
et A
sset
sTo
tal P
rimar
y G
over
nmen
t(9
83,5
72)
$
5,26
1,95
4$
23
,098
,898
$
19
,084
,719
$
17
,796
,600
$
13
,919
,507
$
6,
484,
791
$
1,49
8,76
9$
6,
542,
591
$
Not
e: T
he D
istri
ct b
egan
to re
port
full
accu
ral i
nfor
mat
ion
whe
n it
impl
emen
ted
GA
SB S
tate
men
t 34
in 2
002.
Ten
yea
rs o
f dat
a is
not
ava
ilabl
e.
Sour
ce: R
ockw
ood
Scho
ol D
istri
ct re
cord
s
RO
CK
WO
OD
R-V
I SC
HO
OL
DIS
TR
ICT
GE
NE
RA
L R
EV
EN
UE
S A
ND
TO
TA
L C
HA
NG
E IN
NE
T A
SSE
TS
LA
ST N
INE
FIS
CA
L Y
EA
RS
66
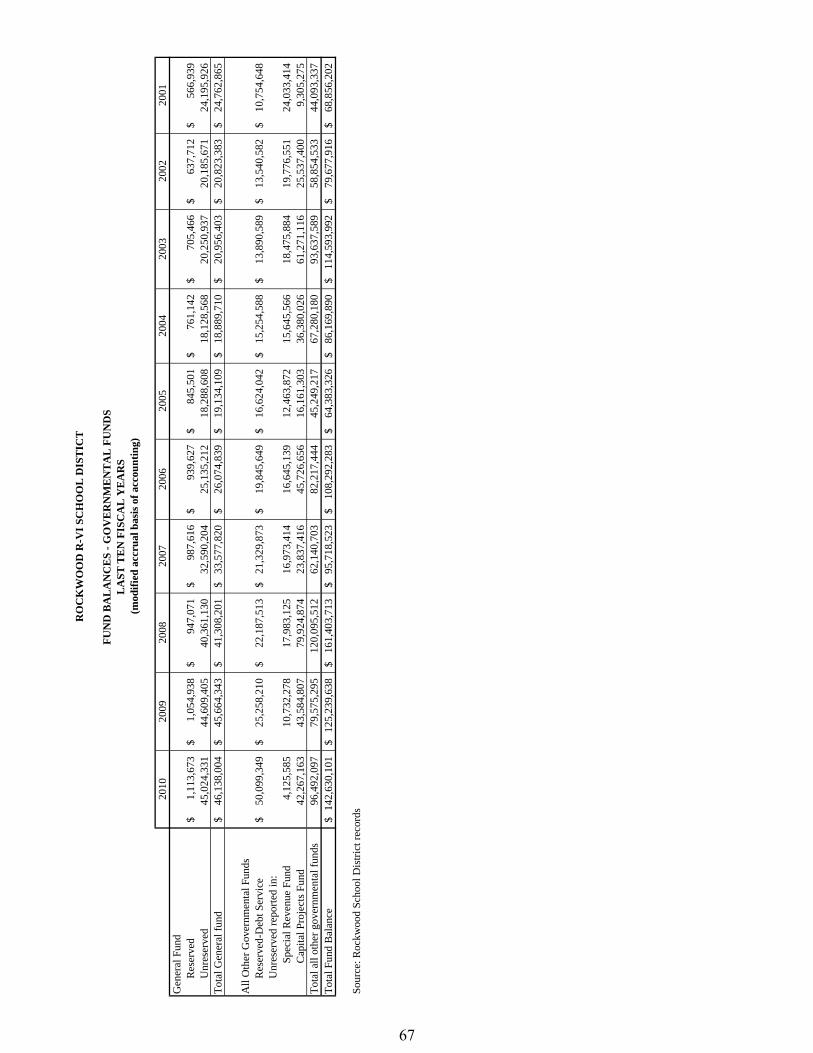
2010
2009
2008
2007
2006
2005
2004
2003
2002
2001
Gen
eral
Fun
dR
eser
ved
1,11
3,67
3$
1,05
4,93
8$
947,
071
$
987,
616
$
939,
627
$
845,
501
$
761,
142
$
705,
466
$
637,
712
$
566,
939
$
Unr
eser
ved
45,0
24,3
31
44,6
09,4
05
40,3
61,1
30
32,5
90,2
04
25
,135
,212
18
,288
,608
18,1
28,5
68
20
,250
,937
20
,185
,671
24,1
95,9
26
To
tal G
ener
al fu
nd46
,138
,004
$
45
,664
,343
$
41
,308
,201
$
33
,577
,820
$
26,0
74,8
39$
19,1
34,1
09$
18
,889
,710
$
20,9
56,4
03$
20,8
23,3
83$
24
,762
,865
$
All
Oth
er G
over
nmen
tal F
unds
Res
erve
d-D
ebt S
ervi
ce50
,099
,349
$
25
,258
,210
$
22
,187
,513
$
21
,329
,873
$
19,8
45,6
49$
16,6
24,0
42$
15
,254
,588
$
13,8
90,5
89$
13,5
40,5
82$
10
,754
,648
$
Unr
eser
ved
repo
rted
in:
Spec
ial R
even
ue F
und
4,12
5,58
5
10,7
32,2
78
17,9
83,1
25
16,9
73,4
14
16
,645
,139
12
,463
,872
15,6
45,5
66
18
,475
,884
19
,776
,551
24,0
33,4
14
C
apita
l Pro
ject
s Fun
d42
,267
,163
43
,584
,807
79
,924
,874
23
,837
,416
45,7
26,6
56
16,1
61,3
03
36
,380
,026
61,2
71,1
16
25,5
37,4
00
9,
305,
275
To
tal a
ll ot
her g
over
nmen
tal f
unds
96,4
92,0
97
79,5
75,2
95
120,
095,
512
62,1
40,7
03
82
,217
,444
45
,249
,217
67,2
80,1
80
93
,637
,589
58
,854
,533
44,0
93,3
37
To
tal F
und
Bal
ance
142,
630,
101
$
125,
239,
638
$
161,
403,
713
$
95,7
18,5
23$
10
8,29
2,28
3$
64
,383
,326
$
86,1
69,8
90$
11
4,59
3,99
2$
79
,677
,916
$
68,8
56,2
02$
Sour
ce: R
ockw
ood
Scho
ol D
istri
ct re
cord
s
RO
CK
WO
OD
R-V
I SC
HO
OL
DIS
TIC
T
FUN
D B
AL
AN
CE
S - G
OV
ER
NM
EN
TA
L F
UN
DS
LA
ST T
EN
FIS
CA
L Y
EA
RS
(mod
ified
acc
rual
bas
is o
f acc
ount
ing)
67

2010
2009
2008
2007
2006
2005
2004
2003
2002
2001
Rev
enue
sPr
oper
ty T
axes
137,
515,
532
$
142,
218,
514
$
134,
683,
975
$
125,
884,
804
$
123,
859,
355
$
117,
118,
710
$
108,
583,
060
$
108,
321,
273
$
106,
479,
670
$
96,0
06,4
37$
Oth
er L
ocal
Sou
rces
63,8
24,6
56
66,4
73,2
86
73,2
06,0
02
63,6
35,2
07
59,4
50,0
75
55,4
38,7
21
51,9
48,8
12
51,4
01,1
06
52,0
54,6
94
49,2
48,3
84
Cou
nty
Sour
ces
3,11
7,99
9
2,85
9,87
5
2,92
0,46
5
2,89
8,67
4
2,47
8,22
9
2,88
9,22
9
2,64
3,75
1
2,69
3,29
7
2,55
2,22
5
2,45
5,60
9
Stat
e So
urce
s29
,459
,257
30
,822
,501
28
,742
,867
25
,369
,682
23
,046
,005
22
,390
,044
22
,155
,510
20
,196
,162
17
,177
,335
17
,440
,498
Fe
dera
l Sou
rces
12,2
29,4
85
6,84
7,04
1
5,64
2,01
0
5,17
0,61
4
5,25
5,06
7
4,99
8,80
4
4,78
9,45
1
5,19
6,24
0
3,48
1,56
3
2,77
8,77
4
Oth
er S
ourc
es71
5,21
6
53
2,60
5
60
1,77
3
44
2,70
6
10
,572
62
,518
75
,512
32
,125
,577
44
,100
39
1,38
5
To
tal R
even
ues
246,
862,
145
$
249,
753,
822
$
245,
797,
092
$
223,
401,
687
$
214,
099,
303
$
202,
898,
026
$
190,
196,
096
$
219,
933,
655
$
181,
789,
587
$
168,
321,
087
$
Not
e: T
he D
istri
ct b
egan
to re
port
full
accu
ral i
nfor
mat
ion
whe
n it
impl
emen
ted
GA
SB S
tate
men
t 34
in 2
002.
Sour
ce: R
ockw
ood
Scho
ol D
istri
ct re
cord
s
RO
CK
WO
OD
R-V
I SC
HO
OL
DIS
TR
ICT
GO
VE
RN
ME
NT
AL
FU
ND
S R
EV
EN
UE
SL
AST
TE
N F
ISC
AL
YE
AR
S(m
odifi
ed a
ccru
al b
asis
of a
ccou
ntin
g)
68

2010
2009
2008
2007
2006
2005
2004
2003
2002
2001
EX
PEN
DIT
UR
ES
T
otal
Inst
ruct
ion
124,
625,
713
$
121,
781,
654
$
111,
130,
902
$
105,
457,
619
$
100,
167,
315
$
95,8
57,3
61$
92
,995
,762
$
89,9
43,5
96$
86
,588
,814
$
79,4
17,8
38$
S
uppo
rt S
ervi
ces
Atte
ndan
ce1,
485,
540
1,
510,
275
1,
297,
090
1,
090,
051
93
4,32
9
75
3,16
7
1,
409,
289
1,
418,
504
84
4,66
3
77
6,44
8
G
uida
nce
6,15
1,88
9
5,97
6,92
9
5,68
3,46
2
5,24
0,39
8
4,74
9,81
6
4,62
4,65
8
5,30
6,96
1
5,20
8,04
4
4,89
4,33
1
4,39
2,77
9
Hea
lth,P
sych
Spe
ech
and
Aud
io2,
447,
080
2,
326,
520
2,
038,
911
1,
842,
114
1,
810,
073
1,
715,
687
2,
186,
791
1,
859,
589
1,
540,
278
1,
512,
976
Im
prov
emen
t of I
nstru
ctio
n8,
999,
165
8,
672,
894
7,
150,
068
6,
671,
704
5,
029,
381
4,
162,
957
4,
669,
640
5,
566,
181
4,
830,
358
4,
334,
071
Pr
ofes
siona
l Dev
elop
men
t37
8,31
5
53
8,37
0
54
2,99
3
50
0,30
7
46
5,79
8
55
7,58
7
41
2,16
9
45
3,14
8
28
9,20
9
28
5,03
4
M
edia
Ser
vice
s (Li
brar
y)5,
699,
157
5,
901,
264
4,
998,
844
4,
536,
168
4,
694,
900
4,
847,
647
5,
058,
537
4,
980,
878
4,
895,
739
4,
589,
916
B
oard
of E
duca
tion
Serv
ices
566,
216
415,
442
374,
663
404,
725
346,
998
297,
693
417,
927
379,
364
297,
306
322,
899
Exec
utiv
e A
dmin
istra
tion
3,77
0,00
8
3,81
3,39
8
4,15
9,24
8
3,81
8,77
0
4,23
7,58
3
4,65
8,14
6
4,05
6,86
0
2,97
3,43
7
2,88
8,41
7
2,72
0,82
6
Bui
ldin
g Le
vel A
dmin
istra
tion
13,9
98,5
35
13
,755
,297
12,9
51,0
17
12
,334
,547
11,7
89,8
78
11
,412
,907
11,4
22,4
88
11
,445
,257
10,6
50,7
40
10
,009
,321
Bus
ines
s Cen
tral S
ervi
ces
2,07
5,08
7
2,12
5,31
7
2,20
7,56
2
2,11
3,60
0
2,09
0,09
6
2,04
1,71
9
2,01
2,76
4
2,03
6,52
8
1,96
2,33
3
2,07
1,55
4
Ope
ratio
n of
Pla
nt22
,772
,405
23,7
47,1
02
21
,113
,616
19,8
16,3
90
18
,964
,768
17,8
64,7
04
18
,042
,233
17,5
72,3
65
17
,123
,773
15,8
55,9
96
Se
curit
y Se
rvic
es65
0,35
5
65
7,96
1
64
2,81
3
45
2,94
6
43
7,80
4
36
7,55
9
33
2,48
2
31
,721
41
,439
30
,985
Pu
pil T
rans
porta
tion
10,3
90,5
47
10
,129
,427
9,87
0,74
5
8,90
3,38
1
8,09
4,71
8
8,22
1,07
1
6,94
2,94
2
6,20
4,02
5
5,08
8,04
5
4,27
6,33
0
Food
Ser
vice
s7,
518,
460
8,
087,
804
7,
851,
794
6,
762,
511
6,
430,
018
6,
135,
205
5,
769,
135
5,
482,
048
5,
317,
313
4,
732,
737
C
entra
l Offi
ce S
uppo
rt Se
rvic
es2,
976,
632
2,
765,
035
2,
532,
319
2,
381,
990
2,
238,
148
2,
293,
402
2,
383,
125
2,
197,
724
2,
413,
506
2,
003,
711
A
dult
Educ
atio
n35
0,91
1
33
1,70
2
28
2,90
9
26
4,24
4
24
2,46
6
27
1,05
7
24
6,83
6
21
9,04
0
21
2,54
2
18
2,70
0
C
omm
unity
Ser
vice
s8,
952,
642
8,
874,
678
8,
087,
570
7,
447,
404
7,
050,
747
7,
118,
191
6,
613,
292
6,
458,
473
6,
201,
143
5,
454,
422
C
apita
l Out
lay
Cap
ital O
utla
y36
,942
,757
37,7
72,8
44
23
,119
,018
23,4
02,1
29
14
,033
,093
29,9
68,8
90
27
,858
,076
17,8
62,2
32
22
,466
,563
23,1
29,2
46
Deb
t Ser
vice
Prin
cipa
l Ret
irem
ent
20,1
54,2
06
18
,063
,295
23,7
59,5
73
16
,930
,810
12,4
84,6
51
12
,295
,470
13,9
16,7
79
28
,480
,167
35,7
52,0
99
12
,251
,507
Inte
rest
and
Fisc
al C
harg
es8,
916,
822
12
,668
,900
7,96
2,18
6
7,60
3,63
9
9,02
0,12
5
9,21
9,51
3
6,56
6,11
1
5,85
0,27
2
6,50
2,29
7
6,44
9,98
7
Tota
l Sup
port
Serv
ices
165,
196,
729
168,
134,
454
146,
626,
401
132,
517,
828
115,
145,
390
128,
827,
231
125,
624,
436
126,
678,
995
134,
212,
093
105,
383,
446
TO
TAL
EXPE
ND
ITU
RES
289,
822,
442
$
289,
916,
108
$
257,
757,
303
$
237,
975,
447
$
215,
312,
705
$
224,
684,
590
$
218,
620,
198
$
216,
622,
591
$
220,
800,
908
$
184,
801,
284
$
D
ebt S
ervi
ce a
s a %
of n
on-c
apita
l exp
endi
ture
s12
.67%
13.8
8%15
.58%
12.8
5%11
.92%
12.5
8%11
.92%
21.4
1%27
.82%
13.5
4%
Sour
ce: R
ockw
ood
Scho
ol D
istric
t rec
ords
RO
CK
WO
OD
R-V
I SC
HO
OL
DIS
TR
ICT
GO
VE
RN
ME
NT
AL
FU
ND
S E
XPE
ND
ITU
RE
S A
ND
DE
BT
SE
RV
ICE
RA
TIO
LA
ST T
EN
FIS
CA
L Y
EA
RS
(mod
ified
acc
rual
bas
is of
acc
ount
ing)
69

2010
2009
2008
2007
2006
2005
2004
2003
2002
2001
Exce
ss (d
efic
ienc
y) o
f rev
enue
s ove
r exp
endi
ture
s(4
2,96
0,29
7)$
(4
0,16
2,28
5)$
(1
1,96
0,21
1)$
(1
4,57
3,76
0)$
(1
,213
,400
)$
(2
1,78
6,56
5)$
(2
8,42
4,10
2)$
3,
311,
064
$
(3
9,01
1,32
1)$
(1
6,48
0,19
7)$
Oth
er F
inan
cing
Sou
rces
(Use
s):
Tran
sfer
s-
-
-
-
-
-
-
-
-
-
C
apita
l Lea
se O
blig
atio
n-
-
60
0,00
0
2,
000,
000
-
-
-
-
-
-
B
ond
Issu
ance
33,9
05,0
00
-
74,5
00,0
00
-
44
,400
,000
-
-
31,6
00,0
00
60
,300
,000
-
Ref
undi
ng b
onds
issu
ed24
,465
,000
32,9
45,0
00
17
,165
,000
-
-
-
-
-
-
-
Paym
ent t
o re
fund
ed b
ond
escr
ow a
gent
-
(3
3,03
0,00
0)
(1
7,16
5,00
0)
-
-
-
-
-
-
-
Prem
ium
on
issu
ance
of b
onds
1,98
0,76
1
4,08
3,21
0
2,54
5,40
1
-
72
2,35
8
-
-
-
-
-
Oth
er N
oncu
rren
t/Sal
e of
Pro
perty
-
-
-
-
-
-
-
5,
013
9,
971
7,33
6
A
rea
Voc
. & C
ontra
ct E
d. S
ervi
ces
-
-
-
-
-
-
-
-
-
26
,982
N
et c
hang
e in
fund
bal
ance
s17
,390
,464
$
(36,
164,
075)
$
65,6
85,1
90$
(12,
573,
760)
$
43,9
08,9
58$
(2
1,78
6,56
5)$
(2
8,42
4,10
2)$
34
,916
,077
$
21,2
98,6
50$
(16,
445,
879)
$
Sour
ce: A
udito
r's R
epor
ts-S
tate
men
t of R
even
ues,
Expe
nditu
res a
nd C
hang
es in
Fun
d B
alan
ce
RO
CK
WO
OD
R-V
I SC
HO
OL
DIS
TIR
CT
OT
HE
R F
INA
NC
ING
SO
UR
CE
S A
ND
NE
T C
HA
NG
E IN
FU
ND
BA
LA
NC
ES
- GO
VE
RN
ME
NT
AL
FU
ND
SL
AST
TE
N F
ISC
AL
YE
AR
S(m
odifi
ed a
ccru
al b
asis
of a
ccou
ntin
g)
70

Real Property Real Property Personal Property Personal Property Total Property Total PropertyAssessed Est. Actual Assessed Est. Actual Assessed Est. Actual
Value 19% Value Value 33% Value Value Value2010 2,927,594,890$ 13,917,578,413$ 588,041,433$ 1,750,288,976$ 3,515,636,323 15,667,867,388 4.008$ 2009 3,064,096,060 15,066,764,370 623,636,362 1,519,733,552 3,687,732,422 16,586,497,922 3.923 2008 2,955,536,150 15,555,453,421 475,944,785 1,442,256,924 3,431,480,935 15,707,250,686 3.999 2007 2,304,350,860 12,128,162,421 586,267,350 1,776,567,727 2,890,618,210 13,041,889,753 4.418 2006 2,253,416,000 11,860,084,211 584,395,250 1,770,894,697 2,837,811,250 12,784,626,522 4.507 2005 1,960,277,630 10,317,250,684 574,062,700 1,739,583,939 2,534,340,330 11,327,518,849 4.633 2004 1,933,011,546 10,173,744,976 621,728,032 1,884,024,338 2,554,739,577 11,192,962,375 4.438 2003 1,801,693,610 9,482,597,947 635,542,692 1,925,886,945 2,437,236,302 10,695,129,367 4.439 2002 1,761,641,360 9,271,796,632 686,210,575 2,079,425,985 2,447,851,935 10,654,275,830 4.421 2001 1,560,072,200 8,210,906,316 599,020,698 1,815,214,236 2,159,092,898 9,398,936,585 4.525
Source: St. Louis and Jefferson County Assessor's Offices
ROCKWOOD R-VI SCHOOL DISTRICT
ASSESSED VALUE AND ACTUAL VALUE OF TAXABLE PROPERTYLAST TEN FISCAL YEARS
Property owners (both Real Estate and Personal Property) are taxed by the various taxing authorities (including the school district) in their county of residence. Tax levy rates (so much per $100 of assessed valuations) are set by the taxing authorities according the State law. Assessed valuations are set by the county in which the property resides and every other year is a reassessment year. The tax obligation is billed by the county department of revenue and paid through that department to the taxing authorities. The tax billed is simply the levy rate multiplied by the assessed valuation. Thare normally multiple taxing authority obligations included on one tax bill which is typically mailed to tax payers in November with a due date of December 31. The District receives the majority of its revenue in late December and January.
Total Tax Rate per
$100 A/V
Fiscal Year Ending
6/30
Note: On January 1 of every second year the property values are rendered for appraisal (reassessment). The appraisal process for the Rockwood School District is conducted by the St. Louis or Jefferson county Assessor's office. For Rockwood School District residential real estate is appraised at 19% of market value, commercial at 32% of value, agricultural at 12% of value and personal property at 33% of value.
The Assessor's Office submits preliminary values to the school district by June. These values are usually a realistic estimate of the ultimate certified values that come by August. The preliminary values are good estimates upon which to base the tax levies for the operating and debt service budgets. Once the certified values are received by the district, the tax rate adoption is completed prior to September and the budgeting process can be begin for the subsequent fiscal year.
71

Taxing Districts 2010 2009 2008 2007 2006 2005 2004 2003 2002 2001Rockwood School District* 4.008$ 3.923$ 3.999$ 4.418$ 4.507$ 4.633$ 4.438$ 4.439$ 4.421$ 4.525$ General Fund 1.333 1.277 1.287 1.505 1.571 1.507 1.428 1.398 1.390 1.368 Special (Teacher's) Fund 1.855 1.776 1.791 2.093 2.186 2.186 2.070 2.071 2.061 2.127 Capital Fund 0.140 0.190 0.170 0.070 - 0.190 0.190 0.220 0.220 0.280 Debt Fund 0.680 0.680 0.750 0.750 0.750 0.750 0.750 0.750 0.750 0.750
OverlappingSt. Louis County 0.523 0.558 0.558 0.558 0.580 0.580 0.580 0.580 0.580 0.580 MunicipalitiesCity of Chesterfield 0.030 0.003 0.060 0.060 0.060 0.600 0.600 0.600 0.060 0.100 City of Clarkson Valley* 0.117 0.111 0.108 0.133 0.132 0.137 0.142 0.139 0.136 0.140 City of Ellisville 0.150 0.150 0.150 0.150 0.150 0.150 0.150 0.150 0.150 0.150 City of Eureka* 0.371 0.373 0.373 0.380 0.380 0.379 0.382 0.390 0.390 0.480 City of Peerless Park N/A N/A N/A N/A N/A N/A N/A N/A N/A N/ACity of Winchester* 0.181 0.176 0.176 0.195 0.194 0.215 0.201 0.222 0.218 0.230 Fire DistrictsEureka 1.141 1.078 1.078 1.195 1.199 1.250 1.281 1.278 1.277 1.323 Fenton* 0.800 0.761 0.763 0.984 0.878 0.880 0.836 0.740 0.740 0.740 Metro West* 0.999 0.860 0.872 1.007 0.962 1.079 1.127 0.997 0.972 1.021 Monarch (Chesterfield)* 0.876 0.871 0.857 0.981 0.979 1.032 1.142 0.979 0.995 1.019 Special School District 0.938 0.918 0.908 0.824 0.870 0.870 0.870 0.870 0.870 0.870 Sewer DistrictMetropolitan Sewer District - - 0.069 0.069 0.069 0.069 0.069 0.069 0.069 0.070
Note: Years listed are calendar years * Rates are blended, other entity's rates are averaged
Source: St. Louis County Department of Revenue
ROCKWOOD R-VI SCHOOL DISTRICT
DIRECT AND OVERLAPPING PROPERTY TAXESLAST TEN FISCAL YEARS
(rate per $100 of assessed value)
72

Taxable % of Total Taxable % of TotalTaxpayer Value Rank Taxable Value Value Rank Taxable Value
Chrysler Group LLC 166,909,670$ 1 4.5% 206,608,960$ 1 11.2%THF Development LLC 57,772,540 2 1.6% N/A N/A N/AMaritz, Inc. 25,496,820 3 0.7% 29,044,800 2 1.6%Unigroup/Vanlinter Insurance/United Van Lines 11,041,030 4 0.3% 9,839,520 4 0.5%Six Flages Theme Parks, Inc. 10,859,980 5 0.3% 9,081,070 6 0.5%Laclede Gas Company 8,448,280 6 0.2% N/A N/A N/AOlde Towne Plaza LLC 8,296,970 7 0.2% N/A N/A N/AMissouri American Water Company 7,928,530 8 0.2% N/A N/A N/AAltus Corporate 44 Partners LLC 7,603,260 9 0.2% N/A N/A N/AHitzert Properties LLC 6,644,600 10 0.2% N/A N/A N/ACassens Transport N/A N/A N/A 18,587,770 3 1.0%St. Louis County Water N/A N/A N/A 9,826,600 5 0.5%The Chesterfield Development Company N/A N/A N/A 8,085,840 7 0.4%Roto-Die Company, Inc. N/A N/A N/A 7,689,000 8 0.4%Bussman N/A N/A N/A 6,496,220 9 0.4%Wildhorse Joint Venture N/A N/A N/A 5,910,890 10 0.3%
Source: St. Louis County Department of Revenue
2009 1999
ROCKWOOD R-VI SCHOOL DISTRICT
PRINCIPAL PROPERTY TAXPAYERSCURRENT YEAR AND TEN YEARS AGO
73

Total PropertyResidential Commercial Agricultural Personal Total Taxable Total Direct Est. Actual
Property Property Property Property Assessed Value Tax Rate Value2010 2,208,816,180$ 726,651,471$ 2,573,310$ 577,595,362$ 3,515,636,323$ 4.008 15,667,867,388$ 2009 2,385,119,190 800,001,080 3,285,800 496,184,642 3,684,590,712 3.923 16,584,233,761 2008 2,344,027,180 608,236,700 3,272,270 475,944,785 3,431,480,935 3.999 15,707,250,686 2007 1,888,435,220 412,674,030 3,241,610 586,267,350 2,890,618,210 4.418 13,041,889,753 2006 1,844,389,120 405,739,930 3,286,950 584,395,250 2,837,811,250 4.507 12,784,626,522 2005 1,605,212,160 351,696,410 3,369,060 574,062,700 2,534,340,330 4.633 11,327,518,849 2004 1,575,382,567 346,897,490 3,478,420 628,981,100 2,554,739,577 4.438 11,192,962,375 2003 1,453,736,350 345,221,490 2,735,770 635,542,692 2,437,236,302 4.439 10,695,129,367 2002 1,419,133,649 562,031,200 2,753,250 463,933,835 2,447,851,935 4.421 10,654,275,830 2001 1,252,927,820 466,542,320 2,723,860 436,898,898 2,159,092,898 4.525 9,398,936,585
Source: St. Louis and Jefferson County Assessor's Offices
June 30,
ROCKWOOD R-VI SCHOOL DISTRICT
ASSESSED VALUE AND ESTIMATED ACTUAL VALUE OF TAXABLE PROPERTYLAST TEN FISCAL YEARS
74

2010
2009
2008
2007
2006
2005
2004
2003
2002
2001
Ass
esse
d V
alua
tions
3,51
5,63
6,32
3
3,68
4,59
0,71
2
3,43
1,48
0,93
5
2,89
0,61
8,21
0
2,83
7,81
1,25
0
2,53
4,34
0,33
0
2,
553,
579,
110
2,
437,
236,
302
2,
447,
851,
935
2,
159,
092,
898
Ta
x R
ate
4.00
8$
3.
923
$
3.99
9$
4.
418
$
4.50
7$
4.
633
$
4.43
8$
4.
439
$
4.42
1$
4.
525
$
Taxe
s Lev
ied
for t
he F
isca
l Yea
r14
0,91
7,25
1$
14
4,55
3,86
3$
13
7,21
4,62
8$
12
7,69
8,84
1$
12
7,91
1,50
4$
11
7,41
5,98
7$
113,
327,
841
$
108,
188,
919
$
108,
219,
534
$
97,6
98,9
54$
Col
lect
ed w
ithin
Fis
cal Y
ear o
f Lev
yA
mou
nt13
6,12
3,24
1$
13
9,69
9,13
7$
13
4,68
9,87
9$
12
7,18
8,04
5$
12
3,85
6,71
0$
11
4,72
9,22
0$
109,
809,
661
$
107,
310,
385
$
105,
202,
722
$
95,1
06,1
09$
% o
f Lev
y96
.6%
96.6
%97
.4%
99.6
%96
.7%
97.7
%96
.9%
99.2
%97
.2%
97.3
%C
olle
cted
in S
ubse
quen
t Yea
rs1,
392,
291
$
2,
549,
378
$
2,
506,
456
$
6,
740,
052
$
15
,502
,674
$
2,
443,
812
$
971,
126
$
1,83
0,88
3$
3,88
7,08
0$
4,04
8,88
9$
Tota
l Col
lect
ions
to D
ate
Am
ount
137,
515,
532
$
142,
248,
515
$
137,
196,
335
$
133,
928,
097
$
139,
359,
384
$
117,
173,
032
$
11
0,78
0,78
7$
10
9,14
1,26
8$
10
9,08
9,80
2$
99
,154
,998
$
%
of L
evy
97.6
%98
.4%
100.
0%10
4.9%
108.
9%99
.8%
97.8
%10
0.9%
100.
8%10
1.5%
Not
e: B
ased
on
Fisc
al Y
ear
Sour
ce: R
ockw
ood
Scho
ol D
istri
ct re
cord
s and
St.
Loui
s Cou
nty/
Jeff
erso
n C
ount
y D
epar
tmen
t of R
even
ue
RO
CK
WO
OD
R-V
I SC
HO
OL
DIS
TR
ICT
PRO
PER
TY
TA
X L
EV
IES
AN
D C
OL
LE
CT
ION
S - S
T. L
OU
IS C
OU
NT
YL
AST
TE
N F
ISC
AL
YE
AR
S
75

2010
2009
2008
2007
2006
2005
2004
2003
2002
2001
Cap
ital l
ease
s66
0,00
0$
1,
185,
000
$
2,
305,
000
$
5,
385,
000
$
4,
425,
000
$
5,
440,
000
$
6,
425,
000
$
7,
375,
000
$
8,
210,
000
$
-
$
Gen
eral
Obl
igat
ion
Bon
ds22
8,68
0,00
0
18
9,68
0,00
0
20
6,44
9,73
3
15
4,32
4,73
3
17
0,10
4,73
2
13
7,06
6,28
5
14
8,23
8,60
0
16
1,12
3,60
0
13
1,26
3,60
0
14
4,23
8,60
0
En
ergy
Fin
anci
ng2,
078,
848
2,
338,
054
2,
596,
617
19
1,00
0
21
5,00
0
26
8,00
0
N
/AN
/AN
/AN
/AD
NR
Not
e-
-
-
110,
190
196,
999
241,
132
325,
362
427,
714
527,
468
612,
116
Tota
l Prim
ary
231,
418,
848
$
193,
203,
054
$
211,
351,
350
$
160,
010,
922
$
174,
941,
731
$
143,
015,
417
$
154,
988,
962
$
168,
926,
314
$
140,
001,
068
$
144,
850,
716
$
Estim
ated
Act
ual V
alue
of T
axab
le P
rope
rty$1
5,66
7,86
7,38
816
,584
,233
,761
$
15,7
07,2
50,6
86$
13
,904
,730
,148
$
12,7
84,6
26,5
22$
11
,327
,518
,849
$
11,1
92,9
62,3
75$
10
,695
,129
,367
$
10,6
54,2
75,8
30$
9,
398,
936,
585
$
%
of G
ener
al B
onde
d D
ebt t
o Es
timat
edA
ctua
l Val
ue O
f Tax
able
Pro
perty
1.46
%1.
14%
1.31
%1.
11%
1.33
%1.
21%
1.32
%1.
51%
1.23
%1.
53%
Pers
onal
Inco
me
(Cou
nty
data
)N
/AN
/A53
,926
,646
,000
51,3
74,9
04,0
00
49
,662
,201
,000
46,3
11,7
39,0
00
45
,517
,507
,735
43,7
92,2
41,6
75
42
,959
,831
,992
42,3
20,0
66,8
10
%
of P
erso
nal I
ncom
eN
/AN
/A0.
39%
0.31
%0.
35%
0.31
%0.
34%
0.39
%0.
33%
0.34
%Po
pula
tion(
Cou
nty
data
)N
/AN
/A99
1,83
0
99
3,51
2
99
8,70
4
1,
004,
666
1,
009,
235
1,
013,
123
1,
018,
102
1,
017,
970
Pe
r Cap
itaN
/AN
/A21
3$
16
1$
17
5$
14
2$
15
4$
16
7$
13
8$
14
2$
Not
e: N
/A-N
ot a
vaila
ble;
Info
rmat
ion
is fo
r St.
Loui
s Cou
nty;
200
9 &
201
0 de
mog
raph
ic in
form
atio
n no
t ava
ilabl
e at
tim
e of
pub
licat
ion.
Sour
ce: R
ockw
ood
Scho
ol D
istri
ct a
nd S
t. Lo
uis C
ount
y re
cord
s
RO
CK
WO
OD
R-V
I SC
HO
OL
DIS
TR
ICT
OU
TST
AN
DIN
G D
EB
T B
Y T
YPE
LA
ST T
EN
FIS
CA
L Y
EA
RS
76

General Approx. Percent Estimated ShareTaxing Body Obligation Debt of Applicable of Direct and
as of 6/30/10 Overlap Overlapping DebtDirect
Rockwood School District 228,680,000$ 100.00% 228,680,000$ Subtotal Direct Debt 228,680,000 100.00% 228,680,000
OverlappingSt. Louis County 37,990,000 15.03% 5,709,897 City of Ballwin 2,820,000 65.39% 1,843,998 City of Chesterfield 19,325,000 37.18% 7,185,035 City of Clarkson Valley - 100.00% - City of Ellisville - 100.00% - City of Eureka - 99.54% - City of Fenton - 66.55% - City of Wildwood 2,165,000 99.94% 2,163,701 City of Winchester - 19.78% - Eureka Fire PD 3,955,000 98.83% 3,908,727 Fenton FPD - 68.53% - Metro West FPD 7,780,000 81.97% 6,377,266 Monarch (Chesterfield) FPD 1,122,959 43.20% 485,118 Special School District - 10.00% - MSD - 0.00% - Subtotal Overlapping Debt 75,157,959 27,673,742 Total 303,837,959$ 256,353,742$
Source: Individual entities
ROCKWOOD R-VI SCHOOL DISTRICT
DIRECT AND OVERLAPPING GOVERNMENTAL DEBTJUNE 30, 2010
Notes: Overlapping governments are those that coincide, at least in part, with the geographic boundaries of the District. This schedule estimates the portion of the outstanding debt of those overlapping governments that is borne by the residents and businesses of the District. Percentage of overlap is calculated by the Collector of Revenue's Office as follows: For the purpose of determining the appropriate composite property tax rates, all properties are within areas defined by what are called school district sub-codes. Each sub-code accounts for what taxing districts have jurisdiction over a particular parcel, or property. Periodic ledgers comprising the total assessed values for each sub-code area are generated by County Revenue. Appropriate percentage overlap values have been culled from the appropriate ledger.
77

Ass
esse
d V
alue
$3,5
15,6
36,3
23D
ebt L
imit
(15%
of A
sses
sed
Val
ue)
527,
345,
448
Deb
t App
licab
le to
Lim
it(2
28,6
80,0
00)
Am
ount
Ava
ilabl
e in
Deb
t Ser
vice
Fun
d50
,099
,350
Lega
l Deb
t Mar
gin
$348
,764
,798
2009
2009
2008
2007
2006
2005
2004
2003
2002
2001
Deb
t Lim
itatio
n52
7,34
5,44
8$
55
2,68
8,60
7$
51
4,72
2,14
0$
43
3,59
2,73
2$
42
5,67
1,68
8$
38
0,15
1,05
0$
38
5,73
6,12
4$
37
5,86
4,08
6$
36
7,17
7,79
0$
32
3,86
3,93
5$
G
ener
al O
blig
atio
n B
onds
Pay
able
(228
,680
,000
)
(1
89,6
80,0
00)
(206
,449
,733
)
(1
54,3
24,7
32)
(170
,104
,732
)
(1
37,0
66,2
84)
(148
,263
,332
)
(1
61,1
48,3
33)
(131
,288
,600
)
(1
05,7
38,6
00)
Ava
il. D
ebt S
ervi
ce F
und
Bal
ance
50,0
99,3
50
25,2
58,2
09
22,1
87,5
13
21,3
29,8
73
19,8
45,6
50
16,6
24,0
42
(15,
705,
007)
13,7
87,3
43
13,4
32,6
80
10,2
48,2
24
Net
Deb
t App
licab
le(1
78,5
80,6
50)
(164
,421
,791
)
(1
84,2
62,2
20)
(132
,994
,859
)
(1
50,2
59,0
82)
(120
,442
,242
)
(1
63,9
68,3
39)
(147
,360
,990
)
(1
17,8
55,9
20)
(95,
490,
376)
Lega
l Deb
t Mar
gin
348,
764,
798
388,
266,
816
330,
459,
920
300,
597,
873
275,
412,
605
259,
708,
808
221,
767,
785
228,
503,
096
249,
321,
870
228,
373,
559
Lega
l Deb
t Mar
gin
as a
% o
f Deb
t Lim
it66
.14%
70.2
5%64
.20%
69.3
3%64
.70%
68.3
2%57
.49%
60.7
9%67
.90%
70.5
2%
Not
e: L
egal
Deb
t Mar
gin
is th
e ad
ditio
nal a
mou
nt o
f deb
t the
Dis
trict
may
incu
r. Le
gal D
ebt L
imit
is th
e as
sess
ed v
alua
tion
(A/V
) mul
tiplie
d by
15%
Sour
ce: R
ockw
ood
Scho
ol D
istri
ct re
cord
s
RO
CK
WO
OD
R-V
I SC
HO
OL
DIS
TR
ICT
LE
GA
L D
EB
T M
AR
GIN
INFO
RM
AT
ION
LA
ST T
EN
FIS
CA
L Y
EA
RS
Leg
al D
ebt M
argi
n C
alcu
latio
n fo
r Fi
scal
Yea
r 20
10
78

2010
2009
2008
2007
2006
2005
2004
2003
2002
2001
Rev
enue
N/A
N/A
N/A
N/A
N/A
N/A
N/A
N/A
N/A
N/A
Deb
t Ser
vice
N/A
N/A
N/A
N/A
N/A
N/A
N/A
N/A
N/A
N/A
P
rinci
pal
N/A
N/A
N/A
N/A
N/A
N/A
N/A
N/A
N/A
N/A
I
nter
est
N/A
N/A
N/A
N/A
N/A
N/A
N/A
N/A
N/A
N/A
Cov
erag
eN
/AN
/AN
/AN
/AN
/AN
/AN
/AN
/AN
/AN
/A
Not
es:
Roc
kwoo
d do
es n
ot h
ave
any
pled
ged
reve
nue
RO
CK
WO
OD
R-V
I SC
HO
OL
DIS
TR
ICT
PLE
DG
ED
-RE
VE
NU
E C
OV
ER
AG
EL
AST
TE
N F
ISC
AL
YE
AR
S
79

UnemploymentRate
2010 N/A N/A N/A 10.2%2009 992,408 N/A N/A 9.9%2008 991,830 53,926,646,000$ 54,343$ 5.9%2007 993,512 51,374,904,000 51,710 4.9%2006 998,704 49,662,201,000 49,727 4.6%2005 1,004,666 46,311,739,000 47,023 5.1%2004 1,009,235 45,517,507,735 45,101 5.4%2003 1,013,123 43,792,241,675 43,225 5.1%2002 1,018,102 42,959,831,992 42,196 4.8%2001 1,017,970 42,320,066,810 41,573 3.8%
Source: St. Louis County Department of Planning, Research and Statistics, and the USDepartment of Labor
Note: N/A-Not available; Information is for St. Louis County; 2009 (partial) & 2010 information not available at time of publication.
ROCKWOOD R-VI SCHOOL DISTRICT
DEMOGRAPHIC AND ECONOMIC STATISTICS - ST. LOUIS COUNTY ONLYLAST TEN FISCAL YEARS
Year PopulationPersonalIncome
Per Capita Personal Income
80

Employer Rank RankRockwood School District 3,402 27.6% 1 2,784 N/A N/ASix Flags 3,000 24.3% 2 N/A N/A N/AMaritz 1,865 15.1% 3 N/A N/A N/ASt. Clare Health Center 1,200 9.7% 4 N/A N/A N/AUnigroup/Vanliner/Mayflower 947 7.7% 5 N/A N/A N/APfizer 500 4.0% 6 N/A N/A N/ARotometrics 438 3.5% 7 N/A N/A N/ACooper Bussman 386 3.1% 8 N/A N/A N/AMark Andy, Inc 340 2.8% 9 N/A N/A N/AFacick CAT Company 270 2.2% 10 N/A N/A N/ATotal 12,348 100% 2,784 N/A N/A
Note: Data includes part-time employees, NA information not available
Source: Individual businesses and Rockwood records from 1999
# of Employees
# of Employees
ROCKWOOD R-VI SCHOOL DISTRICT
2010
%
2001
%
PRINCIPAL EMPLOYERSCURRENT YEAR AND NINE YEARS AGO
81

POSITION 2010 2009 2008 2007 2006 2005 2004 2003 2002 2001SUPT.DEPUTY/ASST SUPT 7 7 6 6 6 7 7 6 7 8DIRECTORS 17 17 16 15 13 9 8 8 7 7PRIN, HS AND MS 10 10 10 10 10 10 10 10 10 9ELEMENTARY PRINCIPALS 19 19 19 19 19 19 18 18 18 18COORD/HS ASST & ASSOC./ACT DIR 45 45 44 44 43 50 47 46 41 44ASST/ASSOC PRIN, ELE & MS 19 21 22 21 21 21 23 25 24 19
SUB TOTAL 117 119 117 115 112 116 113 113 107 105TEACHERS (INCLUDES COUNSELORS, LIBRARIANS AND COLLEGE ADMISSION SPEC.) ELEMENTARY 610 622 620 618 609 583 586 603 615 584MIDDLE SCHOOL 374 378 372 357 363 360 361 359 356 341HIGH SCHOOL 509 509 445 432 419 412 413 416 409 413CERT. PRESCHOOL TEA 17 16 16 16 N/A N/A N/A N/A N/A N/AEARLY CHLDHD SPEC ED TEA, SPCH 45 43 41 38 N/A N/A N/A N/A N/A N/ARESOURCE 94 90 78 76 80 93 97 85 50 37(Includes TAG, Interns and Psychometrists)
SUB TOTAL 1,649 1,658 1,572 1,537 1,471 1,448 1,457 1,463 1,430 1,375 SUPPORT STAFFSECRETARIES (ALL) 192 193 183 192 191 185 192 191 183 181SECRETARIAL ASSTS. 34 35 31 32 28 29 32 32 33 43ACCT/PR/FINANCE 13 13 13 12 12 12 12 12 11 11H.R. SPECIALIST 7 6 6 4 2 2 2 2 3 3MAIL ROOM SPEC 1 1 1 1 1 1 1 1 1 1DATA PROCESSING 10 9 8 5 5 5 4 4 4 3COMMUNICATIONS 5 7 8 7 9 10 9 9 10 11COMPUTER TECH. 26 24 23 24 22 23 18 16 16 15ROTC 4 4 4 4 4 4 4 4 4 4HOMEBOUND TEACHERS 20 32 29 16 17 14 9 N/A N/A N/ASTUDY HALL/ISS 17 16 14 19 16 20 14 16 16 14HALL MONITORS 20 17 13 13 13 15 18 12 15 13SEC RESOURCE 4 3 4 5 4 4 4 3 5 4ECSE AUTISM ANALYST 2 1 1 1 N/A N/A N/A N/A N/A N/AECSE OCCUP THERAPIST 6 6 6 5 5 5 5 4 N/A N/AECSE PHYSICAL THERAPIST 3 2 3 3 3 2 3 3 N/A N/AECSE APPLIED BEHAVIOR 4 8 7 15 20 21 31 19 N/A N/AECSE PARA I AND PARA II 48 35 34 28 33 28 22 20 N/A N/ACLSRM ASSTS/READ I/IT/ESOL 157 156 136 130 106 140 153 115 102 113LIBRARY ASSTS 5 5 5 4 4 8 8 9 11 18COMPUTER SUPPORT SPEC 5 7 9 11 13 16 18 21 24 24NURSES and NURSE SUPV. 42 42 41 39 38 41 39 35 35 34SOCIAL WORKERS/STUDENT SRVS. 15 15 11 10 10 7 7 6 5 5PREVENTION SPEC. (GRANT) 0 1 1 N/A N/A N/A N/A N/A N/A N/ACHILD NUTRITION (ALL) 221 219 217 219 217 225 215 210 203 188WAREHOUSE (ALL) 11 10 11 11 11 11 10 10 11 10PARKING LOT ATTEND 7 7 7 8 7 7 7 8 7 7ADVENTURE CLUB 182 171 171 184 168 180 196 224 170 159PARTNERS IN ED 14 14 14 13 10 16 16 15 15 17PRESCHL/PAT 84 81 81 78 74 91 89 125 122 104SPECIAL PROJECTS N/A N/A N/A N/A N/A N/A N/A N/A N/A N/ACOE 7 5 10 4 9 4 8 13 16 17
SUB TOTAL 1,166 1,145 1,102 1,097 1,052 1,126 1,146 1,139 1,022 999 FACILITIESCOORDINATORS 4 3 3 3 3 3 3 3 3 3SUPERVISORS 6 7 7 7 6 6 7 7 6 5GROUNDS MAINT 19 19 20 16 16 16 16 16 16 16GENERAL MAINT 45 45 45 41 43 43 41 40 41 40CUSTODIAL 175 170 162 158 168 176 187 190 172 171
SUB TOTAL 249 244 237 225 236 244 254 256 238 235SUB TOTAL W/O COMM. ED. 3,181 3,166 3,028 2,974 2,871 2,934 2,970 2,971 2,797 2,714
COMMUNITY EDUCATION(AEL) ADULT BASIC ED 15 15 15 14 12 15 15 15 16 13AQUATICS 130 115 117 83 84 91 76 75 N/A N/ACOMM ED SUPERVISORS 5 5 5 5 6 4 4 11 12 10COMM ED THEATRE\AV 3 3 3 3 3 2 N/A N/A N/A N/ACOMM ED (EVENINGS, SEAS. & MISC) 68 54 60 41 4 2 2 4 54 47
SUB TOTAL 221 192 200 146 109 114 97 105 82 70
GRAND TOTAL 3,402 3,358 3,228 3,120 2,980 3,048 3,067 3,076 2,879 2,784
Note: Does not include substitutes, temporaries, or seasonal employees
Source: Rockwood School District Records
ROCKWOOD R-VI SCHOOL DISTRICT
EMPLOYEE COUNTSLAST TEN FISCAL YEARS
82

2010
2009
2008
2007
2006
2005
2004
2003
2002
2001
Enro
lled
Pupi
ls (S
epte
mbe
r)22
,254
22
,160
22
,268
22
,098
21
,547
21
,798
21
,912
21
,779
21
,532
21
,496
O
pera
ting
Expe
nditu
res
205,
770,
317
$
204,
634,
962
$
188,
163,
324
$
174,
673,
222
$
164,
908,
920
$
158,
358,
112
$
156,
512,
584
$
151,
523,
139
$
145,
347,
814
$
133,
613,
431
$
Cos
t Per
Enr
olle
d Pu
pil
9,24
6$
9,23
4$
8,45
0$
7,90
4$
7,65
3$
7,26
5$
7,14
3$
6,95
7$
6,75
0$
6,21
6$
% c
hg9.
43%
16.8
3%6.
90%
5.13
%3.
50%
1.71
%2.
67%
3.07
%8.
60%
4.79
%Te
achi
ng S
taff
1,
649
1,
658
1,
572
1,
537
1,
471
1,
448
1,
457
1,
463
1,
430
1,
375
En
rolle
d Pu
pils
/Tea
cher
Rat
io13
:113
:114
:114
:115
:115
:115
:115
:115
:116
:1#
of F
ree
& R
educ
ed3,
111
2,
715
2,
778
2,
789
2,
653
2,
615
2,
644
2,
728
2,
535
2,
591
%
of E
nrol
led
Pupi
ls Q
ualif
y fo
r Fre
e/R
educ
ed14
.0%
12.3
%12
.5%
12.6
%12
.1%
12.0
%12
.1%
12.5
%11
.8%
12.1
%
Not
e: O
pera
ting
Expe
nditu
res a
re b
efor
e tra
nsfe
rs; E
nrol
led
Pup
ils in
clud
es re
side
nt, V
TS a
nd S
SD st
uden
ts a
nd d
oes n
ot in
clud
e IL
C st
uden
ts; T
each
ing
Staf
f inc
lude
s cou
selo
rs, e
xclu
des C
olle
ge A
dmin
Spe
cial
ists
Sour
ce: R
ockw
ood
Scho
ol D
istri
ct re
cord
s
RO
CK
WO
OD
R-V
I SC
HO
OL
DIS
TR
ICT
OPE
RA
TIN
G S
TA
TIS
TIC
SL
AST
TE
N F
ISC
AL
YE
AR
S
83

2010
2009
2008
2007
2006
2005
2004
2003
2002
2001
Roc
kwoo
d Sc
hool
Dis
trict
(RSD
)M
inim
um S
alar
y38
,250
$
36,6
00$
35
,000
$
34,0
00$
32
,500
$
31,5
00$
31
,000
$
30,5
00$
30
,000
$
29,2
00$
M
axim
um S
alar
y86
,325
83
,125
79
,600
76
,500
73
,603
71
,808
70
,400
68
,800
66
,500
64
,006
R
SD A
vera
ge S
alar
y54
,778
52
,272
48
,343
48
,343
48
,340
48
,280
47
,297
46
,472
44
,886
43
,552
56
,891
55
,014
53
,986
53
,278
52
,010
50
,649
49
,673
48
,294
46
,690
45
,096
45
,158
$
46,0
99$
43
,256
$
43,5
33$
42
,083
$
40,6
86$
39
,786
$
39,2
80$
38
,103
$
36,8
35$
Not
e: A
mou
nts d
o no
t inc
lude
ben
efits
such
as p
ensi
on, h
ealth
insu
ranc
e, d
isab
ility
, etc
.
Sour
ce: S
tate
wid
e an
d C
ount
y da
ta fr
om D
ESE;
Dis
trict
dat
a fr
om R
ockw
ood
Scho
ol D
istri
ct re
cord
s
Cou
nty
Ave
rage
Sal
ary
Stat
ewid
e A
vera
ge S
alar
y
RO
CK
WO
OD
R-V
I SC
HO
OL
DIS
TR
ICT
TE
AC
HE
R B
ASE
SA
LA
RIE
SL
AST
TE
N F
ISC
AL
YE
AR
S
84

Location 2010 2009 2008 2007 2006 2005 2004 2003 2002 2001ElementaryBABLER-1957
Square Feet 100,473 97,400 97,400 97,400 97,400 97,400 97,400 97,400 96,800 96,800 Capacity 639 660 660 714 714 736 736 824 824 748 Enrollment 569 595 617 621 633 639 736 679 694 676
BALLWIN-1963Square Feet 68,350 68,350 68,350 68,350 68,350 68,350 66,300 66,300 53,832 53,832 Capacity 591 591 591 652 652 696 674 696 696 572 Enrollment 524 517 490 493 491 526 482 465 528 533
BLEVINS-2001Square Feet 61,700 61,700 61,700 61,700 61,700 61,700 61,700 61,700 60,000 60,000 Capacity 570 570 570 538 538 538 538 604 604 506 Enrollment 494 510 497 468 468 482 461 442 442 418
BOWLES-1972Square Feet 53,450 53,450 53,450 53,450 53,450 53,450 52,500 52,500 52,750 52,750 Capacity 438 438 438 410 410 410 432 498 498 418 Enrollment 341 344 342 328 333 363 372 395 404 394
CHESTERFIELD-1959Square Feet 59,300 59,300 59,300 59,300 59,300 59,300 59,300 59,300 60,352 60,352 Capacity 616 616 616 582 582 604 604 714 714 572 Enrollment 512 523 543 525 533 529 605 596 563 569
ELLISVILLE-1940Square Feet 86,650 86,650 86,650 86,400 83,000 83,000 83,000 82,600 82,370 82,370 Capacity 639 639 639 670 670 670 648 824 780 726 Enrollment 575 549 594 607 632 655 585 541 526 495
EUREKA-1962Square Feet 60,560 60,560 60,560 60,560 59,300 59,300 59,300 59,300 54,068 54,068 Capacity 371 371 371 432 432 476 476 432 476 330 Enrollment 275 280 288 268 249 236 251 235 254 256
FAIRWAY-2004Square Feet 67,851 64,400 64,400 64,400 64,400 64,400 N/A N/A N/A N/ACapacity 744 598 593 560 560 560 N/A N/A N/A N/AEnrollment 539 557 560 545 543 502 N/A N/A N/A N/A
GEGGIE-1972Square Feet 62,380 56,000 56,000 53,450 53,450 53,450 52,200 52,200 51,789 51,789 Capacity 591 549 549 584 584 564 564 564 564 440 Enrollment 521 515 507 510 520 501 488 458 401 360
GREEN PINES-1988Square Feet 58,465 58,465 58,465 58,465 54,200 54,200 54,200 54,200 56,398 56,398 Capacity 549 459 549 604 604 604 604 648 648 670 Enrollment 500 507 507 514 534 561 679 664 659 677
KEHRS MILL-1992Square Feet 59,800 59,800 59,800 59,800 59,200 59,200 59,200 59,200 58,600 58,600 Capacity 658 637 637 648 648 648 648 652 652 616 Enrollment 629 626 618 583 562 588 562 592 588 564
KELLISON-1973Square Feet 60,140 60,140 60,140 60,140 58,700 58,700 54,300 54,300 56,013 56,013 Capacity 528 528 528 494 494 560 538 586 586 528 Enrollment 456 464 487 485 461 490 467 479 483 487
ROCKWOOD R-VI SCHOOL DISTRICT
SCHOOL BUILDING INFORMATIONLAST TEN FISCAL YEARS
85

Location 2010 2009 2008 2007 2006 2005 2004 2003 2002 2001Elementary ConcludedPOND-1959
Square Feet 57,300 57,300 57,300 57,300 57,300 57,300 57,300 57,300 59,081 59,081 Capacity 591 591 591 560 560 560 582 626 626 528 Enrollment 456 487 510 490 494 499 634 630 601 631
RIDGE MEADOWS-1991Square Feet 59,900 59,900 59,900 59,900 58,400 58,400 58,400 58,400 58,802 58,802 Capacity 570 570 570 604 604 604 604 692 692 660 Enrollment 524 532 535 547 492 479 595 620 620 643
STANTON-1984Square Feet 57,270 50,570 50,570 50,570 47,000 47,000 47,000 47,000 48,755 48,755 Capacity 612 505 505 454 454 432 432 476 476 374 Enrollment 518 469 461 427 406 378 367 362 334 330
UTHOFF VALLEY-1992Square Feet 60,010 60,010 60,010 60,010 57,400 57,400 57,400 57,400 57,863 57,863 Capacity 570 570 570 648 648 648 648 674 674 616 Enrollment 503 488 509 485 484 470 496 546 555 588
WESTRIDGE-1961Square Feet 66,519 61,130 61,130 61,130 56,625 56,625 54,700 54,700 50,488 50,488 Capacity 610 459 459 454 454 520 498 564 564 528 Enrollment 391 409 446 387 395 366 512 528 530 552
WILD HORSE-1999Square Feet 70,380 65,500 65,500 65,500 65,500 65,500 65,500 65,500 62,000 62,000 Capacity 746 570 570 604 604 604 604 692 692 528 Enrollment 568 543 549 514 509 490 559 567 557 517
WOERTHER-1972Square Feet 58,475 58,475 58,475 58,475 56,550 56,550 55,200 55,200 56,483 56,483 Capacity 658 658 658 648 648 626 626 684 684 682 Enrollment 555 554 586 591 580 583 603 607 639 655
Middle SchoolCRESTVIEW-1964
Square Feet 216,000 216,000 216,000 216,000 207,600 207,600 204,000 206,000 213,964 213,964 Capacity 1,442 1,442 1,442 1,442 1,442 1,350 1,350 1,350 1,350 1,256 Enrollment 1,167 1,197 1,183 1,167 1,166 1,155 1,179 1,137 1,158 1,075
LASALLE SPRINGS-1996Square Feet 115,000 115,000 115,000 115,000 115,000 115,000 115,000 115,000 114,400 114,400 Capacity 1,028 1,028 1,028 1,028 1,028 956 956 956 956 956 Enrollment 903 936 870 842 816 798 783 781 794 1,011
ROCKWOOD SOUTH-1982Square Feet 139,935 139,935 139,935 139,935 132,900 132,900 132,900 132,900 129,328 129,328 Capacity 1,192 1,192 1,192 1,192 1,192 1,013 1,013 1,013 1,013 1,013 Enrollment 954 946 945 961 998 966 970 982 1,030 1,029
ROCKWOOD VALLEY-1994Square Feet 122,300 122,300 122,300 122,300 122,300 122,300 122,300 122,300 117,547 117,547 Capacity 1,012 1,012 1,012 1,012 1,012 919 919 919 919 919 Enrollment 801 796 801 797 828 839 828 804 794 1,061
SELVIDGE-1970 \Square Feet 125,500 125,500 125,500 125,500 114,500 114,500 114,500 106,500 105,128 105,128 Capacity 1,032 1,014 1,014 1,014 1,014 844 844 844 844 844 Enrollment 692 687 714 714 682 699 726 733 740 981
WILDWOOD-2002Square Feet 125,100 125,100 125,100 125,100 125,100 125,100 125,100 125,100 125,000 N/ACapacity 1,001 1,001 1,001 1,001 1,001 900 900 900 900 N/AEnrollment 772 786 785 752 769 755 747 728 693 N/A
ROCKWOOD R-VI SCHOOL DISTRICT
SCHOOL BUILDING INFORMATION (CONTINUED)LAST TEN FISCAL YEARS
86

Location 2010 2009 2008 2007 2006 2005 2004 2003 2002 2001High SchoolEUREKA-1970
Square Feet 315,030 281,730 281,730 281,730 247,000 247,000 247,000 220,700 196,208 196,208 Capacity 1,942 1,656 1,655 1,569 1,569 1,566 1,597 1,597 1,597 1,338 Enrollment 1,882 1,756 1,771 1,649 1,567 1,487 1,371 1,380 1,310 1,273
LAFAYETTE-1992Square Feet 339,425 309,725 309,725 309,475 296,900 296,900 292,500 292,500 277,373 293,956 Capacity 2,352 2,158 2,158 2,158 2,158 2,133 2,115 2,115 2,115 2,115 Enrollment 2,065 2,011 2,063 2,005 2,052 2,009 2,052 2,028 1,994 2,038
MARQUETTE-1995Square Feet 304,060 293,440 293,440 293,440 283,500 283,500 283,500 254,000 269,616 289,408 Capacity 2,296 2,101 2,101 1,971 1,971 1,980 2,072 2,072 2,072 2,072 Enrollment 2,274 2,225 2,179 2,037 2,057 2,023 2,044 2,047 2,033 2,020
ROCKWOOD SUMMIT-1994Square Feet 289,026 262,080 262,080 259,200 259,200 259,200 259,200 259,200 262,475 250,000 Capacity 1,694 1,519 1,519 1,519 1,519 1,519 1,498 1,498 1,498 1,554 Enrollment 1,375 1,351 1,390 1,350 1,293 1,296 1,330 1,339 1,337 1,370
Other StructuresANNEX-1934
Square Feet 85,640 85,640 85,640 84,200 84,200 84,200 87,500 83,900 69,805 69,805 Capacity N/A N/A N/A N/A N/A N/A N/A N/A N/A N/AEnrollment N/A N/A N/A N/A N/A N/A N/A N/A N/A N/A
VANDOVER-1943Square Feet 20,800 20,800 20,800 20,800 20,800 20,800 20,800 20,800 22,966 22,966 Capacity N/A N/A N/A N/A N/A N/A N/A N/A N/A N/AEnrollment N/A N/A N/A N/A N/A N/A N/A N/A N/A N/A
WAREHOUSE-1980Square Feet 24,200 24,200 24,200 24,200 24,200 24,200 24,200 24,200 26,630 26,630 Capacity N/A N/A N/A N/A N/A N/A N/A N/A N/A N/AEnrollment N/A N/A N/A N/A N/A N/A N/A N/A N/A N/A
ADMINISTRATION-1973Square Feet 14,000 1,400 14,000 14,000 14,000 14,000 14,000 14,000 12,422 12,422 Capacity N/A N/A N/A N/A N/A N/A N/A N/A N/A N/AEnrollment N/A N/A N/A N/A N/A N/A N/A N/A N/A N/A
BUS GARAGE-1972Square Feet 10,180 10,180 10,180 7,300 7,300 7,300 7,300 7,300 7,962 7,962 Capacity N/A N/A N/A N/A N/A N/A N/A N/A N/A N/AEnrollment N/A N/A N/A N/A N/A N/A N/A N/A N/A N/A
LEASEDSquare Feet N/A N/A N/A N/A N/A N/A N/A N/A N/A N/ACapacity N/A N/A N/A N/A N/A N/A N/A N/A N/A N/AEnrollment N/A N/A N/A N/A N/A N/A N/A N/A N/A N/A
EUREKA WRHSSquare Feet N/A N/A N/A N/A N/A N/A N/A N/A N/A N/ACapacity N/A N/A N/A N/A N/A N/A N/A N/A N/A N/AEnrollment N/A N/A N/A N/A N/A N/A N/A N/A N/A N/A
STORAGESquare Feet N/A N/A N/A N/A N/A N/A N/A N/A N/A N/ACapacity N/A N/A N/A N/A N/A N/A N/A N/A N/A N/AEnrollment N/A N/A N/A N/A N/A N/A N/A N/A N/A N/A
CCL/SULLIVAN-1975Square Feet 45,200 45,200 45,200 45,200 45,200 45,200 45,200 44,900 39,006 39,006 Capacity N/A N/A N/A N/A N/A N/A N/A N/A N/A N/AEnrollment N/A N/A N/A N/A N/A N/A N/A N/A N/A N/A
EARLY CHILDHOOD CENTER-2004Square Feet 26,500 26,500 26,500 26,500 26,500 26,500 26,500 26,500 N/A N/ACapacity N/A N/A N/A N/A N/A N/A N/A N/A N/A N/AEnrollment N/A N/A N/A N/A N/A N/A N/A N/A N/A N/ASources: Sept. 2009 Official Enrollment, October 2009 Enrollment Projections Report, Facilities DepartmentNote: Square footage as of Fall 2009 and includes trailers
ROCKWOOD R-VI SCHOOL DISTRICT
SCHOOL BUILDING INFORMATION (CONCLUDED)LAST TEN FISCAL YEARS
87

StateC
ompliance
Section
Other Locations
Belleville, IL • Carbondale, IL • Springfield, IL • Jacksonville, IL • Cape Girardeau, MO • Milwaukee, WI
CPAs and Management Consultants
One South Memorial Drive, Ste. 950 St. Louis, MO 63102-2439 ph 314.231.6232 fax 314.231.0079 www.kebcpa.com
Independent Accountants’ Report On Management’s Assertions About Compliance with Specified Requirements of
Missouri State Laws and Regulations Board of Education Rockwood R-VI School District We have examined management’s assertions, included in its representation letter dated November 3, 2010, that the Rockwood R-VI School District complied with the requirements of Missouri Laws and Regulations regarding budgetary and disbursement procedures; attendance and pupil transportation records and other statutory requirements as listed in the Schedule of Selected Statistics. As discussed in that representation letter, management is responsible for the District's compliance with those requirements. Our responsibility is to express an opinion on management's assertions about the District's compliance based on our examination. Our examination was made in accordance with standards established by the American Institute of Certified Public Accountants and, accordingly, included examining on a test basis, evidence about the Rockwood R-VI School District’s compliance with those requirements and performing such other procedures as we considered necessary in the circumstances. We believe that our examination provides a reasonable basis for our opinion. Our opinion does not provide a legal determination on the Rockwood R-VI School District’s compliance with specified requirements. In our opinion, management’s assertions that the Rockwood R-VI School District complied with the aforementioned requirements for the year ended June 30, 2010 are fairly stated in all material respects. This report is intended solely for the information and use of the Board of Education, District management, the Missouri Department of Elementary and Secondary Education and other audit agencies and is not intended to be and should not be used by anyone other than these specified parties. St. Louis, Missouri November 3, 2010
88

ROCKWOOD R-VI SCHOOL DISTRICT
SCHEDULE OF SELECTED STATISTICS - UNAUDITED FOR THE YEAR ENDED JUNE 30, 2010
1. Calendar
The number of actual calendar hours and the number of days classes were in session and pupils were under the direction of teachers during this school year were as follows:
Kindergarten Kindergarten Kindergarten Grades A.M. P.M. Full Day 1-5
Days Hours Hours Hours Hours
Ballwin 177 531.00 531.00 - 1,119.70 Bowles 177 531.00 531.00 1,062.00 1,119.70 Chesterfield 177 531.00 531.00 - 1,119.70 Ellisville 177 531.00 531.00 1,062.00 1,119.70 Ridge Meadows 177 531.00 531.00 1,062.00 1,119.70 Eureka 177 531.00 531.00 - 1,119.70 Green Pines 177 531.00 531.00 - 1,119.70 Geggie 177 531.00 531.00 - 1,119.70 Kellison 177 531.00 531.00 - 1,119.70 Pond 177 531.00 531.00 1,062.00 1,119.70 Stanton 177 531.00 531.00 1,062.00 1,119.70 Westridge 177 531.00 531.00 - 1,119.70 Babler 177 531.00 531.00 1,062.00 1,119.70 Kehrs Mill 177 531.00 531.00 - 1,119.70 Uthoff 177 531.00 531.00 - 1,119.70 Woerther 177 531.00 531.00 - 1,119.70 Wild Horse 177 531.00 531.00 - 1,119.70 Blevins 177 531.00 531.00 - 1,119.70 Fairway 177 531.00 531.00 - 1,119.70
Days Hours Days Hours
Rockwood Valley 177 1,110.45 Eureka 177 1,094.40 Crestview 177 1,110.45 Lafayette 177 1,094.40 LaSalle Springs 177 1,110.45 Marquette 177 1,094.40 Wildwood 177 1,110.45 Rockwood Rockwood South 177 1,110.45 Summit 177 1,094.40 Morgan Selvidge 177 1,110.45
Grades 9 - 12Grades 6 - 8
89

ROCKWOOD R-VI SCHOOL DISTRICT
SCHEDULE OF SELECTED STATISTICS - UNAUDITED FOR THE YEAR ENDED JUNE 30, 2010
2. Average Daily Attendance (ADA)
Regular termFull-Time & Deseg
Part-Time In TotalKindergarten - A.M. 472.68 30.27 502.95 Kindergarten - P.M. 156.15 11.79 167.94 Kindergarten - Full Day 10.10 - 10.10 Grades 1 - 5 7,214.26 595.18 7,809.44 Grades 6 - 8 4,670.67 400.64 5,071.31 Grades 9 - 12 6,359.05 580.02 6,939.07
Subtotal regular term 18,882.91 1,617.90 20,500.81
Summer school 204.57 83.45 288.02
Total regular term plus summer school ADA 19,087.48 1,701.35 20,788.83
3. September Membership
Full-Time & DesegPart-Time In Total
September membership FTE count 20,441.00 1,754.00 22,195.00
4. Free and Reduced Priced Lunch FTE Count
Full-Time & DesegPart-Time In Total
Free 1,079.41 1,487.47 2,566.88 Reduced 410.96 134.35 545.31
Total 1,490.37 1,621.82 3,112.19
90

ROCKWOOD R-VI SCHOOL DISTRICT
SCHEDULE OF SELECTED STATISTICS - UNAUDITED FOR THE YEAR ENDED JUNE 30, 2010
5. Finance
A. As required by Section 162.401, RSMo, a bond was purchased for the district’s treasurer in the total amount of: $ 25,000
B. The district’s deposits were secured during the year as required by Sections
110.010 and 110.020, RSMo. True C. The district maintained a separate bank account for the Debt Service Fund in
accordance with Section 165.011, RSMo. True D. The district issued the following type(s) of general obligation refunding bonds in
the current year.
Current
Advanced-Defeased
Advanced-Crossover X E. The district has appropriately included all current and prior year crossover
refunding bonds in the financial statements. True F. The district has a school improvement plan. True G. The district has a professional development committee plan adopted by the board
with the professional development committee plan identifying the expenditure of seventy-five percent (75%) of one percent (1%) of the current year basic formula apportionment. True
H. The amount spent for approved professional development committee plan
activities was: $ 378,315 I. The district did not use state-funded grant monies to supplant existing salaries. True J. Salaries reported for educators in the October Core Data cycle are supported by
payroll/contract records. True K. If a $162,326 or 7% x SAT x WADA transfer was made in excess of adjusted
expenditures, the board approve a resolution to make the transfer, which identified the specific projects to be funded by the transfer and an expected expenditure date for the projects to be undertaken. N/A
L.
The district took action prior to October 31 to cause the current year’s audit to be performed. True
91

ROCKWOOD R-VI SCHOOL DISTRICT
SCHEDULE OF SELECTED STATISTICS - UNAUDITED FOR THE YEAR ENDED JUNE 30, 2010
M. The district published a summary of the prior year’s audit report within thirty days
of the receipt of the audit pursuant to Section 165.121, RSMo. True N. All above “false” answers must be supported by a finding or management letter comment.
Finding #: N/A
Management Letter Comment #: N/A
6. Transportation
A. The school transportation allowable costs substantially conform to 5 CSR 30-261.040, Allowable Costs for State Transportation Aid.
True B. The district’s school transportation ridership records are so maintained as to
accurately disclose in all material respects the average number of regular riders transported. True
C. Based on the ridership records, the average number of students (non-disabled K-12, K-12
students with disabilities and career education) transported on a regular basis (ADT) was:
Eligible ADT 10,668.50
Ineligible ADT 2,585.50 D. The district’s transportation odometer mileage records are so maintained as to
accurately disclose in all material respects the eligible and ineligible mileage for the year. True
E. Actual odometer records show the total district-operated and contracted
mileage for the year was: 1,969,906
Of this total, the eligible non-disabled and students with disabilities route miles and the ineligible non-route and disapproved miles (combined) was:
Eligible Miles 1,772,693
Ineligible Miles (Non-Route/Disapproved) 197,213
F. Number of days the district operated the school transportation system during the regular school year:
177
92

ROCKWOOD R-VI SCHOOL DISTRICT
SCHEDULE OF SELECTED STATISTICS - UNAUDITED FOR THE YEAR ENDED JUNE 30, 2010
G. All above “False” answers must be supported by a finding or management letter comment.
Finding #: N/A
Management Letter Comment #: N/A
7. Missouri School Improvement Program (MSIP)
A. The district has adequate procedures that allow for the proper recording and reporting of hours of absence. True
B. The district has adequate procedures that allow for the identification and recording
of dropouts as defined in the Core Data Manual (Exhibit 6) and the subsequent reporting of those students to the Adult Literacy Hotline and on the June Cycle of Core Data. True
C. The district has a set of adequate procedures for following up on the college and
career placement of all of the previous year’s graduates 180 days after graduation. True D. The district has a set of procedures that ensure advanced courses and career
courses (approved by the state) are properly identified and reported according to Core Data standards. True
E. All above “False” answers must be supported by a finding or management letter comment.
Finding #: N/A
Management Letter Comment #: N/A
93

FederalCom
plianceSection

Other Locations
Belleville, IL • Carbondale, IL • Springfield, IL • Jacksonville, IL • Cape Girardeau, MO • Milwaukee, WI
CPAs and Management Consultants
One South Memorial Drive, Ste. 950 St. Louis, MO 63102-2439 ph 314.231.6232 fax 314.231.0079 www.kebcpa.com
Independent Auditors’ Report on Internal Control Over Financial Reporting and on Compliance and Other
Matters Based on an Audit of Financial Statements Performed in Accordance with Government Auditing Standards
Board of Education Rockwood R-VI School District We have audited the financial statements of the governmental activities and each major fund of the Rockwood R-VI School District as of and for the year ended June 30, 2010, which collectively comprise the Rockwood R-VI School District’s basic financial statements and have issued our report thereon dated November 3, 2010. We conducted our audit in accordance with auditing standards generally accepted in the United States of America and the standards applicable to financial audits contained in Government Auditing Standards, issued by the Comptroller General of the United States. Internal Control over Financial Reporting In planning and performing our audit, we considered the Rockwood R-VI School District’s internal control over financial reporting as a basis for designing our auditing procedures for the purpose of expressing our opinions on the financial statements but not for the purpose of expressing an opinion on the effectiveness of the Rockwood R-VI School District’s internal control over financial reporting. Accordingly, we do not express an opinion on the effectiveness of the Rockwood R-VI School District’s internal control over financial reporting. A deficiency in internal control exists when the design or operation of a control does not allow management or employees, in the normal course of performing their assigned functions, to prevent, or detect and correct misstatements on a timely basis. A material weakness is a deficiency, or a combination of deficiencies, in internal control such that there is a reasonable possibility that a material misstatement of the entity’s financial statements will not be prevented, or detected and corrected on a timely basis.
Our consideration of internal control over financial reporting was for the limited purpose described in the first paragraph of this section and was not designed to identify all deficiencies in internal control over financial reporting that might be deficiencies, significant deficiencies, or material weaknesses. We did not identify any deficiencies in internal control over financial reporting that we consider to be material weaknesses, as defined above.
94

Compliance and Other Matters As part of obtaining reasonable assurance about whether the Rockwood R-VI School District’s financial statements are free of material misstatement, we performed tests of its compliance with certain provisions of laws, regulations, contracts, and grant agreements, noncompliance with which could have a direct and material effect on the determination of financial statement amounts. However, providing an opinion on compliance with those provisions was not an objective of our audit, and accordingly, we do not express such an opinion. The results of our tests disclosed no instances of noncompliance that are required to be reported under Government Auditing Standards. This report is intended solely for the information and use of the Board of Education, District management, the Missouri Department of Elementary and Secondary Education and federal awarding agencies and pass-through entities and is not intended to be and should not be used by anyone other than these specified parties. St. Louis, Missouri November 3, 2010
95

Other Locations
Belleville, IL • Carbondale, IL • Springfield, IL • Jacksonville, IL • Cape Girardeau, MO • Milwaukee, WI
CPAs and Management Consultants
One South Memorial Drive, Ste. 950 St. Louis, MO 63102-2439 ph 314.231.6232 fax 314.231.0079 www.kebcpa.com
Independent Auditors’ Report on Compliance with Requirements that Could Have a Direct and Material Effect on Each Major Program and on Internal
Control Over Compliance In Accordance With OMB Circular A-133 Board of Education Rockwood R-VI School District Compliance
We have audited Rockwood R-VI School District’s compliance with requirements described in OMB Circular A-133 Compliance Supplement that could have a direct and material effect on each of Rockwood R-VI School District’s major federal programs for the year ended June 30, 2010. Rockwood R-VI School District’s major federal programs are identified in the summary of auditors’ results section of the accompanying schedule of findings and questioned costs. Compliance with the requirements of laws, regulations, contracts and grants applicable to each of its major federal programs is the responsibility of Rockwood R-VI School District’s management. Our responsibility is to express an opinion on Rockwood R-VI School District’s compliance based on our audit. We conducted our audit of compliance in accordance with auditing standards generally accepted in the United States of America; the standards applicable to financial audits contained in Government Auditing Standards, issued by the Comptroller General of the United States; and OMB Circular A-133, Audits of States, Local Governments, and Non-Profit Organizations. Those standards and OMB Circular A-133 require that we plan and perform the audit to obtain reasonable assurance about whether noncompliance with the types of compliance requirements referred to above that could have a direct and material effect on a major federal program occurred. An audit includes examining, on a test basis, evidence about the Rockwood R-VI School District’s compliance with those requirements and performing such other procedures as we considered necessary in the circumstances. We believe that our audit provides a reasonable basis for our opinion. Our audit does not provide a legal determination on the Rockwood R-VI School District’s compliance with those requirements. In our opinion the Rockwood R-VI School District complied, in all material respects, with the requirements referred to above that could have a direct and material effect on each of its major federal programs for the year ended June 30, 2010.
96

Internal Control over Compliance The management of the Rockwood R-VI School District is responsible for establishing and maintaining effective internal control over compliance with requirements of laws, regulations, contracts and grants applicable to federal programs. In planning and performing our audit, we considered the Rockwood R-VI School District’s internal control over compliance with requirements that could have a direct and material effect on a major federal program in order to determine our auditing procedures for the purpose of expressing our opinion on compliance and to test and report on internal control over compliance in accordance with OMB Circular A-133, but not for the purpose of expressing an opinion on the effectiveness of internal control over compliance. Accordingly, we do not express an opinion on the effectiveness of the Rockwood R-VI School District’s internal control over compliance. A deficiency in internal control over compliance exists when the design or operation of a control over compliance does not allow management or employees, in the normal course of performing their assigned function, to prevent, or detect and correct, noncompliance with a type of compliance requirement of a federal program on a timely basis. A material weakness in internal control over compliance is a deficiency, or combination of deficiencies, in internal control over compliance such that there is a reasonable possibility that material noncompliance with a type of compliance requirement of a federal program will not be prevented, or detected and corrected, on a timely basis. Our consideration of internal control over compliance was for the limited purpose described in the first paragraph of this section and was not designed to identify all deficiencies in internal control over compliance that might be deficiencies, significant deficiencies, or material weaknesses. We did not identify any deficiencies in internal control over compliance that we consider to be material weaknesses, as defined above. This report is intended solely for the information and use of the Board of Education, District management, the Missouri Department of Elementary and Secondary Education and federal awarding agencies and pass-through entities and is not intended to be and should not be used by anyone other than these specified parties. St. Louis, Missouri November 3, 2010
97

Pass-Through
CFDA IdentificationFederal Grantor\Pass-through Grantor\Program Title Number Number Expenditures
U.S. Department of EducationPassed-through Missouri Department of Elementary and
Secondary Education:Basic Formula - Stabilization Funds 84.394 096-091 3,241,929$ Transportation ARRA 84.397 096-091 264,513 Title I-A, Education for Disadvantaged - ARRA 84.389 096-091 1,001,339 Title II-D, Education Technology - ARRA 84.386 096-091 21,924 Title VII-B, Mckinney - Vento Homeless Assistance - ARRA 84.387A 096-091 12,529 IDEA, Part B (619) - ARRA 84.392A 096-091 14,204 Adult Basic Education 84.002A 096-091 311,127 Early Childhood Special Education 84.027A 096-091 2,316,044 Title I - ESEA 84.010A 096-091 1,678,859 Title IV - Drug Free Schools 84.186A 096-091 41,202 Title II, Part A - ESEA 84.367A 096-091 372,327 Title II, Part D, ESEA - Enhancing Education 84.318X 096-092 430 Title III, English Language Acquisition 84.365A 096-091 50,302
9,326,729 Passed-through Special School District
Carl Perkins Grant 84.048A N/A 158,793
Received through a Direct AwardHistory Matters Grant 84.215X N/A 235,137 Mentoring Grant 84.184B N/A 207,156
442,293
Total U.S. Department of Education 9,927,815
U.S. Department of Health and Human ServicesPassed-through Missouri Department of Social Services
Strategic Prevention 93.243 096-091 68,224 Drug Free Community Grant 93.276 096-091 61,031 Medicaid 93.778 096-091 195,892 Safe Schools - ARRA 93.778 096-091 21,935
Total U.S. Department of Health and Human Services 347,082
U.S. Department of Homeland SecurityPassed-through Missouri Department of Elementary and
Secondary Education:R.O.T.C. 97.078 096-091 113,669
U.S. Department of AgriculturePassed-through Missouri Department of Elementary and
Secondary Education:School Breakfast Program 10.553 096-091 367,879 National School Lunch Program 10.555 096-091 1,469,173 Food distribution 10.550 096-091 509,303
Total U.S. Department of Agriculture 2,346,355
TOTAL EXPENDITURES OF FEDERAL AWARDS 12,734,921$
ROCKWOOD R-VI SCHOOL DISTRICT
SCHEDULE OF EXPENDITURES OF FEDERAL AWARDSFOR THE YEAR ENDED JUNE 30, 2010
The accompanying notes are an integral part of this statement. 98

ROCKWOOD R-VI SCHOOL DISTRICT
NOTES TO THE SCHEDULE OF EXPENDITURES OF FEDERAL AWARDS FOR THE YEAR ENDED JUNE 30, 2010
NOTE 1 – BASIS OF PRESENTATION
Rockwood R-VI School District prepares its Schedule of Expenditures of Federal Awards on the modified accrual basis of accounting. Under the modified accrual basis of accounting, revenue is recorded when susceptible to accrual, i.e., both measurable and available. Available means collectible within the current period or soon enough thereafter to be used to pay liabilities of the current period. Expenditures are recorded when the related liabilities are incurred.
NOTE 2 – NONCASH PROGRAMS
Rockwood R-VI School District received the following noncash assistance during the year ended June 30, 2010: Food Distribution Program (Commodities) 10.550 $509,303 The commodities received are also included in the federal expenditures presented in the schedule and are valued using prices provided by the United States Department of Agriculture.
99

ROCKWOOD R-VI SCHOOL DISTRICT
SCHEDULE OF FINDINGS AND QUESTIONED COSTS FOR THE YEAR ENDED JUNE 30, 2010
SECTION I - SUMMARY OF AUDITORS’ RESULTS
Financial Statements
Type of report issued on financial statements: Unqualified opinion Internal control over financial reporting:
Material weaknesses identified? No
Significant deficiency identified that are not considered to be material weaknesses? No
Noncompliance material to the financial statements noted? No
Federal Awards
Internal control over major programs:
Material weakness identified? No
Significant deficiency identified that are not considered to be material weaknesses? No
Type of auditors’ report issued on compliance for major programs: Unqualified opinion
Any audit findings disclosed that are required to be reported under section .510(a) of OMB Circular A-133? No The programs tested as a major program are as follows:
CFDA Number(s) Name of Program or Cluster
84.010A and 84.389 Title I Cluster84.394 and 84.397 State Fiscal Stabilization Fund
84.027A and 84.392 Early Childhood Cluster
The dollar threshold used to distinguish between type A and type B programs: $382,048
Auditee qualified as a low-risk auditee? Yes
100

ROCKWOOD R-VI SCHOOL DISTRICT
SCHEDULE OF FINDINGS AND QUESTIONED COSTS FOR THE YEAR ENDED JUNE 30, 2010
SECTION II - FINANCIAL STATEMENT FINDINGS
There were no findings which are required to be reported in accordance with Generally Accepted Governmental Auditing Standards.
SECTION III – FEDERAL AWARD FINDINGS AND QUESTIONED COSTS
There were no findings and questioned costs related to Federal awards. SECTION IV - SCHEDULE OF PRIOR YEAR FINDINGS AND QUESTIONED COSTS There were no prior year findings and questioned costs related to Federal Awards.
101