new hma products and trends for · pdf filefatigue resistance mixture for bridge deck...
TRANSCRIPT

New HMA Products and Trends for NJDOT

Bridge Deck Water-Proof Wearing Course (BDWC)

Water Proof Wearing Course Mix
• Mix designed to provide a thin, rut and fatigue resistance mixture for bridge deck overlays
• Can be placed on bridge deck without vibratory rollers
• Asphalt mixture must also be “water proof” or low permeability
• “Sealing older bridge structures”

Some of Our Problems: I-80 Bridge Deck
“ When we paved over the deck with a membrane the contractor did not expose the open joint for a few weeks. During that time it rained extensively. The 12.5H76 material is very porous. When the contractor exposed the open joint a river of water lay on the membrane and ran down the sloped deck along the open joint. Since the joint area was always wet the asphaltic joint was not able to be constructed with optimum results. They are now popping out. When we placed the asphaltic joint immediately after paving completed this condition was minimal.”

I-80 Bridge Deck
• Problems attributed to:– Potentially high air voids in 12H76 mix
placed on bridge deck• No vibration on during rolling• Coarse, stiff mix with most likely low asphalt

I-80 Lab Testing• Cores taken from Bridge Deck and brought to
Rutgers for forensics and permeability testing• Air Voids:
– Core #2 = 10.4%– Core #4 = 13.7%– Core #5 = 13.7%– Core #6 = 14.2%
• Only 2 cores in good enough shape for permeability testing (#2 and #5)

Falling Head Permeability Test
• Most commonly used for asphalt
• Can test 4 or 6” diameter cores
• Rubber membrane forced on side of samples (15 psi) to prevent side leakage

Permeability Results of Bridge Deck Cores
• Core #2 = 0.477 ft/day– Tested with Membrane still
attached!• Core #5 = 3.539 ft/day
Membrane

What to Do?• Need an HMA mix that:
– Can be placed thin at low air voids without vibration on bridge decks
– Be rut resistant while being crack resistant– Produced and placed using typical
construction practices– Should be able to be “fixed” or “corrected”
when aging occurs under normal maintenance procedures
– This problem not unique to NJDOT Bridge Decks!

GWB Mixture Evaluation• PANYNJ looking to improve performance
of GWB bridge deck overlays– Rutting not an issue (new material should not
be worse though!)– Longitudinal cracking in truck lane
• Flexing in steel orthotropic decks under loading causing high tensile straining in HMA
• High tensile stresses immediately outside truck tires
– Ease of construction – always must keep in mind!

Asphalt Pavement Analyzer
AASHTO TP 63- 100 lb wheel load; 100 psi hose pressure- Tested at 64oC for 8,000 loading cycles

Fatigue Evaluation (Vertical)
• Flexural Beam Fatigue Device, AASHTO T-321
• Tests mix’s ability to withstand repeated bending which causes fatigue failure
• Data = number of loading cycles to failure (loss of stiffness)
• Run at 2000 μ-strain and 10 Hz (high deflection, fast moving vehicle)
εt
εc
δ
εt
εc
δ
HMA
Aggregate Base
Subgrade

• Water-proof wearing course mixture was found to be “impermeable” –could not get water to flow through sample
Samples cored from 6-inch diameter gyratory sample
Permeability Testing of Water-Proof Wearing Course

Water Proof Wearing Course –Design Acceptance
1. Perform volumetric design and NJDOT verification
2. Supply Rutgers University loose mix for performance testing
3. Produce mix through plant and pave test strip off site
4. Sample during production and supply Rutgers University loose mix for performance testing

Why Do Performance Testing?• AE Stone’s 1st
(Right) and 2nd (Left) test strip
• Right lane flushed and did not set like as anticipated
• Performance testing showed poor results
• Why? Eventually found out AE Stone did not switch over proper value on tank – used wrong asphalt binder!

1st vs 2nd Test Strip Material64oC Test Temp.; 100psi Hose Pressure; 100 lb Load Load
0.01.02.03.04.05.06.07.08.09.0
10.011.012.013.014.015.0
0 1,000 2,000 3,000 4,000 5,000 6,000 7,000 8,000
Number of Loading Cycles
APA
Rut
ting
(mm
) APA Rutting @ 8,000 Cycles
AE Stone BDWC - 1st Test Strip = 13.2 mmAE Stone BDWC - 2nd Test Strip = 2.3mm
BDWC Criteria < 3mm

1st vs 2nd Test Strip Material
100
1,000
10,000
1.0E+01 1.0E+02 1.0E+03 1.0E+04 1.0E+05 1.0E+06Loading Cycles (n)
Flex
ural
Stif
fnes
s (M
Pa)
1st Test Strip = 1,865
2nd Test Strip = 250,081
Flexural Beam Fatigue Criteria > 100,000 Cycles

1st Project – Rt 87 Absecon Inlet Bridge
• A.E. Stone produced first BDWC mix
• 1900 tons placed and compacted to a 2-inch thickness in 2 days
• Core densities all between 2 to 4% air voids

Rt 87 Absecon Inlet Bridge –2008 NAPA Quality in
Construction Award Winner!for Non-Typical Asphalt Project

Warm Mix Asphalt

What is Warm Mix Asphalt

Different WMA Types• Viscosity Reducers – These additives significantly
reduce the viscosity of the binder at mixing and compaction temperatures. – Sasobit and Asphaltan B
• Foamed Asphalt – Produced by introducing moisture into the asphalt binder in the mix plant. – Zeolite, Low Energy Asphalt (LEA), ASTEC Double Barrel
Green• Emulsions - Use of an emulsion as the asphalt binder.
– Evotherm• Surfactants – Chemical product that increases the
lubrication between aggregate particles during movement – Evotherm 3G, Rediset

Features & Benefits of WMA
• Better Workability of the Asphalt Mix Allows– Longer Haul Times– Extension of the Paving Season – Easier Handling of Stiff Mixes such as
Polymer Modified, Rubber Asphalt Binder and high RAP Content.

Features & Benefits of WMA
• Reduction in Production Temperatures Reduces Emissions– Reduce Blue Smoke complaints– Reduce Recordable Emissions
• Reduction in Production Temperatures Reduces Energy Consumption– Depending on mix it may be possible to
save 10 to 20% on energy costs.• Lower fuel consumption; lower electricity at
pumps and conveyors due to reduce viscosity

Evotherm Test Section on I78 in NJ
Control Mix: 12M76 with 25% RAP

I-78 Warm Mix

Recorded Emissions –Ohio Test Trials

Recorded Emissions –Ohio Test Trials
Paver Emissions – NIOSH Method 5024 for Total Particulates (TP)
Evotherm WMA: 77% of Conventional HMAAspha-Min WMA: 67% of Conventional HMA
Sasobit WMA: 74% of Conventional HMA

NJDOT Warm Mix Asphalt
• Being used under “Pilot Project” conditions – still experimental
• Three field projects conducted to date
• Looking at 2 to 3 more this season (asphalt rubber applications)

High Performance Thin Overlay
HPTO

High Performance Thin-Overlay (HPTO)
• Focused Applications– Preventative Maintenance – NJDOT
• Placed after signs of initial surface distress • Also potential use of “Shim” course on PCC
prior to Wearing Course– Pavement Overlay – Locals/Municipalities
• Place immediately on surface of pavements showing signs of surface distress with or without milling
– Low severity wheelpath alligator cracking (base issues)
– Surface cracking with minimal rutting

Potential Areas of Application
Low Severity Wheelpath
Low to Mod. LongitudinalCracking
Low to Mod. TransverseCracking
Minimal Rutting – low to moderatesurface cracking
No Full Depth Cracking!

Direct Overlay – No Milling
HPTOHPTO
ExistingExistingBaseBase
ExistingExistingSurfaceSurface

High Performance Thin-Overlay
• Binder– Polymer-modified binder
• PG76-22 (NJDOT Spec)– Minimum Asphalt Content = 6%
• Performance Specification– Utilize the Asphalt Pavement Analyzer
(AASHTO TP 63) for stability (rutting) check• No check for fatigue – low air voids and higher
asphalt content will control• Must supply for mix design verification and
control (1st Lot and every other Lot after)

Typical Permeability Values
3.15E-031.22E-03
2.67E-05
7.70E-07
1.0E-09
1.0E-08
1.0E-07
1.0E-06
1.0E-05
1.0E-04
1.0E-03
1.0E-02
1.0E-01
1.0E+00
0.00 0.50 1.00 1.50 2.00 2.50 3.00 3.50 4.00 4.50
Perm
eabi
lity
(cm
/sec
)
12H76(3.0% AV)
12H76(5.0% AV)
12H76(7.0% AV)
Typical Superpave Dense Graded Asphalt Mixes
HPTO(3.9% AV)

Surface (Skid) Friction, SN40Material Type Skid NumberHPTO (New) 53
12.5mm SP (New) 51.612.5mm (4 Yrs) 54.3
19mm SP (4 Yrs) 55.719mm SP (5 Yrs) 47.7

HPTO Test Section –Paulsboro, NJ

NJDOT HPTO
• Still in experimental stage• 2 projects using it as surface course
– Evaluating general performance over next year or two
• Currently being used as better performing Leveling course

Quiet Pavements

Roadway Noise Generators• Major noise generators:
– engine,– exhaust system,– aerodynamic noise, and – tire/pavement interface
noise.
• For > 20 to 30 mph, pavement/tire noise dominates.
(Billera, et al., TRR 1601)

Approximate “Cross-over Speeds”
Vehicle Type Cruising Speed Accelerating Speed
Cars (< 1995) 18 to 25 mph 25 to 31 mphCars (> 1995) 10 to 15 mph 18 to 28 mph
Trucks (< 1995) 25 to 31 mph 31 to 35 mphTrucks (> 1995) 18 to 25 mph 28 to 31 mph
Pavement surface only effective when vehicle speedsare greater than “Cross-over Speeds”

To Put Noise in Perspective• 1 dB(A) means a 12% decrease in
noise
• 3 dB(A) means a 40% decrease in noise
• 6 dB(A) means a 200% decrease in noise
As a rule of thumb, the human hear can start to differentiate between two sound levels when they
are different by more than 2 to 3 dB(A).

Three Main Mechanisms of Tire-Related Noise Generation
Driving Direction
(1)Tread Impact
(2)Air Pumping Resonance
(3)Tread
“Snap-out”
Different tire tread patterns will develop different noise levels- Typically, the more aggressive, the more tire/pavement noise -

Close Proximity (CPX)
Meets ISO 11819-2
Microphones

Sound-Intensity

Traditional Test Measurements -Wayside
• Statistical pass-by method– Based on measuring the noise level from a
minimum of 180 single-vehicle passbys– Can compare pavements at different locations– Microphones generally set at 50 ft from roadway
• Controlled pass-by – Same as statistical pass-by but with limited
number of vehicles
• Time-averaged method– Noise-level is measured continuously over a time
period– Traffic counts & metrological data is needed

Wayside Measurements –Site Layout
Difficult and Time Consuming to Achieve Proper Conditions

Pavement Noise Study(FHWA-NJDOT-2003-021)
• Measure Pavement/Tire Related Sound– Used Close Proximity Method
• Evaluate the effect of traffic speed• Total of 42 pavement surfaces tested
– HMA – OGFC, SMA, Novachip, Micro-surfacing Superpave (12.5 & 19mm), SHRP Sections
– PCC – transverse tining, diamond grinding, no finish

NEW JERSEYNEW JERSEYTEST SITESTEST SITES

DGA Pavement Surfaces
97.1
98.5 98.6 98.999.3 99.5 99.6 99.7
100.1
94
95
96
97
98
99
100
101
102
103
104
Rt 78 E(12.5mmSuperp.)
0 yrs
Rt 22 W(12.5mmSuperp.)
4 yrs
NJDOTFABC
30 yrs
Rt 78 E(19mm
Superp.)5 yrs
Rt 78 W(12.5mmSuperp.)
4 yrs
NJDOT I-4 with
30% RAP10 yrs
NJDOT I-4 Mix
10 yrs
NJDOT I-4 with
10% RAP10 yrs
Rt 22 W(19mm
Superp.)4 yrs
Soun
d Pr
essu
re (d
B(A
))Vehicle Speed = 60 mph
Noise increases with size and HMA aggregate

OGFC Surfaces
96.296.8 97.0 97.1
98.1 98.398.6 98.6
94
95
96
97
98
99
100
101
102
103
104
Rt 195West
(SHRPSection)
Rt 9 N MP60-61 (10 yrs)
Rt. 78 WMP 30 (1 yrs)
Rt 24 EMP 7.7-8.7
(4 yrs)
Rt 24 WMP 8.6-7.6
(4 yrs)
Rt 195 EMP 6-6.4(2 yrs)
Rt 195 EMP 3-4
(2 yrs)
Rt 195 EMP 5-5.5(2 yrs)
Soun
d Pr
essu
re (d
B(A
))
Crumb RubberModified
(Rouse)(McDonald)
NJDOT MOGFC-1 NJDOT MOGFC-2
Vehicle Speed = 60 mph
Finer OGFC with asphalt rubber quieter

SMA (Stone Mastic Asphalt) Surfaces
97.3 97.597.9 98.0 98.0 98.1
98.9
100.9 101.1
94
95
96
97
98
99
100
101
102
103
104
I-78 E(MP 30.8)
I-78 E(MP
31.25)
I-78 E(MP
31.96)
I-78 E(MP
30.87)
I-78 E(MP
30.55)
I-78 E(MP
28.81)
I-78 E(MP
28.58)
US-1 N(MP 11.3-11.8) 10
yrs
US-1 S(MP11.8-11.3) 10
yrs
Soun
d Pr
essu
re (d
B(A
))Vehicle Speed = 60 mph
9.5 mm Nominal Aggregate Size
12.5 mm Nominal Aggregate Size
Noise increases with size and HMA aggregate

“Thin-Lift” Surface Treatments
98.2 98.398.8
99.199.4
94
95
96
97
98
99
100
101
102
103
104
Novachip (I-195W) 3 yrs
Micro-Surface(NJ 29N) 0 yrs
Micro-Surface(US 202S) 0 yrs
Micro-Surface(NJ 70E) 3 yrs
Novachip (I-78W)8 yrs
Soun
d Pr
essu
re (d
B(A
))Vehicle Speed = 60 mph
Noise increases as the pavement ages and stiffens

Concrete Surface Treatments
98.198.7
101.2 101.2101.9
102.9103.3 103.3
104.2 104.4
105.6
106.7
94
95
96
97
98
99
100
101
102
103
104
105
106
107
108
Rt 29 S(Tunnel)
Rt 287 S(MP 50-
49)
Rt 78 E(MP
24.48)
Rt 29 N(MP 0)
Rt 78 E(MP
25.39)
Rt 280 W(MP 10.3-
9.3)
Rt 287 S(MP 56.4-
56)
Rt 78 E(MP
25.03)
Rt 29 N(MP 4.5-
5.4)
Rt 78 E(MP 26.7)
Rt 78 E(MP 0.9-
2.0)
Rt 78 W(MP 2.0-
0.9)
Soun
d Pr
essu
re (d
B(A
))
Diamond GroundTransverse Saw CutBroom FinishTransverse Tining
Vehicle Speed = 60 mph

10 Quietest Pavement Surfaces Tested
96.2
96.897.0 97.1 97.1
97.998.1 98.1 98.2 98.3 98.3
94.0
94.5
95.0
95.5
96.0
96.5
97.0
97.5
98.0
98.5
99.0
99.5
100.0
CR-OGFC
CR-OGFC
MOGFC-1
MOGFC-1 12
.5mm SP
9.5mm SMA
MOGFC-1
PCC D.G
.Nova
chip®
Micro-S
urface
MOGFC-2
Soun
d Pr
essu
re (d
B(A
))
Vehicle Speed = 60 mph
Crumb Rubber HMA

Quietest to Loudest Comparison
96.296.8 97.0 97.1 97.1
103.3104.2 104.4
105.6106.7
949596979899
100101102103104105106107108109
CR-OGFC
CR-OGFC
MOGFC-1 MOGFC-1 12.5mmSP
I-78 E(MP
25.03)
NJ 29 N(MP 4.5-
5.4)
I-78 E(MP 26.7)
I-78 E(MP 0.9-
2.0)
I-78 W(MP 2.0-
0.9)
Noi
se P
ress
ure,
dB
(A)
PCC
OGFC
Average Difference8 db(A)

NJ Compared to Average
• Based on 10 states (244 pavements)
Noise (dB(A))Pavement Type NJ Average
DGA 99.1 97OGFC (Coarse) 97.6 97OGFC (Fine) N.A. 93SMA (9.5mm) 97.9 96SMA (12.5mm) 101 96

Main Conclusions from NJ Research
• Different pavement surfaces generate various levels of noise– Finer graded HMA generated less noise– HMA lower than typical PCC (D.G. PCC similar)– Over 10 dB(A) difference from highest to lowest
• OGFC vs Transverse Tined PCC
• Generated tire/pavement noise correlated to ride quality– Influenced by same macro-texture properties
• Tire/pavement noise may influence a “users” perception of a “smooth ride” (based on RQI results – IRI was similar)
• A SMOOTHER RIDE MEANS LESS NOISE!

Designing a Quiet Pavement• Based on numerous field studies in Europe
and United States – An open graded mix (OGFC) with more that 15%
air voids and 90 to 100% passing the 3/8” sieve• Not suitable to use everywhere
– Other fine graded HMA can also be utilized, but not as effective (9.5mm SMA, 9.5mm HMA)
– European Concept (experimental) - using a two layer concept
• ¾ inches of a fine graded OGFC• 1 ½ inches of a coarse graded OGFC

OGFC for Quiet Pavement - Restrictions
• OGFC should only be used on pavements with “free-flowing” traffic– No frequent stopping, intersections, sharp curves– Fast moving traffic “self cleans” OGFC– Winter maintenance may be issue – recommend
using rock salt pre-wetted with calcium chloride• Typically uses twice application of Dense Graded HMA
• For areas of potential frequent stopping, better to use a fine-graded HMA or SMA– Will not clog– Easier for winter maintenance– Remember, only beneficial if traffic > 35 mph

Composite Pavement Issues
(HMA overlay PCC)

What? The Problem• Superpave didn’t
address cracking in general, especially reflective cracking
• 45% of NJDOT pavements are composite (HMA over PCC), with another 10% PCC to be overlaid!
• Conventional HMA overlays not addressing need
• Why is Reflective Cracking a Problem?

Reflective Cracking -Mode 1
• Mode 1 Vertical Shear – Poor load transfer– Weak base or voids present– Load Associated Problem

“Poor load transfer…”
Mode 1: Vertical Shear Stress

“Poor load transfer…”
Mode 1: Vertical Shear Stress

“causes shear stresses in the overlay.”
Mode 1: Vertical Shear Stress

“causes shear stresses in the overlay.”
Mode 1: Vertical Shear Stress

“causes shear stresses in the overlay.”
Mode 1: Vertical Shear Stress

Mode 1: Vertical Shear Stress

Mode 1: Vertical Shear Stress

“Over many repeated loads…”
Mode 1: Vertical Shear Stress

Mode 1: Vertical Shear Stress
“Over many repeated loads…”

“reflection cracks develop.”
Mode 1: Vertical Shear Stress

Mode 1: Vertical Shear Stress
“reflection cracks develop.”

Mode 1: Vertical Shear Stress
“reflection cracks develop.”

Mode 1: Vertical Shear Stress
“reflection cracks develop.”

Mode 1: Vertical Shear Stress
“reflection cracks develop.”

Reflective Cracking -Mode 2
• Tensile stress at bottom of AC layer – Poor support– Weak base– Load Associated Problem

“Traffic loads at the joint…”
Mode 2: Horizontal Tensile Stress due to load

“Traffic loads at the joint…”
Mode 2: Horizontal Tensile Stress due to load

“cause tensile stresses at the bottom of the overlay.”
Mode 2: Horizontal Tensile Stress due to load

“cause tensile stresses at the bottom of the overlay.”
Mode 2: Horizontal Tensile Stress due to load

Mode 2: Horizontal Tensile Stress due to load
“cause tensile stresses at the bottom of the overlay.”

“Over many repeated loads…”
Mode 2: Horizontal Tensile Stress due to load

Mode 2: Horizontal Tensile Stress due to load
“Over many repeated loads…”

Mode 2: Horizontal Tensile Stress due to load
“Over many repeated loads…”

Mode 2: Horizontal Tensile Stress due to load
“reflection cracks develop.”

Mode 2: Horizontal Tensile Stress due to load
“reflection cracks develop.”

Mode 2: Horizontal Tensile Stress due to load
“reflection cracks develop.”

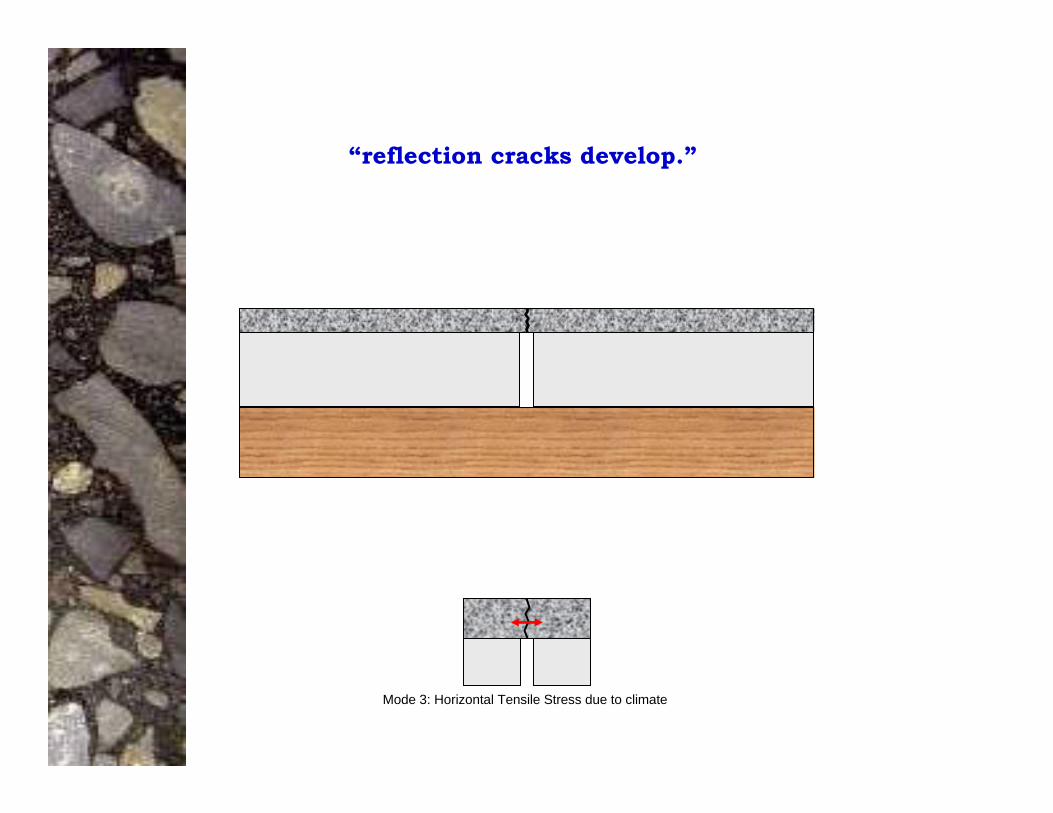
Reflective Cracking -Mode 3
• Horizontal Tensile Stress – Thermally Induced stresses– Magnitude depends on Slab length or
Crack spacing

“Slab shrinkage under cooling temperature…”
Mode 3: Horizontal Tensile Stress due to climate

Mode 3: Horizontal Tensile Stress due to climate
“Slab shrinkage under cooling temperature…”

Mode 3: Horizontal Tensile Stress due to climate
“Slab shrinkage under cooling temperature…”

Mode 3: Horizontal Tensile Stress due to climate
“causes tensile stresses in the overlay.”

Mode 3: Horizontal Tensile Stress due to climate
“causes tensile stresses in the overlay.”

Mode 3: Horizontal Tensile Stress due to climate

Mode 3: Horizontal Tensile Stress due to climate

Mode 3: Horizontal Tensile Stress due to climate

“Over many cycles…”
Mode 3: Horizontal Tensile Stress due to climate

Mode 3: Horizontal Tensile Stress due to climate
“Over many cycles…”

“reflection cracks develop.”
Mode 3: Horizontal Tensile Stress due to climate
Mode 3: Horizontal Tensile Stress due to climate
“reflection cracks develop.”

Overlay
InterlayerExisting PCC
The SolutionReflective Crack Relief Mixtures
• RCRI and RBL– Thin (1”) fine aggregate HMA – Highly elastic binder – modified on low PG
side as well (-28oC and lower)– Asphalt-rich, impermeable layer to keep
moisture away from PCC and supporting materials

Fatigue Life Comparisons
100
1,000
10,000
100,000
1,000,000
10,000,000
100,000,000
0.0001 0.001 0.01
Tensile Strain, et (in/in)
Fatig
ue L
ife, N
f (C
ycle
s)
12.5M76Nf,50% = k1(1/εt)
k2(1/E)k3
k1 = 3.739E-13k2 = 5.5375k3 = 0.1239
9.5H76Nf,50% = k1(1/εt)
k2(1/E)k3
k1 = 2.224E-12k2 = 5.269k3 = 0.0769
RCRINf,50% = k1(1/εt)
k2(1/E)k3
k1 = 1101.8k2 = 2.33
k3 = 0.4894

Successful* Mitigation Methods
9 97
10
3
59
7
4
6
10
21
0
5
10
15
20
25
30
PFG GEO SAMI's RCRI CAL EOT
Num
ber o
f Sta
te H
ighw
ay A
genc
ies
(SH
A)
SuccessfulUnsuccessful
(Bennert and Maher, TRB 2007)(Bennert and Maher, TRB 2007)
2006 State Agency Survey Results
Flexible Asphalt Mixtures (Best Success Rate)
*Greater than 4 Years Before Cracking Observed

MT
WY
ID
WA
OR
NV
UT
CA
AZ
ND
SD
NE
CO
NM
TX
OK
KS
AR
LA
MO
IA
MN
WI
ILIN
KY
TN
MS AL GA
FL
SC
NC
VAWV
OH
MINY
PA
MD
DE
NJCT
RI
MA
ME
VT
NH
AK
HI
Paving Fabrics to Mitigate Reflective Cracking
* Successful is defined as greater than4 years before cracking occurs
Successful*UnsuccessfulNever Tried

Quick Note on Paving Fabrics
• Work well for HMA pavements when additional structural support needed– i.e. – can not increase pavement
thickness but need more support• Due to horizontal movement of PCC,
fabrics stretch and HMA still cracks– Not recommended for PCC/Composite
pavements

RCRI Test Section (Rt 34N)
3.60%
0.33%
6.90%
3.10%
0.0%
1.0%
2.0%
3.0%
4.0%
5.0%
6.0%
7.0%
8.0%
SuperpaveSection
RCRI Section SuperpaveSection
RCRI Section
6 Months 12 Months
% o
f Joi
nt L
engt
h C
rack
edRt 34N Cracking Survey
Why do we still get cracking with a “crack relief interlayer”?

“Crack Jumping”• Occurs in HMA materials
that overlay highly elastic stress absorbing interlayers– No cracking in RCRI –
crack initiates above RCRI – Issues with stiffness/fatigue
compatibility• The interlayers only
absorb a percentage of the vertical stress/strain, not eliminate it– At specified thickness, it
almost completely eliminates the horizontal

1.5” of 12M76
5 Cycles
0.5” of RCRI: 1.5” of 12M76
278 Cycles1.0” of RCRI: 0.5” 12M76
> 2,800 Cycles
0.035” Opening15oC (59oF)

Current Methodology for Composite Pavements
• Rutgers University developed an analytical method to predict the performance of asphalt mixtures on composite pavements– “Deflection Spectra Approach” – Takes into account both horizontal and vertical
movements– Realistic asphalt mixture response (over 15
mixtures sampled from field and tested)• Developed simplified Excel Spreadsheet to
optimize HMA mixture selection• NJDOT evaluating now – still “Experimental”

Example #1: 4” Thick HMA; 15 ft PCC Slab LengthNJDOT HMA Overlay Selection Program
Strata RBL HPTO 9.5mm SMA (76-22) 9.5H76 12H76 12M64
PASS PASS PASS PASS PASS FAIL PASS
CTE (in/in/C) 1.15E-05HMA Overlay Thickness (in) 4
PCC Slab Length (in) 180Temp at Bottom of HMA (°F) 50
Strata RBL HPTO 9.5mm SMA (76-22) 9.5H76 12H76 12M76Step 2 - Determine Appropriate HMA Material to be placed directly over PCC to limit cracking due to vertical deflection
Vertical Fatigue Life (Years) 1750.2 23.4 19.2 15.4 2.1 0.6 5.6
PASS PASS PASS PASS FAIL FAIL FAIL
ESAL's per Year 1.50E+05FWD Vertical Deflection at 18 Kips (mils) 8
-OR-PCC Condition (Good, Avg, Poor) Good
Strata RBL HPTO 9.5mm SMA (76-22) 9.5H76 12H76 12M76Step 3 - Determine Optimum HMA Overlay Vertical Fatigue
Life (Years) 4266.7 121.9 102.1 150.5 13.2 2.4 47.1
PASS PASS PASS PASS PASS FAIL PASS
Requested Design Life to Limit Cracking (Years) 10
Summary Matrix Strata RBL HPTO 9.5mm SMA (76-22) 9.5H76 12H76 12M76
FAILSelect optimum PCC overlay and Select HMA Overlay
Step 1 - Determing appropriate HMA material to be placed directly over PCC to limit cracking due to horizontal
deflection
Horizontal Fatigue Life (Cycles)
PASS PASS PASS PASS FAILPCC Overlay (Vertical)
HMA Overlay
PCC Overlay (Horizontal) PASS PASS PASS PASS PASS FAIL
FAIL
PASS PASS PASS PASS PASS FAIL PASS
672 225976168 15927 18047 20939 9295

Example #2: 4” Thick HMA; 78 ft PCC Slab LengthNJDOT HMA Overlay Selection Program
Strata RBL HPTO 9.5mm SMA (76-22) 9.5H76 12H76 12M64
PASS FAIL FAIL FAIL FAIL FAIL FAIL
CTE (in/in/C) 1.15E-05HMA Overlay Thickness (in) 4
PCC Slab Length (in) 936Temp at Bottom of HMA (°F) 50
Strata RBL HPTO 9.5mm SMA (76-22) 9.5H76 12H76 12M76Step 2 - Determine Appropriate HMA Material to be placed directly over PCC to limit cracking due to vertical deflection
Vertical Fatigue Life (Years) 1750.2 23.4 19.2 15.4 2.1 0.6 5.6
PASS PASS PASS PASS FAIL FAIL FAIL
ESAL's per Year 1.50E+05FWD Vertical Deflection at 18 Kips (mils) 8
-OR-PCC Condition (Good, Avg, Poor) Good
Strata RBL HPTO 9.5mm SMA (76-22) 9.5H76 12H76 12M76Step 3 - Determine Optimum HMA Overlay Vertical Fatigue
Life (Years) 4266.7 121.9 102.1 150.5 13.2 2.4 47.1
PASS PASS PASS PASS PASS FAIL PASS
Requested Design Life to Limit Cracking (Years) 10
Summary Matrix Strata RBL HPTO 9.5mm SMA (76-22) 9.5H76 12H76 12M76
FAILSelect optimum PCC overlay and Select HMA Overlay
Step 1 - Determing appropriate HMA material to be placed directly over PCC to limit cracking due to horizontal
deflection
Horizontal Fatigue Life (Cycles)
PASS PASS PASS PASS FAILPCC Overlay (Vertical)
HMA Overlay
PCC Overlay (Horizontal) PASS FAIL FAIL FAIL FAIL FAIL
FAIL
PASS PASS PASS PASS PASS FAIL PASS
24 71378 287 198 166 21

Example #3: 4” Thick HMA; 15 ft PCC Slab LengthNJDOT HMA Overlay Selection Program
Strata RBL HPTO 9.5mm SMA (76-22) 9.5H76 12H76 12M64
PASS PASS PASS PASS PASS FAIL PASS
CTE (in/in/C) 1.15E-05HMA Overlay Thickness (in) 4
PCC Slab Length (in) 180Temp at Bottom of HMA (°F) 50
Strata RBL HPTO 9.5mm SMA (76-22) 9.5H76 12H76 12M76Step 2 - Determine Appropriate HMA Material to be placed directly over PCC to limit cracking due to vertical deflection
Vertical Fatigue Life (Years) 381.5 1.4 1.1 0.3 0.1 0.1 0.1
PASS FAIL FAIL FAIL FAIL FAIL FAIL
ESAL's per Year 1.50E+05FWD Vertical Deflection at 18 Kips (mils) 16
-OR-PCC Condition (Good, Avg, Poor) Poor
Strata RBL HPTO 9.5mm SMA (76-22) 9.5H76 12H76 12M76Step 3 - Determine Optimum HMA Overlay Vertical Fatigue
Life (Years) 930.0 7.2 5.8 3.1 0.5 0.2 1.2
PASS FAIL FAIL FAIL FAIL FAIL FAIL
Requested Design Life to Limit Cracking (Years) 10
Summary Matrix Strata RBL HPTO 9.5mm SMA (76-22) 9.5H76 12H76 12M76
FAILSelect optimum PCC overlay and Select HMA Overlay
Step 1 - Determing appropriate HMA material to be placed directly over PCC to limit cracking due to horizontal
deflection
Horizontal Fatigue Life (Cycles)
PASS FAIL FAIL FAIL FAILPCC Overlay (Vertical)
HMA Overlay
PCC Overlay (Horizontal) PASS PASS PASS PASS PASS FAIL
FAIL
PASS FAIL FAIL FAIL FAIL FAIL FAIL
672 225976168 15927 18047 20939 9295