new gullen range wind farm pty ltd correspondence...
TRANSCRIPT

The reference in this document to Gullen Range Wind Farm means New Gullen Range Wind Farm Pty Ltd, ACN 167 404 211 whose Registered Office is 1 York Street,
Sydney, NSW, 2000.www.gullenrangewindfarm.com
New Gullen Range Wind Farm Pty Ltd
ACN 167 404 211 Correspondence Address:
Level 21, 1 York Street Sydney, NSW 2000
[email protected] Toll Free: 1800 509711
Description: The following report was prepared by Marshal Day Acoustics at the request of New Gullen Range Wind Farm in order to meet the requirements of condition 8U1 of Environmental Protection Licence 20365. Licensees Name: New Gullen Range Wind Farm Pty Ltd Address of licenced premise: Gullen Range Wind Farm 250 Storriers Lane Banniester NSW 2580 EPL Number: 20365 Location of Sampling Points See attached report Date of Noise Sampling 5th November 2015 Date Monitoring Report Published on Gullen Range Wind Farm Website 24th December 2015 Contact Details for further Information New Gullen Range Wind Farm 1800 509 711, [email protected] EPA NSW, 131 555

GULLEN RANGE WIND FARM NEAR FIELD TESTING: ROUND 2
Rp 001 2015300ML | 11 December 2015

6 Gipps Street
Collingwood VIC 3066
Australia
T: +613 9416 1855
ABN: 53 470 077 191
www.marshallday.com
Project: GULLEN RANGE WIND FARM
Prepared for: New Gullen Range Wind Farm Pty Ltd Level 23, 201 Elizabeth Street Sydney NSW 2000
Attention: Tom Nielsen
Report No.: Rp 001 2015300ML
Disclaimer
Reports produced by Marshall Day Acoustics Pty Ltd are based on a specific scope, conditions and limitations, as agreed between Marshall Day Acoustics and the Client. Information and/or report(s) prepared by Marshall Day Acoustics may not be suitable for uses other than the specific project. No parties other than the Client should use any information and/or report(s) without first conferring with Marshall Day Acoustics.
The advice given herein is for acoustic purposes only. Relevant authorities and experts should be consulted with regard to compliance with regulations or requirements governing areas other than acoustics.
Copyright
The concepts and information contained in this document are the property of Marshall Day Acoustics Pty Ltd. Use or copying of this document in whole or in part without the written permission of Marshall Day Acoustics constitutes an infringement of copyright. Information shall not be assigned to a third party without prior consent.
Document Control
Status: Rev: Comments Date: Author: Reviewer:
Final 11/12/2015 DG, JE JA

Rp 001 2015300ML Gullen Range Wind Farm Near field testing Round 2.docx 3
TABLE OF CONTENTS
1.0 INTRODUCTION .......................................................................................................................................... 4
2.0 EPA REQUIREMENTS .................................................................................................................................. 5
3.0 MEASUREMENTS ........................................................................................................................................ 5
3.1 Location ....................................................................................................................................................... 5
3.2 Scenarios ..................................................................................................................................................... 6
3.2.1 Approach .................................................................................................................................................. 6
3.2.2 Overview .................................................................................................................................................. 6
3.2.3 Variability ................................................................................................................................................. 7
3.3 Measurement positions ............................................................................................................................. 7
3.4 Equipment ................................................................................................................................................... 8
3.5 Analysis ........................................................................................................................................................ 8
4.0 RESULTS ....................................................................................................................................................... 9
4.1 Objective analysis ....................................................................................................................................... 9
4.1.1 Wind speed variability ............................................................................................................................ 9
4.1.2 Round 1 and Round 2 comparison....................................................................................................... 10
4.1.3 Firmware Version 3 ............................................................................................................................... 11
4.1.4 Firmware Version 5 ............................................................................................................................... 13
4.2 Subjective appraisal .................................................................................................................................. 15
5.0 CONCLUSIONS ........................................................................................................................................... 15
APPENDIX A GLOSSARY OF TERMINOLOGY
APPENDIX B FIRMWARE VERSION 5 RESULTS

Rp 001 2015300ML Gullen Range Wind Farm Near field testing Round 2.docx 4
1.0 INTRODUCTION
The Gullen Range Wind Farm is a seventy-three (73) turbine wind farm located near Goulburn in New South Wales. The wind farm comprises Goldwind GW82 and GW100 wind turbines with the GW100 model accounting for the majority of the turbines at the site. A commissioning study of operational noise from the wind farm was recently completed, as detailed in Marshall Day Acoustics report Rp 001 2014544SY1 (The Commissioning Report). Appendix P of the Commissioning Report details the results of a tonality investigation, with section P5 determining that the:
… combined results of measurements, listening studies and objective analysis in accordance with the Noise Compliance Plan are considered to demonstrate that tonality is not a determining factor in the assessment of the wind farm’s compliance…
The investigations detailed in the Commissioning Report included a near field study of a cluster of GW100 turbines to assess the effect that turbine firmware updates has on noise emissions, particularly concerning low frequency tonal character. Several versions of firmware were used across the duration of the commissioning study, as summarised in Table 1 below. As noted in the Commissioning Report, NGRWF has advised that the firmware that controls the GW100 turbines provides the means to alter the operational characteristics of the power conversion plant, in turn altering the associated noise emissions of the turbine. The iterative firmware updates that occurred through the course of the noise monitoring campaign had the objective of reducing turbine noise emissions in the low frequency range.
Table 1: GW100 Firmware software versions
Update Implemented
Version 1 8 to 12 December 2014
Version 2 13 to 14 January 2015
Version 3 13 to 14 April 2015
Version 4 9 to 12 June 2015
The objective of the near field study in the Commissioning Report was to compare noise emissions of relevant turbines when operated with firmware Version 2, being one of the firmware versions installed during an initial portion of the noise commissioning study, with noise emissions using firmware Version 4, which was the firmware version installed at the end of the commissioning study.
After receiving the Commissioning Report in mid July 2015, the NSW Department of Planning and Environment issued a letter on 8 September 2015 acknowledging that the:
…Department has carefully reviewed the Operational Noise Report in consultation with the Environment Protection Authority and is satisfied that the report is consistent with the requirements of condition 2.21 (d).
Subsequent to the issue of this correspondence, the EPA has prepared a draft condition for the wind farm’s Environment Protection Licence (EPL) which seeks additional investigation of noise emissions relating to firmware Versions 3 and 4.
This report, commissioned by NGRWF, documents the results of additional near field tonality investigations at the wind farm to address the requirements of the draft EPL condition.
1 MDA report Rp 001 2014544SY Gullen Range Wind Farm: Assessment of wind farm operational noise dated
17 July 2015.

Rp 001 2015300ML Gullen Range Wind Farm Near field testing Round 2.docx 5
2.0 EPA REQUIREMENTS
New Gullen Range Wind Farm Pty Ltd (NGRWF) has advised that the EPA has proposed additional conditions in the draft 2015 EPL for the wind farm as detailed in Figure 1.
Figure 1: Conditions proposed by the EPA for the draft EPL
3.0 MEASUREMENTS
Near field measurements of turbine noise were carried out at the wind farm on 5 November 2015 between 0830 hours and 1500 hours.
3.1 Location
For the near field study detailed in the Commissioning Report, referred to herein as the Round 1 study, the following criteria were used to identify a suitable measurement location at the wind farm:
The measurement location should be near to one or more GW100 model turbines (the control group)
The location should minimise, as far as is practicable, the influence of noise from turbines outside of the control group
The position for measurements should be on reasonably even terrain and located as far as is practicable from trees, vegetation and other wind generated noise sources (other than the turbines)
The Round 1 testing occurred during westerly winds and, using the noted criteria, a control group of four (4) turbines was identified on the western side of the Bannister section of turbines. The control group comprised BAN_09, BAN_10, BAN_11 and BAN_12 with a number of targeted measurements focused on BAN_09 whilst the other turbines in the group were turned off.
For the measurements on 5 November 2015, referred to herein as the Round 2 study, the wind direction was north-easterly. This necessitated the selection of an alternative control group. Using the selection criteria as noted above one (1) turbine, BAN_25, was selected as the control group for the Round 2 study.
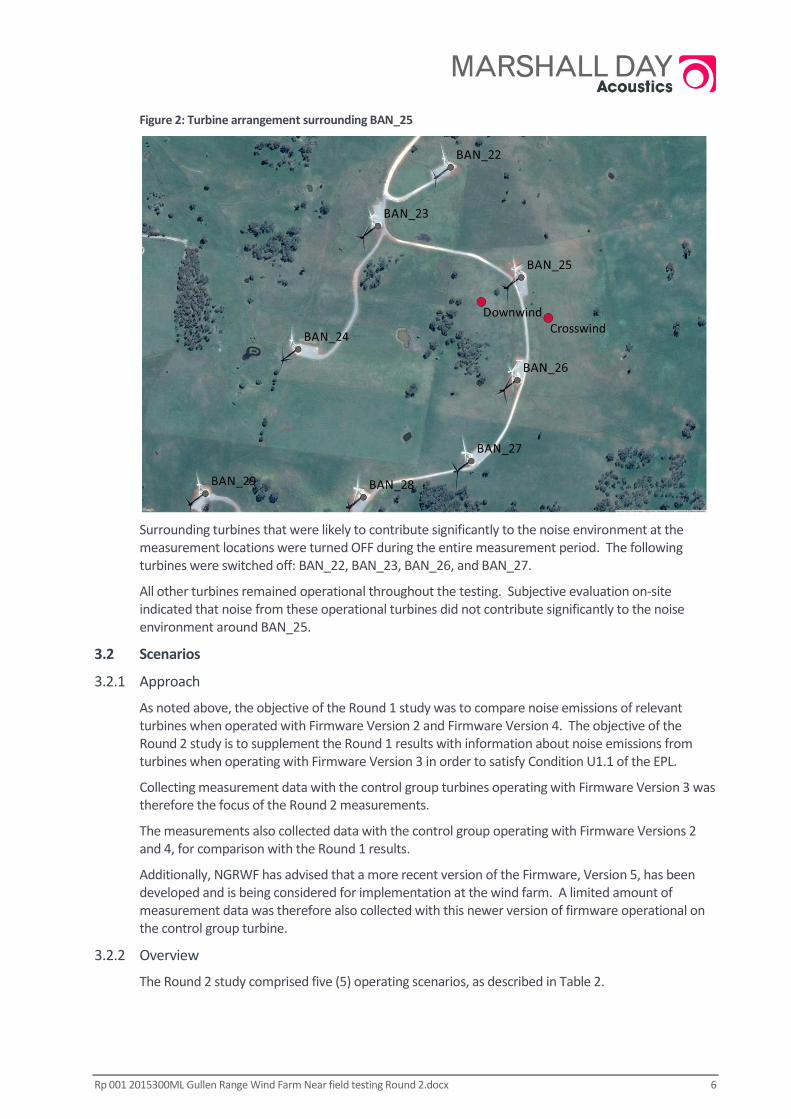
BAN_25 is orientated toward the eastern side of a cluster of GW100 turbines amongst the Bannister section of the wind farm. The area surrounding BAN_25 is generally clear of significant local vegetation and the north, south and western sides of the turbine are characterised by generally flat terrain. The ridge of the Gullen Range is positioned near to the east side of the turbine, orientated in a north-south direction, with terrain dropping away noticeably approximately 100 m from the turbine base.
The general arrangement of BAN_25 and surrounding turbines is illustrated in Figure 2.
Rp 001 2015300ML Gullen Range Wind Farm Near field testing Round 2.docx 6
Figure 2: Turbine arrangement surrounding BAN_25
Surrounding turbines that were likely to contribute significantly to the noise environment at the measurement locations were turned OFF during the entire measurement period. The following turbines were switched off: BAN_22, BAN_23, BAN_26, and BAN_27.
All other turbines remained operational throughout the testing. Subjective evaluation on-site indicated that noise from these operational turbines did not contribute significantly to the noise environment around BAN_25.
3.2 Scenarios
3.2.1 Approach
As noted above, the objective of the Round 1 study was to compare noise emissions of relevant turbines when operated with Firmware Version 2 and Firmware Version 4. The objective of the Round 2 study is to supplement the Round 1 results with information about noise emissions from turbines when operating with Firmware Version 3 in order to satisfy Condition U1.1 of the EPL.
Collecting measurement data with the control group turbines operating with Firmware Version 3 was therefore the focus of the Round 2 measurements.
The measurements also collected data with the control group operating with Firmware Versions 2 and 4, for comparison with the Round 1 results.
Additionally, NGRWF has advised that a more recent version of the Firmware, Version 5, has been developed and is being considered for implementation at the wind farm. A limited amount of measurement data was therefore also collected with this newer version of firmware operational on the control group turbine.
3.2.2 Overview
The Round 2 study comprised five (5) operating scenarios, as described in Table 2.

Rp 001 2015300ML Gullen Range Wind Farm Near field testing Round 2.docx 7
Table 2: Firmware noise testing – measurement scenarios
Scenario Control turbine operating?*
Firmware Version
Test objective
A No - Evaluation of residual noise. Measurements were made periodically through the test period.
B Yes 2 Comparative analysis of Firmware Version 2 between Round 1 and Round 2 studies.
C Yes 3 Analysis of results for Firmware Version 3 as required by draft EPL Condition U1.1
D Yes 4 Comparative analysis of Firmware Version 4 between Round 1 and Round 2 studies. Also, further analysis as required by draft EPL Condition U1.1.
E Yes 5 Analysis of results for Firmware Version 5, for informative purposes.
* Turbines BAN_22, BAN_23, BAN_26, BAN_27 were turned off for the duration of the measurements
It is understood that, throughout the duration of this testing, all wind turbines at the Gullen Range Wind Farm outside of the control group were operating with Firmware Version 4.
3.2.3 Variability
An advantage of testing an alternative control group for the Round 2 study is that it increases the total sample size of turbines considered as part of the collective near field measurements. In the case that the Round 1 and Round 2 results are comparable, this in turn decreases the risk of the results observed during one or other of the rounds being due to some unforeseen or atypical operating characteristic that is not representative of the majority of turbines at site. It is noted, however, that the control group for the Round 1 study considered this issue to a degree as the group comprised four (4) turbines.
Conversely, evaluation of tonal character under Firmware Version 3 using a different test turbine in Round 2 means that comparison with Round 1 results for Firmware Versions 2 and 4 may be less reliable. Specifically, differences observed between rounds could be due to either the change in turbine or the change in firmware. This introduces uncertainty into the assessment. To reduce the influence of this uncertainty, Round 2 measurement results for Firmware Version 3 are compared directly to the results for Firmware Versions 2 and 4 as also measured in Round 2 (rather than Round 1).
3.3 Measurement positions
The positions at the measurement location that were used for monitoring are detailed across Figure 2 above and Table 3 below.
Table 3: Measurement positions around BAN_25 (MGA94 Zone 55)
Location Easting Northing
Downwind 724539 6171742
Crosswind 724716 6171695
A sound level meter was placed at each of the downwind and crosswind measurement positions for the duration of the Round 2 study. Details of the measurement equipment are provided in the pursuant section.

Rp 001 2015300ML Gullen Range Wind Farm Near field testing Round 2.docx 8
3.4 Equipment
Details of equipment used during the measurement campaign are provided in Table 4.
Table 4: Details of measurement equipment
Equipment Make Model Serial number
Sound level meter, with associated microphone and digital sound recorder
01dB DUO 10197
01dB DUO 10349
Weather Station Vaisala WXT520 K1850005
Acoustic calibrator 01dB Cal21 34924044
The sound level meter was fitted with an enhanced secondary wind shield system comprising:
a proprietary inner foam wind shield, provided with the monitoring equipment
a bespoke outer foam wind shield, separated from the inner shield by approximately 30 mm.
The purpose of the enhanced secondary shield is to reduce the influence of extraneous noise associated with wind across the microphone.
Rainfall data was collected using the Vaisala WXT520 weather stations in conjunction with the DUO noise monitoring equipment at the cross wind location. This system was time synchronised with the measured noise data.
3.5 Analysis
Audio signal was recorded across the duration of the measurement period.
Narrow band frequency analysis has been carried out for relevant periods of the audio recording. Periods with significant extraneous noise have not been included in the analysis.
The narrow band analysis was carried out for contiguous 1 minute periods, with a frequency resolution of approximately 1.5 Hz.
Table 5 below presents the tally of 1 minute audio samples analysed for each measurement scenario.
Table 5: Length of audio sample analysed for each measurement scenario
Scenario Firmware Version Length of audio sample (minutes)
A - 43
B 2 15
C 3 12
D 4 16
E* 5 8
* Measurements with Firmware Version 5 were unattended. Recorded audio samples have been reviewed and excluded from the analysis where obvious instances of extraneous noise occurred.
For each relevant 1 minute period of audio, the following sound levels have been determined:
The broadband A-weighted equivalent (LAeq) sound level
The unweighted Leq sound level for narrow band frequencies in the range of nominally 20 Hz to 150 Hz.
Rp 001 2015300ML Gullen Range Wind Farm Near field testing Round 2.docx 9
4.0 RESULTS
4.1 Objective analysis
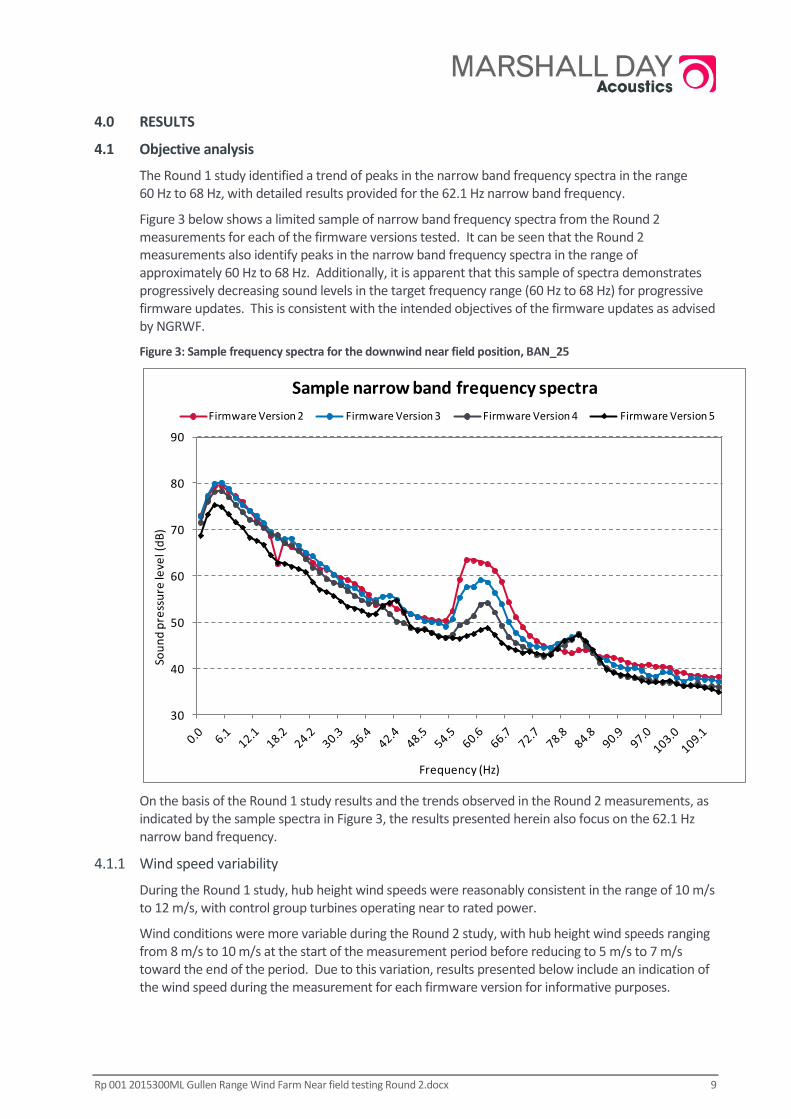
The Round 1 study identified a trend of peaks in the narrow band frequency spectra in the range 60 Hz to 68 Hz, with detailed results provided for the 62.1 Hz narrow band frequency.
Figure 3 below shows a limited sample of narrow band frequency spectra from the Round 2 measurements for each of the firmware versions tested. It can be seen that the Round 2 measurements also identify peaks in the narrow band frequency spectra in the range of approximately 60 Hz to 68 Hz. Additionally, it is apparent that this sample of spectra demonstrates progressively decreasing sound levels in the target frequency range (60 Hz to 68 Hz) for progressive firmware updates. This is consistent with the intended objectives of the firmware updates as advised by NGRWF.
Figure 3: Sample frequency spectra for the downwind near field position, BAN_25
On the basis of the Round 1 study results and the trends observed in the Round 2 measurements, as indicated by the sample spectra in Figure 3, the results presented herein also focus on the 62.1 Hz narrow band frequency.
4.1.1 Wind speed variability
During the Round 1 study, hub height wind speeds were reasonably consistent in the range of 10 m/s to 12 m/s, with control group turbines operating near to rated power.
Wind conditions were more variable during the Round 2 study, with hub height wind speeds ranging from 8 m/s to 10 m/s at the start of the measurement period before reducing to 5 m/s to 7 m/s toward the end of the period. Due to this variation, results presented below include an indication of the wind speed during the measurement for each firmware version for informative purposes.
30
40
50
60
70
80
90
Sou
nd
pre
ssu
re le
vel (
dB
)
Frequency (Hz)
Firmware Version 2 Firmware Version 3 Firmware Version 4 Firmware Version 5
Sample narrow band frequency spectra

Rp 001 2015300ML Gullen Range Wind Farm Near field testing Round 2.docx 10
4.1.2 Round 1 and Round 2 comparison
Table 6 and Figure 4 show a comparison of measurement results for the Round 1 study, specifically measurements at BAN_09, and the Round 2 study at BAN_25. For each study, the results relate to the downwind measurement position.
Table 6: Round 1 & 2 Comparison (Downwind position)
Round Firmware Version
Hub height wind speed
(m/s)
Broadband noise level (LAeq)
Average narrow band noise level at
62.1Hz (dB)
Standard Deviation
1 (BAN_09)
2 10.8 53.9 56.0 0.9
4 10.4 53.8 49.6 1.1
2 (BAN_25)
2 10.5 54.1 61.2 1.3
4 5.7 51.1 53.1 3.1
Figure 4: Round 1 & 2 Comparison summary (Downwind position)
From these results the following trends can be observed:
The hub height wind speed during Round 1 measurements was approximately 10 m/s. During the Round 2 study the hub height wind speed was approximately 10 m/s for the Version 2 measurements, reducing to approximately 6 m/s for the Version 4 measurements. The more variable wind speed for the Round 2 Version 4 measurements is considered to be the cause of the greater variation in measured noise levels in the 62.1 Hz narrow band frequency.
0
10
20
30
40
50
60
40
45
50
55
60
65
70
Hub
hei
ght
win
d sp
eed
(m/s
)
Sou
nd
pre
ssu
re l
evel
(dB
)
Round 1 (BAN_09) Round 2 (BAN_25)
Hub Height Wind Speed
Comparison of Round 1 and Round 2 noise levels62.1 Hz narrow band frequency

Rp 001 2015300ML Gullen Range Wind Farm Near field testing Round 2.docx 11
The reduction in the narrow band noise level from Version 2 to Version 4 during the Round 1 study was approximately 5-6 dB. This is comparable with the reduction observed during the Round 2 study which is approximately 6-7 dB. The Round 2 result is consistent with the findings of the Commissioning Report that the use of Firmware Version 4 leads to a measureable reduction in the narrow frequency band noise level at 62.1 Hz.
The measured narrow band noise levels during the Round 2 study are moderately higher than those measured during the Round 1 study. This may be the result of: variation in noise emission between different turbines, or; the different weather conditions encountered across each study, or; spatial variability of tonal noise (such as can be caused by interference patterns).
On the basis of these observations, it is considered that the results demonstrate that the reduction in 62.1 Hz narrow band noise levels observed during the Round 1 study are consistent with the results of the Round 2 study using the alternative control group. In turn, it is considered that measurements from the Round 2 control group are suitable for evaluating the relative noise levels from a GW100 turbine operating with Firmware Version 2, 3 and 4.
4.1.3 Firmware Version 3
Table 7, Figure 5 and Figure 6 show a comparison of measurement results from the Round 2 study with the control group operating in each of Firmware Versions 2, 3 and 4.
Table 7: Evaluation of Firmware Versions 2, 3 and4
Firmware Version
Hub height wind speed
(m/s)
Measurement position
Broadband noise level (LAeq)
Average* narrow band noise level at 62.1Hz (dB)
Standard Deviation
2 10.5 Downwind 54.1 61.2 1.3
Crosswind 51.1 59.8 1.5
3 7.4 Downwind 52.7 54.5 2.7
Crosswind 49.5 52.8 2.3
4 5.7 Downwind 52.5 53.1 3.1
Crosswind 49.5 51.3 3.1
* Each average level is based on the number of measured 1 minute samples as detailed in Table 5

Rp 001 2015300ML Gullen Range Wind Farm Near field testing Round 2.docx 12
Figure 5: Chart comparing Firmware Versions 2, 3 and 4 (Downwind position)
Figure 6: Chart comparing Firmware Versions 2, 3 and 4 (Crosswind position)
0
10
20
30
40
50
60
40
45
50
55
60
65
70
Ve
rsio
n 2
Ve
rsio
n 3
Ve
rsio
n 4
Win
d s
pe
ed
(m/s
)
Sou
nd
pre
ssu
re le
vel (
dB
)Downwind sound pressure levels:
62.1 Hz narrow band frequency
Hub height wind speed
0
10
20
30
40
50
60
40
45
50
55
60
65
70
Ve
rsio
n 2
Ve
rsio
n 3
Ve
rsio
n 4
Win
d s
pe
ed
(m/s
)
Sou
nd
pre
ssu
re le
vel (
dB
)
Crosswind sound pressure levels:
62.1 Hz narrow band frequency
Hub height wind speed
Rp 001 2015300ML Gullen Range Wind Farm Near field testing Round 2.docx 13
Table 7, Figure 5 and Figure 6 demonstrate the following:
Firmware Versions 3 and 4 both result in a measureable reduction in the tonal content of the control group relative to Firmware Version 2. The reduction observed for the control group equates to approximately 6 to 7 dB in both the downwind and crosswind directions.
Firmware Version 4 results in a potentially modest reduction in tonal content relative to Firmware Version 3. The reduction observed for the control group equates to approximately 1 dB to 2 dB for both the downwind and crosswind directions. It should be noted however that this observed level of reduction is comparable with or less than the standard deviation for each measurement scenario meaning the variation could be the result of sampling variability.
The broadband LAeq levels associated with each firmware version, as detailed in Table 7, indicate relatively consistent levels. Firmware Versions 3 and 4 have moderately reduced LAeq levels, in the order of 1 dB to 2 dB, when compared with Firmware Version 2 which may be due to the lower wind speeds encountered during the measurement periods. This result is consistent with expectations that the firmware changes primarily influence the tonal content of the sound related to the power conversion plant, rather than the overall broadband aerodynamic noise emissions of the turbines.
On the basis of these observations, it is considered that the results demonstrate that the reduction in 62.1 Hz narrow band noise levels observed during the Round 1 study comparing Firmware Versions 2 and 4 are consistent with the results of the Round 2 study comparing Firmware Version 2 with both Versions 3 and 4.
4.1.4 Firmware Version 5
To supplement the results in Section 4.1.3, the Round 2 study includes additional measurements of the control group using Firmware Version 5.
Figure 7 provides a comparison of measurement results from the Round 2 study for the downwind measurement position with the control group operating in each of Firmware Versions 2, 3, 4 and 5. More detailed results are also included in Appendix B.

Rp 001 2015300ML Gullen Range Wind Farm Near field testing Round 2.docx 14
Figure 7: Chart comparing Firmware Versions 2, 3, 4 and5 (Downwind position)
These results demonstrate that Firmware Version 5 provides in a further measureable reduction in the tonal content of the control group turbine relative to Firmware Version 4. The reduction observed for the control group of turbines equated to approximately 6 dB in the downwind direction.
Additionally, comparison of broadband LAeq levels associated with Firmware Versions 4 and 5, as presented in Appendix B, indicates relatively consistent levels, generally within the normal range of variation of turbine noise emission.
This result indicates that Firmware Version 5 provides a further reduction of tonal content relative to Firmware Version 4.
0
10
20
30
40
50
60
40
45
50
55
60
65
70
Ve
rsio
n 2
Ve
rsio
n 3
Ve
rsio
n 4
Ve
rsio
n 5
Win
d s
pe
ed
(m/s
)
Sou
nd
pre
ssu
re le
vel (
dB
)Downwind sound pressure levels:
62.1 Hz narrow band frequency
Hub height wind speed

Rp 001 2015300ML Gullen Range Wind Farm Near field testing Round 2.docx 15
4.2 Subjective appraisal
A subjective appraisal of the character of noise from the control turbine was carried out for each version of the firmware used during the Round 2 study. The following observations are noted:
Due to variations in the amount of residual or extraneous noise in the environment during the testing period, some of the reductions in tonal content demonstrated by the objective analysis in Section 4.1 were not easily subjectively identified. This was particularly the case during the initial portion of the measurement period when wind speeds and therefore also residual noise levels were comparatively high.
For Firmware Version 2, a low level tone was audible around the control turbine with frequency content consistent with the observed spectral peaks in the 60 Hz to 68 Hz region as identified in Figure 3 above.
For Firmware Version 3, a low level tone comparable to that identified for Firmware Version 2 was audible intermittently.
The tonal content observed for Firmware Version 2 was not subjectively identified when the control group operated with Firmware Version 4.
Subjective appraisal of Firmware Version 5 was not able to be carried out during the measurement period for that firmware version. A listening study was however carried out downwind of BAN_25 the following day during which time NGRWF has advised the turbine continued to operate with Firmware Version 5. No tonal characteristic was identified during the subjective appraisal.
5.0 CONCLUSIONS
A near field study of noise from a turbine at the Gullen Range Wind Farm has been carried out to investigate differences in sound character associated with different versions of control firmware. In particular this report has considered the requirements of Condition U1.1(a), to assess whether ‘Firmware Version 4 is providing better or equivalent tonal reduction to that of Firmware Version 3’.
Based on the results of the Round 2 near field study, measurements have demonstrated that Firmware Versions 3 and 4 both provide a measurable reduction in average noise levels in the 62.1 Hz frequency band relative to Firmware Version 2. The measurements further indicate that Firmware Version 4 provides a moderately larger reduction in the average noise level than Firmware Version 3, however the observed differences may be the result of measurement variability in part or in whole, in particular as a result of variable wind conditions during a portion of the Round 2 study.
For informative purposes, assessment of a more recent iteration of firmware, Version 5, has also been carried out. Measurements indicate that Firmware Version 5 provides a further, measurable reduction in the average noise levels in the 62.1 Hz frequency band when compared to Firmware Versions 3 and 4.

Rp 001 2015300ML Gullen Range Wind Farm Near field testing Round 2.docx 16
APPENDIX A GLOSSARY OF TERMINOLOGY
Ambient noise The total, encompassing sound.
Frequency Sound can occur over a range of frequencies extending from the very low, such as the rumble of thunder, up to the very high such as the crash of cymbals. Sound is generally described over the frequency range from 63Hz to 4000Hz (4kHz). This is roughly equal to the range of frequencies on a piano.
Hertz (Hz) Hertz is the unit of frequency. One hertz is one cycle per second. One thousand hertz is a kilohertz (kHz).
Octave Band A range of frequencies where the highest frequency included is twice the lowest frequency. Octave bands are referred to by their logarithmic centre frequencies, these being 31.5 Hz, 63 Hz, 125 Hz, 250 Hz, 500 Hz, 1 kHz, 2 kHz, 4 kHz, 8 kHz, and 16 kHz for the audible range of sound.
Residual noise The total, encompassing sound without the sound of interest.
Sound Pressure Level (LP)
A logarithmic ratio of a sound pressure measured at distance, relative to the threshold of hearing (20 µPa RMS) and expressed in decibels.
dB Decibel. The unit of sound level.
A-weighting The A-weighting approximates the response of the human ear
LAeq The equivalent continuous (time-averaged) A-weighted sound level. This is commonly referred to as the average noise level.
Noise is often not steady. Traffic noise, music noise and the barking of dogs are all examples of noises that vary over time. When such noises are measured, the noise level can be expressed as an average level, or as a statistical measure, such as the level exceeded for 90% of the time.
LA90 The A-weighted noise level equalled or exceeded for 90% of the measurement period. This is commonly referred to as the background noise level.

Rp 001 2015300ML Gullen Range Wind Farm Near field testing Round 2.docx 17
APPENDIX B FIRMWARE VERSION 5 RESULTS
Table 8: Evaluation of Firmware Versions 3 and 5
Firmware Version Hub height wind speed
(m/s)
Measurement position
Broadband noise level (LAeq)
Average narrow band noise level at 62.1Hz (dB)
Standard Deviation
Version 2 10.5 Downwind 54.1 61.2 1.3
Crosswind 51.1 59.8 1.5
Version 3 7.4 Downwind 52.7 54.5 2.7
Crosswind 49.5 52.8 2.3
Version 4 5.7 Downwind 52.5 53.1 3.1
Crosswind 49.5 51.3 3.1
Version 5 5.4 Downwind 51.0 46.9 1.6
Crosswind 47.7 45.1 1.3
Figure 8: Chart comparing Firmware Versions 2, 3, 4 and 5 (Downwind position)
0
10
20
30
40
50
60
40
45
50
55
60
65
70
Ve
rsio
n 2
Ve
rsio
n 3
Ve
rsio
n 4
Ve
rsio
n 5
Win
d s
pe
ed
(m/s
)
Sou
nd
pre
ssu
re le
vel (
dB
)
Downwind sound pressure levels:
62.1 Hz narrow band frequency
Hub height wind speed

Rp 001 2015300ML Gullen Range Wind Farm Near field testing Round 2.docx 18
Figure 9: Chart comparing Firmware Versions 2, 3, 4 and 5 (Crosswind position)
0
10
20
30
40
50
60
40
45
50
55
60
65
70V
ers
ion
2
Ve
rsio
n 3
Ve
rsio
n 4
Ve
rsio
n 5
Win
d s
pe
ed
(m/s
)
Sou
nd
pre
ssu
re le
vel (
dB
)
Crosswind sound pressure levels:
62.1 Hz narrow band frequency
Hub height wind speed