new energy audit of iit kanpur hostel area-1students.iitk.ac.in/ge3/energy audit.pdf · iit kanpur...
TRANSCRIPT

Project Samadhan
The Group for Environment and Energy Engineering 1
The Group for Environment and Energy Engineering
IIT Kanpur Halls of Residence energy audit
Project Samadhan Group of Environment and Energy Engineering

Project Samadhan
The Group for Environment and Energy Engineering 2
Samadhan Team
Students
Anand Vardhan Mishra
Shyam Panjwani
Rahul Singh
Akshit S
Mayank Bansal
Neetisha Besra
Shashank Tripathi
Faculty and Mentors
Dr. S.S.K. Iyer
Institute Works Department
Mr. Rajeev Garg
Mr. Pankaj Singh
Mr. Raghvendra Singh
ABSTRACT
The following report has been prepared with a view to facilitate our
understanding of the energy consumption pattern of the Halls of Residence of IIT
Kanpur. The report focuses on energy efficiency measures.

Project Samadhan
The Group for Environment and Energy Engineering 3
Preface
An energy audit is a study of a plant or facility to determine how and where
energy is used and to identify methods for energy savings. There is now a
universal recognition of the fact that new technologies and much greater use of
some that already exist provide the most hopeful prospects for the future. The
opportunities lie in the use of existing renewable energy technologies, greater
efforts at energy efficiency and the dissemination of these technologies and
options.
This energy audit of the IIT-K Hostels area was carried out by the members of
the GE3.This report is just one step, a mere mile marker towards our destination
of achieving energy efficiency and we would like to emphasise that an energy
audit is a continuous process. We have compiled a list of possible actions to
conserve and efficiently utilize our scarce resources and identified their savings
potential. The next step would be to prioritize their implementation.
We look forward with optimism that the institute authorities, staff and students
shall ensure the maximum execution of the recommendations and the success of
this work.

Project Samadhan
The Group for Environment and Energy Engineering 4
TABLE OF CONTENTS
List of figures
List of tables
1. Introduction
1.1 Objective of the energy audit
1.2 IIT present energy scenario
2. Energy Audit
2.1 Methodology
2.2 Grouping and strategy
3. Quantification by end use
3.1 Hostels Rooms
3.2 Water pumping
3.3 Energy consumption in hostel kitchens
4. Measurements performed in hostels
4.1 Room air conditioners
4.2 Lighting and fan loads
5. Benchmarking
5.1 Energy performance of various Hostels
5.2 Per unit area energy consumption
5.3 Per capita energy consumption
5.4 Per capita electrical energy consumption in hostels
5.5 ECBC standards and comparison
6. Energy conservation and efficiency
6.1 Implementation measures
6.2 Energy management structure
Appendix A – Wing-wise comparative energy consumption graphs.
Appendix B – Hostel wise comparative energy consumption graph.
Appendix C – References
Acknowledgements

Project Samadhan
The Group for Environment and Energy Engineering 5
LIST OF FIGURES
Fig 3.1: Connected Load Distribution (In kW)
Fig 4.1: AC Load for a day without energy saver for AC’s
Fig 4.2: AC Load for a day with energy saver for AC’s
Fig 5.1: Total Annual Energy Consumption for Different Hostels In 2007
Fig 5.2: Per unit area energy consumption (kWh/sq.m/year) for Hostels
Fig 5.3: Per capita electrical energy consumption (kWh/person/yr.) for hostels

Project Samadhan
The Group for Environment and Energy Engineering 6
LIST OF TABLES
Table 3.1: Lighting and Fan Load in Hostels
Table 3.2: Details of energy consumption and food wastage in hostel kitchens
Table 4.1: Energy savings achieved by installation of energy saver for 1.5 ton AC
Table 4.2: Measurement for lighting in Hostels
Table 4.3: Luxmeter Reading of Hostels
Table 5.1: Standard illuminance Levels for different Purposes

Project Samadhan
The Group for Environment and Energy Engineering 7
Introduction
This Project is the vision to make IIT Kanpur hostels energy efficient . It is a fact
that Hostels of IIT Kanpur community uses a huge amount of energy and it is
also very obvious that we waste quite a sizable chunk of it.
IIT Kanpur’s energy bill keeps up around INR 9-10 crore per year. This amount is
huge and thus naturally attracts attention when we understand that quite a lot of
energy is being wasted, which in turn would mean that huge amount of financial
resources are being wasted.
Making the Hostel area energy efficient will not only help the institute reduce its
expenses but also helps us fulfil our moral responsibility of not wasting this
precious resource, which is scarcely available to rest of the people of the country.
This would act as a prototype project, the lessons learnt here can be put to
practice in the future as we progress and move to other parts of the campus.
Hostels have been chosen because they are quite familiar to us, are very
accessible and have conspicuous energy wastage that can be reduced.
We are confident that the results that will come out of this exercise are bound to
be of interest to everyone and can be the first step to make IIT Kanpur
energetically the most efficient campus in India.
1.1 Energy Audit Objective
Primary:
� The First objective is to acquire and analyze data and finding the energy
consumption pattern of these facilities.
� The second objective will be to calculate the wastage pattern based on the
results of the first objective.
� The final objective is to find and implement solutions that are acceptable
and feasible
Secondary:
� This would be our first exposure to this field hence experience gain would
be vital.
� This project will precede many follow up projects and hence help GE3 to
gain technical and management exposure required for future energy
projects
� It is sure to help create a repertoire of vital contacts hence will develop
interaction with alumni, faculty and students.

Project Samadhan
The Group for Environment and Energy Engineering 8
� It would also increase knowledge among students about streams of study
other than their own which is in the spirit of the interdisciplinary
approach of IIT Kanpur.
IIT Kanpur Present Energy scene IIT Kanpur has an approximate area of 1150 acres with a student community
strength of around 3800 and about 300 faculty. There is a floating population of
of the order of 1000 in the campus as the Nankari residents enjoy the right of
way through the campus. IIT Kanpur enjoys 24 hour electricity supply while
within a few hundred feet of the institute there are 12 hour power cuts.
IIT Kanpur has a demand of 8.5 MW (NPC data). Operating power factor hovers
around a good 0.98.
The Specific Energy Consumption (SEC) is defined as the energy consumption
per unit of product output. The specific energy consumption considering
students were calculated which forms the Hostels SEC and was taken as
reference for comparison. The SEC was calculated to be 2252
kWh/person/annum (for 2007-08) for the Hostels.

Project Samadhan
The Group for Environment and Energy Engineering 9
2. Energy audit
2.1 Energy audit methodology
The methodology adopted for this audit was
� Formation of audit groups for specific areas and end use
� Visual inspection and data collection
� Observations on the general condition of the facility and equipment
and quantification
� Identification / verification of energy consumption and other
parameters by measurements
� Detailed calculations, analyses and assumptions
� Validation
� Potential energy saving opportunities
� Implementation
As a first step in this regard, 4 teams of total 6 students from the group were
formed and each team was assigned a particular area or application of energy in
the campus.
2.2 Grouping and strategy
The following groups were formed with specific target areas and end uses
assigned
Team 1: Lighting , Fans etc. in Hostel 1 to Hostel
Team 2: Lighting, Fans etc. in Hostel 6 to Hostel 9 & GH1
Team 3: Data logging
Team 4: Past Data Collection from IWD (internal Works Department)
The groups were allowed the use of various measuring instruments like Lux
meters to assist in the auditing activity.

Project Samadhan
The Group for Environment and Energy Engineering 10
3. Quantification by end used
The loads were segregated based on the end use as lighting and fans,
Computer/printers, water pumping. Quantification, types and necessary
measurements were carried out. The details are given below:
Figure 3.1:Connected Electrical Load
Distribution(In KW)
38408
47680100
51000 LIGHTINGS
FANS
AIR-CONDITIONER
COMPUTERS
3.1 Hostels Rooms
3.1.1 Lighting and fans
The Institute has about 7571 Fluorescent tube lights. Hostels are having 4393
fans in different Hostels. The total lighting load from the above is 302 kW and the
connected fan load is 352 kW.
Table 3.1: Lighting and Fan Load in Hostels
HOSTEL NO. Of FLOUROSCENT TUBE LIGHTS(40 W) NO. of FANS(80 W)
HALL 1 903 538
HALL 2 936 348
HALL 3 693 339
HALL 4 920 481
HALL 5 935 498
HALL 6 271 138
HALL 7 791 596
HALL 8 837 530
HALL 9 835 535
NEW GH 450 390

Project Samadhan
The Group for Environment and Energy Engineering 11
TOTAL 7571 4393
Computers and monitors account for 30%-40% of the energy used by office
equipment. Their energy consumption is second only to office lighting. It is
estimated that a power managed computer consumes less than half the energy of
a computer without power management.
The total number of computers in different hostels in the campus is 3950.In
which No. of desktops is around 1500 and No. of laptops is 2450.
3.3Energy usage in hostel kitchens
Energy usage in hostels messes are as given here:
Table 3.2: Details of energy consumption and food wastage in hostel kitchens
HOSTEL CONNECTED
LOAD(IN kW)
LPG USAGE PER
DAY(kg)
ESTIMATED FOOD
WASTAGE(IN kg)
HALL 1 42 60 125
HALL 2 42 60 125
HALL 3 42 60 125
HALL 4 30 60 100
HALL 5 30 60 125
HALL 6 14 25 30
HALL 7 40 60 100
HALL 8 29 60 100
HALL 9 29 60 100
GH-1 25 50 70
TOTAL 323 555 1000

Project Samadhan
The Group for Environment and Energy Engineering 12
4. Measurements performed at IIT Kanpur and
IIT Bombay
4.1 Room air conditioners (Study by IIT Bombay, Energy Science Department)
A commercially available energy saver for room ACs was procured* and
measurements were carried out for over 60 hrs, with and without the saver, for a
typical 1.5 ton AC.
Fig.4.1: AC Load for a day without energy saver for AC’s
Fig.4.2: AC Load for a day with energy saver for AC’s
Project Samadhan
The Group for Environment and Energy Engineering 13
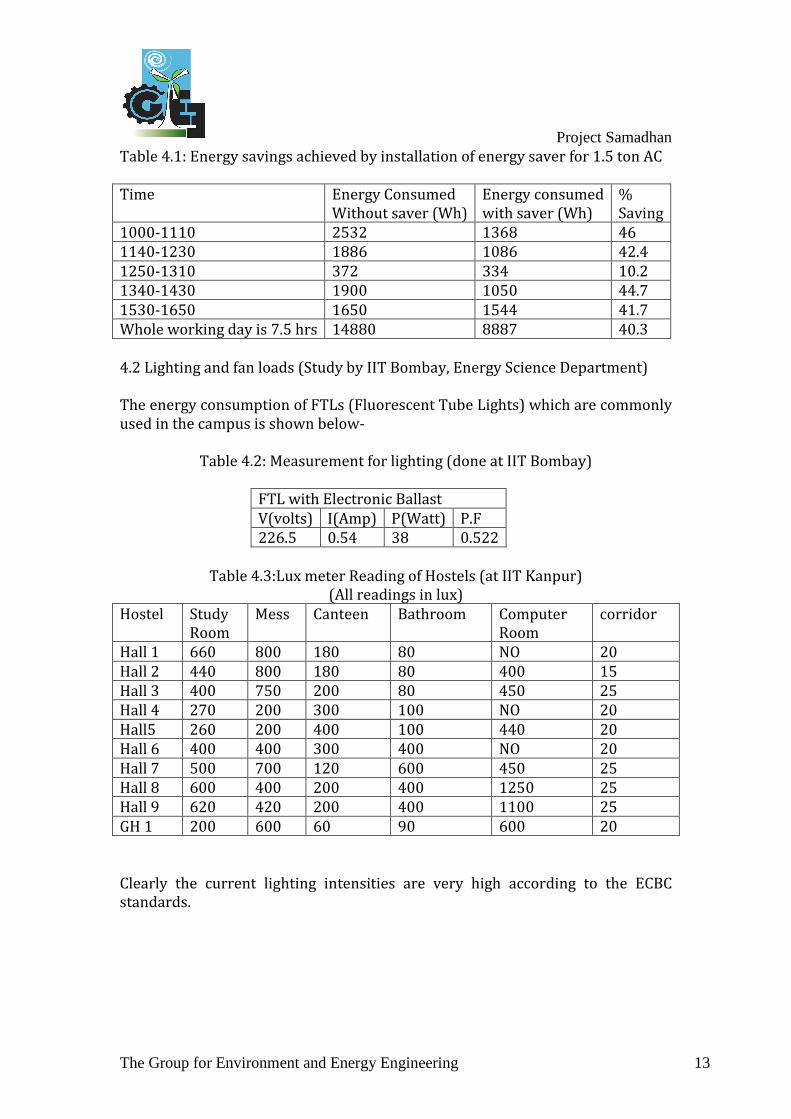
Table 4.1: Energy savings achieved by installation of energy saver for 1.5 ton AC
Time Energy Consumed
Without saver (Wh)
Energy consumed
with saver (Wh)
%
Saving
1000-1110 2532 1368 46
1140-1230 1886 1086 42.4
1250-1310 372 334 10.2
1340-1430 1900 1050 44.7
1530-1650 1650 1544 41.7
Whole working day is 7.5 hrs 14880 8887 40.3
4.2 Lighting and fan loads (Study by IIT Bombay, Energy Science Department)
The energy consumption of FTLs (Fluorescent Tube Lights) which are commonly
used in the campus is shown below-
Table 4.2: Measurement for lighting (done at IIT Bombay)
FTL with Electronic Ballast
V(volts) I(Amp) P(Watt) P.F
226.5 0.54 38 0.522
Table 4.3:Lux meter Reading of Hostels (at IIT Kanpur)
(All readings in lux)
Hostel Study
Room
Mess Canteen Bathroom Computer
Room
corridor
Hall 1 660 800 180 80 NO 20
Hall 2 440 800 180 80 400 15
Hall 3 400 750 200 80 450 25
Hall 4 270 200 300 100 NO 20
Hall5 260 200 400 100 440 20
Hall 6 400 400 300 400 NO 20
Hall 7 500 700 120 600 450 25
Hall 8 600 400 200 400 1250 25
Hall 9 620 420 200 400 1100 25
GH 1 200 600 60 90 600 20
Clearly the current lighting intensities are very high according to the ECBC
standards.

Project Samadhan
The Group for Environment and Energy Engineering 14
5. Benchmarking
Energy benchmarking involves the development of quantitative and qualitative
indicators through the collection and analysis of energy-related data and energy
management practices. Benchmarking in simplistic terms is the process of
comparing the performance of a given process with that of the best possible
process and to try to improve the standard of the process to improve quality of
the system, product, services etc. It allows organizations to develop plans on how
to adopt such best practices, usually with the aim of increasing some Aspect of
performance. Benchmarking may be a one-off event, but is often treated as a
continuous process in which organizations continually seek to challenge their
practices. Benchmarking is a method which should be used on a continual basis
as best practices are always evolving. Benchmarking of energy consumption is a
powerful tool for performance assessment and logical evolution of avenues for
improvement. Historical data, well documented, helps to bring out energy
consumption and cost trends month-wise / daily. Trend analysis of energy
consumption, cost, relevant production features, specific energy consumption,
help to understand effects of capacity utilization on energy use efficiency and
costs on a broader scale.
The basis for benchmarking the energy consumption at IIT-K Hostels is energy
consumed per student. The benchmarking parameters are as following:
� Hostel energy performance
� kWh consumed per sq.m of area
� kWh consumed per capita
5.1Hostel energy performance

Project Samadhan
The Group for Environment and Energy Engineering 15
The details of the annual energy consumption in various Hostels are as shown
here in the following figure.
Energy Consumption of Different Hostels(In KWh)
0
100000
200000
300000
400000
500000
600000
700000
800000
HALL 1 HALL 2 HALL 3 HALL 4 HALL 5 HALL 7 HALL 8 HALL 9 GH 1 GH 2
Hostels
In K
Wh
Fig. 5.1: Total annual energy consumption of different hostels in 2007

Project Samadhan
The Group for Environment and Energy Engineering 16
5.2 Per unit area energy consumption
The energy consumption per sq. m for each department is determined. The
results are shown in following figure.
Per Unit Area Energy Consumption of Different Hostels
0
20
40
60
80
100
120
HALL 1 HALL 2 HALL 3 HALL 4 HALL 5 GH 2 HALL 7 HALL 8 HALL 9 GH 1
Hostel
Un
its
Pe
r S
q.m
Figure 5.2 Per unit energy consumption for each 3 storied hostel. (Area used in
the calculation is the plinth area.)
Per capita energy Consumption of different Hostels
0
500
1000
1500
2000
2500
Hall 1 Hall 2 Hall 3 Hall 4 Hall 5 GH 2 Hall 7 Hall 8 Hall 9 GH 1
Hostel
Un
its/
Pe
rso
ns
Fig 5.3: Per capita electrical energy consumption (kWh/person/yr.) for
Hostel.
Project Samadhan
The Group for Environment and Energy Engineering 17
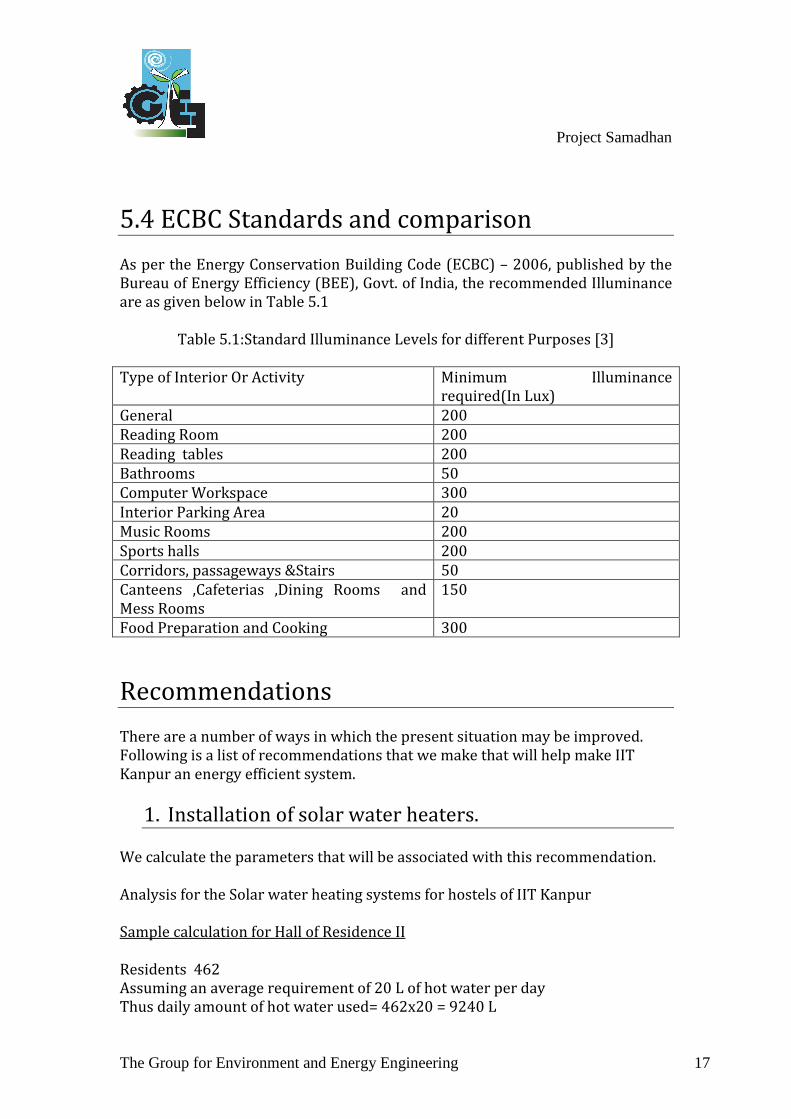
5.4 ECBC Standards and comparison
As per the Energy Conservation Building Code (ECBC) – 2006, published by the
Bureau of Energy Efficiency (BEE), Govt. of India, the recommended Illuminance
are as given below in Table 5.1
Table 5.1:Standard Illuminance Levels for different Purposes [3]
Type of Interior Or Activity Minimum Illuminance
required(In Lux)
General 200
Reading Room 200
Reading tables 200
Bathrooms 50
Computer Workspace 300
Interior Parking Area 20
Music Rooms 200
Sports halls 200
Corridors, passageways &Stairs 50
Canteens ,Cafeterias ,Dining Rooms and
Mess Rooms
150
Food Preparation and Cooking 300
Recommendations
There are a number of ways in which the present situation may be improved.
Following is a list of recommendations that we make that will help make IIT
Kanpur an energy efficient system.
1. Installation of solar water heaters.
We calculate the parameters that will be associated with this recommendation.
Analysis for the Solar water heating systems for hostels of IIT Kanpur
Sample calculation for Hall of Residence II
Residents 462
Assuming an average requirement of 20 L of hot water per day
Thus daily amount of hot water used= 462x20 = 9240 L

Project Samadhan
The Group for Environment and Energy Engineering 18
An average flat plate collector area of 2 m^2 gives 125L of hot water per day. [1]
Thus total collector area required = 9240/125x2 = 147.84 m^2
Assuming cost of installation to be around 10,000 Rs/m^2 total capital cost
comes out to be = 14,78,400Rs
Total geyser usage in the hostel for approximately 12 hrs on a typical cool day
for 2.3 kW geysers installed in the hostel = 12x2.3x21= 579.6 kWh
Geysers are typically operational in IIT Kanpur for about 120 days from
November to February. Thus total energy consumption = 120x579.6 = 69552
kWh
Total expense with geysers = 69552x3.5 Rs/kWh = 243432 Rs.
Thus simple payback period = 14,78,400 / 243432 = 5.25 years.
Clearly this is a comfortable payback period and it is advisable to have solar
water heaters installed in this facility.
The same calculation is done for all the hostels of IITK
Residents
hot
water
required
collector
area
m^2
Capital
investment
INR
no of
geysers
annual
saving
(INR)
payback
(years)
Hall-1 452 9040 144.64 1446400 21 243432 5.9417
Hall-2 459 9180 146.88 1468800 21 243432 6.033718
Hall-4 486 9720 155.52 1555200 24 278208 5.590062
Hall-5 450 9000 144 1440000 24 278208 5.175983
Hall-6 112 2240 35.84 358400 6 69552 5.152979
Hall-7 410 8200 131.2 1312000 30 347760 3.772717
Hall-8 489 9780 156.48 1564800 24 278208 5.624569
Hall-9 300 6000 96 960000 27 312984 3.067249
GH-1 310 6200 99.2 992000 21 243432 4.07506
The payback period of all the facilities is around 5-6 years which is certainly
affordable considering the environmental impact of this technology.
Furthermore data clearly suggest that even while having almost the same
architecture and number of students the per capita electricity consumption of
Hall 2 and 3 is different and the difference clearly has a correlation with the solar
heater that have been installed in Hall 3. This is further confirmed by the fact
that in winter Hall 3 and Hall 2 per capita electricity consumption differences
grows even further.
2. Replacement of rheostatic regulators with electronic
However studies done at IIT Bombay have shown that the electronic regulator is
more energy efficient but experience suggests that resistive regulators are more
durable. Though it is still mentioned here as a possible option.

Project Samadhan
The Group for Environment and Energy Engineering 19
3. Installation of biogas plant at IIT Kanpur
HOSTEL CONNECTED LOAD(IN
KW)
LPG USAGE PER
DAY(Kg)
FOOD WASTAGE(IN
Kg)
HALL 1 42 60 125
HALL 2 42 60 125
HALL 3 42 60 125
HALL 4 30 60 100
HALL 5 30 60 125
HALL 6 14 25 30
HALL 7 40 60 100
HALL 8 29 60 100
HALL 9 29 60 100
GH-1 25 50 70
TOTAL 323 555 1000
Typical waste food density is 890 Kg/m^3[2]
Total volume of waste food per day is about 890 L.
Taking example of an urban bio gas unit Nisarguna of 1000 kg capacity. [4]
Treatment
capacity
(tonnes per day)
Installation
cost
(Rs in lakhs)
O &
M
(Rs)
Methane
generation
Per cubic meter
Manure
generated
(tonnes per
day)
1 5-6 8000 100-120 0.1
Assumptions-
Calorific value of biogas = 21MJ/m^3
Calorific value of LPG = 46.1 MJ/ kg
Energy output of biogas plant per day = 3500 MJ
This implies that LPG saved = 75.92 kg = 5.34 LPG cylinders per day
Total working days = 200 days approximately
Total annual savings = 200x5.34x350 = INR 3,73,800
Payback period = 2.15 years = 26 months approx.
4. Lighting Savings
The lighting that is currently used in most of the hostels is T8 FTL we propose
them to be replaced by the more energy efficient T5 FTL. [5]
Characteristics Conventional 40 W
FTL
T5
Expected Life hrs 5000 20000
Energy input per hour 45 28

Project Samadhan
The Group for Environment and Energy Engineering 20
Consumption in 19 hrs per day (kWh) .885 .532
Annual consumption 200 working days
(units)
177 106.4
Annual consumption (INR) at INR 3.5 per
unit
605 372
Savings INR ----------------- 233
Total savings per year considering we replace 7000 T8 FTLs with T5 we can
save around INR 16, 30,000.
Total investment = 7000x770 = INR 53,90,000
Simple payback period is thus calculated to be 3.3 Years.
As clear from the standard comparison we can clearly remove some of the
lights as the current levels are very high, especially in the common rooms.
5. Executive Recommendations
This section talks about the managerial aspects of the recommendation in the
above section and also about other possible measures.
1. Maintenance of the Hall solar water heaters. This is a rampant problem in
the installation of solar heaters, their maintenance is quite an important
business and thus we propose that constant watch over system performance
can be kept by the maintenance secretary. This can be integrated with the
current duties of the post. Furthermore a more involved solution can be the
creation of an energy and environment committee on the hall level which can
keep a record of the energy consumption parameters of the hall. This can be
further carry weightage in student festivals that are taken seriously by the
student community. This would add much needed glamour into the activity.
2. There has to be an institute level student community that keeps track of
the energy consumption parameters of the halls. This does not need to be
separate, as it can derive membership from the already existing hall
maintenance secretaries.
3. Energy auditing inside the campus has to be done on a regular basis and
the reports should be made public. The IWD tries to keep track of the
readings of various hostel meters but this reporting has to be made public to
generate awareness.

Project Samadhan
The Group for Environment and Energy Engineering 21
Appendix

Project Samadhan
The Group for Environment and Energy Engineering 22
Appendix A
Charts for energy consumption pattern in various wings of halls. Units
consumed per person are plotted against the month giving us a monthly
behaviour.

Project Samadhan
The Group for Environment and Energy Engineering 23
1. GH1
0
1
2
3
4
5
6
7
MARO7
APR
O7
MAYO
7
JUN
O7
JULY
O7
AUGO
7
SEPO
7
OCT-O
7
NO
VO
7
DEC
O7
JANO
8
A
B
C
D
E
F
G
2.
Hall1
0
5
10
15
20
25
30
MAR O7 APRO7 MAYO7 JUNEO7 JULO7 AUGO7 SEPO7 07-Oct NOVO7 DECO7 JANO8
A
B
C
D
E
F
G
3. Hall 2

Project Samadhan
The Group for Environment and Energy Engineering 24
0
1
2
3
4
5
6
7
8
9
MARO7
APRO7
MAYO7
JUNEO7
JULO7
AUGO7
SEPO7
07-O
ct
N0VO7
DECO7
JANO8
A
B
C
D
E
F
G
4. Hall 3
0
1
2
3
4
5
6
MARO7 APRO7 MAYO7 JUNO7 JULO7 AUGO7 SEPO7 OCT-O7 NOVO7 DECO7 JANO8
1B
1M
1T
2B
2M
2T
3B
3M
3T
4B
4M
4T
5B
5M
5T
6B
6M
6T
7B
7M
7T

Project Samadhan
The Group for Environment and Energy Engineering 25
5. Hall 4 *
MARO7
APRO7
MAYO7
JUNEO7
JULO7
AUGO7
SEPO7
OCT-O
7
NOVO7
DECO7
JANO8
-2
-1
0
1
2
3
4
5
MARO7
APRO7
MAYO7
JUNEO7
JULO7
AUGO7
SEPO7
OCT-O
7
NOVO7
DECO7
JANO8
A
B
C
D
E
F
G
H
E1
* Clearly energy consumption can not be negative it seems to be that a meter
was changed and due to this discrepancy was created.
6. Hall 5
MARO7
APRO
7
MAYO
7
JUN
O7
JULYO
7
AUGO
7
SEPO
7
OCT-O
7
NO
VO
7
DECO
7
JANO
8-0.5
0
0.5
1
1.5
2
2.5
3
3.5
4
4.5
5
MARO7
APRO
7
MAYO
7
JUN
O7
JULYO
7
AUGO
7
SEPO
7
OCT-O
7
NO
VO
7
DECO
7
JANO
8
A
B
C
D
E
F
G
H
I

Project Samadhan
The Group for Environment and Energy Engineering 26
7. Hall 6
0
1
2
3
4
5
6
7
8
MARO7
APR
O7
MAYO
7
JUN
EO7
JULO
7
AUGO
7
SEP
O7
OCT-
O7
NO
VO
7
DEC
O7
JANO
8
A
B
6. Hall 7
0
1
2
3
4
5
6
7
8
9
MARO7
APR
O7
MAYO
7
JUN
O7
JULY
O7
AUGO
7
SEPO
7
OCT-O
7
NO
VO
7
DEC
O7
JANO
8
A
B
C
D
E
F
G
H
I
J
7. Hall 8

Project Samadhan
The Group for Environment and Energy Engineering 27
0
2
4
6
8
10
12
14
16
MARO7
APRO
7
MAYO
7
JUN
O7
JULYO
7
AUGO
7
SEP
O7
OCT-
O7
NO
VO
7
DECO
7
JANO
8
A
B
C
D
E
F
G
H
9. Hall 9
0
0.5
1
1.5
2
2.5
3
3.5
4
4.5
MARO7
APR
O7
MAYO
7
JUN
O7
JULO
7
AUGO
7
SEP
O7
OCT-
O7
NO
VO
7
DEC
O7
JANO
8
A
B
C
D

Project Samadhan
The Group for Environment and Energy Engineering 28
Appendix B
This Graph clearly points out the higher energy consuming halls of the campus
i.e. GH2 which has significantly higher consumption than any other Hall
especially in January.
Comparison of daily consumption per student for various halls
0
1
2
3
4
5
6
7
Janu
ary
Febru
ary
Mar
chApr
ilM
ayJu
ne July
Augus
t
Septe
mber
Octobe
r
Novem
ber
Decem
ber
Month
Un
its
pe
stu
den
t d
aily
Hall 1Hall 2Hall 3Hall 4Hall 5hall 7Hall 8hall 9GH 1GH 2

Project Samadhan
The Group for Environment and Energy Engineering 29
Appendix C
References
[1] IIT Bombay Energy audit report, Department of Energy Science and
Engineering.
[2] MATERIAL AND ENERGY BALANCES IN A LARGE-SCALE AEROBIC
BIOCONVERSION CELL by Nickolas J. Themelis. Earth Engineering Center and
Department of Earth and Environmental Engineering, Columbia University, New
York.
[3] Energy Conservation Building Code (ECBC) – 2006, published by the Bureau
of Energy Efficiency (BEE), Govt. of India
[4] SOLID WASTE MANAGEMENTP. U. Asnani of the 3i network in which IITK is
also involved.
[5] Source: http://www.energyfreeindia.com/t5-tube-light.htm

Project Samadhan
The Group for Environment and Energy Engineering 30
Acknowledgements
The acknowledgements are due to all the officials at the IWD department who
helped us in data collection, especially Mr. Rajiv Garg, Mr. Raghvendra, Mr.
Pankaj Singh. We also thank Mr. Amitav Ray and Mr. Pawan Kumar of the
National Power Corporation for helping in measurements. We also acknowledge
the effort of the DESE IIT Bombay as it formed a basis on which could start our
work.
We thank our faculty for their unwavering support throughout the process. We
feel that this is only the tip of the iceberg, and an enormous amount of work can
be done on the campus in terms of energy efficiency.