new economic imperative or political choice? · 2008. 5. 26. · executive summary 1 introduction 4...
TRANSCRIPT

Public Service Cuts in the Northwest Territories: Economic Imperative or Political Choice?
Parkland Institute Report • May 2008


Public Service Cuts in the Northwest Territories: Economic Imperative or Political Choice?
3
This report was published by the Parkland InstituteMay 2008. © All rights reserved.
Contents
Acknowledgements ii
About the Author ii
About the Parkland Institute ii
Executive Summary 1
Introduction 4
The Government’s Financial Picture 6
Increasing Surpluses 7
Financial Position: In the Black 7
”The Evolution of the NWT Fiscal Framework, 2004 - 2008” 8
The NWT Economy: Strong and Growing 12
Future Government Revenues 15
Potential Sources of Additional Revenue 17
Conclusions 21
To obtain additional copies of the report or rights to copy it, please contact:Parkland Institute, University of Alberta11045 Saskatchewan DriveEdmonton, Alberta T6G 2E1Phone: (780) 492-8558 Fax: (780) 492-8738Web site: www.ualberta.ca/parklandE-mail: [email protected]
ISBN 1-894949-19-6
i
Public Service Cuts in the Northwest Territories: Economic Imperative or Political Choice?

Park land Inst i tute • May 2008
4
Parkland Institute is an Alberta research network that examines public policy issues. We are based in the Faculty of Arts at the University of Alberta and our research network includes members from most of Alberta’s academic institutions as well as other organizations involved in public policy research. Parkland Institute was founded in 1996 and its mandate is to:
• conductresearchoneconomic,social,cultural,andpoliticalissues facing Albertans and Canadians.
• publishresearchandprovideinformedcommentoncurrentpolicy issues to the media and the public.
• sponsorconferencesandpublicforumsonissuesfacingAlbertans.
• bringtogetheracademicandnon-academiccommunities.
About the Parkland Institute
TheauthorthanksAggieBrockman,Jean-FrancoisDesLauriers,GregFlanagan,DianaGibson,JohnKolkman,BenMcDonald,ShelaghMontgomery,SuzetteMontreuil,KevinO’Reilly,DougRitchieandtwoanonymous reviewers from the Northwest Territories for providing valuableinformationandreviews.ThanksalsogotoScottHarrisforthoroughandaccuratecopyeditingandproofreading,andFlavioRojasforspeedyandprofessionaldesignandlayout.Theauthortakessole responsibility for content.
Acknowledgements
ii
DavidThompsonisanindependentpublicpolicyconsultantandaParklandInstituteResearchAssociate.Hehaspostgraduatedegreesinlawandeconomics,andhasworkedingovernment,theprivatesectorandthenot-for-profitsector.
About the Author

Public Service Cuts in the Northwest Territories: Economic Imperative or Political Choice?
1
Executive Summary
The Government of the Northwest Territories (GNWT) announced in January that it will cut approximately $135 million in expenditures over the next two years. This will likely result in hundreds of jobs being lost in the civil service and in the wider economy. It is unknown what the impacts will be on public services, such as education, health care, supports for the elderly and disabled, and other social services.
The Government itself has been silent on the cuts; despite handing out notices to 135 employees, it has given no indications of what services will be affected, or in what communities. It has implied that the rationale for the cuts is financial, and that there is a need to move funding toward infrastructure investments. Thus this report analyses the Government’s financial picture, and the underlying economy of the Northwest Territories (NWT) to determine whether the cuts are necessary in order to make this infrastructure investment.
Growing Revenues and SurplusesSeventy percent of the revenues of the GNWT come from federal government grants and transfers. A new Territorial Formula Financing (TFF) system will provide a steady increase in core federal funding over the next several years. Thirty percent of revenues are own-source revenues (OSR) and these also have been on an upward trend. Total revenues have been growing more quickly than expenses, and since 2004-2005, the GNWT has been operating at a surplus. The surplus has grown each year, most recently reaching $109 million.
This growing surplus has meant that the GNWT’s debt has been paid down. From over $66 million in March 2006, the net financial debt was down to $6 million in March 2007, and was likely eliminated that spring. The net debt-to-GDP ratio is near zero or less, which compares very favourably to around 20% for the rest of Canada, and 50% for the wealthy G7 countries. Considering non-financial assets, the government actually has an accumulated surplus that is likely over $1 billion.
Nevertheless, the Government insists it is in financial hard times. In February 2008, it released a document titled “The Evolution of the NWT Fiscal Framework, 2004-2008” (EFF). The EFF states that expenditure growth has been forecast to exceed revenue growth for the past four years. However, this forecast has not come true; in each of those years, revenue growth has exceeded expenditure growth.

Park land Inst i tute • May 2008
2
Finance Minister and Premier Floyd Roland took this claim a step further, stating “our spending will continue to grow faster than our revenues.” Again, the reality is that spending has not grown faster than revenues. And in late 2006, Moody’s Investor Services issued the GNWT an Aa1 credit rating, thus casting more doubt on the claim that the GNWT is constantly on the brink of sliding into structural deficit.
A Strong EconomyEven if there were a deficit coming, there should be no automatic assumption that the only response is to cut spending. The economy may well be able to support higher Government revenues. The NWT’s economic health appears to be very robust. The NWT has the highest GDP per capita in Canada – 40% higher than that of oil-soaked Alberta. Furthermore, GDP has been on an upward trend for years, growing 67% between 1999 and 2006. The GNWT Bureau of Statistics projects a doubling of GDP by 2014. Statistics Canada recently confirmed ongoing GDP growth, reporting 2007 growth of 13.1% – the highest in Canada and substantially higher than that of China.
Other indicators paint a similarly healthy economic picture. Employment is the highest in Canada, and rising. Unemployment is now at 5.3%, compared to the Canadian average of 6.3%. The NWT also enjoyed the highest average incomes in Canada, and several other indicators in the Government’s most recent “Economic Review” also show strong economic growth. Indeed, in the spring of 2007, the Government was predicting “enormous ... unprecedented” growth.
Capacity for Revenue GrowthDespite the ongoing and projected economic growth, the Government is predicting a $31 million drop off in revenues. Taking account of the rising federal core funding, GNWT own-source revenues would need to decline by more than $40 million (11-12%) for this gloomy prediction to come true.
However, with economic and employment growth, own-source revenues are more likely to increase. If they maintained their current ratio to GDP, total annual revenues would grow by $32 million to $107 million in the next four to five years. And with GDP estimated to double by 2014, annual revenues would grow by $115 million. Furthermore, in February the federal government announced

Public Service Cuts in the Northwest Territories: Economic Imperative or Political Choice?
3
infrastructure funding support amounting to $26.5 million per year for the next seven years, and a further $8.6 million per year for NWT communities, for a total of $35 million per year available for infrastructure investment in the NWT.
Such increases in revenues would go a long way toward covering infrastructure investment needed in the future, perhaps covering it all with no need for spending cuts or tax increases. And ordinary debt financing could help bridge any gap in the next couple of years, if there is one (the $300 million GNWT borrowing cap was raised to $500 million last year).
Although it appears that economic growth could boost revenues adequately, if higher revenues proved necessary, several options are available. The GNWT’s tax rates on large corporations, top income earners and fuel are all below Canadian averages, and could be increased. The GNWT’s liquor “tax” (the Revolving Fund) could also yield higher revenues. It may be possible to levy new taxes as well, such as taxes on retail sales or capital investment. A carbon tax alone could raise on the order of $100 million per year.
ConclusionIn light of the Government’s healthy financial picture, and the strong NWT economy, there would appear to be little reason to continue with the public service cuts. In light of the harm they could cause to families and communities in the NWT, the Government should conduct a detailed re-examination of its financial outlook, taking into account the truly “enormous” and “unprecedented” growth that the NWT is about to experience.
Park land Inst i tute • May 2008
4
Introduction
The Government of the Northwest Territories (GNWT, Government) announced in January that it will cut approximately $135 million in expenditures over the next two years.1 This cut will result in 135 layoffs, plus a further 88 currently vacant positions being eliminated, for a total loss of 223 civil service jobs.2
Those outside of the civil service also will be affected by the cuts. Depending on the areas cut, and what is done with the salaries of those eliminated positions, the economic multiplier effect of cutting $135 million in GNWT’s spending could be losses on the order of another 1,000 jobs.3
Moreover, it is unclear what this spending cut will mean for public services in the Northwest Territories (NWT). It is highly unlikely with a cut of this magnitude that some services will not be adversely affected. Will the cut affect student/teacher ratios? Will it affect hospital staff levels? Will it affect front line delivery of supports for children, the elderly or the disabled, or other social services?
The answers to these questions are unknown. The GNWT has been very quiet about the cuts. No details have been given, and the GNWT’s website seems not to contain any information about the cuts – no news release, no information on which services will be affected, or in what communities. Yet in February 2008, 135 employees were given notice that they may lose their jobs.4 It remains unclear whether there will be further rounds of cuts.
Public statements of the GNWT strongly suggest that the rationale for this budget cut is financial, not program prioritization.5 This report examines publicly available documents – public accounts, budgets, economic reports and the like – from both the GNWT and the federal government to determine whether there is in fact a solid financial reason for cuts of this magnitude.
The first section of this report examines the finances of the GNWT – both its annual surplus/deficit and cumulative surplus/debt position – to help determine whether the government’s financial situation necessitates the cuts.
The next part of the report then considers the state of the economy of the NWT in order to determine whether the government’s future financial situation will be impaired by a foundering economy.
1 CBC News “135 gov’t jobs on the line in N.W.T. budget cuts: minister” (CBC News, Feb. 29, 2008) http://www.cbc.ca/canada/north/story/2008/02/29/nwt-cuts.html (accessed April 15, 2008).
2 Idem.
3 The GNWT Bureau of Statistics “NWT Economic Multipliers - Overview and Results” (Nov 2007) at p.5 provides an economic multiplier of 8.0 jobs per $million for Government Sector spending http://www.stats.gov.nt.ca/Statinfo/Economic/Multiplier/Multiplier%20Report-2007.pdf (accessed April 18, 2008).
4 Jess McDiarmid, “Workers’ union vows to fight budget” (Northern News Service, April 4, 2008) http://nnsl.com/northern-news-services/stories/papers/apr4_08unw.html (accessed April 20, 2008).
5 e.g. see discussion below of the “Evolution of the NWT Fiscal Framework, 2004-2008” document.

Public Service Cuts in the Northwest Territories: Economic Imperative or Political Choice?
5
Finally, in the event that revenues actually do fall in the future, the report outlines several potential revenue sources that the government could tap into at that time.
The report then draws conclusions about whether the cuts are necessary in light of the government’s financial situation, the strength of the broader economy and the ability of the government to raise revenues.
Park land Inst i tute • May 2008
6
The Government’s Financial Picture
The GNWT has two main revenue streams:
1. federal Government funds via Territorial Formula Financing (TFF) and transfer payments; and
2. its own-source revenue - the money that the GNWT raises on its own, through taxes etc.
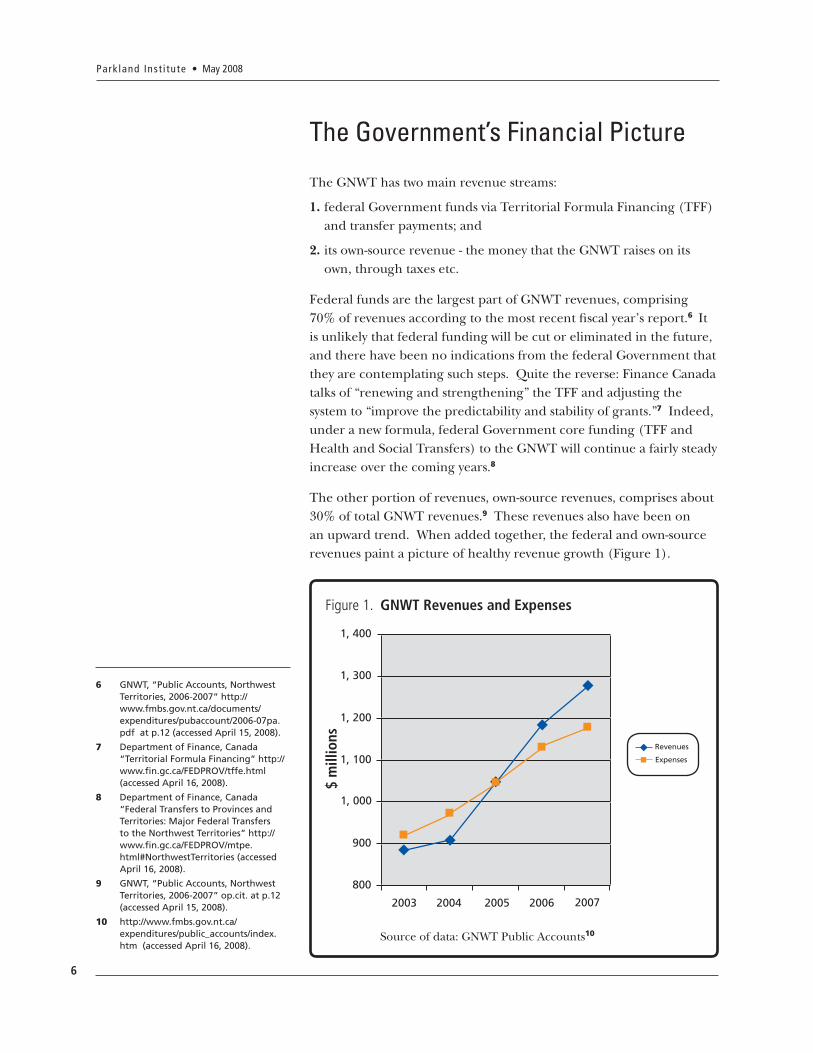
Federal funds are the largest part of GNWT revenues, comprising 70% of revenues according to the most recent fiscal year’s report.6 It is unlikely that federal funding will be cut or eliminated in the future, and there have been no indications from the federal Government that they are contemplating such steps. Quite the reverse: Finance Canada talks of “renewing and strengthening” the TFF and adjusting the system to “improve the predictability and stability of grants.”7 Indeed, under a new formula, federal Government core funding (TFF and Health and Social Transfers) to the GNWT will continue a fairly steady increase over the coming years.8
The other portion of revenues, own-source revenues, comprises about 30% of total GNWT revenues.9 These revenues also have been on an upward trend. When added together, the federal and own-source revenues paint a picture of healthy revenue growth (Figure 1).
Source of data: GNWT Public Accounts10
Revenues
Expenses
1, 400
1, 300
1, 200
1, 100
1, 000
900
800
2003 2004 2005 2006 2007
$ m
illio
ns
Figure 1. GNWT Revenues and Expenses
6 GNWT, “Public Accounts, Northwest Territories, 2006-2007” http://www.fmbs.gov.nt.ca/documents/expenditures/pubaccount/2006-07pa.pdf at p.12 (accessed April 15, 2008).
7 Department of Finance, Canada “Territorial Formula Financing” http://www.fin.gc.ca/FEDPROV/tffe.html (accessed April 16, 2008).
8 Department of Finance, Canada “Federal Transfers to Provinces and Territories: Major Federal Transfers to the Northwest Territories” http://www.fin.gc.ca/FEDPROV/mtpe.html#NorthwestTerritories (accessed April 16, 2008).
9 GNWT, “Public Accounts, Northwest Territories, 2006-2007” op.cit. at p.12 (accessed April 15, 2008).
10 http://www.fmbs.gov.nt.ca/expenditures/public_accounts/index.htm (accessed April 16, 2008).

Public Service Cuts in the Northwest Territories: Economic Imperative or Political Choice?
7
Increasing Surpluses
Expenses have also grown over this period, but not as much as revenues. Consequently, the Government is in surplus, and the surpluses have been growing. As of 2004-2005, the Government began operating in the black, with a modest surplus of $4.7 million.11 By the following year, the surplus had grown to over $59 million.12 By the most recent year for which there are results, the GNWT surplus was nearly $109 million.13
Thus, over the period 2004-2007, the Government recorded $173 million in surpluses. The Government has forecast a surplus of over $44 million for 2007-2008,14 which would bring the total surplus for the last four years to over $210 million. However, the four-year total surplus could end up being significantly higher. Based on the trend of increasing surpluses, and the Government’s tendency15 to underestimate surpluses (by a mean average of $19 million per year over the last four years16), the current year’s surplus will likely be higher than forecast.
Financial Position: In the Black
The growing surplus has meant that the GNWT’s financial debt has been paid down. From over $66 million in March 2006, the net financial debt17 was down to under $6 million in March 2007.18 Given the projected surplus for the most recent fiscal year (over $44 million, as noted above), the net financial debt was likely eliminated in the spring of 2007.19
However, net debt is a somewhat limited indicator of Government financial health. Other things being equal, a healthy GDP means that debt can be sustained or retired relatively easily.20 Thus net debt-to-GDP ratio is an important measure of financial health for Governments.
The GNWT’s net debt-to-GDP ratio in March of 2007 was 0.15%.21 And of course, because the GNWT net debt was likely eliminated in spring of 2007, the ratio is now likely below zero. In contrast, the total net debt-to-GDP ratio for Canada as a whole is more than a hundred times larger; by 2009 it is projected to decline to 19.5%.22 The average for wealthy G7 countries is projected to be 51.9%. (See Figure 2 for comparisons.)
11 “Public Accounts of the Government of the Northwest Territories for the Year Ended March 31, 2006 - Section I Consolidated Financial Statements” (Northwest Territories Financial Management Board, July 2006) at p.12 http://www.fmbs.gov.nt.ca/documents/expenditures/pubaccount/2005-06pa.pdf (accessed April 15, 2008).
12 “Public Accounts of the Government of the Northwest Territories for the Year Ended March 31, 2007 - Section I Consolidated Financial Statements” op.cit. at p.12.
13 Idem.
14 Government of the Northwest Territories, “Main Estimates 2007-2008” at p. vi http://www.fmbs.gov.nt.ca/documents/budgetdocuments/mains/2007-08mainsvol1.pdf (accessed April 16, 2008).
15 In some jurisdictions, lowballing revenues and surpluses has become a tradition, with in-year “surprise surpluses” that are a surprise to nobody. Alberta’s tendency to so do has been linked to impairment of democratic processes: Parkland Institute Committee on Alberta’s Finances, “Fiscal Surplus, Democratic Deficit: Budgeting and Government Finance in Alberta” at pp.10-14 (Parkland Institute, May 2006). http://www.ualberta.ca/PARKLAND/research/studies/FiscalDemocracy.pdf (accessed April 28, 2008).
16 “Public Accounts of the Government of the Northwest Territories for the Year Ended March 31, 2007 [and for years 2006, 2005 and 2004]: Section I Consolidated Financial Statements - Statement of Operations and Accumulated Surplus,” available at http://www.fmbs.gov.nt.ca/expenditures/public_accounts/index.htm (accessed April 16, 2008).
17 Net financial debt is financial assets minus financial liabilities. As of March 2007, GNWT financial assets were $535.1 million and financial liabilities were $540.7 million. Financial liabilities are comprised of several items, the largest of which is accounts payable; actual long-term borrowing was $113.1 million. “Public Accounts of the Government of the Northwest Territories for the Year Ended March 31, 2007 - Section I Consolidated Financial Statements” op.cit. at p.10.
18 Idem.
19 This will be determined when the Public Accounts are made available, which is normally in July following the fiscal year end.

Park land Inst i tute • May 2008
8
20 The GNWT’s own-source revenues are more closely linked to GDP, while its federal grants are less so. Unlike provincial governments, the GNWT does not directly access rents from resource development, instead receiving federal government grants. See below for discussion of potential impacts of GDP growth on own-source revenues.
21 Net debt / GDP = $6 million / $4 billion = 0.0015.
22 Government of Canada, “Budget 2008: Annex 1 Canada’s Total Government Fiscal Performance,” at chart A1.8 http://www.budget.gc.ca/2008/plan/ann1-eng.asp (accessed April 17, 2008).
60
50
40
30
20
10
0
G7 Average Canada: Total Gov’t GNWT
Perc
ent
Figure 2. Net Debt-to-GDP Ratios
Moving beyond net financial debt, which is the cash position of the Government, the GNWT also has a number of non-financial assets (e.g. land, buildings). Combining the small net financial debt that the GNWT still had in March 2007 with its substantial non-financial assets, its total accumulated surplus was over $1 billion. It is now likely higher.
“The Evolution of the NWT Fiscal Framework, 2004-2008”
The Government’s financial picture seems healthy, and there would appear to be little reason to institute major spending cuts. However, the Government claims this is not so. In February 2008, it released a document titled “Evolution of the NWT Fiscal Framework, 2004-2008”23 (EFF). As will be seen below, this document appears to have been created for the purpose of justifying the cuts. Thus some scrutiny of this document is warranted.
Despite the surpluses over the past four years, the EFF states that for years expenditure growth has been forecast to exceed revenue growth. This is repeated several times throughout the document, which goes through the successive budgets and financial results over the years, beginning with 2004-2005. It is reiterated in the final section providing the fiscal outlook for 2008-2009 and beyond: “revenues are projected to grow more slowly than expenditures.”
23 http://www.fin.gov.nt.ca/documents/Evolution%20of%20the%20NWT%20Fiscal%20Framework%202004%20to%202008%20for%20tabling.pdf (accessed April 17, 2008).

Public Service Cuts in the Northwest Territories: Economic Imperative or Political Choice?
9
Despite the repetition of this prediction, Figure 1 above shows that the reverse was true; for entire period covered by the EFF, revenue growth has outpaced expenditure growth. The Government’s own numbers are clear on this, despite its repeated claims to the contrary.
While the EFF is somewhat guarded in stating that expenditure growth has been projected to exceed revenue growth, Finance Minister and Premier Floyd Roland recently took the assertion one step further when he stated “our spending will continue to grow faster than our revenues.”24 It bears repeating that, in reality, spending has not been growing faster than revenues.
Perhaps because of this fact, the EFF makes the claim that the GNWT’s healthy financial picture over the past few years is the result of unanticipated one-time revenues that have artificially improved Government finances. It states in the introductory section:
... from 2004-05 to 2007-08, it was clear that the GNWT had a structural deficit where expenditure growth was outpacing revenue growth, but each year, one-time revenues improved the situation and postponed the need for drastic action.
The subsequent sections of the EFF go through the detailed financial highlights of each year. However, these year-by-year sections do not support the assertion that one-time revenues improved the situation each year:
• Inalloftheyears,bothactualrevenuesandactualexpenditureswere higher than budgeted.25
• Thesectionon2004-2005mentionssomerevenueincreases,butmost or all were long-term, not one-time.
• Thesectionon2005-2006mentionsnoone-timerevenueincreases.
• Thesectionon2006-2007mentionsone-timerevenuedecreases,but no increases.
• Thesectionon2007-2008mentionsalong-termrevenueincrease related to new TFF arrangements and a resulting one-time corporate tax adjustment that offsets earlier write-downs of corporate income tax.
24 Minister’s Statement (February 7, 2008) at p.2 http://www.fin.gov.nt.ca/documents/Ministers%20statement%20fiscal%20update%20Feb%202008222.pdf (accessed April 16, 2008).
25 “Public Accounts of the Government of the Northwest Territories for the Year Ended March 31, 2007 [and for years 2006 and 2005]: Section I Consolidated Financial Statements - Statement of Operations and Accumulated Surplus,” available at http://www.fmbs.gov.nt.ca/expenditures/public_accounts/index.htm (accessed April 16, 2008).

Park land Inst i tute • May 2008
10
Thus, the detailed annual discussions in the EFF do not appear to support the claim that “each year, one-time revenues improved the situation.” Rather it appears that, quite simply, revenue growth has been outpacing expenditure growth.
Capital Spending
Although there is nothing on the GNWT website describing the cuts, much less explaining the math behind the cuts, some news stories imply that the Government’s desired future capital investments are at the root of the cuts.26 The EFF projects capital investments of somewhat over $100 million per year through 2011-12,27 and this is the same order of magnitude as the proposed cuts ($135 million).
Significant infrastructure spending is often warranted in an economy set to grow aggressively, as is the case in the NWT. However, it is unclear whether all of the spending anticipated is for general public benefit or for private benefit. For instance, would a road leading to a mine be primarily for the benefit of the general public or primarily for the benefit of the mine owners? Examining the rationale behind each of the investments (and thus their defensibility) at this level of detail is beyond the scope of this paper. However, if capital investments are driving proposed cuts to public services, the Government should be making it clear to the public which new investments are being financed by the cuts, and why each of those investments needs to be made using public funds.
Assuming that all the investments are for legitimate public purposes, the issue is then whether the investments are affordable. Certainly investments on the order of $100 million per year are substantial. However, as will be seen below, Government revenues in future years appear set to rise substantially.
Finally, one would think that if the Government had a long-term “structural deficit” and was perpetually sliding toward actual deficit and growing debt, investment houses would take notice. However, in late 2006, Moody’s Investor Services issued the GNWT an Aa1 credit rating. It appears that Moody’s considers the GNWT financial picture to be fairly healthy.
26 CBC News “135 gov’t jobs on the line in N.W.T. budget cuts: minister” (CBC News, Feb. 29, 2008) http://www.cbc.ca/canada/north/story/2008/02/29/nwt-cuts.html (accessed April 15, 2008). CBC News, “Roland wants to redirect $135M in N.W.T. spending” (CBC News, Jan 22, 2008) http://www.cbc.ca/canada/north/story/2008/01/22/roland-cuts.html (accessed April 23, 2008).
27 EFF, op.cit. at p.6.

Public Service Cuts in the Northwest Territories: Economic Imperative or Political Choice?
11
Beyond whether the Government’s statements about impending deficits are accurate, there is the issue of an unstated assumption that if there will be a deficit, the solution is to cut spending. For instance, where the EFF addresses potential deficits, the reaction is always the planning of expenditure cuts28 and never the planning of revenue increases.
This reactive stance – to assume that any deficit should be addressed by spending cuts – needs to be recognized for what it is, and for what it is not. As one indicator of what may be driving this reactive stance, when the EFF addresses future expenditures it speaks of “mitigation” of those expenditures.29 The Oxford Dictionary defines “mitigate” as “to make less severe, serious, or painful.” Does the GNWT view supporting health, social services, and education as something “severe, serious or painful?” It appears that values-based judgements could be displacing analysis.
In any event, assuming that deficits must be addressed by spending cuts is not sound financial management. Sound financial management means objectively assessing revenues and expenditures and their trends, and then making an informed decision as to whether to change revenues, or expenditures or both.
A government is not in the same position as an individual on salary. People cannot simply decide to give themselves a raise. In contrast, a government can decide to increase its revenues, when and as needed. Not raising revenues when that decision is warranted is a failure by the government – a replacement of sound financial management by uncritical reaction, whether caused by deficient analysis or service to ideology.
Thus, the question becomes, “can the economy support higher Government revenues?”
28 E.g., at p. 1 under “2004-2005 Budget,” p.3 under “2005-2006 Budget”, p.4 under “2006-2007 Budget”, etc.
29 Op.cit. at p.5.

Park land Inst i tute • May 2008
12
Despite growing surpluses and zero net debt, it is possible that revenues of a given government could decline in the future if the economy were to weaken. This would suggest that, in such a jurisdiction, cutting government spending could be a wise choice. So the question becomes: is the NWT economy weak?
The GNWT’s “Economic Review & Outlook,” published in February 2008, examines economic development, factors of production, industry performance, etc. In examining economic development, it focuses solely on GDP, stating “Gross Domestic Product (GDP) is the most common measure of economic performance.”30
What is the NWT’s GDP, and what is its trend?
The NWT’s GDP is approximately $4 billion. With its small population, this translates to over $98,000 per capita.31 This is far higher than any other jurisdiction in Canada, and is 40% higher than oil-soaked Alberta. It is more than twice the national average. If the NWT were a sovereign country, it would compete with Luxembourg for highest GDP per capita in the world.32
The NWT Economy: Strong and Growing
30 “Economic Review & Outlook 2007 - Investment and Economic Analysis (GNWT Industry, Tourism and Investment, February 2008) at p.2 http://www.iti.gov.nt.ca/main/pdf/FINAL%20Feb08.pdf (accessed April 15, 2008).
31 Statistics Canada CANSIM Tables 384-00013; 051-00011.
32 For international GDP per capita levels, see International Monetary Fund “World Economic and Financial Surveys - World Economic Outlook Database, October 2007 Edition” http://imf.org/external/pubs/ft/weo/2007/02/weodata/weoselgr.aspx (accessed April 20, 2008).
$100,000
$90,000
$80,000
$70,000$60,000
$50,000
$40,000
$30,000
$20,000
$10,000
$0
Can
ada
Nfl
d &
Lab PE
I
No
va S
coti
a
New
Bru
ns
Qu
ebec
On
tari
o
Man
ito
ba
Sask
Alb
erta BC
Yu
kon
NW
T
Nu
nav
ut
Source of data: Statistics Canada CANISM Tables 384-00013; 051-00011
Figure 3. GDP/person: Canada Average, and Provinces and Territories
Public Service Cuts in the Northwest Territories: Economic Imperative or Political Choice?
13
As for GDP trend, the “Economic Review & Outlook” notes a significant long-term upward trend: GDP increased by 67% between 1999 and 2006. As noted in the Government’s most recent “Economic Review,” since division of the former NWT in 1999 “the NWT has experienced the highest cumulative economic growth of any jurisdiction in the country.”33
Moreover, future GDP will likely be significantly higher. The most recent GNWT Economic Brief notes that with the Snap Lake diamond mine entering production in late 2007, GDP is expected to increase by $400-500 million, i.e. at least 10%.34
Beyond this, there are other mines planned, as well as gas developments. The Economic Brief points out that five mineral mines are slated for development and production by 2011, with another three after that. 35 The “Economic Review & Outlook” states:
Major new investments are planned over the next five years, including $15-30 billion in development of the Mackenzie Gas Project, plus another $2-3 billion in new mine development.
What will be the result of this new investment? The “Economic Review & Outlook” states:
With new mining developments, GDP could increase by three quarters of a billion dollars over the next five years. Development of the Mackenzie Gas Project could increase GDP by a further 1-2.5 billion (depending on production).36
Thus, GDP can be expected to grow significantly over the coming four or five years. The GNWT’s own figures suggest possible total growth in the range of 28-93% ($1-$3.25 billion), for a GDP level in the range of $4.5-$6.75 billion. The GNWT Bureau of Statistics estimates that by 2014, GDP will more than double the current $4 billion to rise above $8 billion.37
A recent Statistics Canada report confirmed that the strong upward trend in GDP continues, noting that the NWT’s real (i.e. inflation adjusted) GDP rose by 13.1% in 2007, the highest rate of growth in Canada,38 and significantly higher than the 9-10% growth of China.39
33 GNWT, “2007-2008 Budget Address, Budget Papers - Economic Review”, at p. A1 http://www.fin.gov.nt.ca/documents/2007-08%20Budget%20Address%20and%20Review%20Papers.pdf (accessed April 18, 2008).
34 GNWT Industry Tourism and Investment, “Economic Brief July 2007) at p.1 http://www.iti.gov.nt.ca/publications/2007/businesseconomicdevelopment/economicbrief10.pdf (accessed April 23, 2008).
35 Ibid at p.2.
36 “Economic Review & Outlook 2007 - Investment and Economic Analysis op.cit. at p.2.
37 “NWT Economic Update and Forecast” at p.21
http://www.stats.gov.nt.ca/Statinfo/Economic/Economic%20update%20and%20forecast_NOV2007.pdf (accessed April 29, 2008).
38 Statistics Canada, “The Daily - April 28, 2008” http://www.statcan.ca/Daily/English/080428/d080428a.htm (accessed April 29, 2008).
39 The Economist Intelligence Unit, “Country Briefings - China Forecast” (April 10, 2008) http://www.economist.com/countries/china/profile.cfm?folder=Profile-Forecast (accessed April 29, 2008).

Park land Inst i tute • May 2008
14
Although the “Economic Review & Outlook” relies solely on GDP as an indicator of economic health, GDP does not present the entire picture. Corporations from other jurisdictions can siphon wealth from the NWT, and contractors and some workers can reside elsewhere. It is important to bear in mind that the economy of a region should be seen as serving the people of that region, not the reverse. Thus, another often-used indicator is employment, which more tangibly reflects the impact of a region’s economy on its people.
Employment in the NWT is high and rising. In November 2007, the NWT Bureau of Statistics noted that during “the past six years, the NWT employment rate has been significantly higher than the Canadian average, and is generally the highest in Canada.”41 As would be expected, the unemployment rate in the NWT is generally lower than that of Canada as a whole, and the most recent Economic Review notes that unemployment in the NWT was 5.3%, while Canada’s was 6.3%.42 Not surprisingly, the NWT also has the highest average incomes in Canada.43
Indeed, looking at all the economic indicators that the GNWT reports on in the Economic Review, the overall trend has been significant economic improvement. Of eight indicators (GDP, total investment, consumer expenditures, government expenditures, exports, imports, employment, and average weekly earnings)44 over the four year period covered, increases were reported 30 times out of 32.45
14%
12%
10%
8%
6%
4%
2%
$0
N.L
P.E.
I.
No
va S
coti
a
New
Bru
ns.
Qu
ebec
On
tari
o
Man
ito
ba
Sask
Alb
erta
B.C
.
Nu
nav
ut
N.W
.T.
Yu
kon
Can
ada
Source of data: Statistics Canada40
Figure 4. Real GDP Growth in 2007
40 Statistics Canada, “The Daily - April 28, 2008” http://www.statcan.ca/Daily/English/080428/d080428a.htm (accessed April 29, 2008).
41 “NWT Economic Update and Forecast” at p.14
http://www.stats.gov.nt.ca/Statinfo/Economic/Economic%20update%20and%20forecast_NOV2007.pdf (accessed April 29, 2008).
42 GNWT, “2007-2008 Budget Address, Budget Papers - Economic Review”, op.cit. at p. A3.
43 “Economic Review & Outlook 2007 - Investment and Economic Analysis op.cit. at p.1.
44 CPI was also covered; it stayed within the range of 1.3% to 1.3%.
45 The only two downward statistics were exports in 2005 and 2006. 2007 exports were projected to resume increasing, and with new mines opening and being built, this temporary decrease is not likely to recur anytime soon. 2006 indicators were estimated, and 2007 indicators were forecast: GNWT, “2007-2008 Budget Address, Budget Papers - Economic Review”, op.cit. at p. A2.

Public Service Cuts in the Northwest Territories: Economic Imperative or Political Choice?
15
In sum, it appears that the economy of the NWT is very strong and growing, and will continue to grow. As Minister of Finance and Premier Floyd Roland said in his 2007 budget address, the economic growth in coming years will be “enormous ... unprecedented.”46 There is no basis for concluding that the economy is so weak as to jeopardize future revenues.
Future Government Revenues Despite this comfortable economic picture, the Government is projecting significant reductions in revenues. In the most recent budget documents, the Government forecast total revenues for 2008-2009 dropping by $31 million to $1.200 billion, and for 2009-2010 to remain below the 2007-2008 level.47 The federal contributions for these periods are set out by the federal Department of Finance,48 and subtracting federal funding from total revenues would determine own-source revenues. For these two years’ total revenue projections to come true, GNWT own-source revenues would need to drop by $44 million and $41 million – a drop-off of 11-12%.
Considering the strength of the economy, such a drop would seem very unlikely. The GNWT Department of Industry, Tourism and Investment notes that planned development of natural gas and continued development of the diamond industry “ensure strong economic growth.”49
This growth means more jobs. The Government’s own figures suggest that for the non-renewable resource sector alone “new development over the next five years could add $2 billion to investment while creating approximately 1,900 new jobs.” 50 The Department of Industry, Tourism and Investment states, “It is estimated future projects will create approximately 350,000 person years of direct, indirect and induced employment.”51
Both the increased level of economic activity and the increases in employment should result in higher – not lower – tax revenues. Even without changing tax rates, own-source revenues could increase significantly. As noted above, the Government projects 28-93% GDP growth in the next four or five years. If the ratio of Government revenues to GDP is stable over that same period, the GNWT’s own-source revenues could increase significantly, with total revenues increasing by approximately $32 million to $107 million.52 As noted above, by 2014 GDP is estimated by the Bureau of Statistics to double, and thus the total revenues could be $115 million higher.
46 GNWT, “2007-2008 Budget Address, Budget Papers”, op.cit. at p. 2.
47 GNWT, “2007-2008 Budget Address, Budget Papers - Fiscal Review”, op.cit. at p. B7.
48 Department of Finance, Canada “Federal Transfers to Provinces and Territories: Major Federal Transfers to the Northwest Territories” http://www.fin.gc.ca/FEDPROV/mtpe.html#NorthwestTerritories (accessed April 16, 2008).
49 Emphasis added. GNWT Industry, Tourism and Investment, “Northwest Territories Economic Fact Sheet,” p.2 http://www.investnwt.com/marketresearch.html (accessed April 20, 2008).
50 “Economic Review & Outlook 2007 - Investment and Economic Analysis op.cit. at p.11 http://www.iti.gov.nt.ca/main/pdf/FINAL%20Feb08.pdf (accessed April 15, 2008).
51 GNWT Industry, Tourism and Investment, “Northwest Territories Economic Fact Sheet,” p.2 http://www.investnwt.com/marketresearch.html (accessed April 20, 2008).
52 2006-2007 own-source revenues were $382 million: “Public Accounts of the Government of the Northwest Territories for the Year Ended March 31, 2007 - Section I Consolidated Financial Statements” op.cit. at p.12. At a 28-93% increase, and with the EDI permitting the GNWT to retain 30% as total increase in revenues, the increase would be $382m x (.28 to .93) x .3 =$32.1m to $106.6m.

Park land Inst i tute • May 2008
16
In February 2008, the federal government announced that the NWT will be receiving $185.8 million over seven years ($26.5 million per year) to build bridges, airports and water systems.53 Under the same agreement, an additional $60 million ($8.6 million per year) will flow to communities in the NWT to finance infrastructure investment, for a total of $245.8 million, or $35 million per year, of federal money to support infrastructure investment in the NWT.
The details are available on the federal government’s website,54 but the agreement appears not to be mentioned on the GNWT’s website.55 It is remarkable that a significant infrastructure funding agreement would not be mentioned on the GNWT website, especially as the GNWT prepares spending cuts that apparently result from its desire to increase infrastructure investment.
So instead of a drop in revenues of $31 million, revenues could well increase. In four or five years, this increase could be $32 million to $107 million, and by seven years it could be $115 million. And federal infrastructure funding of $35 million per year for that whole period would be available to the NWT. Altogether these funds would go a long way toward funding the capital investment projected for the coming years, perhaps covering the entire amount needed without cutting program spending or raising taxes. If additional, bridge financing of capital investment is required before these resources fully ramp up, debt financing could be employed. The $300 million cap on GNWT borrowing was increased to $500 million in the spring of 2007, and the $98 million in available borrowing capacity rose to $298 million56
While government publications aimed at potential investors are clear about future increases in GDP,57 the EFF document, which makes the case for cuts, is completely silent about it and other indicators of economic health.58 Likewise, the Medium-Term Outlook59 presented in the most recent budget papers is silent about anticipated GDP increases and the impact they could have on revenues.
One possible explanation for the Government’s gloomy revenue predictions, in the face of major GDP increases, is that the Government is quietly considering further tax cuts. This would be unfortunate for the people of the NWT, many of whose lives would be needlessly affected by the cuts. It would also constrain the options for future public investments.
If the Government is not considering tax cuts, it must be assuming that existing sources of revenue will diminish. Again, this is unlikely considering the magnitude of economic growth the Government
53 CBC News, “Ottawa gives N.W.T. $245M for infrastructure” (Feb 21, 2008) http://www.cbc.ca/canada/north/story/2008/02/21/nwt-infra.html (accessed April 23, 2008).
54 Building Canada, “Canada and the Northwest Territories Sign $245 Million Infrastructure Agreement” http://www.buildingcanada-chantierscanada.gc.ca/media/news-nouvelles/2008/20080221yellowknife-eng.html (accessed April 29, 2008).
55 The announcement was not to be found on the Department of Finance website, which had announced the Government’s EFF document two weeks earlier, and information on the Federal Budget six days later. The Government’s search facility did not turn up any mention of it as of April 29, 2008: http://google.gov.nt.ca/search?q=%24245&site=All_GNWT&entqr=0&ud=1&sort=date%3AD%3AL%3Ad1&output=xml_no_dtd&ie=UTF-8&oe=UTF-8&client=GNWT_MAIN&proxystylesheet=GNWT_MAIN
56 “Public Accounts of the Government of the Northwest Territories for the Year Ended March 31, 2007 - Government Indicators” op.cit. at p.8.
57 E.g. GNWT Industry Tourism and Investment, “Economic Brief July 2007) http://www.iti.gov.nt.ca/publications/2007/businesseconomicdevelopment/economicbrief10.pdf (accessed April 23, 2008); “Economic Review & Outlook 2007 - Investment and Economic Analysis” op.cit.
58 E.g., the EFF document, op.cit.
59 GNWT, “2007-2008 Budget Address, Budget Papers - Fiscal Review”, op.cit. at pp. B6-7.

Public Service Cuts in the Northwest Territories: Economic Imperative or Political Choice?
17
projects. However, if it were the case, the fact remains that the GNWT can raise its revenues. As noted earlier, the GNWT sets its own tax rates, and can increase or decrease its tax revenues at will.
Potential Sources of Additional RevenueThis report does not argue that tax rate increases are needed.60 It appears that projected economic growth, given constant tax rates, could well provide additional revenues needed to forestall the public service cuts.
However, given that the economy is strong and could sustain higher government revenues if they turned out to be needed, the next question is what sorts of instruments could raise those revenues?
The GNWT currently obtains tax revenues from:
• corporateincome; • personalincome; • fuel; • tobacco; • payroll; • propertyandschooluse;and • insurance.
Together, these sources contributed $230 million in revenue to the 2006-2007 fiscal year, or 60% of own-source revenues. Tax reform would be possible in any of these areas and could yield significant additional revenues.
Areas especially worthy of consideration for potential tax increases include those where GNWT tax rates are lower than those in other parts of Canada. For instance, average tax rates for provinces and territories across Canada exceed the following GNWT rates by the amounts noted:
• largecorporationsincometax–nationalaverageis9%higher than GNWT rate
• combinedtoppersonalincometaxrate–nationalaverage6% higher than GNWT rate
• fueltaxes: * gasoline – national average is 33% higher than GNWT rate * gasoline (off highway)61 - national average is 122% higher than GNWT rate * diesel – national average is 58% higher62 than GNWT rate
60 That determination would require detailed analysis of the individual tax instruments, which is beyond the scope of this report. However, this report also does not recommend reducing taxes, which would require the same detailed analysis, lest it lead to long-term deficits and inflation (when the economy is expanding as rapidly as it is, inflation is a very real threat).
61 In NWT and Nunavut, the off-highway rate applies in areas without highways: Natural Resources Canada, “Taxes on Petroleum Products” (January 2008) at note g) http://fuelfocus.nrcan.gc.ca/fact_sheets/table1_e.cfm (accessed April 28, 2008).
62 GNWT, “2007-2008 Budget Address, Budget Papers - Fiscal Review”, op.cit. at p. B17.

Park land Inst i tute • May 2008
18
Looking first at corporate taxes, it should be noted that the Government in 2006 reduced the large corporations income tax rate from 14% to 11.5%, making it the third-lowest rate in Canada.66 For large corporations, a surtax on high profits could be instituted.
Royalties
Currently, unlike provincial governments, the GNWT does not directly receive royalties from resource extraction. According to the 2007 budget address, in 2005-2006 the federal government received $244 million in oil and gas and diamond royalties.63 It is clear that diamond mining and fossil fuel developments in the Liard and Mackenzie Valley could yield substantial additional royalties.
The GNWT and the federal government are in negotiations about the NWT directly obtaining those royalties. However, it is far from clear that any new fiscal arrangement would result in greater overall revenues for the GNWT. The federal government would likely reduce its grants (or eliminate them) to compensate for transferring royalty collection capacity to the GNWT. Currently the federal government provides the GNWT more money per person than it raises from the NWT ($18,000 vs. $16,000).64
In any event, these royalties are not the solution to short-term budget needs. Non-renewable resource royalties should not be used to finance ordinary government operations; they should be financed with sustainable revenue sources such as taxes. Because royalties are derived from natural capital stocks, they should be converted to financial capital, and saved in a permanent trust fund that would yield revenues needed in future years when the natural capital is depleted.65
The GNWT’s top combined marginal personal income tax rate is the fourth-lowest in Canada.67 There is room to increase this rate; as noted above, NWT incomes are the highest in Canada. For high-income individuals, a new top tax bracket could be created, with a higher marginal tax rate. Alternatively a surtax on high incomes could be instituted.
Fuel tax rates are substantially below the Canadian average. Even if additional revenues are not required to balance the budget, higher fuel taxes should be considered in order to control pollution and conserve resources.68
63 GNWT, “2007-2008 Budget Address”, op.cit. at p. 10.
64 Idem.
65 For elaboration on this idea, see “Saving for the Future: Fiscal Responsibility and Budget Discipline in Alberta” (Parkland Institute, April 2008) http://www.ualberta.ca/PARKLAND/research/studies/SavingForTheFuture.pdf (accessed April 24, 2008).
66 GNWT, “2007-2008 Budget Address, Budget Papers - Fiscal Review”, op.cit. at p. B17.
67 GNWT Department of Finance, “NWT Tax Information - Corporate Income Tax” http://www.fin.gov.nt.ca/CIT.shtml (accessed April 18, 2008).
68 A fuel tax could be phased in slowly over time, with a pre-set, annual tax rate escalator. This would give individuals and firms time to prepare and make the best choices around such things as vehicle purchases, building energy retrofits, etc. A portion of the fuel tax increase could be used to reduce its financial impact on lower income residents, e.g. through income tax measures and program spending unrelated to fuel use.

Public Service Cuts in the Northwest Territories: Economic Imperative or Political Choice?
19
A further source of increased revenues could come from the GNWT’s Liquor Revolving Fund, which generates a surplus on the purchase and sale of alcoholic beverages. The fund contributed over $21 million to GNWT coffers last year,69 which is close to the level of revenues obtained from fuel taxes.
In addition to the possibility of increasing revenue from the above sources, the GNWT could also consider creating new taxes, for example on retail sales and on capital. The GNWT currently has no retail sales tax, and yet it has clear legislative authority to tax retail sales,70 and this could generate substantial revenues.71
The federal government has traditionally levied capital taxes on large corporations. And in 2006 it created tax room for provincial and territorial governments to levy capital taxes by eliminating its own capital taxes.
69 Northwest Territories Liquor Commission, “Financial Statements 2006-2007” (March 31, 2007) at p.3, available at http://www.fmbs.gov.nt.ca/documents/expenditures/pubaccount/2006-07pa.pdf in Section III Supplementary Financial Statements (accessed April 29, 2008).
70 NorthWest Territories Act, (R.S., 1985, c.N-27) s.16(a) http://laws.justice.gc.ca/en/showdoc/cs/N-27/bo-ga:l_I-gb:s_16//en#anchorbo-ga:l_I-gb:s_16 (accessed April 21, 2008).
71 The GNWT would need to study whether, and to what extent, such a tax could reduce sales from locally-owned retail stores. The assertion that it would drive sales to southern retailers would need to be backed up with realistic numbers, and weighed against the increased revenues that the tax would provide.
72 A similar but distinct issue is “transfer pricing”. Corporations with subsidiaries in different jurisdictions can “purchase” outputs from their subsidiaries at non-market prices, thus recording profits in low-tax jurisdictions, and losses in high-tax jurisdictions. See OECD Centre for Tax Policy Administration, “Transfer Pricing Resources” http://www.oecd.org/department/0,2688,en_2649_33753_1_1_1_1_1,00.html (accessed April 29, 2008).
73 See, for example, the discussion in Hugh MacKenzie, “The Art of the Impossible: Fiscal Federalism and Fiscal Balance in Canada” (CCPA, July 2006) at pp.50-51 http://www.policyalternatives.ca/documents/National_Office_Pubs/2006/Fiscal_Federalism.pdf (accessed April 30, 2008).
74 The higher tax rate would be partially absorbed by firms as it drives up gross salaries, thus reducing “leakage” of revenues out of the NWT. The rebate would offset the impact of the tax on NWT residents.
75 For more on this, see D. Gibson, “Selling Albertans Short: Alberta’s Royalty Review Panel Fails the Public Interest” (Parkland Institute, October 2007) at p.12 http://www.ualberta.ca/PARKLAND/research/studies/OilRoyaltyReport(web).pdf (accessed April 23, 2008).
A frequently heard objection to the idea of raising tax revenues is that businesses will relocate in other jurisdictions. 72 In reality, this has to be judged on a case-by-case basis, and it depends on a range of operational, taxation, and other considerations bearing on both revenues and costs. In the case of industries in which many jurisdictions can compete on key inputs costs – e.g. labour-intensive industries like call centres - corporate relocation is a serious issue (and a reason to develop mechanisms to prevent policy competition).73 However, it is important to remember that the key input for much of the NWT’s economy – the non-renewable resources – are not going anywhere.
Thus tax avoidance can be reduced by carefully adjusting various taxes to maximize revenues and prevent leakage. For instance, instead of simply increasing the taxation of declared corporate income, the Government could carefully design increases in taxation of corporate income and corporate activities that occur locally, e.g. capital spending, or purchase of labour. For instance, the payroll tax could be raised significantly, with a portion of the proceeds being rebated to residents of the NWT.74
It remains to those asserting that a particular business would leave in order to avoid taxes to present the numbers to support that assertion. There is an obvious financial incentive to exaggerate such claims, and without numbers to back them up, many could be little more than empty threats.75
Park land Inst i tute • May 2008
20
Another potential source of revenue lies in addressing the NWT’s greenhouse gas emissions. Taxes on carbon emissions are now supported by a wide range of Canadian researchers and policy commentators,76 financial institutions,77 and industry associations (including both the Canadian Association of Petroleum Producers78 and the Canadian Gas Association79). They can reduce greenhouse gas emissions while providing a significant source of government revenue.
Other Canadian jurisdictions are already adopting carbon taxes, following the lead of many European countries. Québec started the trend in late 2007 with a modest carbon tax80 and in February 2008, BC passed a carbon tax in its budget legislation.81 In March, Alberta instituted an industrial carbon tax82 and in April, Manitoba announced plans for a carbon tax on coal-burning facilities.83 A recent study found that a carbon tax could raise $50 billion per year across Canada.84 Given its proportion of Canada’s greenhouse gasses emitted,85 such a carbon tax in the NWT would raise long-term revenues this year on the order of $100 million per year.86 Even a modest carbon tax, such as that adopted by BC and phased in over four years, could yield $100 million per year for the GNWT.87
In any event, this report does not make the recommendation that the GNWT raise its tax rates or create new taxes. Considering the level of economic growth in the NWT, merely maintaining existing tax rates will likely result in significantly increased revenues over the coming four years. However, if the need for higher revenues did arise, the tax instruments are available.
76 E.g., “Economists urge Ottawa to adopt National Carbon Tax” (Financial Post, April 9, 2008) http://www.financialpost.com/story.html?id=433660 (accessed April 17, 2008); Conference Board of Canada, “Use Green Taxes and Market Based Instruments to Reduce Greenhouse Gas Emissions” http://www.conferenceboard.ca/documents.asp?rnext=2426 (accessed April 17, 2008).
77 E.g., TD Bank Financial Group “Market-Based Solutions to Protect the Environment” http://www.td.com/economics/special/bc0307_env.pdf (accessed April 17, 2008).
78 “Petro-Giants will Accept a Carbon Tax” (Georgia Straight, Dec. 6, 2007) http://www.straight.com/article-123594/petro-giants-will-accept-a-carbon-tax (accessed April 17, 2008).
79 “CGA Calls BC Carbon Tax a Breakthrough in Addressing Climate Change” (Canadian Gas Association, Feb 21, 2008) http://www.cga.ca/documents/CGAReleaseFeb21.pdf (accessed April 17, 2008).
80 “Carbon Tax Comes into Effect” (Montreal Gazette, October 1, 2007) http://www.canada.com/montrealgazette/news/story.html?id=32b19510-c038-4484-a795-136c36932f2a&k=49634 (accessed April 17, 2008).
81 “BC Introduces a Carbon Tax” (Vancouver Sun, February 19, 2008) http://www.canada.com/topics/news/story.html?id=ecea1487-507c-43ef-ab88-5a972898e0b7&k=38130 (accessed April 17, 2008).
82 “Go figure -- a carbon tax crafted right here at home” (Calgary Herald, March 09, 2007) http://www.canada.com/calgaryherald/columnists/story.html?id=8c3c9760-7cbe-4fab-b00c-1c77243903b6 (accessed March 12, 2008).
83 “Manitoba Plans Coal Emissions Tax” (Energy Analects, April 10, 2008) http://www.energyanalects.com/issues/extra.asp?article=080410%2FEA2008_AA0001.html (accessed April 17, 2008).
84 Nic Rivers and Dave Sawyer, “Pricing Carbon, Saving Green: A carbon price to lower emissions, taxes and barriers to green technology” (M.K. Jaccard and Associates and EnviroEconomics, 2008) http://www.davidsuzuki.org/files/reports/Pricing_Carbon_saving_green_eng.pdf at p.8 (accessed March 12, 2008).
Public Service Cuts in the Northwest Territories: Economic Imperative or Political Choice?
21
85 GNWT estimates approximately 1,750 kilotonnes CO2 emissions, and projects significant increases that would at least double emissions within the next 3 years. “NWT Greenhouse Gas Strategy 2007-2011” at p.9, 10 (Chart #2) http://www.enr.gov.nt.ca/eps/pdf/GHG_Strategy-FINAL-070313.pdf (accessed April 29, 2008). Canada’s emissions in 2005 were 747 MT Environment Canada, “National Inventory Report, 1990-2005: Greenhouse Gas Sources and Sinks in Canada, Section 2 Greenhouse Gas Emission Trends, 1990-2005” http://www.ec.gc.ca/pdb/ghg/inventory_report/2005_report/s2_eng.cfm#s2_1 at s.2.1
86 Assuming $50 billion tax revenues across Canada, NWT portion would be $50 billion x (1.750MT/747MT) = $117 million. Note that doubling of NWT CO2 emissions would dramatically increase revenues.
87 Assuming 3,500 kilotonnes CO2 emissions by 2012 (“NWT Greenhouse Gas Strategy 2007-2011” at p.9, 10 (Chart #2) op.cit.), and carbon tax rate phased in and increasing to $30/tonne by 2012, revenue = 3.5 million tonnes x $30 / tonne = $105 million.
The GNWT is proposing public service cuts that will affect not only public employees and their families, but also the recipients of those services and the wider community. The Government pleads financial hardship, yet its own numbers suggest that the Government’s finances are solid: its net debt is at or near zero and its revenues and surpluses have been growing.
Moreover, the underlying economy of the NWT is strong. All the indicators show a strong economy, and GDP appears set to grow substantially in the coming years. This economic growth will bring jobs and added revenues for the Government. These revenues should be enough to cover any needed infrastructure investments. If those added revenues turned out to be insufficient in a few years time, the economy is strong enough that government could then raise any number of taxes.
Given this, any decision to cut spending and jobs must been seen for what it is – a political decision, not an economic necessity. Given the harm that such a decision would cause, and the fact that it is not necessary, the Government should cancel the planned cuts, and conduct a detailed re-examination of its financial outlook, taking into account the truly “enormous... unprecedented” growth that the NWT is set to experience.
Conclusions

Park land Inst i tute • May 2008
22

Public Service Cuts in the Northwest Territories: Economic Imperative or Political Choice?
5

Park land Inst i tute • May 2008
6
11045 Saskatchewan Drive,Edmonton, Alberta
T6G 2E1Phone: (780) 492-8558
Email: [email protected]: www.ualberta.ca/parkland
ISBN 1-894949-19-6