new drugs and technologies -...
TRANSCRIPT

Myocardial Contrast EchocardiographyA 25-Year Retrospective
Sanjiv Kaul, MD
Obstacles are those frightful things you see whenyou take your eyes off your goals.
–Anonymous
In 1997, I wrote an invited review on myocardial contrastechocardiography (MCE) entitled “Myocardial Contrast
Echocardiography: 15 Years of Research and Development”in the From-Bench-to-Bedside section of Circulation.1 Then,in 2003, Hiroshi Ito and I wrote a 2-piece invited reviewentitled “Microvasculature in Acute Myocardial Ischemia:Evolving Concepts in Pathophysiology, Diagnosis, and Treat-ment” in the Clinical Cardiology: New Frontiers section ofCirculation.2,3 In this review for the New Drugs and Tech-nology section of Circulation, I will provide a 25-yearretrospective on MCE but with emphasis on more recentdevelopments and remaining challenges for the field. I willlimit myself to myocardial imaging and will not discussimaging of other organs or the vascular system. Likewise, Iwill not address the therapeutic applications of microbubble-ultrasound interactions such as drug and gene delivery orsonothrombolysis.
I have organized this review into 7 sections. I begin bybriefly describing some historical and technical elements sothat the reader unfamiliar with MCE will be able to follow therest of the review. I then describe the more recent studiesrelating to the role of MCE in the diagnosis and prognosti-cation in acute coronary syndromes and chronic coronaryartery disease (CAD), followed by assessment of myocardialviability in chronic CAD. After that, I describe advances insite-targeted or molecular imaging and certain miscellaneousfindings. Finally, I discuss the remaining challenges of MCEfrom a clinical adoption point of view.
Some Historical and Technical ElementsInitial MCE studies were performed in dogs to define in vivothe area at risk during acute coronary occlusion with the useof hand-agitated solutions.4–9 Shortly thereafter, the tech-nique of sonication was described, which allowed the pro-duction of smaller microbubbles,10 and was rapidly adoptedfor intracoronary injections in animals and humans.11–13
Subsequently, the first commercial agent (Albunex) wasdeveloped by sonication of 5% human albumin solution, andit produced excellent myocardial opacification on intracoro-
nary injection.14 It therefore came as a surprise to many whenthis agent was not that successful in opacifying the leftventricular (LV) cavity after intravenous injection.15
The gas contained in Albunex microbubbles was air that,being highly diffusible, leaked out of the microbubbles asthey crossed the pulmonary circulation, thus reducing theirsize. Also being highly soluble, the air dissolved in bloodvery rapidly after leaking out. Because the acoustic backscat-ter from a bubble is related to the sixth power of its radius,even modest changes in bubble size can result in largechanges in backscatter, which explained the poor LV cavityopacification after intravenous administration of Albunex. Toovercome this limitation, the air in the bubble was changed tohigher-molecular-weight gases (such as fluorocarbons) thatresulted in more stable bubbles. Being insoluble in blood, thegas, even when it had escaped from the bubble, continued toproduce effective ultrasound backscatter by acting as a freegas bubble.16,17 These new preparations were highly success-ful in opacifying the LV cavity and the myocardium from avenous injection. Table 1 lists the various commerciallyprepared microbubble agents. The 2 currently available in theUnited States (Definity and Optison) have been approvedonly for LV cavity opacification. No agents have thus farbeen approved for myocardial opacification in the UnitedStates.
There are salient features common to most of the commer-cially produced ultrasound contrast agents. The microbubblesin these agents do not aggregate, are biologically inert andsafe,18,19 remain entirely within the vascular space,20,21 havean intravascular rheology that is very similar to that oferythrocytes,20–22 respond nonlinearly to ultrasound,23–25 andare eliminated from the body via the reticuloendothelialsystem with their gas escaping from the lungs.
A key technical advance in MCE was online signalprocessing of ultrasound backscatter from insonified micro-bubbles.26 Before that, it was not possible to separate bubblesignals from myocardial backscatter without offline imageprocessing.27 Unlike tissue, microbubbles are compressibleand oscillate in an ultrasound field. At even a low mechanicalindex, these oscillations become nonlinear, that is, duringeach oscillation the microbubbles expand more than theycontract. The term nonlinear in this context means that theoutput of a system does not match the input. In other words,
From the Division of Cardiovascular Medicine, Oregon Health and Science University, Portland, Ore.Correspondence to Sanjiv Kaul, MD, Division of Cardiovascular Medicine, Oregon Health and Science University, UHN62, 3181 SW Sam Jackson
Park Rd, Portland, OR 97239. E-mail [email protected](Circulation. 2008;118:291-308.)© 2008 American Heart Association, Inc.
Circulation is available at http://circ.ahajournals.org DOI: 10.1161/CIRCULATIONAHA.107.747303
291
New Drugs and Technologies
by guest on June 3, 2018http://circ.ahajournals.org/
Dow
nloaded from

small perturbations can cause large effects.24,25 With the useof novel signal processing techniques, the nonlinear signalsemanating from these oscillating microbubbles can be ampli-fied, and the linear signals can be suppressed, resulting inmyocardial opacification.26 With the use of these approaches,both high–mechanical index intermittent imaging (with theuse of B-mode and power Doppler) as well as low–mechani-cal index continuous imaging are currently being employedfor MCE.
The method for assessing (and quantifying) myocardialperfusion during MCE was described and validated in acanine model a decade ago.28 For this approach, a dilutesolution of microbubbles is administered intravenously as aconstant infusion with the use of a pump device. In a fewminutes, steady state is achieved, at which time theinfusion rate can be adjusted depending on the degree ofattenuation seen in the LV cavity. Ideally, no shadowingshould be seen in the LV cavity on apical views becausewhen shadowing is present, the relation between micro-bubble concentration in the myocardium and ultrasoundbackscatter is no longer linear.28 However, some shadow-ing should be noted in the left atrium to ensure that there
is an adequate concentration of microbubbles in themyocardium at a dose at which the relation betweenmicrobubble concentration and backscatter from the LVcavity is still linear. Then high–mechanical index pulsesare used to destroy microbubbles in the myocardium, afterwhich their rate of myocardial replenishment is measured.Time versus acoustic intensity (AI) curves can be gener-ated from different myocardial regions and fitted to anexponential function: y�A(1�e��t), where y is AI at apulsing interval t, A is the plateau AI, and � is the rateconstant that represents the rate of rise of AI (and thusmean microbubble velocity).28
The unique advantage of this method over other modalitiesfor assessing myocardial perfusion is that it can be used tomeasure both components of tissue perfusion: myocardialblood flow (MBF) velocity and myocardial blood volume(MBV), the latter being denoted by the value A. NormalizingA to the AI value from the LV cavity provides a measure ofMBV fraction.29 The product of MBV fraction and MBFvelocity provides an estimate of MBF. It is preferable to makethese measurements with the use of end-systolic framesbecause at this point in the cardiac cycle most of the larger
Table 1. Ultrasound Contrast Agents
Name Manufacturer Shell GasMean
Diameter, �m Concentration, � mL�1 Comments
Levovist Schering None;stabilizedwith 0.1%palmitate
Air 1.2 1.2–2.0 � 108 when2.5 g is dissolved in
10 mL saline
Available for cardiologicalapplications in 69 countries but
not in the United States
Albunex Molecular Biosystems,Inc
Denaturedhumanalbumin
Air 4.3 0.5 � 109 Approved for LV cavityopacification in the United
States but no longermanufactured
Imagent AlliancePharmaceuticals/IMCOR
Surfactantcoated
Perfluorohexane 5.0 0.5 � 108 Approved for LV cavityopacification in the United
States but no longermanufactured
Optison General Electric Denaturedhumanalbumin
Perflutren 3.0–4.5 5.0–8.0 � 108 Approved for LV cavityopacification in the UnitedStates, Europe, and Latin
America
Sonazoid General Electric Lipid Perflubutane 2.4–2.5 0.3 � 109 Approved in Japan for liveropacification
Definity Lantheus Lipid Octafluropropane 1.1–3.3 1.2 � 1010 Approved for LV cavityopacification in the UnitedStates, Europe, and Latin
America and also radiologicalapplications in Canada
Sonovue Bracco Diagnostics Lipid Sulphurhexafluoride
2.5 5.0 � 108 Available in Europe for LV cavityopacification and radiological
applications
Cardiosphere Point Biomedical, Inc Bilayer: innerpolymer and
outeralbumin
Nitrogen 3.0 2.0–5.0 � 108 Under FDA review for MCE
Imagify Acusphere, Inc Polymer Decafluorobutane 2.3 Gas is 260�25�g � mL�1 of
reconstituted product
Under FDA review for MCE
FDA indicates Food and Drug Administration.
292 Circulation July 15, 2008
by guest on June 3, 2018http://circ.ahajournals.org/
Dow
nloaded from

intramyocardial vessels have been emptied of blood, and themajority of MBV resides in capillaries, which is the site ofnutrient MBF.30 A modified version of this approach was alsovalidated against positron emission tomography (PET) inhumans.31
Figure 1 depicts idealized curves based on previous animaland human studies. The top panel of Figure 1 illustrates timeversus AI curves that are obtained at rest during normal(Figure 1A [top]) and reduced MBF (Figure 1B to 1D [top]),in which the reduction in MBF can be due to a decrease in
Figure 1. Top, Time vs AI curves obtained at rest from normal myocardium (A), infarcted myocardium supplied by a nonstenotic coro-nary artery (B), chronically ischemic (hibernating) myocardium (C), and infarcted myocardium supplied by an artery with a flow-limitingstenosis or collaterals (D). See text for details. Bottom, Time vs AI curves obtained at rest (solid line) and stress (dotted line) duringintracoronary administration of adenosine (A), during intracoronary administration of dobutamine (B), and during intravenous administra-tion of adenosine or dobutamine (C). See text for details.
Kaul 25 Years of Myocardial Contrast Echocardiography 293
by guest on June 3, 2018http://circ.ahajournals.org/
Dow
nloaded from

MBV alone (such as after infarction when the infarct-relatedartery is patent with minimal stenosis; Figure 1B [top]), adecrease in blood velocity alone (such as during subtotalocclusion or total coronary occlusion with collateral flow orhibernating myocardium; Figure 1C [top]), or a combinationof both a decrease in MBV and blood velocity such as is seenin an infarcted myocardium supplied either by an artery witha very severe flow-limiting stenosis or by collaterals (Figure1D). The decrease in MBV in the presence of critical stenosis(Figure 1C [top]) is due to reduced capillary perfusionpressure that results in partial capillary collapse or derecruit-ment.32 The more severe the stenosis, the greater is the fall inperfusion pressure, and the greater is the capillary collapse.This changing capillary resistance with decreasing flow is theprobable reason for the positive zero-filling coronary pres-sure.32 The decrease in capillary blood volume also results ina smaller capillary surface area and a resting perfusion defecton myocardial perfusion imaging with the use of any imagingmodality, including nuclear imaging.33
The bottom panel of Figure 1 illustrates time versus AIcurves obtained from the normal myocardium during rest anddifferent forms of stress. Figure 1A (bottom) depicts curvesbefore and during intracoronary infusion of adenosine inwhich MBV remains constant and blood flow velocity in-creases.28 At rest, the myocardium replenishes in 4 to 5seconds after microbubble destruction. In the presence ofintracoronary adenosine, MBF increases 4 to 5 times solelybecause of an increase in MBF velocity without any changein MBV. Therefore, instead of taking 4 to 5 seconds toreplenish, the myocardium now replenishes in 1 second.
Figure 1B (bottom) shows curves before and during intra-coronary infusion of dobutamine (in which both MBV andvelocity increase34). Figure 1C (bottom) illustrates curvesobtained before and during venous administration of either avasodilator or dobutamine. The increase in MBV duringintravenous compared with intracoronary administration ofadenosine occurs from the increase in myocardial oxygendemand that results from mild systemic hypotension andresultant reflex tachycardia.35 Similar curves can also beobtained during supine bicycle exercise.36
The comparative efficacy of dobutamine and dipyridamolefor coronary stenosis detection was studied in chronicallyinstrumented closed-chest dogs with multivessel coronarystenosis.37 In the presence of either drug, MBV increasedmore in the normal bed than in the abnormal bed, but theincrease was higher in both beds with dobutamine than it waswith dipyridamole. The slope of the relationship betweenMBF reserve and MBV reserve was greater during adminis-tration of dobutamine than with dipyridamole, whereas theconverse was true for MBF velocity reserve. Consequently,the relationship of the ratio of either variable between theabnormal and normal beds was similar for both drugs. Thus,these 2 drugs can be used interchangeably for CAD detectionby MCE.
MCE in Acute Coronary SyndromesAs stated previously, experimental work in MCE began byestablishing its role in defining the presence and size of therisk area during acute coronary occlusion.4–9 It then pro-
gressed to establishing the success of tissue reperfusion aswell as the residual infarct size5,38–41 (via the no-reflowphenomenon), which has been reviewed in great detailpreviously.2,3 MCE was used to document the heterogeneityin resting MBF and MBF reserve in the previously occludedbed and the appropriate timing of imaging for determininginfarct size.41–43 Finally, it was used to assess the presenceand extent of collateral perfusion during acute coronaryocclusion and its influence on myocardial viability.44–46
These studies were followed by similar ones in humans withthe use of intravenous injection of microbubbles.47–52
It had been noted for some time that the circumferentialextent of abnormal wall thickening overestimated that ofinfarction. Several mechanisms were postulated to explainthis behavior, ranging from mechanical tethering53 to inherentlimitations in the methods of analysis used. With the use ofMCE, it has been shown that this disparity is due tocollateral-derived intermediate levels of MBF in the borderzones of the occluded bed that have escaped necrosis and thatthe reduction in function in these border zones is commen-surate with the reduction in resting MBF.54
Recent advances in the management of patients with acutecoronary syndromes with MCE pertain to those patientspresenting to the emergency department (ED) with chest painsyndromes and nondiagnostic ECGs. In the United States, �5million people visit the ED each year with chest pain. Thevast majority is either admitted to the hospital or to a chestpain unit in the ED, but acute myocardial ischemia orinfarction (AMI) is confirmed in only �20%. The initial ECGis diagnostic in fewer than half of the patients with ongoingAMI, and cardiac enzymes do not become positive for severalhours after coronary occlusion. Meanwhile, valuable time islost before definitive therapy can be offered.
A multicenter study compared MCE with single photonemission computed tomography (SPECT) to diagnose AMI inchest pain patients with a nondiagnostic ECG.55 Concordancebetween MCE and SPECT was 77% for all territories with ahigher concordance for the anterior wall (84%). Thirty-eightof the 203 patients in the study (19%) had a cardiac eventwithin 48 hours of ED presentation. On multivariate regres-sion analysis, the number of abnormal segments on MCE andSPECT was a significant predictor of cardiac events. MCEprovided 17% and gated SPECT provided 23% additionalinformation for predicting cardiac events compared withroutine demographic, clinical, and ECG variables that wereavailable in the ED at the time of presentation. Anothersmaller single-center study also reported similar results.56
A large National Institutes of Health–funded single-centerstudy showed even more remarkable results.57 Of the 1017patients studied, 166 (16.3%) had early (within 48 hours)events. Adding regional function assessment by MCE in-creased the prognostic information of the clinical and ECGvariables significantly for predicting these events. Whenmyocardial perfusion assessment was added, further addi-tional information was obtained (Figure 2A). Patients withoutearly events were followed for a median of 7.7 months. Ofthese, 126 had events. The added prognostic value of bothregional function and myocardial perfusion assessments onMCE was similar to that seen for the early events. Patients
294 Circulation July 15, 2008
by guest on June 3, 2018http://circ.ahajournals.org/
Dow
nloaded from

with normal perfusion and function had excellent outcome,whereas those in whom both were abnormal had the worstoutcome. Intermediate outcome was noted in those withnormal perfusion despite abnormal function (Figure 2B).These patients included those with spontaneous reperfusion(approximately one sixth of the AMI patients) and those withnonischemic cardiomyopathies.
Although an elevated troponin level is the gold standard forAMI diagnosis, it may not be elevated or even available at the
time of ED presentation. It is at this juncture that MCE hasbeen shown to be most helpful.58 In this study, a modifiedThrombolysis in Myocardial Infarction (TIMI) score wascalculated from 6 immediately available variables, which didnot include troponin because it was not known at that time.Follow-up was performed for early (within 24 hours), inter-mediate (30 days), and late (after 30 days) events. Themodified TIMI score was unable to discriminate betweenintermediate-risk compared with high-risk patients at anyfollow-up time point, whereas only 2 of 523 patients withnormal regional function on MCE had an early event.Regional function on MCE provided incremental informationover modified TIMI scores for predicting intermediate andlate events. In patients with abnormal regional function,myocardial perfusion further classified those intointermediate- and high-risk groups. The full TMI score (aftertroponin levels became available) could not improve on theseresults at any follow-up time point. Since this study wascompleted, another �1000 patients have been analyzed, and,interestingly, multivariate models derived from the first 1000patients predict early events in these patients with the sameaccuracy.
On the basis of the results of these studies, 2 separateeditorials have strongly recommended the use of MCE inthe ED.59,60
Figure 3A illustrates a case of Tako-Tsubo syndrome inwhich apical ballooning (arrows) is clearly seen in theend-systolic image, but myocardial perfusion is normal. Onthe basis of this study in the ED, the patient was not taken tothe catheterization laboratory, and the regional dysfunctionresolved spontaneously. Although Tako-Tsubo syndromemay be associated with microvascular abnormalities, thesemay be subtle and occur early in the pathogenesis of thesyndrome. Generally, by the time MCE is performed, myo-cardial perfusion is normal.61 Figure 3B shows a patientexamined in the ED for chest pain who not only had an apicaldefect on MCE (thick arrow) but very nicely demonstrated anapical thrombus as well (thin arrow). Contrast echocardiog-raphy has become the gold standard for detecting LV cavitythrombi, which has obvious implications for therapy.
MCE for CAD DetectionIn the absence of prior infarction, the detection of CAD onmyocardial perfusion imaging is based on the occurrence of
Figure 2. A, Incremental value of tests performed for predictionof early events in patients with nondiagnostic ECGs undergoingED evaluation for chest pain.57 D indicates demographics; C,clinical; E, ECG; RF, regional function; and MP, myocardial per-fusion. See text for details. With permission from the EuropeanSociety of Cardiology. B, Adjusted survival probabilities for dif-ferent combinations of regional function and myocardial perfu-sion values for late events (occurring after 48 hours) in patientspresenting to the ED with nondiagnostic ECGs. WM indicateswall motion. See text for details. Modified from Rinkevich et al,57
with permission. Copyright 2005, Oxford Journals Press.
Figure 3. A, Low–mechanical index real-timeMCE showing normal perfusion in a patientwith apical ballooning (arrows) who was seenin the ED for chest pain. B, Low–mechanicalindex real-time MCE showing a dense apicaldefect in a patient with chest pain who experi-enced an AMI (thick arrow). An apical thrombusis also noted (thin arrow).
Kaul 25 Years of Myocardial Contrast Echocardiography 295
by guest on June 3, 2018http://circ.ahajournals.org/
Dow
nloaded from

reversible perfusion defects during pharmacological or exer-cise stress. Experimental studies had previously demonstratedthe ability of MCE to detect coronary stenosis and to quantifythe degree of MBF mismatch during pharmacologicalstress.62–64 Studies also showed that coronary stenosis can bedetected65,66 and abnormal coronary blood flow reserve canbe accurately measured67 with MCE in humans with venousadministration of microbubbles.
The conventional wisdom had been that a reversibleperfusion defect results from MBF mismatch that is seen atstress and not at rest. With the use of MCE, it has been shownthat reversible perfusion defects are actually caused by a
decrease in MBV distal to a stenosis during stress.32 Whenflow increases through a stenosis during stress, the coronaryperfusion pressure falls. To maintain a constant capillaryhydrostatic pressure, capillary derecruitment occurs, leadingto a decrease in MBV. In the case of nuclear tracers, theresultant decrease in capillary surface area causes less traceruptake and hence a perfusion defect.33 Thus, the site ofabnormal flow reserve in CAD is not at the level of thestenosis but actually at the level of the microcirculation.
The decrease in MBV during stress is seen only withmoderate to severe stenosis. With less severe stenosis, theonly abnormality seen on MCE is the inability of the MBF
Figure 4. A, High–mechanical index intermittentpower Doppler images obtained at rest andstress showing normal myocardial perfusion.See text for details. B, High–mechanical indexintermittent power Doppler images obtained atrest and stress showing a reversible defect(arrow). See text for details.
296 Circulation July 15, 2008
by guest on June 3, 2018http://circ.ahajournals.org/
Dow
nloaded from

velocity to increase by the desired amount. As shown in thebottom panel of Figure 1, MBF velocity increases 4 to 5 timesin the normal myocardium during stress. The inability of theMBF velocity to increase by this amount during stressindicates a reduction in MBF reserve. What discriminates theattenuation of flow reserve in the presence of a stenosiscompared with other causes such as hypertrophy, and hyper-lipidemia is its regional nature.67
Figures 4 and 5 demonstrate normal perfusion (top panels)and either a reversible (Figure 4) or a fixed (Figure 5) defect(bottom panels) in patients undergoing dipyridamole stressimaging with the use of Cardiosphere. The imaging protocol
is based on the principles depicted in the bottom panel inFigure 1. At rest, microbubble replenishment should occur in4 to 5 seconds if MBF is normal. Therefore, the rest images(left panels) are captured at the fourth heartbeat after bubbledestruction. If MBF reserve is normal, then at stress themyocardium should replenish within 1 second. Hence, thestress images are captured at the first heartbeat after bubbledestruction (right panels). In the normal setting, these 2images (rest and stress) should look similar (panel A in bothfigures). If there is a significant stenosis in the absence ofprior infarction, the stress image should show a relative defectcompared with the rest image (indicated by arrows in Figure
Figure 5. A, High–mechanical index intermittentpower Doppler images obtained at rest andstress showing normal myocardial perfusion.See text for details. B, High–mechanical indexintermittent power Doppler images obtained atrest and stress showing a fixed defect (arrow).See text for details.
Kaul 25 Years of Myocardial Contrast Echocardiography 297
by guest on June 3, 2018http://circ.ahajournals.org/
Dow
nloaded from

4B). In the presence of infarction, in which MBV is markedlyreduced due to capillary loss, a fixed defect (present at bothrest and stress) should be noted (indicated by arrows in Figure5B). The images shown here were obtained with the use ofpower Doppler, with each wall in each view imaged sepa-rately because of the narrow imaging sector necessary for ahigh-pulse repetition frequency required to minimize motionartifacts.
Figure 6 illustrates rest and stress (dipyridamole) imagesobtained with the use of Imagify. Here the images areacquired with the use of real-time low–mechanical indeximaging. Figure 6A depicts a normal study, whereas Figure6B depicts a reversible lateral defect (denoted by arrows) ina patient with a proximal left circumflex artery stenosis. Inthis particular case, the nuclear scan was entirely normal.
The top panel in Figure 7 depicts MCE and SPECT resultsfrom a multicenter study of 55 patients with an intermediateprobability of CAD who did not have a prior infarction.68
Thus, their resting function and perfusion were normal. Froma clinical perspective, it is in these patients that the ability todiagnose CAD is most relevant. It is evident from the toppanel in Figure 7 that the sensitivity of MCE was higher thanthat of SPECT at mild to moderate levels of stenosis. Thisoccurred because abnormalities in MBF velocity were noted
on MCE even when MBV may not have decreased (seebottom panel in Figure 7 and later discussion), resulting inabnormal MCE images but a normal stress SPECT study.Only at severe levels of stenosis, in which MBV reduction isalmost certain to occur during hyperemia, was SPECTequivalent to MCE. Another reason for the superiority ofMCE over SPECT for detecting mild to moderate stenoseswas the presence of subendocardial perfusion defects on theformer that could not be visualized on the latter because of thepoor spatial resolution of SPECT.
On a coronary circulation basis (anterior and posteriormyocardium), the sensitivity for MCE in this study wassignificantly higher than that of SPECT for the detection ofCAD (86% versus 43%). The specificities of MCE andSPECT, however, were similar (88% and 93%). Both tech-niques were marginally more accurate in the anterior com-pared with the posterior circulation. On a patient basis, MCEhad a higher sensitivity than SPECT for the detection of CAD(83% versus 49%), although specificity tended to be higherfor SPECT than MCE (92% versus 58%). When CAD wasdefined as �40% rather than �50% coronary stenosis onquantitative coronary angiography, the specificity of MCEincreased to 83% without any change in sensitivity.
Several other small studies have compared MCE withSPECT during vasodilator stress,69 and some others havebeen summarized in a meta-analysis showing an overallsuperiority of MCE to SPECT.70 More recently, the results of2 large (a total of 662 patients from 28 centers) phase IIIclinical trials performed to determine the efficacy of Imagifyfor detecting CAD in patients with chronic stable chest paindemonstrated a similar performance for MCE and SPECT.71
Interestingly, in this study wall motion abnormality ondipyridamole stress was much more frequent than reportedpreviously in literature published in the United States. Mostprobably this resulted from a much better assessment ofregional function with contrast in the LV cavity. Because inmost instances even low-dose dipyridamole (0.56 mg · kg�1)causes some degree of hypotension and reflex tachycardia, anincrease in myocardial oxygen consumption is frequent,which can explain the occurrence of wall motion abnormal-ities,72,73 that are much better appreciated when contrast ispresent in the LV cavity.
The ischemic cascade had been demonstrated previously insupply but not demand ischemia.74 This phenomenon wasmore recently demonstrated in demand ischemia as well withthe use of MCE.75 It was shown that in the presence ofnoncritical coronary stenosis, perfusion abnormalities oc-curred earlier than wall motion abnormalities with escalatingdoses of dobutamine. Abnormal perfusion (delayed rate ofmicrobubble replenishment) was seen at the lowest dose ofdobutamine irrespective of the stenosis severity, whereas wallthickening abnormality was seen only at high doses ofdobutamine and was influenced by the stenosis severity. Thebottom panel of Figure 7 illustrates an example of normalwall thickening (Figure 7A) despite abnormal perfusion(denoted by arrows in Figure 7B) in an animal with leftcircumflex artery stenosis during dobutamine infusion. Figure7C depicts the time versus AI curves, showing delayed fillingin the left circumflex coronary artery bed. In this study, even
Figure 6. A, Low–mechanical index real-time images obtainedat rest and stress showing normal myocardial perfusion. Seetext for details. B, Low–mechanical index real-time imagesobtained at rest and stress showing a reversible defect (arrow).See text for details.
298 Circulation July 15, 2008
by guest on June 3, 2018http://circ.ahajournals.org/
Dow
nloaded from

when wall thickening abnormality occurred in single-vesselstenosis, it was less in extent than the perfusion defect.
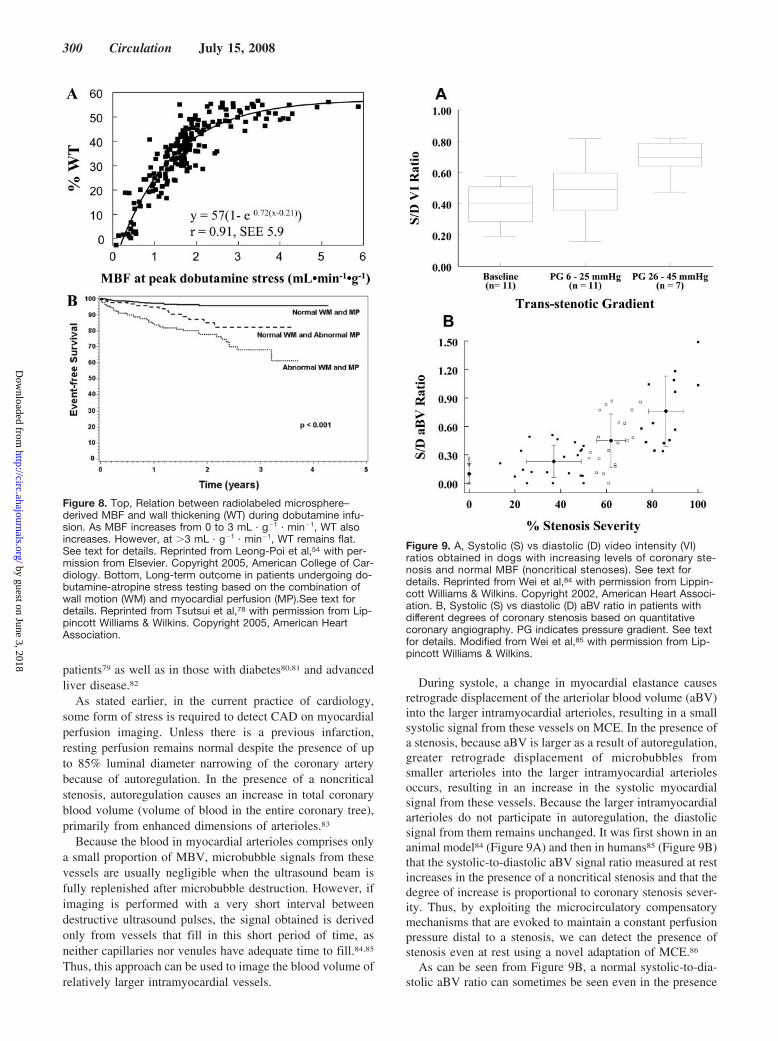
Another series of experiments demonstrated that the mech-anism of the disparity in the circumferential extent of abnor-mal wall thickening and perfusion defect during demandischemia (the former being significantly less than the latter)was due to the presence of collateral MBF in the border zonesof the ischemic bed.54 It was shown that at higher levels ofMBF (�3 times normal), the relation between MBF and wallthickening was flat (Figure 8A). Thus, regions at the borderssupplied with collateral flow that did not experience as muchhyperemia as the remote normal beds nonetheless continuedto exhibit as much thickening.
These principles were confirmed in clinical reports. In 1study, 170 patients underwent dobutamine-atropine stresstesting.76 The sensitivity of MCE was higher than that of wallmotion at both maximal (91% versus 70%) and intermediate(84% versus 20%) doses of dobutamine. Specificity waslower for MCE compared with wall motion abnormality
(51% versus 74%). Most of the perfusion defects occurred atintermediate levels of stress when side effects of dobutaminewere minimal. Similar results were subsequently reported inpatients with diabetes, a high-risk group in whom CADdetection is very important.77
In a retrospective analysis, 788 patients undergoing dobu-tamine stress were followed up for a median of 20 months. Itwas shown that myocardial perfusion assessment on MCEhad significant incremental value over clinical factors, restingejection fraction, and wall motion responses in predictingevents.78 As shown in Figure 8B, the 3-year event-freesurvival was 95% for patients with normal perfusion andfunction, 82% for those with normal function but abnormalperfusion, and 68% for those with both abnormal functionand perfusion. When these data are interpreted on the basis ofresults of previous experimental studies, it likely that patientswith both abnormal perfusion and function have a higherincidence of multivessel CAD and compromised collateralperfusion. Similar results have been reported in elderly
Figure 7. Top, Comparison of perfusiondefect occurrence on MCE and SPECTduring dipyridamole stress imagingbased on the degree of coronary ste-nosis determined by quantitative coro-nary angiography. See text for details.Reprinted from Senior et al,68 with per-mission from Elsevier. Bottom, Imagesfrom a dog with a moderate left cir-cumflex stenosis during 10 �g · kg�1 ·min�1 of dobutamine. A, End-diastolicand end-systolic images with normalwall thickening. B, MCE frames at dif-ferent time points after microbubbledestruction showing slow left circum-flex bed filling. C, Time vs AI curvesshowing slower filling in the left cir-cumflex (LCX) compared with the leftanterior descending (LAD) artery bed.Reprinted from Leong-Poi et al,75 withpermission from Lippincott Williams &Wilkins. Copyright 2002, AmericanHeart Association.
Kaul 25 Years of Myocardial Contrast Echocardiography 299
by guest on June 3, 2018http://circ.ahajournals.org/
Dow
nloaded from
patients79 as well as in those with diabetes80,81 and advancedliver disease.82
As stated earlier, in the current practice of cardiology,some form of stress is required to detect CAD on myocardialperfusion imaging. Unless there is a previous infarction,resting perfusion remains normal despite the presence of upto 85% luminal diameter narrowing of the coronary arterybecause of autoregulation. In the presence of a noncriticalstenosis, autoregulation causes an increase in total coronaryblood volume (volume of blood in the entire coronary tree),primarily from enhanced dimensions of arterioles.83
Because the blood in myocardial arterioles comprises onlya small proportion of MBV, microbubble signals from thesevessels are usually negligible when the ultrasound beam isfully replenished after microbubble destruction. However, ifimaging is performed with a very short interval betweendestructive ultrasound pulses, the signal obtained is derivedonly from vessels that fill in this short period of time, asneither capillaries nor venules have adequate time to fill.84,85
Thus, this approach can be used to image the blood volume ofrelatively larger intramyocardial vessels.
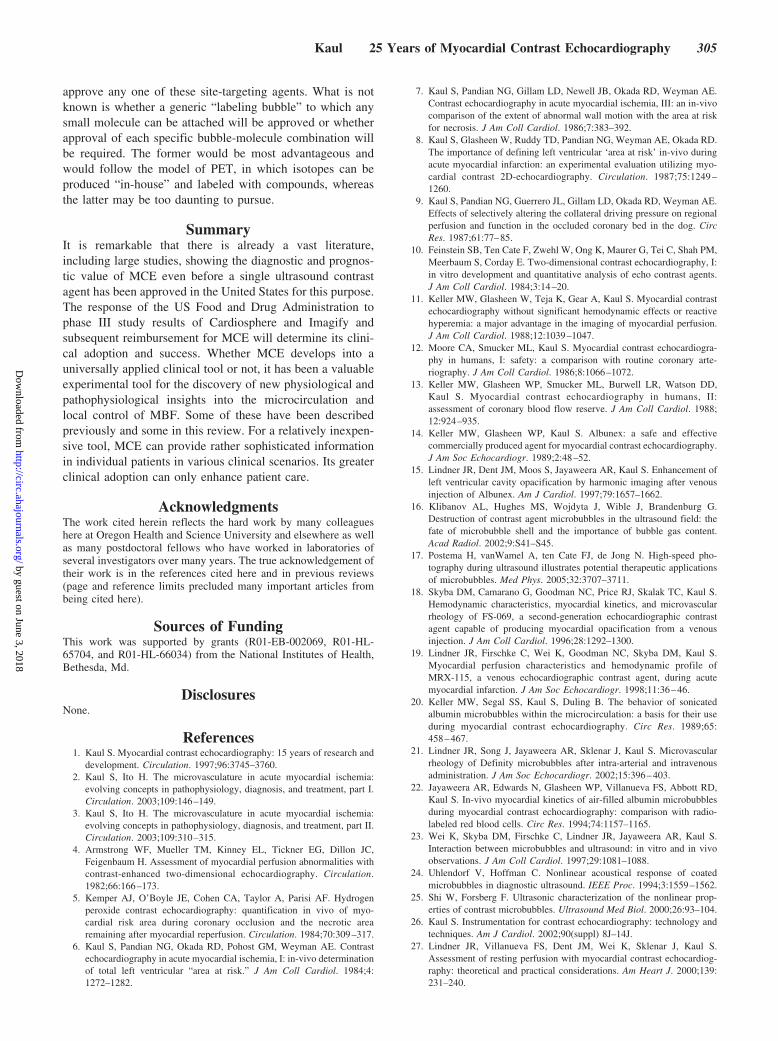
During systole, a change in myocardial elastance causesretrograde displacement of the arteriolar blood volume (aBV)into the larger intramyocardial arterioles, resulting in a smallsystolic signal from these vessels on MCE. In the presence ofa stenosis, because aBV is larger as a result of autoregulation,greater retrograde displacement of microbubbles fromsmaller arterioles into the larger intramyocardial arteriolesoccurs, resulting in an increase in the systolic myocardialsignal from these vessels. Because the larger intramyocardialarterioles do not participate in autoregulation, the diastolicsignal from them remains unchanged. It was first shown in ananimal model84 (Figure 9A) and then in humans85 (Figure 9B)that the systolic-to-diastolic aBV signal ratio measured at restincreases in the presence of a noncritical stenosis and that thedegree of increase is proportional to coronary stenosis sever-ity. Thus, by exploiting the microcirculatory compensatorymechanisms that are evoked to maintain a constant perfusionpressure distal to a stenosis, we can detect the presence ofstenosis even at rest using a novel adaptation of MCE.86
As can be seen from Figure 9B, a normal systolic-to-dia-stolic aBV ratio can sometimes be seen even in the presence
Figure 8. Top, Relation between radiolabeled microsphere–derived MBF and wall thickening (WT) during dobutamine infu-sion. As MBF increases from 0 to 3 mL · g�1 · min�1, WT alsoincreases. However, at �3 mL · g�1 · min�1, WT remains flat.See text for details. Reprinted from Leong-Poi et al,54 with per-mission from Elsevier. Copyright 2005, American College of Car-diology. Bottom, Long-term outcome in patients undergoing do-butamine-atropine stress testing based on the combination ofwall motion (WM) and myocardial perfusion (MP).See text fordetails. Reprinted from Tsutsui et al,78 with permission from Lip-pincott Williams & Wilkins. Copyright 2005, American HeartAssociation.
Figure 9. A, Systolic (S) vs diastolic (D) video intensity (VI)ratios obtained in dogs with increasing levels of coronary ste-nosis and normal MBF (noncritical stenoses). See text fordetails. Reprinted from Wei et al,84 with permission from Lippin-cott Williams & Wilkins. Copyright 2002, American Heart Associ-ation. B, Systolic (S) vs diastolic (D) aBV ratio in patients withdifferent degrees of coronary stenosis based on quantitativecoronary angiography. PG indicates pressure gradient. See textfor details. Modified from Wei et al,85 with permission from Lip-pincott Williams & Wilkins.
300 Circulation July 15, 2008
by guest on June 3, 2018http://circ.ahajournals.org/
Dow
nloaded from

of moderate to severe coronary stenosis. It was hypothesizedthat this is caused by collateral blood flow. In a canine modelof coronary stenosis, measurements were made in collateral-ized and noncollateralized myocardium. The systolic-to-dia-stolic aBV signal ratio in the noncollateralized bed increasedsignificantly with increasing stenosis severity, whereas in thecollateralized bed it did not.87 Because extensive collateral-ization may indicate excellent prognosis, this ratio mayprovide a more appropriate assessment of the myocardiumdespite the presence of significant coronary artery stenosisand hence better prognostic information than that provided bythe coronary anatomy.
MCE for Detecting Viability in Chronic CADOne of the earliest experimental and clinical applications forMCE was the detection of myocardial viability based onmicrocirculatory integrity after attempted reperfusion inAMI.5,38–43,47–49 Another aspect was the maintenance ofmyocardial viability in AMI based on adequate collateralMBF.44–46 More recently, attention has shifted to the assess-ment of viability in chronic CAD. MCE was compared with201Tl imaging and low-dose dobutamine stress in patients withCAD and dysfunctional myocardium undergoing coronarybypass surgery.88 It was found that the sensitivity of MCE forrecovery of function after bypass was 90% and was similar tothat of 201Tl imaging (92%) and dobutamine echocardiogra-phy (80%). However, the specificity of MCE was higher(63%) than that of the other 2 techniques (45% and 54%).These patients also underwent myocardial biopsies duringbypass surgery to correlate MCE parameters to histology.89
As expected, MBV ratios from different beds correlated verywell with microvascular density and capillary area ratios fromthese beds (r�0.84 and r�0.87, respectively). Also notsurprisingly, MCE-derived MBF was a better predictor offunctional recovery than MBV alone.
Another study examined patients presenting with acuteheart failure who had no previous infarction or history ofCAD.90 Clinically, in these patients 2 questions need to beanswered. Do they have CAD, and if they do, is themyocardium viable? In this study, the sensitivity, specificity,and positive and negative predictive values of stress MCE forthe detection of CAD were 82%, 97%, 95%, and 88%,respectively. Quantitative MCE demonstrated significantlylower MBF velocity reserve in patients with CAD comparedwith those with normal coronary arteries. Almost all patientswith CAD had reversible defects indicating the presence ofviable myocardium. Thus, MCE was able to answer the 2critical questions at the bedside without requiring a morecumbersome assessment through SPECT, PET, or magneticresonance imaging.
MCE for Site-Targeted ImagingAs stated earlier, microbubbles used for MCE have a rheol-ogy that is similar to that of erythrocytes.20–22 Therefore, itwas unexpected when instead of flowing freely throughtissue, microbubbles were found to be sticking in the myo-cardium after cold crystalline cardioplegia delivery both inanimal models91 and in humans.92 This sticking was notrelated to any of the cardioplegia constituents (including
oxygen content) or temperature and was not seen when themyocardium was reperfused by venous rather than arterialblood,93 in which free oxygen radical–induced injury is less.Similar microbubble sticking was noted during ischemia/reperfusion, and it was found that the microbubbles were infact adhering to activated leukocytes via cell-surface integrinsor complement-mediated opsonization depending on the mi-crobubble used.94 Thus began the journey with site-targeted(or molecular) imaging with MCE.
The advantage of MCE over modalities such as magneticresonance imaging is that because of their nonlinear behaviorwhen exposed to ultrasound, very few bubbles need to bepresent in the target to produce signal. Therefore, the signal-to-noise ratio is very good. The disadvantage that MCE hasover other modalities, especially PET/CT, is that targetslimited only within the vascular space can be imaged. Table2 lists the targets that have been imaged successfully withMCE with the use of either antibodies or small molecules andthe different experimental conditions in which they have beenshown to be useful. Many of these applications are outside theheart or even the cardiovascular system.
In terms of the myocardium, the obvious potential appli-cations of this approach are imaging of angiogenesis (espe-cially in the context of cell and gene therapy)95–97; acute andchronic cardiac transplant rejection (in which it could sup-plant the more invasive cardiac biopsies)98,99; ischemia/reperfusion injury, especially if one can modulate it (seelater)94,100–102; imaging microthromboembolism during per-cutaneous coronary interventions (to determine effectivetherapy for the no-reflow phenomenon)103,104; and ischemicmemory (to differentiate new from old wall motion abnor-mality in the setting of chest pain).105,106 Early coronaryatherosclerosis can also be detected with this approach.107
Microbubbles can also bind to early atherosclerotic lesionsnonspecifically by complement-mediated adhesion.108
Table 2. Targets for Microbubble-Based Molecular ImagingPertaining to the Cardiovascular System
Molecule TargetedPathophysiological
Substrate
Experimental Conditions inWhich Shown to be
Successful
Phosphatidylserine
Activated leukocytes,inflammation
Ischemia/reperfusioninjury94,100–102
ICAM-1 Inflammation Activated endothelialcells98
Cardiac transplantrejection99
VCAM-1 Inflammation Early atherosclerosis107
P-selectin Inflammation Ischemic memory106
Sialyl Lewis Inflammation Ischemic memory105
�V-integrins Angiogenesis Tumor angiogenesis96
Angiogenesis in hindlimbischemia95
Arg-Arg-Leu Angiogenesis Tumor angiogenesis97
Glycoprotein IIb/IIIa Activated platelets Microthrombosis103
ICAM-1 indicates intracellular adhesion molecule-1; VCAM-1, vascular celladhesion molecule-1.
Kaul 25 Years of Myocardial Contrast Echocardiography 301
by guest on June 3, 2018http://circ.ahajournals.org/
Dow
nloaded from

Described herein is an experiment in which MCE-basedmolecular imaging was used to determine the efficacy oftherapy aimed at reducing infarct size in a setting of percu-taneous coronary intervention performed for acute coronarythrombosis. The reason to present these results is to indicatepossible ways in which molecular imaging could be used todetermine the effect of treatments.
The thrombus burden influences the size of the no-reflowphenomenon as well as infarct size after attempted coronaryintervention,104 suggesting that the beneficial effects of plate-let glycoprotein IIb/IIIa receptor blockade may be due in partto reduction in microthromboemboli. Another consequence ofischemia/reperfusion is endothelial activation from oxygenfree radicals and tissue factor, resulting in the expression ofthe �v�3, which, in turn, causes platelets to adhere to theendothelium. In the presence of microthromboemboli, pro-thrombin can bind to both IIb/IIIa and �v�3, resulting inadditional thrombus formation. Activation of �v�3 is also
associated with leukocyte entrapment within the platelet-fibrin mesh as well as monocyte adhesion to the endothelium.These effects could reduce microvascular perfusion and causemore ischemia.
Thus, the therapeutic aim of this experiment was thecombined inhibition of �v�3 and IIb/IIIa with the use of anovel synthetic compound, CP-4715, whose action was com-pared with that of tirofiban, which predominantly blocks theIIb/IIIa receptor.109 A control group (saline) was also used.Myocardial activities of �v�3 and IIb/IIIa were measured withechistatin-labeled microbubbles95 and 99mTc-labeled DMP-444,104 respectively. Inflammation was assessed with phos-phatidyl serine–coated microbubbles.102
Whereas the risk area size was similar between the 3groups, the no-reflow zone was different, as demonstrated bythe examples shown in the top panel of Figure 10. It was thelargest in the group 1 dog receiving saline (Figure 10A [top]),intermediate in the group 2 dog receiving tirofiban (Figure
Figure 10. Top, MCE-derived no-reflow imagesfrom dogs receiving saline (A) (group 1), tirofi-ban (B) (group 2), and CP-4715 (C) (group 3).See text for details. Reprinted from Sakuma etal,109 with permission of the European Societyof Cardiology. Bottom, Platelet aggregation inthe myocardium 180 minutes after recanaliza-tion on 99mTc-DMP-444 autoradiography. A, B,and C are same as in top panel. See text fordetails. Reprinted from Sakuma et al,109 withpermission of the European Society ofCardiology.
302 Circulation July 15, 2008
by guest on June 3, 2018http://circ.ahajournals.org/
Dow
nloaded from

10B [top]), and smallest in the group 3 dog receivingCP-4715 (Figure 10C [top]). 99mTc-DMP-444 activity onautoradiography is shown in the bottom panel in Figure 10. Itwas higher in group 1 (Figure 10A [bottom]) compared withgroup 2 and 3 dogs (Figure 10B and 10C [bottom]), indicat-ing some reduction in microthromboemboli with IIb/IIIainhibition caused by both drugs. Background-subtractedcolor-coded images after administration of echistatin-conjugated microbubbles are shown in the top panel in Figure11. There was the least backscatter in group 3 dogs (Figure11C [top]), indicating effective inhibition of �v�3 by CP-4715.Similar images after administration of phosphatidyl serine–coated microbubbles are shown in the bottom panel of Figure11. The backscatter was the lowest in the group 3 dogs(Figure 11C [bottom]), indicating suppression of inflamma-tion by CP-4715. Overall, there was a 59% reduction ininfarct size in the group 3 dogs receiving CP-4715 compared
with controls and a 37% reduction compared with the group2 dogs receiving tirofiban. Thus, the combined suppression ofboth IIb/IIIa and �v�3 markedly limits no-reflow and tissueinjury.109
Miscellaneous Applications and FindingsMCE has been found to be very effective in identifying theseptal perforator arteries that supply the thickened muscle,which contributes to outflow track obstruction in hypertropiccardiomyopathy. Thus, selective intracoronary injections ofmicrobubbles can be used to define the vessel through whichalcohol needs to be administered for creating localizednecrosis and reduction in the outflow tract gradient.110 MCEhas also been used for visualization of the right ventricularmyocardium111 and to demonstrate improved perfusion afterstem cell therapy.112 A particularly innovative application hasbeen in the evaluation of cardiac tumors. Malignant tumors
Figure 11. Top, Myocardial �v�3 activity mea-sured with the use of backscatter fromechistatin-conjugated microbubbles. A, B, andC are same as in Figure 10, top panel. See textfor details. Reprinted from Sakuma et al,109
with permission of the European Society ofCardiology. Bottom, “Inflammation” imagingfrom phosphatidyl serine–conjugated micro-bubbles. A, B, and C are same as in Figure 10,top panel. See text for details. Reprinted fromSakuma et al,109 with permission of the Euro-pean Society of Cardiology.
Kaul 25 Years of Myocardial Contrast Echocardiography 303
by guest on June 3, 2018http://circ.ahajournals.org/
Dow
nloaded from

have been shown to have higher MBF velocity and MBV atrest, which separates them from benign tumors.113 With theuse of MCE, it has been demonstrated that the reason for thereversible defect in patients with left bundle-branch block onstress nuclear imaging is the partial volume effect caused bythe poor spatial resolution of SPECT.114 An experimentalstudy using MCE has shown that the cyclic variation inintegrated backscatter seen during the cardiac cycle is causedby cardiac contraction–induced cyclic changes in MBV andnot due to cyclic alterations in myofibrillar elastic elementorientation and ultrasonic anisotropy, as has been suggestedpreviously.115 MCE has also been used successfully to assessmyocardial perfusion in both rats116 and mice.117
MCE has opened up an entire new frontier of research inthe control of microcirculatory flow. For instance, wholeblood viscosity plays a premier role in capillary resistance,and it was shown recently that hyperlipidemia increaseswhole blood viscosity and decreases coronary flow re-serve.118 In this study, when serum triglyceride levels wereincreased during maximal hyperemia, MBF velocity de-creased and myocardial vascular resistance increased(Figure 12A).
Whole blood viscosity is, in large part, determined byerythrocyte charge and deformability that ultimately affectserythrocyte mobility in capillaries. In an animal model ofmyocardial ischemia, it was shown that augmented MBF inthe ischemic microcirculation during nitroglycerin adminis-tration occurs in tandem with increased erythrocyteS-nitrosothiol content that increases both erythrocyte mobilityand oxygen unloading in ischemic but not nonischemictissue.119 Thus, when tissue is normoxic, hemoglobin binds tonitric oxide. In contradistinction, when tissue is hypoxic,hemoglobin releases nitric oxide. Thus, erythrocyte-mediatedmicrovascular mechanisms rather than only reduction inpreload and large coronary artery dilatation may contribute tothe powerful anti-ischemic effects of nitroglycerin, especiallyduring low-flow states.
Finally, it has been shown that the myocardial capillaryhydrostatic pressure is tightly regulated by the body evenwhen autoregulation is exhausted. When the coronary perfu-sion pressure was kept within the autoregulatory range, asexpected, MBV remained unchanged (coronary blood volumeincreased but not MBV, which primarily reflects capillaryblood volume).120 However, when perfusion pressure wasdecreased, capillaries derecruited to maintain a constanthydrostatic pressure (Figure 12B). More interestingly, whenaortic pressure was increased with phenylephrine, capillariesagain derecruited to maintain a constant capillary hydrostaticpressure.
Remaining Challenges for MCEDespite 25 years of research and development, MCE is notyet used routinely as a clinical tool, for which there areseveral reasons. First, no ultrasound contrast agent has yetbeen approved for myocardial opacification in the UnitedStates. The second and most important reason is that currentlythere is no reimbursement for MCE. In comparison, SPECTis compensated handsomely. It is also true that the learningcurve for MCE is steep, and �1 person (a sonographer and anassistant/physician) is required to perform a good-qualitystudy. Furthermore, it involves placing an intravenous line,which in many states requires the services of a registerednurse who may not be readily available. However, a faircompensation for performing and interpreting the study islikely to result in its rapid adoption.
The future of molecular imaging with MCE as a clinicalentity appears uncertain at the moment. Until now, not asingle human study has been performed with any of thestrategies depicted in Table 2. A major reason is the reluc-tance to use antibodies that may inhibit activated moleculesoutside the myocardium and produce untoward effects. Sec-ond, even if we use other ligands instead of antibodies, amethod to conjugate them to microbubbles that is safe inhumans has not yet been identified. Currently, biotin-streptavidin is used for conjugating ligands to bubbles orliposomes. Streptavidin can also bind to biotin in the body(needed for fatty acid synthesis and gluconeogenesis) andprevent its function, leading to potentially deleterious effects.Conjugation of ligands to microbubbles through amine orsulfhydryl covalent bonds may be safe in humans. Althoughthese methods may be developed soon, it will take years to
Figure 12. A, Effect of serum triglyceride levels (x axis) on myo-cardial vascular resistance (MVR, left y axis; filled circles) as wellas radiolabeled microsphere–derived MBF (right y axis; trian-gles) in the presence of maximal hyperemia. All values are nor-malized to baseline hyperemic values in each dog. See text fordetails. Reprinted from Rim et al,118 with permission from Lip-pincott Williams & Wilkins. Copyright 2001, American HeartAssociation. B, Relation between coronary driving pressure(x axis) and normalized percent change in coronary blood flow(CBF, left y axis and filled circles) and MBV fraction (right y axisand open circles) over a wide range of coronary driving pres-sures in dogs. The shaded area denotes the autoregulatoryrange. See text for details. Reprinted from Le et al,120 with per-mission. Copyright 2004, BMJ Publishing Group Ltd.
304 Circulation July 15, 2008
by guest on June 3, 2018http://circ.ahajournals.org/
Dow
nloaded from
approve any one of these site-targeting agents. What is notknown is whether a generic “labeling bubble” to which anysmall molecule can be attached will be approved or whetherapproval of each specific bubble-molecule combination willbe required. The former would be most advantageous andwould follow the model of PET, in which isotopes can beproduced “in-house” and labeled with compounds, whereasthe latter may be too daunting to pursue.
SummaryIt is remarkable that there is already a vast literature,including large studies, showing the diagnostic and prognos-tic value of MCE even before a single ultrasound contrastagent has been approved in the United States for this purpose.The response of the US Food and Drug Administration tophase III study results of Cardiosphere and Imagify andsubsequent reimbursement for MCE will determine its clini-cal adoption and success. Whether MCE develops into auniversally applied clinical tool or not, it has been a valuableexperimental tool for the discovery of new physiological andpathophysiological insights into the microcirculation andlocal control of MBF. Some of these have been describedpreviously and some in this review. For a relatively inexpen-sive tool, MCE can provide rather sophisticated informationin individual patients in various clinical scenarios. Its greaterclinical adoption can only enhance patient care.
AcknowledgmentsThe work cited herein reflects the hard work by many colleagueshere at Oregon Health and Science University and elsewhere as wellas many postdoctoral fellows who have worked in laboratories ofseveral investigators over many years. The true acknowledgement oftheir work is in the references cited here and in previous reviews(page and reference limits precluded many important articles frombeing cited here).
Sources of FundingThis work was supported by grants (R01-EB-002069, R01-HL-65704, and R01-HL-66034) from the National Institutes of Health,Bethesda, Md.
DisclosuresNone.
References1. Kaul S. Myocardial contrast echocardiography: 15 years of research and
development. Circulation. 1997;96:3745–3760.2. Kaul S, Ito H. The microvasculature in acute myocardial ischemia:
evolving concepts in pathophysiology, diagnosis, and treatment, part I.Circulation. 2003;109:146–149.
3. Kaul S, Ito H. The microvasculature in acute myocardial ischemia:evolving concepts in pathophysiology, diagnosis, and treatment, part II.Circulation. 2003;109:310–315.
4. Armstrong WF, Mueller TM, Kinney EL, Tickner EG, Dillon JC,Feigenbaum H. Assessment of myocardial perfusion abnormalities withcontrast-enhanced two-dimensional echocardiography. Circulation.1982;66:166–173.
5. Kemper AJ, O’Boyle JE, Cohen CA, Taylor A, Parisi AF. Hydrogenperoxide contrast echocardiography: quantification in vivo of myo-cardial risk area during coronary occlusion and the necrotic arearemaining after myocardial reperfusion. Circulation. 1984;70:309–317.
6. Kaul S, Pandian NG, Okada RD, Pohost GM, Weyman AE. Contrastechocardiography in acute myocardial ischemia, I: in-vivo determinationof total left ventricular “area at risk.” J Am Coll Cardiol. 1984;4:1272–1282.
7. Kaul S, Pandian NG, Gillam LD, Newell JB, Okada RD, Weyman AE.Contrast echocardiography in acute myocardial ischemia, III: an in-vivocomparison of the extent of abnormal wall motion with the area at riskfor necrosis. J Am Coll Cardiol. 1986;7:383–392.
8. Kaul S, Glasheen W, Ruddy TD, Pandian NG, Weyman AE, Okada RD.The importance of defining left ventricular ‘area at risk’ in-vivo duringacute myocardial infarction: an experimental evaluation utilizing myo-cardial contrast 2D-echocardiography. Circulation. 1987;75:1249 –1260.
9. Kaul S, Pandian NG, Guerrero JL, Gillam LD, Okada RD, Weyman AE.Effects of selectively altering the collateral driving pressure on regionalperfusion and function in the occluded coronary bed in the dog. CircRes. 1987;61:77–85.
10. Feinstein SB, Ten Cate F, Zwehl W, Ong K, Maurer G, Tei C, Shah PM,Meerbaum S, Corday E. Two-dimensional contrast echocardiography, I:in vitro development and quantitative analysis of echo contrast agents.J Am Coll Cardiol. 1984;3:14–20.
11. Keller MW, Glasheen W, Teja K, Gear A, Kaul S. Myocardial contrastechocardiography without significant hemodynamic effects or reactivehyperemia: a major advantage in the imaging of myocardial perfusion.J Am Coll Cardiol. 1988;12:1039–1047.
12. Moore CA, Smucker ML, Kaul S. Myocardial contrast echocardiogra-phy in humans, I: safety: a comparison with routine coronary arte-riography. J Am Coll Cardiol. 1986;8:1066–1072.
13. Keller MW, Glasheen WP, Smucker ML, Burwell LR, Watson DD,Kaul S. Myocardial contrast echocardiography in humans, II:assessment of coronary blood flow reserve. J Am Coll Cardiol. 1988;12:924–935.
14. Keller MW, Glasheen WP, Kaul S. Albunex: a safe and effectivecommercially produced agent for myocardial contrast echocardiography.J Am Soc Echocardiogr. 1989;2:48–52.
15. Lindner JR, Dent JM, Moos S, Jayaweera AR, Kaul S. Enhancement ofleft ventricular cavity opacification by harmonic imaging after venousinjection of Albunex. Am J Cardiol. 1997;79:1657–1662.
16. Klibanov AL, Hughes MS, Wojdyta J, Wible J, Brandenburg G.Destruction of contrast agent microbubbles in the ultrasound field: thefate of microbubble shell and the importance of bubble gas content.Acad Radiol. 2002;9:S41–S45.
17. Postema H, vanWamel A, ten Cate FJ, de Jong N. High-speed pho-tography during ultrasound illustrates potential therapeutic applicationsof microbubbles. Med Phys. 2005;32:3707–3711.
18. Skyba DM, Camarano G, Goodman NC, Price RJ, Skalak TC, Kaul S.Hemodynamic characteristics, myocardial kinetics, and microvascularrheology of FS-069, a second-generation echocardiographic contrastagent capable of producing myocardial opacification from a venousinjection. J Am Coll Cardiol. 1996;28:1292–1300.
19. Lindner JR, Firschke C, Wei K, Goodman NC, Skyba DM, Kaul S.Myocardial perfusion characteristics and hemodynamic profile ofMRX-115, a venous echocardiographic contrast agent, during acutemyocardial infarction. J Am Soc Echocardiogr. 1998;11:36–46.
20. Keller MW, Segal SS, Kaul S, Duling B. The behavior of sonicatedalbumin microbubbles within the microcirculation: a basis for their useduring myocardial contrast echocardiography. Circ Res. 1989;65:458–467.
21. Lindner JR, Song J, Jayaweera AR, Sklenar J, Kaul S. Microvascularrheology of Definity microbubbles after intra-arterial and intravenousadministration. J Am Soc Echocardiogr. 2002;15:396–403.
22. Jayaweera AR, Edwards N, Glasheen WP, Villanueva FS, Abbott RD,Kaul S. In-vivo myocardial kinetics of air-filled albumin microbubblesduring myocardial contrast echocardiography: comparison with radio-labeled red blood cells. Circ Res. 1994;74:1157–1165.
23. Wei K, Skyba DM, Firschke C, Lindner JR, Jayaweera AR, Kaul S.Interaction between microbubbles and ultrasound: in vitro and in vivoobservations. J Am Coll Cardiol. 1997;29:1081–1088.
24. Uhlendorf V, Hoffman C. Nonlinear acoustical response of coatedmicrobubbles in diagnostic ultrasound. IEEE Proc. 1994;3:1559–1562.
25. Shi W, Forsberg F. Ultrasonic characterization of the nonlinear prop-erties of contrast microbubbles. Ultrasound Med Biol. 2000;26:93–104.
26. Kaul S. Instrumentation for contrast echocardiography: technology andtechniques. Am J Cardiol. 2002;90(suppl) 8J–14J.
27. Lindner JR, Villanueva FS, Dent JM, Wei K, Sklenar J, Kaul S.Assessment of resting perfusion with myocardial contrast echocardiog-raphy: theoretical and practical considerations. Am Heart J. 2000;139:231–240.
Kaul 25 Years of Myocardial Contrast Echocardiography 305
by guest on June 3, 2018http://circ.ahajournals.org/
Dow
nloaded from

28. Wei K, Jayaweera AR Firoozan S, Linka A, Skyba DM, Kaul S.Quantification of myocardial blood flow with ultrasound-induceddestruction of microbubbles administered as a constant venous infusion.Circulation. 1998;97:473–483.
29. Le DE, Bin JP, Coggins M, Linder J, Wei K, Kaul S. Relation betweenmyocardial oxygen consumption and myocardial blood volume: a studyusing myocardial contrast echocardiography. J Am Soc Echocardiogr.2002;15:857–863.
30. Toyota E, Fujimoto K, Ogasawara Y, Kajita T, Shigeto F, Matsumoto T,Goto M, Kajiya F. Dynamic changes in three-dimensional architectureand vascular volume of transmural coronary microvasculature betweendiastolic- and systolic-arrested rat hearts. Circulation. 2002;105:621–626.
31. Vogel R, Indermühle A, Reinhardt J, Meier P, Siegrist PT, Namdar M,Kaufmann PA, Seiler C. The quantification of absolute myocardialperfusion in humans by contrast echocardiography: algorithm and val-idation. J Am Coll Cardiol. 2005;45:754–762.
32. Jayaweera AR, Wei K, Coggins M, Bin JP, Goodman C, Kaul S. Roleof capillaries in determining coronary blood flow reserve: new insightsusing myocardial contrast echocardiography. Am J Physiol. 1999;277:H2363–H2372.
33. Wei K, Le E, Min JP, Coggins M, Goodman NC, Kaul S. Mechanism ofreversible 99mTc-sestamibi perfusion defects during pharmacologically-induced coronary vasodilatation. Am J Physiol. 2001,280:H1896–H1904.
34. Bin JP, Le DE, Jayaweera AR, Coggins MP, Wei K, Kaul S. Directeffects of dobutamine on the coronary microcirculation: comparisonwith adenosine using myocardial contrast echocardiography. J Am SocEchocardiogr. 2003;16:871–879.
35. Bin JP, Pelberg RA, Coggins MP, Wei K, Kaul S. Mechanism ofinducible regional dysfunction during dipyridamole stress. Circulation.2002;106:112–117.
36. Miszalski-Jamka T, Kuntz-Hehner S, Schmidt H, Hammerstingl C,Tiemann K, Ghanem A, Troatz C, Lüderitz B, Omran H. Real timemyocardial contrast echocardiography during supine bicycle stress andcontinuous infusion of contrast agent: cutoff values for myocardialcontrast replenishment discriminating abnormal myocardial perfusion.Echocardiography. 2007;24:638–648.
37. Bin JP, Pelberg RA, Wei K, Le DE, Goodman NC, Kaul S. Dobutamineversus dipyridamole for inducing reversible perfusion defects in chronicmultivessel coronary artery stenosis. J Am Coll Cardiol. 2002;40:167–174.
38. Ito H, Tomooka T, Sakai N, Yu H, Higashino Y, Fujii K, Masuyama T,Kitabatake A, Minamino T. Lack of myocardial perfusion immediatelyafter successful thrombolysis: a predictor of poor recovery of left ven-tricular function in anterior myocardial infarction. Circulation. 1992;85:1699–1705.
39. Ito H, Maruyama A, Iwakura K, Takiuchi S, Masuyama T, Hori M,Higashino Y, Fujii K, Minamino T. Clinical implications of the “no reflow”phenomenon: a predictor of complications and left ventricular remodelingin reperfused anterior wall myocardial infarction. Circulation. 1996;93:223–228.
40. Ragosta M, Camarano GP, Kaul S, Powers E, Sarembock IJ, GimpleLW. Microvascular integrity indicates myocellular viability in patientswith recent myocardial infarction: new insights using myocardialcontrast echocardiography. Circulation. 1994;89:2562–2569.
41. Sakuma T, Hayashi Y, Sumii K, Imazu M, Yamakido M. Prediction ofshort- and intermediate-term prognoses of patients with acute myo-cardial infarction using myocardial contrast echocardiography one dayafter recanalization. J Am Coll Cardiol. 1998;32:890–897.
42. Villanueva FS, Glasheen WP, Sklenar J, Kaul S. Characterization ofspatial patterns of flow within the reperfused myocardium using myo-cardial contrast echocardiography: implications in determining theextent of myocardial salvage. Circulation. 1993;88:2596–2606.
43. Villanueva FS, Camarano G, Ismail S, Goodman NC, Sklenar J, Kaul S.Coronary reserve abnormalities during post-infarct reperfusion: impli-cations for the timing of myocardial contrast echocardiography to assessmyocardial viability. Circulation. 1996;94:748–754.
44. Sabia PJ, Powers ER, Ragosta M, Sarembock IJ, Burwell LR, Kaul S.An association between collateral blood flow and myocardial viability inpatients with recent myocardial infarction. N Engl J Med. 1992;372:1825–1831.
45. Sabia PJ, Powers ER, Jayaweera AR, Ragosta M, Kaul S. Functionalsignificance of collateral blood flow in patients with recent acute myo-
cardial infarction: a study using myocardial contrast echocardiography.Circulation. 1992;85:2080–2089.
46. Coggins MP, Le DE, Wei K, Goodman NC, Lindner JR, Kaul S.Noninvasive prediction of ultimate infarct size at the time of acutecoronary occlusion based on the extent and magnitude of collateral-derived myocardial blood flow. Circulation. 2001;104:2471–2477.
47. Janardhanan R, Swinburn JM, Greaves K, Senior R. Usefulness ofmyocardial contrast echocardiography using low-power continuousimaging early after acute myocardial infarction to predict late functionalleft ventricular recovery. Am J Cardiol. 2003;92:493–497.
48. Dwivedi G, Janardhanan R, Hayat SA, Swinburn JA, Senior R. Prog-nostic value of myocardial viability detected by myocardial contrastechocardiography early after acute myocardial infarction. J Am CollCardiol. 2007;50:327–334.
49. Hayat SA, Janardhanan R, Moon JC, Pennell DJ, Senior R. Comparisonbetween myocardial contrast echocardiography and single-photonemission computed tomography for predicting transmurality of acutemyocardial infarction. Am J Cardiol. 2006;97:1718–1721.
50. Rovai D, Zanchi M, Lombardi M, Magagnini E, Chella P, Pieroni A,Picano E, Ferdeghini M, Morris H, Distante A, L’Abbate A. Residualmyocardial perfusion in reversibly damaged myocardium by dipyridam-ole contrast echocardiography. Eur Heart J. 2006;17:296–301.
51. Galiuto L, Gabrielli FA, Lombardo A, La Torre G, Scara A, RebuzziAG, Crea F. Reversible microvascular dysfunction coupled with per-sistent myocardial dysfunction: implications for post-infarct left ventric-ular remodelling. Heart. 2007;93:565–571.
52. Ujino K, Hillis GS, Mulvagh SL, Hagen ME, Oh JK. Usefulness ofreal-time intravenous myocardial contrast echocardiography in pre-dicting left ventricular dilation after successfully reperfused acute myo-cardial infarction. Am J Cardiol. 2005;96:17–21.
53. Scherrer-Crosbie M, Liel-Cohen N, Otsuji Y, Guerrero JL, Sullivan S,Levine RA, Picard MH. Myocardial perfusion and wall motion ininfarction border zone: assessment by myocardial contrast echocardiog-raphy. J Am Soc Echocardiogr. 2000;13:353–357.
54. Leong-Poi H, Coggins M, Sklenar J, Jayaweera AR, Wang X, Kaul S.Role of collateral blood flow in the apparent disparity between the extentof abnormal wall thickening and perfusion defect size during acutemyocardial infarction and demand ischemia. J Am Coll Cardiol. 2005;45:565–572.
55. Kaul S, Senior R, Firschke C, Wang X, Lindner JR, Villanueva FS,Kontos MC, Taylor A, Nixon JV, Watson DD, Harrell FE. Incrementalvalue of cardiac imaging in patients presenting to the emergencydepartment with chest pain and without ST-segment elevation: a multi-center study. Am Heart J. 2004;148:129–136.
56. Korosoglou G, Labadze N, Hansen A, Selter C, Giannitsis E, Katus H,Kuecherer H. Usefulness of real-time myocardial perfusion imaging inthe evaluation of patients with first time chest pain. Am J Cardiol.2004;94:1225–1231.
57. Rinkevich D, Kaul S, Wang X-Q, Tong KL, Belcik T, Kalvaitis S,Lepper W, Foster WA, Wei K. Incremental value of regional perfusionover regional function in patients presenting to the emergencydepartment with suspected cardiac chest pain and non-diagnostic elec-trocardiographic changes. Eur Heart J. 2005;26:1606–1611.
58. Tong KL, Kaul S, Wang X, Rinkevich �, Kalvaitis S, Belcik T, LepperW, Foster WA, Wei K. Myocardial contrast echocardiography providessuperior and rapid prognostic information compared to routineassessment in patients presenting with chest pain to the emergencydepartment. J Am Coll Cardiol. 2005;46:920–927.
59. Senior R, Ashrafian H. Detecting acute coronary syndrome in theemergency department: the answer is in seeing the heart: why lookfurther? Eur Heart J. 2005;26:1606–1611.
60. Vannan MA, Narula J. Ischemic versus nonischemic chest pain in theemergency room. J Am Coll Cardiol. 2005;46:928–929.
61. Ramakrishna G, Ravi BS, Chandrasekaran K. Apical ballooningsyndrome in a postoperative patient with normal microvascular per-fusion by myocardial contrast echocardiography. Echocardiography.2005;22:606–610.
62. Ismail S, Jayaweera AR, Goodman NC, Camarano GP, Skyba DM, KaulS. Detection of coronary artery stenoses and quantification of blood flowmismatch during coronary hyperemia with myocardial contrast echocar-diography. Circulation. 1995;91:821–830.
63. Firschke C, Lindner JR, Wei K, Skyba D, Goodman NC, Kaul S.Myocardial perfusion imaging in the setting of coronary artery stenosisand acute myocardial infarction using venous injection of FS-069, a
306 Circulation July 15, 2008
by guest on June 3, 2018http://circ.ahajournals.org/
Dow
nloaded from

second generation echocardiographic contrast agent. Circulation. 1997;96:959–967.
64. Wei K, Jayaweera AR, Firoozan S, Linka A, Skyba DM, Kaul S. Basisfor stenosis detection using venous administration of microbubblesduring myocardial contrast echocardiography: bolus or continuousinfusion? J Am Coll Cardiol. 1998;32:252–260.
65. Kaul S, Senior R, Dittrich H, Raval U, Khattar R, Lahiri A. Detection ofcoronary artery disease using myocardial contrast echocardiography:comparison with 99mTc-sestamibi single photon emission computedtomography. Circulation. 1997;96:785–792.
66. Porter TR, Li S, Jiang L, Grayburn P, Deligonul U. Real-time visual-ization of myocardial perfusion and wall thickening in human beingswith intravenous ultrasonographic contrast and accelerated intermittentharmonic imaging. J Am Soc Echocardiogr. 1999;12:266–271.
67. Wei K, Ragosta M, Thorpe J, Moos S, Kaul S. Noninvasive mea-surement of coronary blood flow reserve myocardial contrast echocar-diography. Circulation. 2001;103:2560–2565.
68. Senior R, Lepper W, Pasquet A, Chung G, Hoffman R, VanoverscheldeJL, Cerquera M, Kaul S. Myocardial perfusion assessment in patientswith medium probability of coronary artery disease and no prior myo-cardial infarction: comparison of myocardial contrast echocardiographywith 99mTc-SPECT. Am Heart J. 2004;147:1100–1105.
69. Jeetley P, Hickman M, Kamp O, Lang RM, Thomas JD, Vannan MA,Vanoverschelde JL, van der Wouw PA, Senior R. Myocardial contrastechocardiography for the detection of coronary artery stenosis: a pro-spective multicenter study in comparison with single-photon emissioncomputed tomography. J Am Coll Cardiol. 2006;47:141–145.
70. Dijkmans PA, Senior R, Becher H, Porter TR, Wei K, Visser CA, MD,Kamp O. Myocardial contrast echocardiography evolving as a clinicallyfeasible technique for accurate, rapid, and safe assessment of myocardialperfusion: the evidence so far. J Am Coll Cardiol. 2006;48:2168–2177.
71. Senior R, Zabalgoita M, Monaghan M, Main M, Zamarano JL, TiemannK, Agati L, Weissman NJ, Klein AL, Marwick TH, Ahmad M, DeMariaAN, Becher H, Kaul S, Udelson JE, Wackers FJ, Walvovitch RC, PicardMH. Accurate detection of coronary artery disease by echocardiographyusing perflubutane polymer microspheres, a novel contrast agent: com-parison with nuclear perfusion imaging in two phase three multicenterclinical trials. Circulation. 2007;116:II-546. Abstract.
72. Bin JP, Pelberg RA, Coggins MP, Wei K, Kaul S. Mechanism ofinducible regional dysfunction during dipyridamole stress. Circulation.2002;106:112–117.
73. Firschke C, Andrássy P, Linka AZ, Busch R, Martinoff S. Adenosinemyocardial contrast echo in intermediate severity coronary stenoses: aprospective two-center study. Int J Cardiovasc Imaging. 2007;23:311–321.
74. Hauser AM, Vellappillil G, Ramos RG, Gordon S, Timmis GC.Sequence of mechanical, electrocardiographic and clinical effects ofrepeated coronary artery occlusion in human beings: echocardiographicobservations during coronary angioplasty. J Am Coll Cardiol. 1985;5:193–197.
75. Leong-Poi H, Rim S-J, Le ED, Fisher NG, Wei K, Kaul S. Perfusionversus function: the ischemic cascade in demand ischemia: implicationsof single- versus multivessel stenosis. Circulation. 2002;105:987–992.
76. Elhendy A, O’Leary EL, Xie F, McGrain AC, Anderson JR, Porter TR.Comparative accuracy of real-time myocardial contrast perfusionimaging and wall motion analysis during dobutamine stress echocardi-ography for the diagnosis of coronary artery disease. J Am Coll Cardiol.2004;44:2185–2191.
77. Elhendy A, Tsutsui JM, O’Leary EL, Xie F, McGrain AC, Porter TR.Noninvasive diagnosis of coronary artery disease in patients withdiabetes by dobutamine stress real-time myocardial contrast perfusionimaging. Diabetes Care. 2005;28:1662–1667.
78. Tsutsui JM, Elhendy A, Anderson JR, Xie F, McGrain AC, Porter TR.Prognostic value of dobutamine stress myocardial contrast perfusionechocardiography. Circulation. 2005;112:1444–1450.
79. Tsutsui JM, Xie F, Cloutier D, Kalvaitis S, Elhendy A, Porter TR.Real-time dobutamine stress myocardial perfusion echocardiographypredicts outcome in the elderly. Eur Heart J. 2008;29:377–385.
80. Dodla S, Xie F, Cory B, Stevens RB, O’Leary E, Porter TR. Prognosticvalue and angiographic correlation of dobutamine stress imaging withreal time perfusion echocardiography in asymptomatic diabetic patientsundergoing pre-operative evaluation. J Am Soc Echocardiogr. 2007;20:564. Abstract.
81. Moir S, Haluska B, Jenkins C, McNab D, Marwick TH. Comparison ofspecificity of quantitative myocardial contrast echocardiography for
diagnosis of coronary artery disease in patients with versus withoutdiabetes mellitus. Am J Cardiol. 2005;96:187–192.
82. Tsutsui JM, Mukherjee S, Elhendy A, Xie F, Lyden ER, O’Leary E,McGrain AC, Porter TR. Value of dobutamine stress myocardialcontrast perfusion echocardiography in patients with advanced liverdisease. Liver Transplantation. 2006;12:592–599.
83. Lindner JR, Skyba DM, Goodman NC, Jayaweera AR, Kaul S. Changesin myocardial blood volume with graded coronary stenosis: an experi-mental evaluation using myocardial contrast echocardiography.Am J Physiol. 1997;272:H567–H575.
84. Wei K, Le E, Bin JP, Jayaweera AR, Goodman NC, Kaul S. Non-invasive detection of coronary artery stenosis at rest without recourse toexercise or pharmacologic stress. Circulation. 2002;105:218–223.
85. Wei K, Tong KL, Belcik T, Rafter P, Ragosta M, Kaul S. Detection ofnon-critical coronary stenosis at rest with myocardial contrast echocar-diography. Circulation. 2005;112:1154–1160.
86. Grayburn PA. Stress echo without the stress: detection of coronarystenosis at rest by myocardial contrast echocardiography. Circulation.2005;112:1085–1087.
87. Pascotto M, Wei K, Micari A, Bragadeesh T, Goodman NC, Kaul S.Phasic changes in myocardial blood volume are influenced by collateralblood flow: implications for the quantification of coronary stenosis atrest. Heart. 2007;93:438–443.
88. Shimoni S, Fangogiannis NG, Aggeli CJ, Shan K, Verani MS, QuinonesMA, Espada R, Letsou GV, Lawrie GM, Winters WL, Reardon MJ,Zoghbi WA. Identification of hibernating myocardium with quantitativeintravenous myocardial contrast echocardiography comparison with do-butamine echocardiography and thallium-201 scintigraphy. Circulation.2003;107:538–544.
89. Shimoni S, Frangogiannis NG, Aggeli CJ, MD, Shan K, Quinones MA,Espada R, Letsou GV, Lawrie GM, Winters WL, Reardon MJ, ZoghbiWA. Microvascular structural correlates of myocardial contrast echo-cardiography in patients with coronary artery disease and left ventriculardysfunction implications for the assessment of myocardial hibernation.Circulation. 2002;106:950–956.
90. Senior R, Janardhanan R, Jeetley P, Burden L. Myocardial contrastechocardiography for distinguishing ischemic from nonischemicfirst-onset acute heart failure insights into the mechanism of acute heartfailure. Circulation. 2005;112:1587–1593.
91. Keller MW, Spotnitz WD, Matthew TL, Glasheen WP, Watson DD,Kaul S. Intraoperative assessment of regional myocardial perfusionusing quantitative myocardial contrast echocardiography: an experi-mental evaluation. J Am Coll Cardiol. 1990;16:1267–1279.
92. Villanueva FS, Spotnitz WD, Jayaweera AR, Gimple LW, Dent J, KaulS. On-line intraoperative quantitation of regional myocardial perfusionduring coronary artery bypass graft operations with myocardial contrasttwo-dimensional echocardiography. J Thorac Cardiovasc Surg. 1992;104:1524–1531.
93. Bayfield M, Lindner JR, Kaul S, Ismail S, Goodman NC, Spotnitz WD.Deoxygenated blood minimizes adherence of sonicated albumin micro-bubbles during cardioplegic arrest and after blood reperfusion: experi-mental and clinical observations with myocardial contrast echocardiog-raphy. J Thorac Cardiovasc Surg. 1997;113:1100–1108.
94. Lindner JR, Coggins MP, Kaul S, Klibanov AL, Brandenburger GH,Ley K. Microbubble persistence in the microcirculation during ische-mia-reperfusion and inflammation is caused by integrin- andcomplement-mediated adherence to activated leukocytes. Circulation.2000;101:668–675.
95. Leong-Poi H, Christiansen J, Klibanov AL, Kaul S, Lindner JR. Non-invasive assessment of angiogenesis by molecular imaging withultrasound and microbubbles targeted to �v integrins. Circulation. 2003;107:455–460.
96. Ellegala DB, Leong-Poi H, Carpenter JE, Klibanov AL, Kaul S,Shaffrey ME, Sklenar J, Lindner JR. Imaging tumor angiogenesis withcontrast ultrasound and microbubbles targeted to �v�3. Circulation.2003;108:336–341.
97. Weller GER, Wong MKK, Modzelewski RA, Lu E, Klibanov AL,Wagner WR, Villanueva FS. Ultrasonic imaging of tumor angiogenesisusing contrast microbubbles targeted via the tumor-binding peptidearginine-arginine-leucine. Cancer Res. 2005;65:533–539.
98. Villanueva FS, Jankowski RJ, Klibanov S, Pina ML, Alber SM, WatkinsSC, Brandenburger GH, Wagner WR. Microbubbles targeted to inter-cellular adhesion molecule-1 bind to activated coronary artery endothe-lial cells. Circulation. 1998;98:1–5.
Kaul 25 Years of Myocardial Contrast Echocardiography 307
by guest on June 3, 2018http://circ.ahajournals.org/
Dow
nloaded from

99. Weller GER, Lu E, Csikari MM, Klibanov AL, Fischer D, WagnerWR, Villanueva FS. Ultrasound imaging of acute cardiac transplantrejection with microbubbles targeted to intercellular adhesionmolecule-1. Circulation. 2003;108:218 –224.
100. Lindner JR, Dayton PA, Coogins MP, Ley K, Song J, Ferrara K, KaulS. Noninvasive imaging of inflammation by ultrasound detection ofphagocytosed microbubbles. Circulation. 2000;102:531–538.
101. Lindner JR, Song J, Xu F, Klibanov AL, Singbartl K, Ley K, Kaul S.Noninvasive ultrasound imaging of inflammation using microbubblestargeted to activated leukocytes. Circulation. 2000;102:2745–2750.
102. Christiansen JP, Leong-Poi H, Klibanov AL, Kaul S, Lindner JR. Non-invasive imaging of myocardial reperfusion injury using leukocyte-targeted contrast echocardiography. Circulation. 2002;105:1764–1767.
103. Schumann P, Christiansen JP, Quigley RM, McCreery TP, Sweitzer RH,Unger EC, Lindner JR, Matsunaga TO. Targeted-microbubble bindingselectively to GPIIb IIIa receptors of platelet thrombi. Invest Radiol.2002;37:587–593.
104. Sakuma T, Sklenar J, Leong-Poi H, Goodman NC, Glover DK, Kaul S.Molecular imaging identifies regions with microthromboemboli duringprimary angioplasty in acute coronary thrombosis. J Nucl Med. 2004;45:1194–1200.
105. Villanueva FS, Lu E, MD, Bowry S, Kilic S, Tom E, Wang J, GrettonJ, Pacella JJ, Wagner WR. Myocardial ischemic memory imaging withmolecular echocardiography. Circulation. 2007;115:345–352.
106. Kaufmann B, Lewis C, Xie A, Mirza-Mohd A, Lindner JR. Detection ofrecent myocardial ischaemia by molecular imaging of P-selectin withtargeted contrast echocardiography. Eur Heart J. 2007;28:2011–2017.
107. Kaufmann BA, Sanders JM, Davis C, Xie A, Aldred P, Sarembock IJ,Lindner JR. Molecular imaging of inflammation in atherosclerosiswith targeted ultrasound detection of vascular cell adhesionmolecule-1. Circulation. 2007;116:276 –284.
108. Anderson DR, Tsutsui JM, Xie F, Radio SJ, Porter TR. The role ofcomplement in the adherence of microbubbles to dysfunctional arterialendothelium and atherosclerotic plaque. Cardiovasc Res. 2007;73:597–606.
109. Sakuma T, Sari I, Goodman NC, Lindner JR, Klibanov A, Kaul S.Simultaneous �v�3 and IIb/IIIa inhibition causes a marked reduction ininfarct size following reperfusion in a canine model of acute coronarythrombosis: utility of in-vivo molecular imaging with myocardialcontrast echocardiography. Cardiovasc Res. 2005;66:552–561.
110. Nagueh SF, Lakkis NM, Zuo-Xiang H, Middleton KJ, Killip A, ZoghbiWA, Quinones MA, Roberts E, Verani MS, Kleiman NS. Role ofmyocardial contrast echocardiography during nonsurgical septalreduction therapy for hypertrophic obstructive cardiomyopathy. J AmColl Cardiol. 1998;32:225–229.
111. Masugata H, Fujita N, Kondo I, Peters B, Ohmori K, Mizushige K,Kohno M, DeMaria AN. Assessment of right ventricular perfusion afterright coronary artery occlusion by myocardial contrast echocardiogra-phy. J Am Coll Cardiol. 2003;41:1823–1830.
112. Wolf D, Reinhard A, Krause U, Seckinger A, Katus HA, Kuecherer H,Hansen A. Stem cell therapy improves myocardial perfusion and cardiacsynchronicity: new application for echocardiography. J Am Soc Echo-cardiogr. 2007;20:512–520.
113. Kirkpatrick JN, Wong T, Bednarz JE, Spencer KT, Sugeng L, Ward RP,DeCara JM, Weinert L, Krausz T, Lang RM. Differential diagnosis ofcardiac masses using contrast echocardiographic perfusion imaging.J Am Coll Cardiol. 2004;43:1412–1419.
114. Hayat SA, Dwivedi G, Jacobson A, Kinsey C, Senior R. Effects of leftbundle branch block on cardiac structure, function, perfusion and per-fusion reserve: implications for myocardial contrast echocardiographyversus radionuclide perfusion imaging for the detection of coronaryartery disease. Circulation. 2008;117:1832–1841.
115. Micari A, Pascotto M, Jayaweera AR, Sklenar J, Goodman NC, Kaul S.Cyclic variation in ultrasonic myocardial integrated backscatter is due tophasic changes in myocardial microvascular dimensions. J UltrasoundMed. 2006;25:1009–1019.
116. Thibault H, Lafitte S, Timperley J, Tariosse L, Becher H, Roudaut R.Dos Santos P. Quantitative analysis of myocardial perfusion in rats bycontrast echocardiography. J Am Soc Echocardiogr. 2005;18:1321–1328.
117. Kaufmann BA, Lankford M, Behm CZ, French BA, Klibanov AL, XuY, Lindner JR. High-resolution myocardial perfusion imaging in micewith high-frequency echocardiographic detection of a depot contrastagent. J Am Soc Echocardiogr. 2007;20:136–43.
118. Rim S-J, Leong-Poi H, Lindner JR, Wei K, Fisher NG, Kaul S. Thedecrease in coronary blood flow reserve during hyperlipidemia is sec-ondary to an increase in blood viscosity. Circulation. 2001;104:2704–2709.
119. Bin JP, Doctor A, Lindner JR, Leong-Poi H, Fisher NG, Le ED,Hendersen EH, Christiansen J, Kaul S. Effects of nitroglycerin onerythrocyte rheology and oxygen unloading: novel role ofS-nitrosohemoglobin in relieving myocardial ischemia. Circulation.2006;113:2502–2508.
120. Le DE, Jayaweera AR, Wei K, Coggins MP, Lindner JR, Kaul S.Changes in myocardial blood volume over a wide range of coronarydriving pressures: role of capillaries beyond the autoregulatory range.Heart. 2004;90:1199–1205.
KEY WORDS: contrast media � coronary disease � echocardiography �imaging
308 Circulation July 15, 2008
by guest on June 3, 2018http://circ.ahajournals.org/
Dow
nloaded from

Sanjiv KaulMyocardial Contrast Echocardiography: A 25-Year Retrospective
Print ISSN: 0009-7322. Online ISSN: 1524-4539 Copyright © 2008 American Heart Association, Inc. All rights reserved.
is published by the American Heart Association, 7272 Greenville Avenue, Dallas, TX 75231Circulation doi: 10.1161/CIRCULATIONAHA.107.747303
2008;118:291-308Circulation.
http://circ.ahajournals.org/content/118/3/291World Wide Web at:
The online version of this article, along with updated information and services, is located on the
http://circ.ahajournals.org//subscriptions/
is online at: Circulation Information about subscribing to Subscriptions:
http://www.lww.com/reprints Information about reprints can be found online at: Reprints:
document. Permissions and Rights Question and Answer this process is available in the
click Request Permissions in the middle column of the Web page under Services. Further information aboutOffice. Once the online version of the published article for which permission is being requested is located,
can be obtained via RightsLink, a service of the Copyright Clearance Center, not the EditorialCirculationin Requests for permissions to reproduce figures, tables, or portions of articles originally publishedPermissions:
by guest on June 3, 2018http://circ.ahajournals.org/
Dow
nloaded from