new cu(ii) and zn(ii) complexes with pyrazolyl derived ... · the zn(ii) complex was also...
TRANSCRIPT

New Cu(II) and Zn(II) complexes with pyrazolyl derived Schiff base ligands: synthesis and preliminary biological evaluation
Nádia Raquel Pólvora Ribeiro
Dissertação para obtenção do Grau de Mestre em
Química
Orientador: Doutora Maria Isabel Rodrigues Correia
Júri
Presidente: Professora Doutora Maria Matilde Soares Duarte Marques
Orientador: Doutora Maria Isabel Rodrigues Correia
Vogal: Professora Doutora Maria Helena Anselmo Viegas Garcia
Novembro 2016

i
To Gabriel

ii

iii
Acknowledgments
First I would like to say thanks to my family for their unconditional love and support, specially my husband
and my son.
A special word must be dedicated to Professor Maria Matilde Marques, as the Coordinator of this Master,
she really brings the heart and soul of Instituto Superior Técnico (IST) to the participants. Of course the
attention is extended to all the “trainers” that have provided knowledge and confidence to the students.
Also to IST, Centro de Química Estrutural (CQE) and to the IST-UTL Centers of the Portuguese NMR
and Mass Spectrometry Networks for providing the resources for the development of the work.
I thank Professor João Costa Pessoa for having me in his laboratory and to all the colleagues that have
shared these months with me making time fly. I specially thank Cristina Matos for all her support and
long talks on the subjects.
I thank Dr. Somnath Roy for the synthesis of two compounds. I also thank Dr. Nataliya Butenko, Dr.
Fernanda Marques, Dr. Fernando Pavan, Dr. Roberto di Paolo and Dr. Fernando Avecilla for their help
with specific tests and techniques performed during the course of this work. Their expertise and
enlightenments over each one’s field of research provided me with the necessary tools for the conclusion
of my work.
I thank the financial support from Fundação para a Ciência e Tecnologia, project UID/QUI/00100/2013.
Finally, but decidedly with all my heart, a very special thanks to my supervisor, Dr. Isabel Correia. Her
kind attention and wise advises make this much more than just a Master Thesis’ objective. For having
received me, guided me throughout the work and patience in reviewing all the discussion of the obtained
results, she will always hold a special place in my thoughts.

iv
v
Abstract
Since the discovery of cisplatin there has been a continuous pursuit for new metallodrugs showing
higher efficacies and lower side-effects. In this work, new copper(II) (C1-C6) and zinc(II) (C7) complexes
were developed. Through condensation reactions of 5-methyl-1H-pyrazole-3-carbohydrazide with
different aromatic aldehydes, a set of pyrazole based “ONO” tridentate Schiff base ligands were
obtained in moderate to good yields - L1-L4. Other ligands (L5 and L6, previously synthetized) were
also used in the synthesis of the complexes. Copper coordination was accomplished by mixing
methanolic solutions of the ligands and CuCl2.2H2O, resulting in moderate to good yields of the products.
All compounds were characterized by analytical techniques (elemental analysis, UV-Vis, MS, FTIR,
NMR and EPR) to establish their structures. The antioxidant potential of all compounds was tested,
yielding low activity in most cases, with the exception of L1 and C5.
The Cu(II) complexes were tested for their aqueous stability, and for their interaction with biological
molecules, namely DNA and HSA, through fluorescence quenching experiments (and electrophoresis
for DNA). Their cytotoxicity against two cancer cell lines (MCF7 - breast and PC3 - prostate) was also
tested. The complexes with larger aromatic systems showed cytotoxicity higher than cisplatin.
The Zn(II) complex was also characterized by the same techniques and tested for biological interactions.
It exhibited fluorescence emission and was further studied under this technique.
With the exception of C3, all the synthetized complexes were able to interact with DNA and HSA and
the complexes with larger aromatic systems are promising candidates as metallodrugs.
Keywords: pyrazole, Schiff base ligand, copper complexes, cytotoxicity, fluorescence quenching.

vi
vii
Resumo
Desde a descoberta da cisplatina que se assiste a uma busca contínua por novos metalo-fármacos que
detenham maior eficácia e menores efeitos secundários. Neste trabalho, novos complexos de cobre(II)
(C1-C6) e de zinco(II) (C7) foram desenvolvidos e estudados.
Reações de condensação entre 5-metilo-1H-pirazolo-3-carbohidrazida e aldeídos aromáticos
providenciaram diferentes ligandos tridentados do tipo bases de Schiff (L1-L4), obtidos com
rendimentos razoáveis. Dois outros ligandos (L5 e L6) também derivados do pirazole, foram usados na
coordenação. Os complexos de cobre foram obtidos por reação do respetivo ligando com CuCl2.2H2O
em solução metanólica, tendo sido obtidos com rendimentos razoáveis. Várias técnicas analíticas
(análise elementar, MS, e espectroscopias de RMN, UV-Vis, IV e RPE) foram usadas para elucidar as
estruturas dos compostos. O seu potencial antioxidante foi avaliado, mas apenas L1 e C5 revelaram
atividade moderada.
Os complexos foram testados quanto à sua estabilidade em meio aquoso e capacidade de interação
com biomoléculas, nomeadamente ADN e albumina do soro humano, através de experiências de
fluorescência (e eletroforese com o ADN), e a sua atividade anticancerígena foi testada em duas linhas
celulares cancerígenas: MCF7 – mama, e PC3 – próstata. Os complexos derivados de ligandos com
maior sistema aromático revelaram citotoxicidade superior à cisplatina.
O complexo de zinco (com L5) foi igualmente obtido, caracterizado e submetido aos mesmos ensaios
biológicos. Sendo um composto fluorescente, a sua fotofísica foi estudada em pormenor.
Com exceção do C3, todos os complexos interatuaram com as biomoléculas e os complexos derivados
de ligandos com maior sistema aromático mostraram-se promissores como metalo-fármacos.
Palavras-chave: pirazole, bases de Schiff, citotoxicidade, complexos de cobre, extinção de fluorescência.

viii
ix
Table of Contents
Acknowledgments ................................................................................................................................... iii
Abstract.....................................................................................................................................................v
Resumo .................................................................................................................................................. vii
Table of Contents .................................................................................................................................... ix
Index of Figures ..................................................................................................................................... xiii
Index of Tables ..................................................................................................................................... xvii
Index of Schemes .................................................................................................................................. xix
Symbols and Abbreviations ................................................................................................................... xxi
Introduction .............................................................................................................................................. 1
Metal complexes as anticancer drugs – Metallopharmaceuticals ....................................................... 2
Use of copper and zinc complexes in medicinal chemistry ................................................................. 5
Schiff-base ligands ............................................................................................................................... 7
Biological Evaluation Methods............................................................................................................... 10
Interaction with the genetic material .................................................................................................. 10
Interaction with HSA .......................................................................................................................... 12
Cytotoxicity ......................................................................................................................................... 14
Experimental .......................................................................................................................................... 15
Materials............................................................................................................................................. 15
Instrumentation .................................................................................................................................. 15
Preparation of solutions for biological assays.................................................................................... 16
Synthesis of the ligands ..................................................................................................................... 16
(E)-N’-((3-hydroxy-5-(hydroxymethyl)-2-methylpyridin-4-yl)-5-methyl-1H-pyrazole-3-
carbohydrazide hydrochloride (L1) ................................................................................................ 16
(E)-N’-(2-hydroxybenzylidene)-5-methyl-1H-pyrazole-3-carbohydrazide (L2) ............................... 17
(E)-N’-(3-methoxy-2-hydroxybenzylidene)-5-methyl-1H-pyrazole-3-carbohydrazide (L3) ............ 17
(E)-N’-(3-ethoxy-2-hydroxybenzylidene)-5-methyl-1H-pyrazole-3-carbohydrazide (L4) ............... 18
(E)-N’-((2-hydroxynaphthalen-1-yl) methylene)-5-methyl-1H-pyrazole-3-carbohydrazide (L5) ..... 18
(E)-N’-((2-hydroxynaphthalen-1-yl) methylene)-5-methyl-1-(pyridine-2-yl)-pyrazole-3-
carbohydrazide (L6) ....................................................................................................................... 19
Synthesis of the complexes ............................................................................................................... 19
x
Complex C1 (L1 + CuCl2.2H2O) ..................................................................................................... 19
Complex C2 (L2 + CuCl2.2H2O) ..................................................................................................... 19
Complex C3 (L3 + CuCl2.2H2O) ..................................................................................................... 20
Complex C4 (L4 + CuCl2.2H2O) ..................................................................................................... 20
Complex C5 (L5 + CuCl2.2H2O) ..................................................................................................... 20
Complex C6 (L6 + CuCl2.2H2O) ..................................................................................................... 20
Complex C7 (L5 + ZnCl2.2H2O) ..................................................................................................... 21
Chloride analysis by ion exchange chromatography ......................................................................... 21
Stability studies in aqueous medium ................................................................................................. 21
Evaluation of the antioxidant activity .................................................................................................. 22
Interaction with biological molecules ................................................................................................. 22
TO displacement assays ................................................................................................................ 22
DNA cleavage activity .................................................................................................................... 22
HSA binding studies ....................................................................................................................... 24
Cell viability assays in human tumor cell lines ................................................................................... 24
Anti-Mycobacterium Tuberculosis (Mtb) tests.................................................................................... 24
Fluorescence studies with C7 ............................................................................................................ 25
Results and Discussion ......................................................................................................................... 27
Synthesis and characterization of ligands ......................................................................................... 27
Synthesis and characterization of the complexes ............................................................................. 30
Stability studies in aqueous medium ................................................................................................. 39
Antioxidant activity studies with DPPH .............................................................................................. 41
Interaction with biological molecules ................................................................................................. 43
Interaction with ctDNA .................................................................................................................... 43
DNA cleavage activity .................................................................................................................... 49
HSA binding studies ....................................................................................................................... 52
Cell viability assays in human tumor cell lines ................................................................................... 58
Anti-Mycobacterium Tuberculosis (Mtb) tests.................................................................................... 61
Fluorescence studies with C7 ............................................................................................................ 61
Interaction with HSA ....................................................................................................................... 62
Conclusion ............................................................................................................................................. 69

xi
References ............................................................................................................................................ 71
Annex A: X-Ray crystal structure of L3 ............................................................................................... - 1 -
Annex B: DNA cleavage activity .......................................................................................................... - 5 -

xii

xiii
Index of Figures
Figure 1 The hallmarks of cancer [2]. ..................................................................................................... 1
Figure 2 The multistep metastatic cascade showing the ability of cancer cells to disseminate [2]. ....... 2
Figure 3 Metal-based anticancer drugs that primarily target DNA. (a) Pt(IV) complexes that deliver
cisplatin and two equivalents of estradiol (1) [7] and the GST inhibitor ethacrynic acid (2) [8] after
activation. Complex (3) binds non-covalently to the nanotube and shows increased cellular uptake and
cytotoxicity [9]. (b) Complexes (4) and (5) are cytotoxic examples of the ruthenium-cyclopentadienyl
family of complexes [10]. ......................................................................................................................... 3
Figure 4 Pyrazolyl thiosemicarbazones iron(III) complexes that are both active against HeLa cells in a
dose-dependent manner and more active than their corresponding ligands [11]. .................................. 4
Figure 5 Proteins and enzymes as non-classical targets. (a) The Au(I)-phosphole complex 1 inhibits
hTrxR [12]. The crystal structure shows the two gold binding sites (insets, gold atoms as orange
spheres). (b) Gold(III)-porphyrin anticancer agent 2 [13]. (c) The cobalt-alkyne (3) [14] and cobalt-
marimastat chaperone (4) [15] complexes inhibit COX and MMP (Matrix metalloproteinase),
respectively. The cobaltocenium complex (5) carries a nuclear localization signal (NLS) for directed
nuclear delivery [16]. ............................................................................................................................... 4
Figure 6 Rhenium complexes that can be activated by a specific wavelength in order to induce an anti-
cancer effect [2]. ...................................................................................................................................... 5
Figure 7 Reported photocytotoxic iron(III) catecholates [17]. ................................................................. 5
Figure 8 Naphtoquinone derivatives [20] (left) and a flavone derivative [21] (right) copper complexes
induced oxidative DNA damage involving generation of ROS. ............................................................... 6
Figure 9 2-oxo-quinoline-3-carbaldehyde Schiff bases Cu(II) complexes that were found to interact with
ctDNA through intercalation [22]. ............................................................................................................ 6
Figure 10 Terpyridine based zinc(II) supermolecular complexes (1) that have demonstrate higher in
vitro cytotoxicity than cisplatin [24] and zinc(II) phthalocyanines (2) that have showed excellent
photocytotoxicity [25]. .............................................................................................................................. 7
Figure 11 Action of pyridoxal 5-phosphate in the metabolism of amino acids [29]. ............................... 8
Figure 12 Crystallographic structure of HSA. The domains and subdomains are displayed with different
color, the two main binding sites and Trp214 being highlighted. Adapted from [43]. ........................... 13
Figure 13 ORTEP plot of compound L3. All the non-hydrogen atoms are presented by their 50%
probability ellipsoids. ............................................................................................................................. 29
Figure 14 π-π stacking interactions in the crystal packing of the compound L3. The planarity of the
molecule can be seen through this representation. .............................................................................. 30
Figure 15 FTIR spectra of ligands and complexes showing the shift in the NH and CO bands. The
spectra were obtained in KBr pellets. A: L1-C1; B: L2-C2; C: L3-C3; D: L4-C4; E: L5-C5; F: L6-C6. . 31
Figure 16 UV-visible electronic absorption spectra of ligands and complexes in solution: L1-C1 (MeOH;
62.5μM:66.7μM); L2-C2 (DMF; 100μM:125μM); L3-C3 (DMSO; 50μM:100μM); L4-C4 (DMSO;
60μM:100μM); L5-C5 (DMSO; 60μM:50μM); L6-C6 (DMF; 66.7μM:50μM). ........................................ 33

xiv
Figure 17 First derivative X-band EPR spectra of complexes (a) C1 (MeOH, 1.5mM), (b) C4 (DMSO,
1mM), (c) C5 (DMSO, 1mM) and (d) C6 (DMSO, 1.5mM) as glasses in liquid nitrogen (T=77K). The
experimental spectra are presented in orange and the calculated in blue. ........................................... 34
Figure 18 First derivative X-band EPR spectrum of C2: 1mM in DMSO at 77K. ................................. 35
Figure 19 FTIR spectra of L5 and C7 obtained as KBr pellets. ............................................................ 37
Figure 20 UV-Vis absorption spectra of L5 (blue line) and C7 (orange line). The spectra were obtained
in DMSO solution with [L5]=60μM and [C7]=50μM, at room temperature. ........................................... 37
Figure 21 UV-Vis absorption spectra of C7 (25μM) in two solutions containing different concentration of
C12E10 (20 and 200μM). The spectra were obtained in aqueous solution with 3.85% DMSO. .......... 38
Figure 22 1H NMR spectra of L5 (blue line) and C7 (red line) in DMSO-d6 (300MHz) at 85ºC. The arrows
point out the peaks that are shifted in the complex when compared to the ligand, as evidenced in the
four insets. ............................................................................................................................................. 38
Figure 23 UV-Vis absorption spectra of C4 (A) and C5 (B) with increasing time (time between each
measurement 5 minutes, up to 2.5h; 3h and 24h). Insets: variations at band maxima (λ= 325 nm and λ=
400 nm for C4, and λ= 339 nm and λ= 417 nm for C5) in the first 160 minutes. The spectra were obtained
with 25 μM solutions in PBS (5% DMSO). ............................................................................................ 40
Figure 24 UV-Vis absorption spectra measured with time (time between spectra 5 minutes, up to 2,5h;
3h and 72h) for solutions containing complex C1 (25 μM) in PBS buffer with 5% DMSO. Inset: Variation
at maxima (λ= 310 nm and λ= 418 nm) during the first 160 minutes. ................................................... 41
Figure 25 UV-Vis absorption spectra measured for solutions containing DPPH (60 μM in MeOH) and
different % (v/v) of L1, indicated in the legend. Inset: Linear regression of % scavenging activity vs. [L1]
for the DPPH assay, from which the IC50 is obtained: 49.6 μM. ........................................................... 42
Figure 26 IC50 values (μM) of the scavenging activity determined for the synthetized compounds by the
DPPH assay. * No activity was recorded for C4 and L5, meaning that no decrease in the absorbance at
λ= 515 nm was recorded. ...................................................................................................................... 42
Figure 27 Emission spectra (λex= 509 nm) of the TO-ctDNA complex (1.6 μM: 2.1 μM) in the absence
and in the presence of increasing concentrations of C5 (0.7 – 16 μM) in 2% DMSO/ PBS pH 7.4 after
subtraction of blank emission spectra (arrow indicates the variation observed with increasing
concentration of the complex). .............................................................................................................. 44
Figure 28 Effect of complexes C3 – C7 in TO-ctDNA fluorescence emission: relative fluorescence
intensity (%) at emission maxima with increasing complex concentration. ........................................... 45
Figure 29 Stern-Volmer plots at 530 nm obtained from steady-state (I0/I) measurements for C3 (a) and
C4 (b) – [DNA]~ 2 μM, TO:ctDNA= 0.8 and λex= 509 nm (I0/I data were corrected for reabsorption and
inner-filter-effects). ................................................................................................................................. 46
Figure 30 Stern-Volmer plots at 530 nm obtained from steady-state (I0/I) measurements for C5 (a) and
C6 (b) – [DNA]~ 2 μM, TO:ctDNA= 0.8 and λex= 509 nm (I0/I data were corrected for reabsorption and
inner-filter-effects). ................................................................................................................................. 46
Figure 31 Stern-Volmer plot at 530 nm for the fluorescence quenching of TO-ctDNA with increasing
concentration of C5 (0 – 16 μM). (I0/I data were corrected for reabsorption and inner-filter-effects). ... 47

xv
Figure 32 Modified Stern-Volmer plot at 530 nm for the fluorescence quenching of TO-ctDNA with
increasing concentrations of C5, considering both dynamic and static quenching mechanisms. ........ 48
Figure 33 Stern-Volmer plots at 530 nm obtained from steady-state (I0/I) measurements for C7 – [DNA]~
2.1 μM, TO:ctDNA= 0.8 and λex= 509 nm (I0/I data were corrected for reabsorption and inner-filter-
effects). .................................................................................................................................................. 48
Figure 34 Nuclease activity of C7 in 10 mM PBS. Prepared to be of a 400-μM concentration, the stock
solution was diluted 1:2, 1:8, 1:16, 1:40 and 1:80 due to the lack of solubility. Lanes 1 and 13 are the
controls of native pDNA; 2 is the control of native pDNA in PBS; 12 is the control of native pDNA in PBS
5% DMSO; 3 and 11 are the controls for linearized DNA; 4 is the control of MPA. .............................. 50
Figure 35 Nuclease activity of C1 at 2.5, 5, 10, 25, 50 and 100 μM in 10 mM PBS. The complex is
soluble in water and was dissolved using MilliQ® water. Lanes 1 and 14 are the controls of native pDNA;
2 and 13 are the controls of native pDNA in PBS; 3 and 12 are the controls for linearized DNA. Lane 11
is the control of MPA. ............................................................................................................................ 51
Figure 36 Nuclease activity of C1 and C5 and corresponding ligands L1 and L5 in 10 mM PBS. C1 is
soluble in water and was tested at 100 and 200 μM. Prepared to be of a 400-μM concentration, the stock
solution of C5 was diluted 1:2 and 1:4. Lanes 1 and 16 are the controls of native pDNA; 2 is the controls
of native pDNA in PBS and 5% DMSO; 3 and 15 are the controls for linearized DNA. Lane 7 is the
control of MPA. ...................................................................................................................................... 51
Figure 37 Effect of complexes C1 – C7 in HSA fluorescence emission: relative fluorescence intensity
(%) at emission maxima with increasing complex concentration. ......................................................... 53
Figure 38 Stern-Volmer plot at 339 nm obtained from steady-state (I0/I) measurements for C1 (0-7.78
μM) – [HSA]~ 1.5 μM, and λex= 295 nm (I0/I data were corrected for reabsorption and inner-filter-effects).
............................................................................................................................................................... 53
Figure 39 Scatchard plot at 339 nm obtained from steady-state (I0/I) measurements for C1 (0-7.78 μM)
– [HSA]~ 1.5 μM, and λex= 295 nm, obtaining n= (0.93±0.02) and log K= (4.4±0.1). ........................... 54
Figure 40 Stern-Volmer plot at 339 nm obtained from steady-state (I0/I) measurements for C3 – [HSA]~
1.5 μM, and λex= 295 nm (I0/I data were corrected for reabsorption and inner-filter-effects). ............... 54
Figure 41 Stern-Volmer plots at 339 nm obtained from steady-state (I0/I) measurements for C2 (a) and
C4 (b) – [HSA]~ 1.5 μM, and λex= 295 nm (I0/I data were corrected for reabsorption and inner-filter-
effects). .................................................................................................................................................. 55
Figure 42 Scatchard plots at 339 nm obtained from steady-state (I0/I) measurements for C2 (a) and C4
(b) – [HSA]~ 1.5 μM, and λex= 295 nm (data were corrected for reabsorption and inner-filter-effects). 55
Figure 43 Stern-Volmer plots at 339 nm obtained from steady-state (I0/I) measurements for C5 (a) and
C6 (b) – [HSA]~ 1.5 μM, and λex= 295 nm (I0/I data were corrected for reabsorption and inner-filter-
effects). .................................................................................................................................................. 56
Figure 44 Scatchard plots at 339 nm obtained from steady-state (I0/I) measurements for C5 (a) and C6
(b) – [HSA]~ 1.5 μM, and λex= 295 nm (data were corrected for reabsorption and inner-filter-effects). 56
Figure 45 Quenching of HSA (~1.5 μM in PBS) emission of fluorescence with increasing amounts of
C7 (0-3 μM in 1%DMSO/PBS). As the amount of complex increases, the emission of HSA at 340 nm
decreases and the emission of C7 at 485 nm increases. ..................................................................... 57
xvi
Figure 46 Stern-Volmer (a) and Scatchard (b) plots at 339 nm obtained from steady-state (I0/I)
measurements for C7 – [HSA]~ 1.5 μM, and λex= 295 nm (I0/I data were corrected for reabsorption and
inner-filter-effects). ................................................................................................................................. 57
Figure 47 Results for quenching emission fluorescence of HSA experiments with the synthetized
complexes. ............................................................................................................................................ 58
Figure 48 Concentration-response curves obtained upon incubation of the (a) PC3 and (b) MCF7 cells
for 48 h with the complexes. .................................................................................................................. 59
Figure 49 Cellular viability results obtained with 10 μM solutions of L2, L4, L5, and L6 after 48 h
incubation period with (a) PC3 cells and (b) MCF7 cells. ..................................................................... 60
Figure 50 Normalized fluorescence emission spectra of C7 (50 μM in DMSO) showing the difference
between choosing an excitation wavelength at 400 nm (only the complex is excited) and at 370 nm (both
the ligand and the complex are excited). ............................................................................................... 61
Figure 51 Fluorescence emission spectra measured for solutions containing HSA (ca. 32.5 μM) and
increasing amounts of C7 (0, 6.44, 12.8, 31, 74.8, 132 μM). Excitation at 280 nm. ............................. 63
Figure 52 Variation of the fluorescence intensity (%I0) at the emission maximum with the [C7]/M.
Excitation at 280 nm. ............................................................................................................................. 63
Figure 53 Stern-Volmer plot for the fluorescence quenching of HSA (ca. 32 μM in PBS) with increasing
concentration of C7 (0, 6.44, 12.8, 31, 74.8 μM). Excitation at 280 nm (I0/I data were corrected for
reabsorption and inner filter effects). ..................................................................................................... 64
Figure 54 Stern-Volmer for time-resolved fluorescence measurements ([HSA] ~32μM in PBS and [C7]
= 0, 6.44, 12.8, 31, 74.8). Excitation at 280 nm and the samples were stirred while the measurements
where conducted. .................................................................................................................................. 65
Figure 55 Scatchard plot at 326 nm obtained from steady-state (I0/I) measurements for HSA (ca. 32 μM
in PBS) with increasing concentration of C7 (0, 6.44, 12.8, 31, 74.8 μM). Excitation at 280 nm (data
were corrected for reabsorption and inner filter effects). ....................................................................... 65
Figure 56 Plot of fluorescence average lifetime of HSA (blue) and C7 (red). [HSA]~32μM in PBS and
[C7] = 0, 12.8, 31, 74.8, 132 μM. Excitation at 280 nm. ........................................................................ 66
Figure 57 Fluorescence decay of HSA 32.5 μM in PBS buffer (pH 7.4) at 23º C with λex= 280 nm, λem=
340 nm and fit to a 3 exponential function with decay times of 0.10, 0.50, and 3.42 ns and pre-
exponential coefficients of 0.28, 0.16, and 0.56, respectively. χ2 = 1.12. ............................................. 66
Figure 58 Fluorescence emission spectra measured for solutions containing HSA (ca. 32.5 μM) and
increasing amounts of DMSO (0; 0.99; 1.96; 4.76; 11.50; 20.32%). Excitation at 280 nm. .................. 67
Figure 59 Variation of each component of the HSA fluorescence lifetime (A) and corresponding pre-
exponential coefficients (B) with different molar ratios of HSA-C7. ([HSA]= 32 μM, λex= 280 nm, λem=
340 nm).................................................................................................................................................. 68

xvii
Index of Tables
Table 1 Chemical shift of selected protons in the ligands, δ (ppm). ..................................................... 27
Table 2 IR frequency, ν (cm-1), of the characteristic groups of the ligands. ......................................... 28
Table 3 UV- Visible electronic absorptions bands of the ligands, λmax (nm). ........................................ 28
Table 4 Assignment of the molecular ion peaks by ESI-MS. ................................................................ 28
Table 5 Selected bond distances (Å) and angles (º) for L3. ................................................................. 29
Table 6 Hydrogen bonds for L3 [Å and º]. ............................................................................................ 29
Table 7 Spin Hamiltonian parameters for the Cu(II) complexes obtained by computer simulation of the
experimental spectra [63]. ..................................................................................................................... 35
Table 8 Peak assignment for the copper complexes by ESI-MS.......................................................... 35
Table 9 IC50 values and molar ratio of compound to DPPH obtained from the DPPH assays for the
synthetized compounds. ........................................................................................................................ 43
Table 10 Thiazole orange (TO) quenching assay results for the complexes. ...................................... 49
Table 11 Results for HSA binding studies with the synthetized complexes. ........................................ 58
Table 12 In vitro cytotoxic activity measured as the half-inhibitory concentration (IC50) after 48 h
incubation period for C1 – C7 against two human tumor cell lines: prostate cancer PC3 cells and breast
cancer MCF7 cells. IC50 values are reported in μM (±SD). For comparison Cisplatin was included as a
positive control. (SD = standard deviation). .......................................................................................... 59

xviii

xix
Index of Schemes
Scheme 1 Structure of the metallopharmaceutical cisplatin. .................................................................. 2
Scheme 2 Pyrazole structures. ............................................................................................................... 8
Scheme 3 Salicylaldehyde-pyrazole-carbohydrazide derivatives investigated in the inhibition of the
proliferation of A549 lung cancer cells [33]. ............................................................................................ 9
Scheme 4 General synthesis of the ligands used in this work. .............................................................. 9
Scheme 5 Chemical structure of Thiazole orange [35]. ........................................................................ 11
Scheme 6 Synthesis of L1. ................................................................................................................... 16
Scheme 7 Synthesis of L2. ................................................................................................................... 17
Scheme 8 Synthesis of L3. ................................................................................................................... 17
Scheme 9 Synthesis of L4. ................................................................................................................... 18
Scheme 10 Ligand L5. .......................................................................................................................... 18
Scheme 11 Ligand L6. .......................................................................................................................... 19
Scheme 12 General scheme for the formation of the complexes. R is H or pyridyl and Ar stands for 1 or
2 fused aromatic rings. .......................................................................................................................... 30
Scheme 13 Proposed structures for complexes C1 (A), C2 (B), C3 (C), C4 (D), C5 (E) and C6 (F). .. 36
Scheme 14 Proposed structure for C7. ................................................................................................ 39
Scheme 15 DPPH radical structure having a purple coloration while DPPH(H), the neutral molecule, is
colorless [68]. ........................................................................................................................................ 41

xx

xxi
Symbols and Abbreviations
DNA Deoxyribonucleic Acid
1H NMR Proton Nuclear Magnetic Resonance
A Hyperfine coupling constant
AGE Agarose Gel Electrophoresis
br (FTIR) broad band
cisPT Cisplatin
ctDNA Calf thymus DNA
DMF Dimethyl formamide
DMSO Dimethyl sulfoxide
DPPH 1,1-Diphenyl-2-picryl-hydrazyl radical
dsDNA double-stranded DNA
EPR Electron Paramagnetic Resonance
ESI-MS Electrospray Ionization Mass Spectrometry
FTIR Fourier Transform Infra-Red Spectroscopy
g g value
HSA Human Serum Albumin
I fluorescence emission intensity
IC50 Half-inhibitory concentration
LinDNA Linear DNA
m (FTIR) medium band
m (NMR) multiplet
m/z mass/ charge
MCF7 cell line breast adenocarcinoma cell line
MeOH Methanol
MilliQ Double deionized water
MPA 3-Mercaptopropionic acid
Mtb Mycobacterium tuberculosis
MTT 3-(4,5-dimethylthiazol-2-yl)-2,5-diphenyltetrazolium bromide
n→π* Electronic transition from the n orbital to the π* orbital
NckDNA Nicked circular DNA
PBS Phosphate Buffered Saline
PC3 cell line grade IV prostate carcinoma cell line
pDNA Plasmid DNA
pyr pyridoxal
pz pyrazole
s (FTIR) strong band
s (NMR) singlet
ScDNA Supercoiled plasmid DNA
TO Thiazole Orange
Trp Tryptophan residue
UV-Vis Ultra-violet-Visible Spectroscopy
w (FTIR) weak band
δ chemical shift

xxii
ε extinction coefficient
η refractive index
λem fluorescence emission wavelength
λex excitation wavelength
λmax maximum wavelength
ν vibration frequency
π→π* Electronic transition from the π orbital to the π* orbital
π-system aromatic compound containing a delocalised orbital in one or more structural rings
τ fluorescence lifetime
Φ Fluorescence quantum yield

xxiii

1
Introduction
Cancer is one of the worst diseases in the world and its impact is substantial at a personnel, social and
economic level [1]. It is nowadays the leading cause of death in economically developed countries and
the second one in developing countries [2].
The common feature to all forms of cancer is high genomic instability. This leads to continuous
acquisition of DNA aberrations, which prompt the cancer cells to adapt, resist, and become continuously
more aggressive [2].
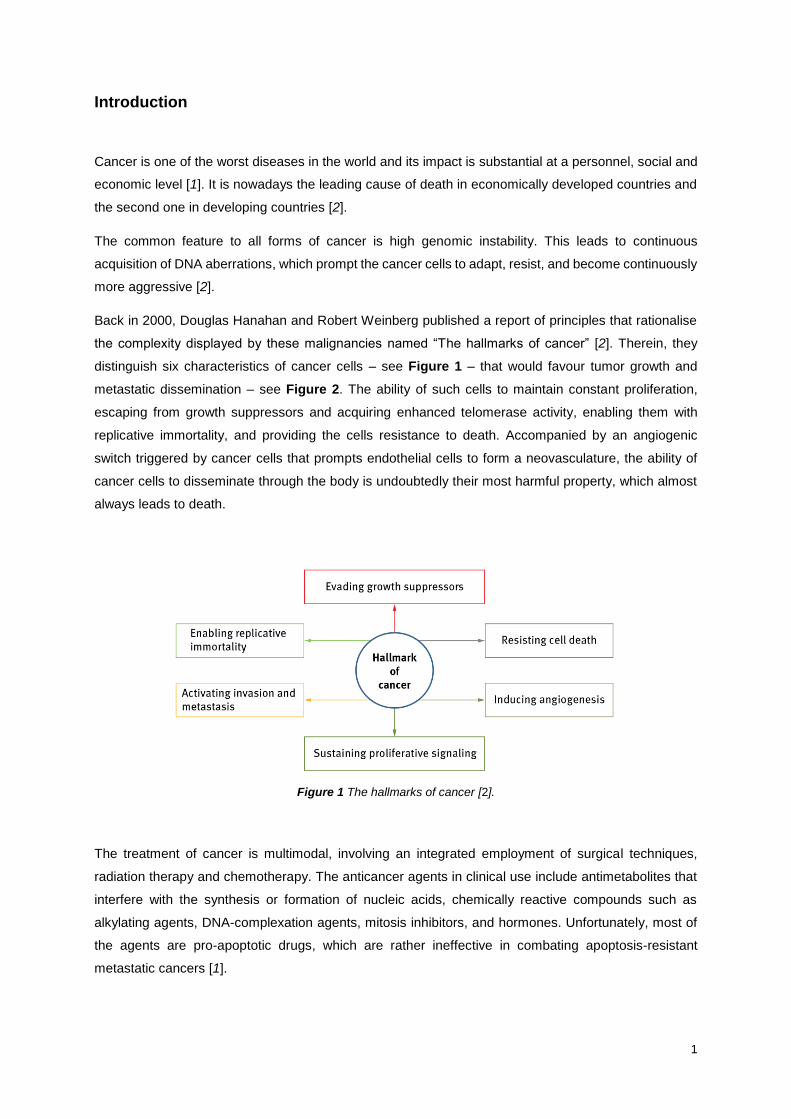
Back in 2000, Douglas Hanahan and Robert Weinberg published a report of principles that rationalise
the complexity displayed by these malignancies named “The hallmarks of cancer” [2]. Therein, they
distinguish six characteristics of cancer cells – see Figure 1 – that would favour tumor growth and
metastatic dissemination – see Figure 2. The ability of such cells to maintain constant proliferation,
escaping from growth suppressors and acquiring enhanced telomerase activity, enabling them with
replicative immortality, and providing the cells resistance to death. Accompanied by an angiogenic
switch triggered by cancer cells that prompts endothelial cells to form a neovasculature, the ability of
cancer cells to disseminate through the body is undoubtedly their most harmful property, which almost
always leads to death.
Figure 1 The hallmarks of cancer [2].
The treatment of cancer is multimodal, involving an integrated employment of surgical techniques,
radiation therapy and chemotherapy. The anticancer agents in clinical use include antimetabolites that
interfere with the synthesis or formation of nucleic acids, chemically reactive compounds such as
alkylating agents, DNA-complexation agents, mitosis inhibitors, and hormones. Unfortunately, most of
the agents are pro-apoptotic drugs, which are rather ineffective in combating apoptosis-resistant
metastatic cancers [1].

2
Figure 2 The multistep metastatic cascade showing the ability of cancer cells to disseminate [2].
Side-effects and resistance to most of these therapies remain, however, major concerns and efforts are
being made to discover and develop new types of compounds to overcome these drawbacks.
Metal complexes as anticancer drugs – Metallopharmaceuticals
Among various types of anticancer drugs, metal-based complexes have been under a lot of attention
since the discovery of the cytotoxic effect exerted by cisplatin (see Scheme 1) in the 1960’s, a metal-
based complex super molecule that acts as an anticancer agent by forming a strong interaction with the
genetic material. Metal ions may not seem an obvious choice as components of pharmaceuticals and it
is common perception that metal compounds are toxic and unstable. However, the particular chemical
reactivities of metal ions, their magnetic and nuclear properties and the structural diversity of their
compounds, have become important in several medical applications, such as treatment and diagnosis
[3]. Moreover, metal ions are essential cellular components that play major roles in the function of
several indispensable biochemical processes for living organisms, being mainly enzymes cofactors [2].
Pt
NH3
NH3
Cl
Cl
Scheme 1 Structure of the metallopharmaceutical cisplatin.
In order to be useful in medicine, chemical compounds need to meet a variety of criteria. The most
obvious requirement is that they must exhibit a medically beneficial effect with minimal toxic side effects,
defined as their therapeutic window. Then, the compound will need to retain sufficient solubility in the

3
aqueous saline environment of the blood. Also, interactions with proteins and other species present in
the blood need to be considered. This is particularly important for metal containing drugs, since proteins
may compete to bind the metal ion and therefore influence its biodistribution and properties.
The biodistribution of a drug is affected by several parameters and the rate of absorption (A), distribution
(D), metabolism (M) and elimination (E) determine its pharmacokinetics. This is based on the hypothesis
that the magnitude of the responses to a drug, both therapeutic and toxic, is a function of its
concentration at its site of action [4].
Although modelling and structure-activity relationships can be applied to metallopharmaceuticals, it is
necessary to introduce additional considerations relating to the role of the metal ion and the nature of
its interaction with the host structure in which it is contained. Metal ions are often quite reactive towards
changing the atoms they are bonded to in aqueous media. However, reaction rates can vary
substantially between different metal ions and between different compounds of the same metal ion.
Controlling the reactivity of the metal compound is one way of controlling which biological system can
have access to the metal [3].
The need to overcome several drawbacks found with cisplatin lead to a development in structures that
can be used with the same therapeutic effect. Many of these pro-drugs present improved ways of
delivering cisplatin (or its analogues) to the target tumour cells [5]. Following the example of cisplatin,
recent research with ruthenium and iron [6] has provided complexes with high cytotoxicity (Figure 3).
Figure 3 Metal-based anticancer drugs that primarily target DNA. (a) Pt(IV) complexes that deliver cisplatin and two equivalents of estradiol (1) [7] and the GST inhibitor ethacrynic acid (2) [8] after activation. Complex (3) binds non-covalently to the nanotube and shows increased cellular uptake and cytotoxicity [9]. (b) Complexes (4) and
(5) are cytotoxic examples of the ruthenium-cyclopentadienyl family of complexes [10].
4
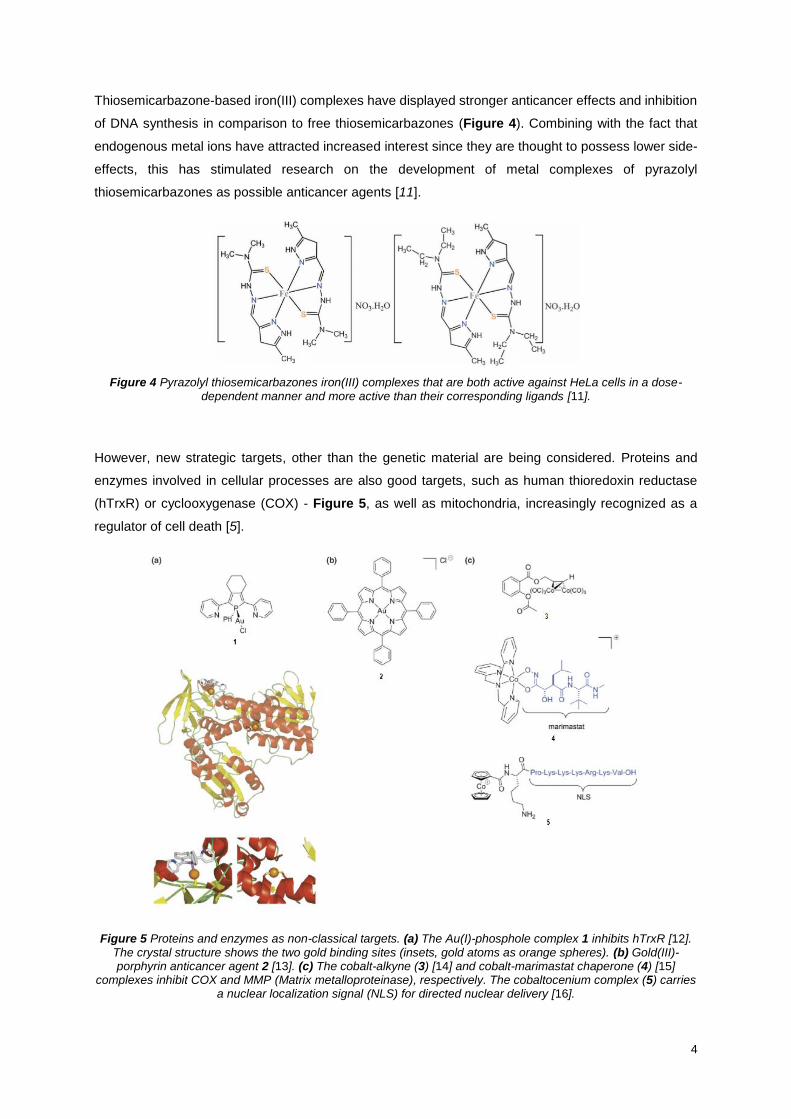
Thiosemicarbazone-based iron(III) complexes have displayed stronger anticancer effects and inhibition
of DNA synthesis in comparison to free thiosemicarbazones (Figure 4). Combining with the fact that
endogenous metal ions have attracted increased interest since they are thought to possess lower side-
effects, this has stimulated research on the development of metal complexes of pyrazolyl
thiosemicarbazones as possible anticancer agents [11].
Figure 4 Pyrazolyl thiosemicarbazones iron(III) complexes that are both active against HeLa cells in a dose-dependent manner and more active than their corresponding ligands [11].
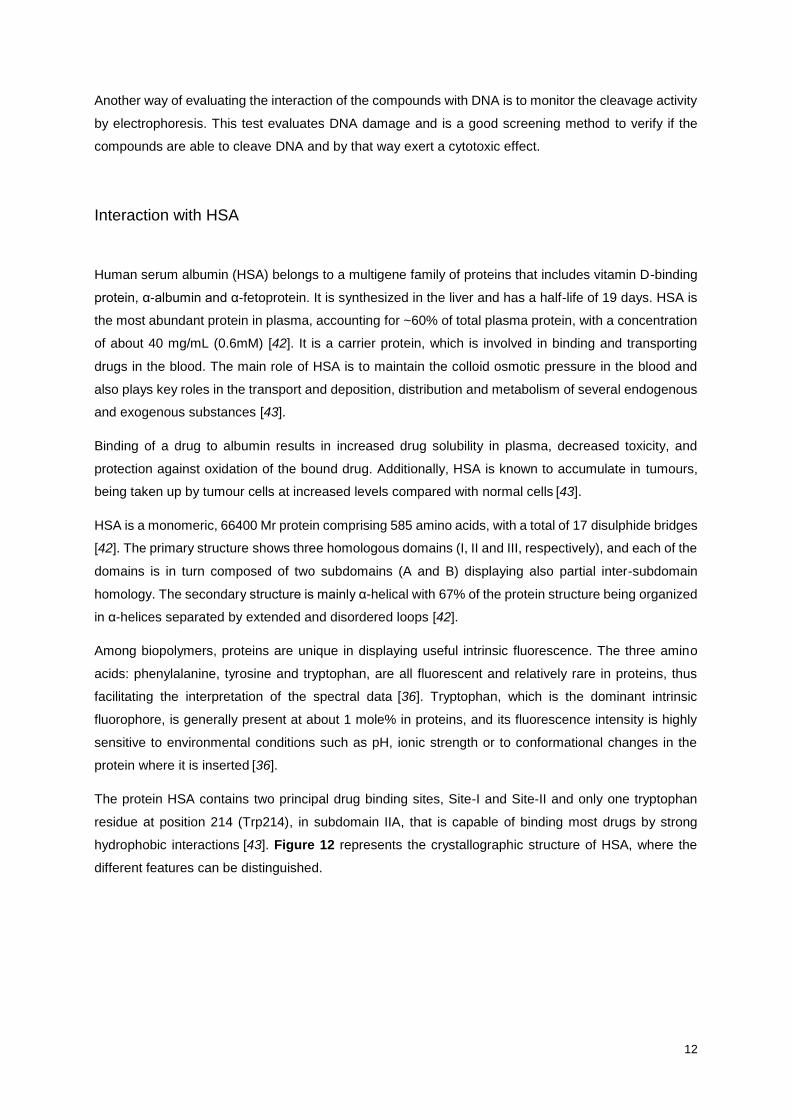
However, new strategic targets, other than the genetic material are being considered. Proteins and
enzymes involved in cellular processes are also good targets, such as human thioredoxin reductase
(hTrxR) or cyclooxygenase (COX) - Figure 5, as well as mitochondria, increasingly recognized as a
regulator of cell death [5].
Figure 5 Proteins and enzymes as non-classical targets. (a) The Au(I)-phosphole complex 1 inhibits hTrxR [12]. The crystal structure shows the two gold binding sites (insets, gold atoms as orange spheres). (b) Gold(III)-porphyrin anticancer agent 2 [13]. (c) The cobalt-alkyne (3) [14] and cobalt-marimastat chaperone (4) [15]
complexes inhibit COX and MMP (Matrix metalloproteinase), respectively. The cobaltocenium complex (5) carries a nuclear localization signal (NLS) for directed nuclear delivery [16].

5
Newly emerging therapies of cancer include the combination of multiple facets of approaches; one of
the promising applications is photodynamic therapy (PDT). This therapy is based on a photosensitizer
(PS), a light-sensitive compound that accumulates in the target tissue and, upon illumination, is activated
and exerts its effects by triggering the production of reactive oxygen species (ROS) in the tissue
microenvironment. Traditional photosensitizers make use of porphyrins’ chemistry in developing
analogue molecules containing metals that facilitate their action [1] - Figure 6. More recently, also
iron(III) catecholates (Figure 7) have demonstrated their potential for cellular imaging and
photocytotoxicity [17].
Figure 6 Rhenium complexes that can be activated by a specific wavelength in order to induce an anti-cancer effect [2].
Figure 7 Reported photocytotoxic iron(III) catecholates [17].
Use of copper and zinc complexes in medicinal chemistry
Copper and zinc are trace elements in the human body but both act as cofactors in enzymes and other
structures making their presence indispensable for the normal function of the organism.
It is therefore no surprise that these two elements are considered in the preparation of
metallopharmaceuticals (Figure 8 and Figure 10). The interest in developing coordination compounds
of different metal ions for application as anticancer agents arises from the fact that platinum-based
drugs, although possessing a powerful anticancer effect, present undesirable side-effects and attack
only a restricted variety of cancer cells. Also, the fact that platinum is an exogenous metal to the human
organism can lead to a response from the body that can severely prejudice the efficacy of the drug and/
or its toxic side-effects can prevail over the therapeutic ones. There is, therefore, an interest in

6
developing new drugs based in these endogenous metal ions, considered to have less side-effects, with
an improved spectrum of efficacy and lower toxicity [18].
The coordination chemistry of copper is dominated by Cu(II) derivatives. Their d9 electronic configuration
promotes d-d transitions resulting in intense coloured species. In these complexes the coordination
number varies from four to six, including four-coordinated square planar, five-coordinated trigonal
bipyramidal and six-coordinated octahedral geometries. Such molecular structures depart from ideal
arrangements showing tetragonal distortions. The variety of available arrays allows for a great
assortment in the choice of the ligands (from mono- to hexa-dentate chelates), and of donor atoms (N,
S, O and halides) [19].
Figure 8 Naphtoquinone derivatives [20] (left) and a flavone derivative [21] (right) copper complexes induced oxidative DNA damage involving generation of ROS.
The use of copper complexes has, in many cases, the genetic material as primary target. The damage
is provided by different mechanisms that can be promoted by intercalation of the compound into the
DNA double helix - Figure 9.
Figure 9 2-oxo-quinoline-3-carbaldehyde Schiff bases Cu(II) complexes that were found to interact with ctDNA through intercalation [22].
Although zinc also appears as Zn(II), its closed-shell d10 electronic configuration does not allow for d-d
transitions and, consequently, most of its compounds are white, except when the anion is coloured. This
also means that no crystal field stabilization energy is associated with an exact geometry and zinc,
unlike many other metals, prefers tetrahedral geometries, a common feature of the metal site in zinc
enzymes [23]. Also with zinc, DNA is the primary target, but some of the complexes have found
usefulness in photodynamic therapy [1].

7
Figure 10 Terpyridine based zinc(II) supermolecular complexes (1) that have demonstrate higher in vitro cytotoxicity than cisplatin [24] and zinc(II) phthalocyanines (2) that have showed excellent photocytotoxicity [25].
As the interest in the development of antitumor molecules is increasing astonishingly, there is always a
pursuit of designing compounds to combine with targeted organic compounds to inhibit specific enzymes
because many anticancer drugs are either classic non-targeted coordination complexes or organic
alkylating agents with serious side effects. In this regard, the extraordinary ability for coordination of
organic ligands, presented both by copper and zinc, makes these two elements good bets for such
purpose [1].
The success of metal-based drugs is closely linked to the proper choice of the auxiliary ligand, which
plays a key role in modifying reactivity, lipophilicity, and stabilizing specific oxidation states.
Schiff-base ligands
Ligands containing nitrogen atoms have been widely used in coordination chemistry and, in particular,
as elements for the synthesis and development of pharmaceuticals. It is then of no surprise that a lot of
work has been done using the extraordinary simple chemistry that leads to the formation of Schiff bases
[26].
Structurally, Schiff bases (also known as imine or azomethine) are nitrogen analogues of an aldehyde
or ketone in which the carbonyl group (C=O) has been replaced by an imine or azomethine group (C=N).
They are formed by the condensation of an aldehyde or ketone with a primary amine. Schiff bases are
widely used organic compounds. One of the most interesting characteristics of Schiff bases is its
modular character, since the combination of different amines with different aldehydes introduces
different features. They are used as pigments and dyes, catalysts, intermediates in organic synthesis,
and as polymer stabilisers. This kind of compounds has also been shown to exhibit a broad range of
biological activities, including antifungal, antibacterial, antimalarial, antiproliferative, anti-inflammatory,
antiviral and antipyretic properties [26].
Schiff bases and their metal complexes, especially the ones containing heterocyclic amines as co-
ligands, have been an important field in drug research and development due to their broad bioactivities
such as antitumor [1].

8
Aromatic Schiff bases, pyridoxal based ones and especially, their metal complexes have drawn special
interest in the last few decades due to their powerful antitumor activities [27]. Pyridoxal containing Schiff
bases impart a physiological relevance as pyridoxal 5-phosphate (PLP) is the biologically active form of
vitamin B6, and a versatile enzyme cofactor responsible for amino acid metabolism in organisms ranging
from bacteria to humans (see Figure 11 for exemplification). Therefore, metal complexes with pyridoxal
based ligands are important functional units in bioinorganic chemistry [28].
Figure 11 Action of pyridoxal 5-phosphate in the metabolism of amino acids [29].
Hydrazides, carbohydrazides and similar compounds are well known as useful building blocks for the
synthesis of a variety of heterocyclic rings. A large number of heterocyclic carbohydrazides and their
derivatives are reported to exhibit significant biological activities, and the carbohydrazide function
represents an important pharmacophoric group in several classes of therapeutically useful substances
[30]. Moreover, the fact that nowadays there are several different carbohydrazides commercially
available makes these structures good starting materials for further reactions.
When referring ligands that contain nitrogen, it is impossible not to name pyrazoles (see Scheme 2).
These consist of doubly unsaturated 5-membered rings containing two nitrogen atoms (positions 1 and
2 of the ring) [31]. The attractiveness of pyrazole and its derivatives is their versatility that allows the
synthesis of a series of analogues containing different moieties, thus affecting the electronics and by
extension the properties of the resultant compounds [32].
The core pyrazole structure, in general, has attracted widespread attention because of the diversity of
biological activity shown by derivatives of this nucleus, such as antimicrobial, anticancer, cytotoxic,
analgesic, anti-inflammatory, antihypertensive, central nervous system activity like antiepileptic,
antidepressant, etc. [30,31].
NH
N
1H-pyrazole
N
N
3H-pyrazole
NN
4H-pyrazole
Scheme 2 Pyrazole structures.

9
Substitution with a carbohydrazide moiety at position C5 of the pyrazole ring provides derivatives that
can undergo condensation with aldehydes forming Schiff bases. These compounds also exhibit
antitumor activity, particularly those resulting from the reaction with salicylaldehyde [30] - Scheme 3.
Scheme 3 Salicylaldehyde-pyrazole-carbohydrazide derivatives investigated in the inhibition of the proliferation of A549 lung cancer cells [33].
Considering all the evidences so far, it is intended with this work to synthesize and characterize new
Schiff base complexes and to further analyze their interaction with biomolecules, as well as to evaluate
their potential as anticancer drugs. Our choice fell on copper and zinc complexes with Schiff bases
derived from pyrazole-3-carbohydrazide and aromatic substituents, such as pyridoxal, salicylaldehyde
and its derivatives, and 2-hydroxynaphthene-1-carbaldehyde. Scheme 4 represents the general
approach for the synthesis of the ligands.
Scheme 4 General synthesis of the ligands used in this work.
The use of ligands with a naphthalene moiety will provide means to evaluate the importance of a larger
delocalized π system, since many of the interactions with biological molecules are sustained by π-π
stacking or electrostatic forces.
Also, the use of a pyridyl substituent at N-1 of the pyrazole ring will allow checking if the efficacy of such
product is higher than that of the other complexes with a proton at the same position.

10
Biological Evaluation Methods
An important requisite when developing molecules to act as pharmaceutical drugs is their ability to
interact with biological targets. When studying organic materials, the possibility of using modeling and
computer added discovery in structure-activity relationships is common practice in many pharmaceutical
companies and laboratories. The use of such aids is someway more difficult when dealing with
metallodrugs, especially due to the possible interactions of the metal ion with the host structure
increasing the number of variables to consider. In this case, scientists rely on their knowledge about
certain structures that have already proven their worth in similar tasks. The job is then to develop new
structures based on those and try to rationalize to more efficient compounds.
Many of the inorganic or organometallic complexes accomplished in such synthesis are not soluble in
water but only in organic solvents, which cannot be present in high percentage when the biological
studies are being undertaken. Even when they are water soluble, they may not be soluble in the saline
environment that is found in the human body. And, for sure, there is no guarantee that they will maintain
their structure unchanged for the time it takes to obtain the results of such studies.
Therefore, the first step in evaluating the possibility of interaction with biological molecules is to be sure
that the compounds will maintain their structure for the necessary time period without substantial
degradation or precipitation in the saline environment. To do so, spectroscopic studies can be done in
a solvent mimetizing the cellular environment, for a time period considered relevant for the biological
studies.
Interaction with the genetic material
As stated before, cancer is characterized by high genomic instability and, therefore, it’s no surprise to
consider deoxyribonucleic acid (DNA) as one of the primary targets for anticancer drugs. Others include
proteins, membranes, etc., and in fact the true target(s) responsible for the biological activity of a
compound is quite difficult to determine.
Many of the metal complexes that are being developed consider DNA as target based mainly on the
previous work done with cisplatin.
Binding to the genetic material can be evaluated directly by titration of the complex with DNA and
following spectroscopic changes in the range of the ultra-violet and visible region (UV-Vis) or by an
indirect technique using the displacement of a probe and following the quenching of the emission of
fluorescence by the system probe bound to DNA [34].
Thiazole orange (TO - Scheme 5) is a fluorescent dye that has the ability to intercalate in between the
DNA base pairs, and can therefore be used in analytical studies such as the quenching of its
fluorescence by binding of a second competing molecule [35].

11
TO is a non-planar chromophore composed of a benzothiazole derivative and a quinolinium ring linked
via a monomethine bridge – see Scheme 5.
Scheme 5 Chemical structure of Thiazole orange [35].
The increase in quantum efficiency of TO upon intercalation results from the restriction of rotation around
the monomethine bridge connecting the benzothiazole and quinolinium heterocycles of the dye. Both
the benzothiazole and quinolinium rings adapt to the propeller twist of the base pairs, while a charge
symmetry is created through resonance by the two nitrogen atoms present in the molecule.
It has been showed that the fluorescence of TO-dsDNA can be quenched by the presence of another
species, namely by displacement of the TO, thus lowering the quantum yield [35].
TO fluorescence displacement experiments can then be used to characterize the interaction of
complexes with DNA. If a metal complex intercalates into DNA it leads to a decrease in the binding sites
of DNA occupied by TO, resulting in the decrease of the fluorescence intensity of the TO-DNA system
[34].
The quenching of the fluorescence intensity can then be studied by the Stern-Volmer equation [36]
𝐼0
𝐼= 1 + 𝐾𝑆𝑉 [𝑄]
Equation 1
where I0 and I are the fluorescence intensities in the absence and in the presence of quencher,
respectively, KSV is the Stern-Volmer quenching constant and [Q] is the concentration of quencher. A
plot of I0/I versus [Q] will give KSV as the slope. In order to minimize errors introduced by reabsorption
and inner-filter effects, the ratio I0/I is corrected using the absorbance values measured for each solution
at the excitation and emission wavelengths, according to already established relationships [37,38,39].
Therefore, TO can be used as a probe for the competitive binding of other compounds towards DNA
[40]. The results can be expressed in terms of the apparent binding constant, Kapp, which may be
estimated from the equation:
Kapp [Complex] = Kapp-TO [TO]
Equation 2
where Kapp-TO is the apparent binding constant of TO, assumed to be 3.16x10⁵ M-1 [41], [TO] is the
concentration of TO used and [Complex] is the concentration of the test compound at 50% quenching.
12
Another way of evaluating the interaction of the compounds with DNA is to monitor the cleavage activity
by electrophoresis. This test evaluates DNA damage and is a good screening method to verify if the
compounds are able to cleave DNA and by that way exert a cytotoxic effect.
Interaction with HSA
Human serum albumin (HSA) belongs to a multigene family of proteins that includes vitamin D-binding
protein, α-albumin and α-fetoprotein. It is synthesized in the liver and has a half-life of 19 days. HSA is
the most abundant protein in plasma, accounting for ~60% of total plasma protein, with a concentration
of about 40 mg/mL (0.6mM) [42]. It is a carrier protein, which is involved in binding and transporting
drugs in the blood. The main role of HSA is to maintain the colloid osmotic pressure in the blood and
also plays key roles in the transport and deposition, distribution and metabolism of several endogenous
and exogenous substances [43].
Binding of a drug to albumin results in increased drug solubility in plasma, decreased toxicity, and
protection against oxidation of the bound drug. Additionally, HSA is known to accumulate in tumours,
being taken up by tumour cells at increased levels compared with normal cells [43].
HSA is a monomeric, 66400 Mr protein comprising 585 amino acids, with a total of 17 disulphide bridges
[42]. The primary structure shows three homologous domains (I, II and III, respectively), and each of the
domains is in turn composed of two subdomains (A and B) displaying also partial inter-subdomain
homology. The secondary structure is mainly α-helical with 67% of the protein structure being organized
in α-helices separated by extended and disordered loops [42].
Among biopolymers, proteins are unique in displaying useful intrinsic fluorescence. The three amino
acids: phenylalanine, tyrosine and tryptophan, are all fluorescent and relatively rare in proteins, thus
facilitating the interpretation of the spectral data [36]. Tryptophan, which is the dominant intrinsic
fluorophore, is generally present at about 1 mole% in proteins, and its fluorescence intensity is highly
sensitive to environmental conditions such as pH, ionic strength or to conformational changes in the
protein where it is inserted [36].
The protein HSA contains two principal drug binding sites, Site-I and Site-II and only one tryptophan
residue at position 214 (Trp214), in subdomain IIA, that is capable of binding most drugs by strong
hydrophobic interactions [43]. Figure 12 represents the crystallographic structure of HSA, where the
different features can be distinguished.

13
Figure 12 Crystallographic structure of HSA. The domains and subdomains are displayed with different color, the two main binding sites and Trp214 being highlighted. Adapted from [43].
Upon excitation at 295 nm, HSA emits strong fluorescence at around 340 nm, which can be attenuated
by a binding event at, or close to, the Trp214, due to its susceptibility to changes in its environment [44].
The quenching of fluorescence can then be analyzed in order to evaluate the binding ability of a
compound. Once again the Stern-Volmer equation (Equation 1) can be used for this purpose. Since
this process implies the formation of a complex between HSA and the species under study, static
quenching will be observed and the Scatchard equation can be employed to calculate the binding
constant and number of binding sites [45]:
log (𝐼0 − 𝐼
𝐼) = log 𝐾 + 𝑛 log[𝑄]
Equation 3
where I0 and I are the fluorescence intensities of HSA in the absence and presence of quencher, K and
n are the binding constant and the number of binding sites, respectively. Thus, a plot of log [(I0-I)/I]
versus log [Q] can be used to determine K (binding constant) from the intercept on y-axis and n (binding
sites) from the slope.
The evaluation of the binding ability of the complex to albumin is very important since this protein can
serve as a carrier for the drug to its site of action. By following the changes in the fluorescence emission
of Trp214, this assessment can be done and the interaction can be proven.

14
Cytotoxicity
Ultimately, our goal is to develop complexes able to exert a cytotoxic effect against cancer cells. Before
testing in an organism, the compounds have to undergo a series of tests for proving their efficacy, as
well as their tolerance by healthy cells. These tests are performed in cell lines using the normal
metabolism for assessing the viability of the cells after incubation with the compounds.
The cytotoxic potential of the compounds was determined in two human tumour cell lines: MCF7 (breast
adenocarcinoma) and PC-3 (grade IV prostate carcinoma), using the MTT (3-(4,5-dimethylthiazol-2-yl)-
2,5-diphenyltetrazolium bromide) assay, a colorimetric determination of cellular viability during in vitro
treatment with a drug.
The assay measures the amount of MTT reduction to purple formazan by mitochondrial dehydrogenase
in living cells and it assumes that cell viability is proportional to the production of formazan that is
measured spectrophotometrically, usually between 500 and 600 nm [46].

15
Experimental
Materials
5-methyl-1H-pyrazole-3-carbohydrazide, pyridoxal hydrochloride, 2-hydroxybenzaldehyde, 3-methoxy-
2-hydroxybenzaldehyde, and 3-ethoxy-2-hydroxybenzaldehyde (all from Sigma) were used as received.
The metal salts CuCl2.2H2O (Merck) and ZnCl2 (Riedel-de-Häen) were used as supplied. Methanol
(Aldrich) and dimethyl sulfoxide (Carlo Erba) were p.a. grade and used without further purification.
Millipore® water was used throughout all the experiments with biological macromolecules. Phosphate
buffered saline (PBS) was purchased from Sigma-Aldrich as tablets readily soluble in water (deionized
water) giving 0.01 M in phosphate (NaCl 0.138 M; KCl 0.0027 M), pH 7.4 at 25º C. Calf thymus DNA
(ctDNA), thiazole orange (TO) and Human Serum Albumin (HSA) (fatty acid free) were purchased from
Sigma-Aldrich. All other materials not mentioned here were either p.a. or reagent grade.
Instrumentation
Elemental analysis for C, H and N were carried on a FISONS EA 1108 CHNS-O apparatus at Laboratório
de Análises of Instituto Superior Técnico. The 1H NMR spectra were recorded at ambient temperature
on a Bruker Avance II + 300 (UltraShieldTM Magnet) spectrometer operating at 300.13 MHz. The
chemical shifts are reported in ppm using tetramethylsilane as internal reference. The Infra-Red spectra
were recorded on a JASCO FT/IR 4100 spectrophotometer and the UV-Visible absorption spectra were
recorded on a Perkin Elmer Lambda 35 UV-Vis spectrophotometer with 10.0 mm cuvettes. A 500-MS
Varian Ion Trap Mass Spectrometer was used to measure ESI-MS spectra of methanolic solutions of
the complexes in both positive and negative modes. The first derivative X-band EPR spectra of the
frozen solutions (frozen in liquid nitrogen, 77 K) were recorded on a Bruker ESP 300E spectrometer.
The spectrometer was operated at ~ 9.51 GHz with a frequency modulation of 100 KHz. An ion
chromatography system was used to determine the presence of chloride using a DIONEX ICS-1500,
equipped with a IonPac® AS14A 4-mm analytical (4x250 mm) column and a suppressed conductivity
at 10 μSFS ASRS®-ULTRA AutoSuppression® recycle mode detection system. Fluorescence
measurements were carried out on a SPEX® Fluorolog spectrofluorimeter (Horiba Jobin Yvon) in a FL3-
11 configuration, equipped with a Xenon lamp and in a 10.0 mm quartz cuvette. The instrumental
response was corrected by means of a correction function provided by the manufacturer. The
experiments were carried out at room temperature and are all steady-state measurements, unless
otherwise stated.

16
Preparation of solutions for biological assays
Stock solutions of DNA were prepared by dissolving the nucleic acid in PBS buffer (pH 7.4), kept at 4ºC
for about 48 h to get homogeneity, and used within a week. Solutions of DNA gave ratios of absorbance
A260/A280 of ca. 1.9, indicating that the DNA was sufficiently protein free [47]. The concentration of the
prepared ctDNA stock solutions were calculated based on their absorbance at 260 nm by using the per
nucleotide extinction coefficient ε260 = 6600 M-1 cm-1 [47].
The thiazole orange solution was prepared by dissolving ~1 mg of the compound in 6 mL of deionized
water, providing a 317 μM initial concentration and used in the same day.
The fatty acid free HSA solutions were prepared by dissolving the protein in PBS buffer (pH 7.4). The
solutions were gently swirled and allowed to equilibrate overnight at 4ºC. They were used within 24h.
The HSA concentrations were estimated spectrophotometrically considering an extinction coefficient of
36850 M-1 cm-1 at 280 nm [46]. Typically, the concentration of the HSA stock solution was ~40 μM.
Synthesis of the ligands
(E)-N’-((3-hydroxy-5-(hydroxymethyl)-2-methylpyridin-4-yl)-5-methyl-1H-pyrazole-3-
carbohydrazide hydrochloride (L1)
Ligand L1 was synthesized by refluxing a methanolic solution (25 ml) of 5-methyl-1H-pyrazole-3-
carbohydrazide (250 mg, 1.78 mmol), with pyridoxal hydrochloride (363 mg, 1.78 mmol) also taken in
methanol (25 ml), for ca. 5 hours in the presence of two drops of acetic acid. A white solid compound
separated out. The solid was filtered off, washed with cold methanol and dried in vacuum. (Yield: 482
mg, 83%); ESI-MS (electrospray ionization mass spectra) (MeOH) m/z [Found (Calcd)]: 290.1 (290.12)
(100%) [L+H]+; 288.6 (288.12) (15%) [L-H]-; 324.2 (324.09) (100%) [L+Cl]-; 612.9 (613.24) (80%)
[2*L+Cl]-. Anal. Calc. for C13H16ClN5O3: C, 47.90; H, 4.95; N, 21.50. Found: C, 48.1; H, 4.9; N, 21.7%.
FTIR (KBr, cm-1): 3440 (m, pyr, -CH2OH), 3338 (s, NH), 3204 (s, pyr, -OH), 2868 (s, pyr, N-H+-Cl-),
1658 (s, -C=O), 1599 (m, azomethine, C=N), 1562 (s, C=C), 1411 (m, pz, C=N). 1H NMR (300 MHz,
DMSO-d6, δ (ppm)): 2.08 (s, 1H, pyr, -CH2OH), 2.31 (s, 3H, pz, -CH3), 2.61 (s, 3H, pyr, -CH3), 4.74 (s,
2H, pyr, -CH2OH), 6.62 (s, 1H, pz, -CH), 8.19 (s, 1H, pyr, -CH), 9.04 (s, 1H, -CH=N), 12.83 (s, 1H, pz, -
NH), 13.21 (s, 1H, NNH). UV-Vis [MeOH, λmax/nm (ε/M-1cm-1)]: 296 (1.55x10⁴), 309 (1.98x10⁴), 319
(1.96x10⁴), 342 (1.81x10⁴), 355 (1.61x10⁴), 403 (5.01x10²).
NH+ OH
CH3
O
OH
Cl-
+NH
N
O
NH
NH2
CH3NH
+
NONH
N
NH
OH
OH
CH3
CH3
Cl-
Scheme 6 Synthesis of L1.

17
(E)-N’-(2-hydroxybenzylidene)-5-methyl-1H-pyrazole-3-carbohydrazide (L2)
Ligand L2 was synthesized in a procedure similar to the one used for L1 with 2-hydroxybenzaldehyde
(229 mg, 1.88 mmol, 0.20 ml) instead of pyridoxal hydrochloride. A white solid separated out after
cooling to room temperature. The solution was evaporated and the solid was washed with cold methanol
and dried in vacuum. (Yield: 372 mg, 85.7%); ESI-MS (MeOH) m/z [Found (Calcd)]: 245.2 (245.10)
(100%) [L+H]+; 243.8 (243.1) (95%) [L-H]-. Anal. Calc. for C12H12N4O2: C, 59.01; H, 4.95; N, 22.94.
Found: C,59.0; H, 4.9; N, 22.3%. FTIR (KBr, cm-1): 3281 (m, -N-NH), 3172 (m, -OH), 1683 (s, -C=O),
1649 (m, azomethine, C=N), 1545 (s, C=C), 1488 (m, pz, C=N). 1H NMR (300 MHz, DMSO-d6, δ (ppm)):
2.30 (s, 3H, pz, -CH3), 6.52 (s, 1H, pz, -CH), 6.94 (m, 2H, aromatic), 7.29 (m, 1H, aromatic), 7.43 (m,
1H, aromatic), 8.66 (s, 1H, -CH=N), 11.46 (s, 1H, -OH), 11.98 (s, 1H, NNH), 13.14 (s, 1H, pz, -NH). UV-
Vis [DMF, λmax/nm (ε/M-1cm-1)]: 276 (1.03x10⁴), 286 (1.61x10⁴), 297 (1.77x10⁴), 325 (1.25x10⁴), 332
(1.20x10⁴).
OH
O
NNH
O
NHNH2
+N
OH
NH NNH
O
Scheme 7 Synthesis of L2.
(E)-N’-(3-methoxy-2-hydroxybenzylidene)-5-methyl-1H-pyrazole-3-carbohydrazide
(L3)
Ligand L3 was synthesized in a procedure similar to the one used for L1 with 3-methoxy-2-
hydroxybenzaldehyde (434 mg, 2.85 mmol) instead of pyridoxal hydrochloride. A white solid separated
out. The solid was filtered off, washed with cold methanol and dried in vacuum. (Yield: 528 mg, 67.5%);
ESI-MS (MeOH) m/z [Found (Calcd)]: 275.3 (275.11) (20%) [L+H]+; 297.2 (297.11) (100%) [L+Na]+;
570.8 (571.22) (55%) [2L+Na]+; 273.3 (273.11) (100%) [L-H]−. Anal. Calc. for C13H14N4O3: C, 56.93; H,
5.14; N, 20.43. Found: C, 56.8; H, 5.3; N, 20.4%. FTIR (KBr, cm-1): 3302 (s, NH), 1666 (s, -C=O), 1610
(m, azomethine, C=N), 1542 (s, C=C), 1468 (s, pz, C=N). 1H NMR (300 MHz, DMSO-d6, δ (ppm)): 2.30
(s, 3H, pz, -CH3), 3.81 (s, 3H, -OCH3), 6.52 (s, 1H, pz, -CH), 6.85 (m, 1H, aromatic), 7.01 (m, 2H,
aromatic), 8.66 (s, 1H, -CH=N), 11.24 (s, 1H, -OH), 11.96 (s, 1H, NNH), 13.14 (s, 1H, pz, -NH). UV-Vis
[DMSO, λmax/nm (ε/M-1cm-1)]: 300 (2.72x10⁴), 309 (2.55x10⁴), 333 (1.05x10⁴).
OH
O
O
NNH
O
NHNH2
+N
OH
NH NNH
O
O
Scheme 8 Synthesis of L3.

18
(E)-N’-(3-ethoxy-2-hydroxybenzylidene)-5-methyl-1H-pyrazole-3-carbohydrazide (L4)
Ligand L4 was synthesized in a procedure similar to the one used for L1 with 3-ethoxy-2-hydroxy
benzaldehyde (298 mg, 1.79 mmol) instead of pyridoxal hydrochloride. A white yellowish solid separated
out after evaporation of some solvent. The solid was filtered off, washed with cold methanol and dried
in vacuum. (Yield: 318 mg, 62%); ESI-MS (MeOH) m/z [Found (Calcd)]: 289.3 (289.12) (30%) [L+H]+;
598.9 (599.24) (100%) [2L+H]+; 287.4 (287.12) (75%) [L-H]-; 574.8 (575.24) (100%) [2L-H]−. Anal. Calc.
for C14H16N4O3: C, 58.32; H, 5.59; N, 19.43. Found: C, 57.8; H, 5.7; N, 19.3%. FTIR (KBr, cm-1): 3311
(w, -N-NH), 3253 (w, -OH), 1667 (s, -C=O), 1539 (s, C=C), 1467 (s, pz, C=N). 1H NMR (300 MHz,
DMSO-d6, δ (ppm)): 1.34 (t, 3H, -OCH2CH3), 2.30 (s, 3H, pz, -CH3), 4.07 (m, 2H, -OCH2CH3), 6.53 (s,
1H, pz, -CH), 6.83 (m, 1H, aromatic), 6.99 (m, 2H, aromatic), 8.66 (s, 1H, -CH=N), 11.28 (s, 1H, -OH),
11.97 (s, 1H, NNH), 13.14 (s, 1H, pz, -NH). UV-Vis [DMSO, λmax/nm (ε/M-1cm-1)]: 300 (3.11x10⁴), 310
(2.90x10⁴), 341 (1.02x10⁴).
OH
O
O
NNH
O
NHNH2
+N
OH
NH NNH
O
O
Scheme 9 Synthesis of L4.
(E)-N’-((2-hydroxynaphthalen-1-yl) methylene)-5-methyl-1H-pyrazole-3-
carbohydrazide (L5)
Ligand L5 was previously prepared by a colleague (Dr. Somnath Roy) and only its characterization will
be presented. ESI -MS (MeOH) m/z [Found (Calcd)]: 293.4 (293.11) (35%) [L-H]-; 329.1 (329.08) (10%)
[L+Cl]-; 586.9 (587.22) (100%) [2L-H]−. Anal. Calc. for C16H14N4O2: C, 65.30; H, 4.79; N, 19.04. Found:
C, 65.1; H, 4.8; N, 18.7%. FTIR (KBr, cm-1): 3196 (s, -N-NH), 3148 (s, -OH), 1671 (s, -C=O), 1626 (m,
C=N), 1583 (s, C=C), 1468 (m, pz, C=N). 1H NMR (300 MHz, DMSO-d6, δ (ppm)): 2.32 (s, 3H, pz, -
CH3), 6.56 (s, 1H, pz, -CH), 7.21-8.15 (5m, 6H, aromatic), 9.65 (s, 1H, -CH=N), 12.04 (s, 1H, -OH),
12.93 (s, 1H, NNH), 13.20 (s, 1H, pz, -NH). UV-Vis [DMSO, λmax/nm (ε/M-1cm-1)]: 262 (2.53x10⁴), 300
(7.78x10³), 312 (1.54x10⁴), 325 (2.28x10⁴), 345 (1.36x10⁴), 360 (2.06x10⁴), 375 (1.91x10⁴), 435
(4.13x10²).
OH
N
NH
ON
NH
Scheme 10 Ligand L5.

19
(E)-N’-((2-hydroxynaphthalen-1-yl) methylene)-5-methyl-1-(pyridine-2-yl)-pyrazole-3-
carbohydrazide (L6)
Ligand L6 was previously prepared by a colleague (Dr. Somnath Roy) and only its characterization will
be presented. ESI-MS (MeOH) m/z [Found (Calcd)]: 370.6 (371.14) (51%) [L-H]−. Anal. Calc. for
C21H17N5O2: C, 67.91; H, 4.61; N, 18.86. Found: C, 68.0; H, 4.7; N, 18.5%. FTIR (KBr, cm-1): 3423 (br,
-N-NH and -OH), 1707 (m, -C=O), 1666 (s, C=N), 1592 (m, C=C), 1473 (m, pz, C=N). 1H NMR (300
MHz, DMSO-d6, δ (ppm)): 2.71 (s, 3H, pz, -CH3), 6.85 (s, 1H, pz, -CH), 7.19-8.54 (7m, 10H, aromatic),
9.56 (s, 1H, -CH=N). UV-Vis [DMF, λmax/nm (ε/M-1cm-1)]: 268 (1.66x10⁴), 275 (1.57x10⁴), 312 (1.29x10⁴),
325 (1.91x10⁴), 346 (1.18x10⁴), 361 (1.78x10⁴), 377 (1.64x10⁴).
OH
N
NH
ON
N N
Scheme 11 Ligand L6.
Synthesis of the complexes
Complex C1 (L1 + CuCl2.2H2O)
To a solution of L1 (289 mg, 0.887 mmol) in methanol (10 ml), CuCl2.2H2O (170 mg, 0.997 mmol) taken
in the same solvent was added dropwise with constant stirring in the presence of two drops of NaOH
0.5M. Immediately, the solution turned olive green. Stirring was continued for ca. 2 hours and a green
coloured compound separated out from the reaction mixture. The solid was filtered, washed with cold
methanol and dried in vacuum. (Yield: 183 mg, 47%); Anal. Calc. for C13H15Cl2CuN5O3.4H2O: C, 31.49;
H, 4.68; N, 14.13. Found: C, 31.8; H, 3.3; N, 14.1%. FTIR (KBr, cm-1): 3478 (w, pyr, -CH2OH), 2857 (m,
pyr, N-H+-Cl-), 1575 (s, C=N), 1544 (s, C=C), 1430 (s, pz, C=N). UV-Vis [MeOH, λmax/nm (ε/M-1cm-1)]:
236 (2.20x10⁴), 317 (8.02x10³), 332 (9.60x10³), 345 (9.85x10³), 383 (9.16x10³), 401 (1.48x10⁴), 419
(1.64x10⁴).
Complex C2 (L2 + CuCl2.2H2O)
To a hot solution of L2 (122 mg, 0.499 mmol) in methanol (10 ml), CuCl2.2H2O (85 mg, 0.499 mmol)
taken in H2O/ MeOH (8ml, 1:2 v/v) was added dropwise with constant stirring at 55ºC in the presence
of two drops of NaOH 0.5M. Immediately, the solution turned olive green and the stirring was continued
for ca. 5 hours. A green coloured compound separated out from the reaction mixture. This was filtered,
washed with cold methanol and dried in vacuum. (Yield: 140 mg, 82%); ESI-MS (MeOH) m/z [Found
(Calcd)]: 337.8 (337.99) (90%) [M-Cl+MeOH]+; 340.4 (339.99) (100%) [M-H]−. Anal. Calc. for
C12H11ClCuN4O2: C, 42.11; H, 3.24; N, 16.37. Found: C, 42.3; H, 3.5; N, 16.2%. FTIR (KBr, cm-1): 1618
20
(s, azomethine, C=N), 1539 (s, C=C), 1440 (m, pz, C=N). UV-Vis [DMF, λmax/nm (ε/M-1cm-1)]: 269
(1.40x10⁴), 287 (1.28x10⁴), 298 (1.41x10⁴), 313 (1.38x10⁴), 327 (1.22x10⁴), 383 (1.02x10⁴), 396
(1.08x10⁴).
Complex C3 (L3 + CuCl2.2H2O)
Complex C3 was synthesized in a procedure similar to the one used for C1 with L3 (272 mg, 0.992
mmol) instead of L1. A green coloured compound separated out from the reaction mixture. This was
filtered, washed with cold methanol and dried in vacuum. (Yield: 302 mg, 81%); ESI-MS (MeOH) m/z
[Found (Calcd)]: 336.2 (336.00) (50%) [M-Cl]+; 273.5 (273.11) [M-H]− (100%); 370.2 (370.00) (62%) [M-
H]−. Anal. Calc. for C13H13ClCuN4O3.0.3H2O: C, 41.34; H, 3.63; N, 14.83. Found: C, 41.5; H, 3.7; N,
14.6%. FTIR (KBr, cm-1): 1617 (s, N=CO), 1605 (s, azomethine, -C=N), 1549 (s, C=C), 1440 (s, pz,
C=N). UV-Vis [DMSO, λmax/nm (ε/M-1cm-1)]: 261 (1.48x10⁴), 300 (1.30x10⁴), 313 (1.43x10⁴), 325
(1.41x10⁴), 338 (1.13x10⁴), 401 (7.48x10³).
Complex C4 (L4 + CuCl2.2H2O)
Complex C4 was synthesized in a procedure similar to the one used for C2 with L4 (144 mg, 0.499
mmol) instead of L2. A green coloured compound separated out from the reaction mixture. This was
filtered, washed with cold methanol and dried in vacuum. (Yield: 168 mg, 87%); ESI-MS (MeOH) m/z
[Found (Calcd)]: 428.05 (428.3) [M+Acetonitrile+H]+ (90%); 384.3 (384.01) (85%) [M-H]-. Anal. Calc. for
C14H15ClCuN4O3.0.5H2O: C, 42.54; H, 4.08; N, 14.17. Found: C, 42.3; H, 4.1; N, 13.8%. FTIR (KBr, cm-
1): 1619 (s, -N=CO), 1602 (s, azomethine C=N), 1540 (s, C=C), 1442 (s, pz, C=N). UV-Vis [DMSO,
λmax/nm (ε/M-1cm-1)]: 260 (1.13x10⁴), 313 (1.04x10⁴), 326 (1.10x10⁴), 339 (9.37x10³), 401 (6.78x10³).
Complex C5 (L5 + CuCl2.2H2O)
Complex C5 was synthesized in a procedure similar to the one used for C1 with L5 (294 mg, 0.999
mmol) instead of L1. A green coloured compound separated out from the reaction mixture. This was
filtered under suction, washed with cold methanol and dried in vacuum. (Yield: 301 mg, 76.8%); ESI-
MS (MeOH) m/z [Found (Calcd)]: 455.1 (455.03) [M+Acetonitrile+Na]+ (100%). Anal. Calc. for
C16H13ClCuN4O2.1.1H2O: C, 46.63; H, 3.72; N, 13.59. Found: C, 46.6; H, 3.4; N, 13.1%. FTIR (KBr, cm-
1): 3235 (m, NH), 1634 (m, -C=O), 1575 (m, azomethine, C=N), 1546 (s, C=C), 1456 (m, pz, C=N). UV-
Vis [DMSO, λmax/nm (ε/M-1cm-1)]: 262 (2.41x10⁴), 271 (2.39x10⁴), 310 (9.15x10³), 325 (1.16x10⁴), 333
(1.15x10⁴), 382 (6.81x10³), 415 (1.24x10⁴), 433 (1.23x10⁴).
Complex C6 (L6 + CuCl2.2H2O)
Complex C6 was synthesized in a procedure similar to the one used for C2 with L6 (110 mg, 0.296
mmol) instead of L2. A green coloured compound separated out from the reaction mixture, after ca. 5
21
h. This was filtered, washed with cold methanol and dried in air. (Yield: 116 mg, 85.5%); ESI-MS (MeOH)
m/z [Found (Calcd)]: 433.4 (433.94) [M-Cl]+ (100%). Anal. Calc. for C21H16ClCuN5O2.2H2O: C, 49.91; H,
3.99; N, 13.86. Found: C, 50.0; H, 3.0; N, 13.8 %. FTIR (KBr, cm-1): 3434 (br, -N-NH), 1664 (s, -
C=O),1612 (s, C=N), 1600 (m, C=C), 1460 (s, pz, C=N). UV-Vis [DMF, λmax/nm (ε/M-1cm-1)]: 268
(2.19x10⁴), 283 (2.69x10⁴), 326 (1.33x10⁴), 340 (1.63x10⁴), 395 (1.15x10⁴), 416 (1.81x10⁴), 435
(1.54x10⁴).
Complex C7 (L5 + ZnCl2.2H2O)
To a solution of L5 (147 mg, 0.499 mmol) in methanol (10 ml), ZnCl2.2H2O (70 mg, 0.51 mmol) taken in
H2O/ MeOH (8 ml, 1:2 v/v) was added dropwise with constant stirring at 55ºC in presence of two drops
of NaOH 0.5M. The solution turned bright yellow in time and the stirring was continued for ca. 5 hours
at 45ºC. A yellow coloured compound separated out from the reaction mixture. This was filtered, washed
with cold methanol and dried in air. (Yield: 109 mg, 55%); ESI-MS (MeOH) m/z [Found (Calcd)]: 295.3
(295.11) [L5+H]+ (46%); 651.1 (651.14) [Zn(L5)2+H]+, (30%). Anal. Calc. for C32H26N8O4Zn.0.5H2O: C,
58.15; H, 4.12; N, 16.95. Found: C, 58.0; H, 3.9; N, 16.9. FTIR (KBr, cm-1): 3318 (br, -N-NH), 1604 (s, -
C=N), 1559 (s, C=C), 1455 (m, pz, C=N). UV-Vis [DMSO, λmax/nm (ε/M-1cm-1)]: 263 (3.68x10⁴), 274
(2.73x10⁴), 299 (1.38x10⁴), 312 (1.84x10⁴), 325 (2.50x10⁴), 360 (1.83x10⁴), 376 (1.79x10⁴), 410
(7.93x10³), 430 (8.68x10³).
Chloride analysis by ion exchange chromatography
Solutions of C1 in water and C3 and C5 in DMSO (ca. 4 mM) were hydrolysed with a solution 0.1 M of
H2SO4 by stirring overnight at room temperature. The resulting solutions were diluted with Millipore water
so that the expected Cl- concentration was within the range of the measured calibration curve.
A calibration curve was obtained with five solutions of KCl, prepared from a concentrated solution of 500
ppm in Millipore water, with concentrations ranging from 2 to 25 ppm. The diluted, hydrolysed solutions
of the complexes were injected and the chloride concentration was determined.
Stability studies in aqueous medium
Stock solutions of the complexes were prepared in DMSO (except complex C1 that was dissolved in
water) with a concentration of 500 μM. Dilutions were then prepared containing 125 μL of the stock
solution and 2375 μL of PBS buffer (pH 7.4, 10 mM), having a final complex concentration of 25 μM and
5% DMSO. The UV-Visible spectra (250-700 nm) were then recorded for 2½ hours with 5 minutes
between each two consecutive measurements. Two other spectra were recorded after 3 and 24 hours.

22
Evaluation of the antioxidant activity
The compounds were dissolved in DMSO at an initial concentration of 1 mM. A 98.5 µM solution of
DPPH (1,1-Diphenyl-2-picryl-hydrazyl) in methanol (2 mg/50 mL) was prepared as stock, and kept in
the dark during the entire time of the experiment. Then, 5 samples were prepared, with a final volume
of 2500 µL, containing 1500 µL of DPPH and different volumes of the compounds’ solution and
methanol, in order to obtain ratios n(compound)/n(DPPH) of 0, 25, 50, 75 and 100%. These were
vigorously shaken and kept in the dark for 30 minutes. The absorbance was then recorded between 300
and 700 nm, so that the value at 516 nm could be read. The antioxidant activity (% scavenging activity)
is calculated as
%𝑆𝑐𝑎𝑣𝐴𝑐𝑡 = (𝐴0 − 𝐴𝑓
𝐴0) 100
Equation 4
where A0 is the absorbance in the absence of the tested compound and Af is the absorbance with a %
of compound. The value for IC50 is determined by a linear regression where the % of scavenging activity
is 50. Since this is a comparative method, the procedure was also done for a known antioxidant: ascorbic
acid, which acts as the positive control (PC).
Interaction with biological molecules
TO displacement assays
Prior to titration with the complexes, DNA was saturated with TO. Selected volumes of the ctDNA and
TO stock solutions were added in the fluorescence cuvette, with a total volume of 2500 μL completed
with PBS buffer, in order to ensure a ratio TO/ DNA of 0.8. The fluorescence emission spectrum was
recorded between 520 nm and 700 nm. The following parameters were used: λex = 509 nm, excitation
and emission bandwidths of 5 nm.
Successive aliquots of the complexes’ stock solutions were added directly to the cuvette and the
fluorescence emission spectrum was recorded for each of them.
Blank assays were done for each complex where the fluorescence under the same concentrations for
ctDNA and complex was recorded and subtracted to each corresponding emission spectrum.
DNA cleavage activity
This procedure was executed by Dr. Nataliya Butenko at EMMC-ChIR, University of Algarve, as
described below.

23
The plasmid DNA (pDNA) used for gel electrophoresis experiments was pA1, which consists of a full-
length cDNA from Cytochrome P4baby50 CYP3A1 inserted in the PBS plasmid vector (pBluescribe,
Strata- gene, UK) and described elsewhere [48]. Plasmid DNA was amplified in Escherichia coli Mach1
and purified using Nucleobond® AX Anion Exchange Columns for quick purification of nucleic acids
from MACHEREY-NAGEL. DNA concentration per nucleotide base pair (bp) was determined by UV
absorption at 260 nm using the extinction coefficient of 13200 M-1cm-1 bp-1.
Linear DNA was obtained by digestion of pA1 with 50M of VO(acac)2 in PBS. This compound has
shown a strong nuclease activity towards pA1 [49] and was often used as a reference for linear DNA
form in the agarose gel electrophoresis (AGE) experiments.
DNA cleavage activity of a potential nuclease is evaluated by monitoring the conversion of supercoiled
plasmid DNA (Sc) to nicked circular DNA (Nck) and linear DNA (Lin). Each reaction mixture was
prepared by adding (in the following order) 6 L of Millipore water, 2 L of 100 mM stock buffer solution
(PBS, pH 6.8), 2 L (0.2 g) of supercoiled pA1 DNA and 10 L of the aqueous 5% DMSO solution of
the complexes. The final reaction volume was 20 L. The final metal concentrations tested were planned
to be 2.5, 5, 10, 25, 50, 100, and 200 M. The final PBS concentration was 10 mM.
When the reaction involved addition of the activating agent MPA (3-Mercaptopropionic acid), the initial
volume of water was reduced to 4 L, and 2 L of an aqueous MPA solution were added before the
metal complex. MPA was chosen as reducing agent. The control sample of MPA was prepared in the
absence of a metal complex.
A solution of CuCl2 dissolved in water was prepared for comparison.
Agarose gel preparation
Agarose powder (1.5 g) from Sigma-Aldrich was weighed following the addition of 150 mL of 0.5xTBE
(89 mM Tris–borate, 1 mM EDTA, pH 8.3). The mixture was heated in a microwave oven at middle
power until the agarose dissolved completely. 10 μL (10 μg/mL) of Ethidium bromide were added upon
cooling the mixture to approximately 65-70°C and poured on a clean casting plate with an appropriate
comb and left to solidify for ~ 1 h at room temperature.
Incubation and electrophoresis
Samples were incubated for 1 h at 37 °C, wrapped up in aluminium foil. After incubation, 5 L of loading
buffer (0.25% bromophenol blue, 0.25% xylene cyanol, 30% glycerol in water) were added to each tube
to stop the reaction and to stain otherwise colourless reaction mixtures. The samples were loaded onto
a 1% agarose gel in TBE buffer. Controls of non-incubated and of linearized plasmid were included in
both extremes of a 13-, 14- or 16- well gel combs. The electrophoresis was carried out for 3 h at 110 V.
Bands were visualized under UV light and photographed using an AlphaImager (Alpha Innotech).
24
HSA binding studies
The concentration of the HSA in the experiments was ca. 1.5 μM (in PBS). The fluorescence emission
spectra were recorded between 305 nm and 700 nm, with λex = 295 nm, excitation and emission
bandwidths of 5 nm.
Successive additions of the complexes were done directly to the cuvette (1 cm) and the fluorescence
emission spectra were recorded for each of them under the same conditions.
Blank assays were done for each system where the fluorescence spectra for solutions containing the
same concentration of complex and no HSA were recorded in order to subtract to the corresponding
emission spectra containing the fluorophore.
Cell viability assays in human tumor cell lines
This procedure was performed by Dr. Fernanda Marques at C2TN, Instituto Superior Técnico,
Universidade de Lisboa, as described below.
The tumor cell lines MCF-7 (breast) and PC-3 (prostate) were cultured in DMEM (Dulbecco’s Modified
Eagle Medium) containing GlutaMax I (MCF-7) and RPMI 1640 (PC-3) culture medium (Invitrogen)
supplemented with 10% FBS and 1% penicillin/streptomycin at 37ºC in a humidified atmosphere of 95%
of air and 5% CO2 (Heraeus, Germany). Cell viability was evaluated using a colorimetric method based
on the tetrazolium salt MTT ([3-(4,5-dimethylthiazol-2-yl)-2,5-diphenyltetrazolium bromide]), which is
reduced in viable cells to yield purple formazan crystals. Cells were seeded in 96-well plates at a density
of 2×10⁴ cells (PC-3) and 5×10⁴ cells (MCF-7) per well in 200 μL of culture medium and left to incubate
overnight for optimal adherence. After careful removal of the medium, 200 μL of a dilution series of the
compounds (from stock solutions of 5 mM in DMSO) in fresh medium were added and incubation was
performed at 37°C/ 5% CO2 for 48 h. The percentage of DMSO in cell culture medium did not exceed
1%. Cisplatin was first solubilized in saline and then added at the same concentrations used for the other
compounds. At the end of the incubation period, the compounds were removed and the cells were
incubated with 200 μL of MTT solution (500 μg/mL). After 3–4 h at 37°C/ 5% CO2, the medium was
removed and the purple formazan crystals were dissolved in 200 μL of DMSO by shaking. The cell
viability was evaluated by measurement of the absorbance at 570 nm using a plate spectrophotometer
(Power Wave Xs, Bio-Tek). The cell viability was calculated dividing the absorbance of each well by that
of the control wells (cells treated with medium containing 1% DMSO). Each experiment was repeated at
least three times and each point was determined in at least six replicates.
Anti-Mycobacterium Tuberculosis (Mtb) tests
This procedure was performed by Dr. Fernando Pavan at Faculdade de Ciências Farmacêuticas/
UNESP (Brazil), as described below.

25
The anti-Mtb activity of the ligands L1, L5 and L6 and the complexes C1, C5, C6 and C7 was determined
by the Resazurin Microtiter Assay (REMA) [50]. Stock solutions of the tested compounds were prepared
in DMSO and diluted in Middlebrook 7H9 broth (Difco Laboratories, Detroit, MI, USA), supplemented
with oleic acid, albumin, dextrose and catalase (OADC enrichment- BBL/Becton Dickinson, Detroit, MI,
USA), to obtain final drug concentration ranges from 0.09 to 25 μg/mL. The serial dilutions were carried
out with a Precision XS Microplate Sample Processor (BioTekTM). The standard drug Rifampicin® was
used as a positive control. M. tuberculosis H37Rv ATCC 27294 was grown for 7-10 days in Middlebrook
7H9 broth supplemented with OADC, plus 0.05% Tween 80 to avoid clumps. The culture was frozen at
-80º C in aliquots. After 2 days, the CFU/mL of the aliquot was determined. The concentration was
adjusted to 5 x 10⁵ CFU/mL, and 100 μL of the inoculum was transferred to each well of the 96-well
microtiter plate (NUNC), together with 100 μL of the test compounds. Each assay was set up in triplicate.
Microplates were incubated for 7 days at 37º C, and then resazurin (30 μL 0.01% resazurin solubilized
in water) was added for the readings after 24 h of incubation in the same conditions. The wells that
turned from blue to pink, with the development of fluorescence, indicated growth of bacterial cells, while
maintenance of the blue color indicated bacterial inhibition. The fluorescence was read (530 nm
excitation filter and 590 nm emission filter) in a Cytation 3 (Biotek Instruments, Inc., USA). As positive
control the MIC90 (defined as the lowest concentration resulting in 90% inhibition of growth of M.
tuberculosis) of Rifampicin® was determined as 0.015 μg/mL.
Fluorescence studies with C7
These measurements were performed at Professor António Maçanita’s laboratory, at Centro de Química
Estrutural, Instituto Superior Técnico, Universidade de Lisboa, under the direct supervision of Dr.
Roberto di Paolo.
UV-absorption spectra were measured using an Olis-15 double-beam spectrophotometer with 1.0 nm
resolution. Steady-state fluorescence emission spectra were measured using a SPEX Fluorog 212I
spectrofluorimeter. All spectra were collected in the S/R mode and corrected for optics and detector
wavelength dependence. Fluorescence was collected in right angle geometry.
Time-resolved fluorescence measurements were carried out using the single photon counting
technique. Excitation of samples was carried out with the frequency-tripled output of an actively mode-
locked picosecond Ti-Sapphire laser (Spectra Physics Tsunami), pumped by a solid-state laser (Spectra
Physics Millennia Xs). The repetition rate was set to 82 MHz and excitation was vertically polarized and
emission was collected at 90º geometry, passed through a prism polarizer at 54.7º and a
monochromator (Jobin-Yvon H20 Vis), and detected with a microchannel plate photomultiplier (MCP-
PT Hamamatsu R3809u-50) and a SPC-630 acquisition board (Becker and Hickl, GmbH). The
experimental instrumental response function was 42 ps. The fluorescence decays were deconvoluted
in a PC, using George Striker’s program (LINUX version) [51].

26
The PL quantum yield of the complex was determined using an oligothiophene (alfa5) as standard (F
= 0.36 in dioxane at 293 K [52]) by the relative method [53]. To minimize instrumental errors, sample
and standard solutions were prepared with very similar absorption values at the common excitation
wavelength (418 nm). The fluorescence quantum yield of the complex was measured in DMSO, at room
temperature.
The lifetime of HSA was also determined but in PBS buffer (since this is the medium in which the
quenching experiments were conducted).
The evaluation of the quenching of fluorescence emission of HSA by C7 was done both in steady-state
and time-resolved conditions. A solution of HSA in PBS buffer (32.5 μM) was prepared as well as a
stock solution of C7 in DMSO (650 μM). Individual samples were prepared by addition of the previous
solutions to obtain molar ratios of HSA:C7 of 1:0; 1:0.2; 1:0.4; 1:1; 1:2.5; and 1:5. Each of these solutions
was measured for its UV-Visible absorption, steady-state emission (with λex = 280 nm, bandwidths of 1
mm) of fluorescence and time-resolved fluorescence (with λex = 280 nm and constant stirring, and
collecting at 340 nm for HSA and 500 nm for C7).

27
Results and Discussion
Synthesis and characterization of ligands
The ligands used throughout this work are Schiff bases derived from pyrazole that were synthetized
using a simple methodology by condensation of the corresponding carbohydrazide with different
aldehydes. This kind of chemistry, formation of an imine through condensation of an amine with a
carbonyl compound, is of easy performance in the laboratory by refluxing a mixture of both components
in the presence of a catalytic amount of acid. The stability of the final product is strongly dependent on
the substituents present in the molecules: when an electronegative group is carried by the nitrogen, like
in the case of the carbohydrazide, and an aromatic group is in resonance with the imine, like those used
in the aldehydes, then the product is stable enough to be isolated [29].
For all prepared ligands the reactions were performed in methanol with a catalytic amount of acetic acid
to ensure the formation of the imine (or in these specific cases, azomethine) and separation of the
product from the mixture, with no possibility to reverse the process. Moderate to good yields (62 - 88%)
were obtained in these reactions.
The ligands were then characterized by a set of analytical techniques in order to confirm the obtained
structures. The elemental analysis for C, H and N quantities, present on each structure, always gave
values very close to those expected from the theoretical hypothesis, with deviations ranging from 0.0 to
0.65%.
1H NMR spectroscopy allowed the identification and attribution of the peaks making a perfect
correspondence both in the chemical shift and integration values to the predicted structures. An
important peak assignment in this technique is the one corresponding to the azomethine proton (HC=N),
which clearly identifies the presence of the Schiff base [33].
Table 1 Chemical shift of selected protons in the ligands, δ (ppm).
L1 L2 L3 L4 L5 L6
HC=N 9.04 8.66 8.66 8.66 9.65 9.56
CH3 (pz) 2.31 2.30 2.30 2.30 2.32 2.71
NH (hydrazine) 13.21 11.98 11.96 11.97 12.93 ---a) a) The signal was not possible to assign due to broad peaks in this region.
Another peak that was clearly identified at δ 2.30 ppm, integrating for 3 protons, was unambiguously
assigned to the methyl group attached to the pyrazole ring. Moreover, the effect of having a pyridine
ring as substituent in the nitrogen can be observed since this signal appears at 2.32 ppm for L5 and at
2.71 ppm for L6 [54].
By using the Fourier Transform Infra-Red (FTIR) spectroscopic technique it was possible to identify
characteristic groups present in the ligands, by assignment of IR bands to functional groups and specific

28
bonds - see Table 2. The assignment was based not only in theoretical knowledge [29], but also in
previous works reported in the literature [54,55]. The band corresponding to the stretching vibration of
the azomethine ν(C=N), appears between 1592 cm-1 and 1626 cm-1, as expected for a Schiff base
coupled to an aromatic ring [40]. The frequency for the C-O stretching in the phenol group appears at
lower wavenumbers [56].
Table 2 IR frequency, ν (cm-1), of the characteristic groups of the ligands.
L1 L2 L3 L4 L5 L6
NH 3338 3281 3302 3311 br band br band 3423 hydrogen-bonded OH 3204 3172 3223 3184 3196
C=O 1658 1683 1666 1667 1671 1666
C=N 1599 1618 1610 1604 1626 1592
C-O phenol 1261 1272 1248 1248 1245 1263
The UV-visible electronic absorption spectra of the ligands were recorded in MeOH for L1, DMF for L2
and L6, and DMSO for L3- L5, according to the solubilities of the corresponding complexes, since the
ligands are all soluble in any of these solvents.
In the spectra of all Schiff base ligands it was possible to observe two set of bands corresponding to the
π → π* and n → π* transitions of both the carbonyl moiety and imine bonds present in the molecules
[57]. Moreover, for ligands L5 and L6, sharing a naphthalene moiety, it was also possible to assign the
bands corresponding to the π → π* transition of the aromatic rings. The results are presented in Table
3.
Table 3 UV- Visible electronic absorptions bands of the ligands, λmax (nm).
L1 L2 L3 L4 L5 L6
Aromatic π→π* -----a) -----a) -----a) ------a) 262 268-275
C=O and C=N π→π* 286-306 276-297 300-309 300-310 300-325 312-325
C=O and C=N n→π* 337 325-332 333 341 360-375 361-377 a) This band appears at lower wavelengths then those that were used (250-600 nm).
The ligands were also characterized by electrospray ionization mass spectrometry (ESI-MS) in the
positive and negative mode and for all ligands it was possible to identify the peak corresponding to the
molecular ion, in the positive and/ or negative mode, according to the expected molecular weight [29].
The assignments are listed in Table 4. Other peaks corresponding to species such as [L+Na]+, [L+Cl]-,
[2L+H]+ and [2L-H]- were also identified (see experimental section).
Table 4 Assignment of the molecular ion peaks by ESI-MS.
L1 L2 L3 L4 L5 L6
Peak assignment [L+H]+ [L+H]+ [L-H]- [L-H]- [L-H]- [L-H]-
Calc. exact mass (g/mol) 290.12 245.10 273.11 287.12 293.11 371.14
Found m/z 290.1 245.2 273.3 287.4 293.4 370.6

29
The ligands’ structures were further confirmed by the crystal structure obtained for L3 by X-ray diffraction
– see Figure 13. The molecule crystallizes in the monoclinic group C/c (for details, see Annex A).
Selected bond distances (Å) and angles (º) are listed in Table 5. The phenyl ring [C(7)-C(8)-C(9)-C(10)-
C(11)-C(12)] is almost flat with respect to the pyrazole ring [C(2)-C(3)-C(4)-N(3)-N(4)], the torsion angle
being 5.61(7)º.
Figure 13 ORTEP plot of compound L3. All the non-hydrogen atoms are presented by their 50% probability ellipsoids.
Table 5 Selected bond distances (Å) and angles (º) for L3.
Bond distance (Å) Angles (º)
O(1) – C(1) 1.2332(17) O(1) – C(1) – N(1) 122.26(13)
N(1) – C(1) 1.3535(19) C(1) – N(1) – N(2) 118.92(12)
N(1) – N(2) 1.3735(16) N(2) – C(6) – C(7) 119.89(13)
N(2) – C(6) 1.2881(18) C(7) – C(8) – O(2) 121.98(13)
O(2) – C(8) 1.3572(17)
O(3) – C(13) 1.4297(17)
In the crystal packing π-π interactions appear as well as hydrogen bonds between the molecules of L3.
The π-π interactions between phenyl rings and pyrazole rings of different molecules (distance between
centroids is ca 3.773(2) Å), determine the intermolecular system of stacked molecules (see Figure 14).
Intramolecular hydrogen bonds between OH groups of phenol ring and azomethine nitrogen atoms
further contribute to the planarity of the molecule. Other intermolecular hydrogen bonds are present in
the crystal packing. Table 6 lists the hydrogen bonds present in the structure.
Table 6 Hydrogen bonds for L3 [Å and º].
D-H...A d(D-H) d(H...A) d(D...A) <(DHA)
N(1)-H(1N)...O(3)#1 0.91(2) 2.48(2) 3.2919(17) 148.5(16)
N(4)-H(4N)...O(1)#2 0.89(2) 1.96(2) 2.8408(17) 169.6(17)
O(2)-H(2O)...N(2) 0.91(2) 1.77(2) 2.5706(16) 144.5(19)
Symmetry transformations used to generate equivalent atoms: #1 x,-y, z-1/2 #2 x,-y-1, z-1/2
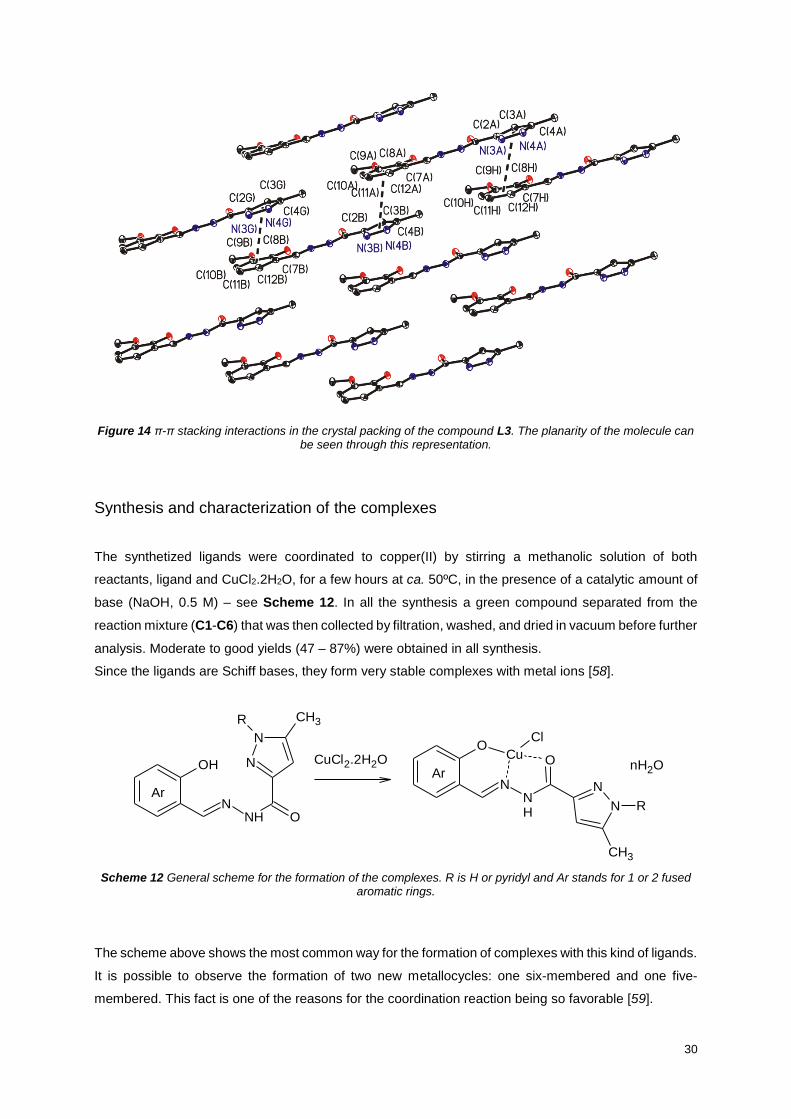
30
Figure 14 π-π stacking interactions in the crystal packing of the compound L3. The planarity of the molecule can be seen through this representation.
Synthesis and characterization of the complexes
The synthetized ligands were coordinated to copper(II) by stirring a methanolic solution of both
reactants, ligand and CuCl2.2H2O, for a few hours at ca. 50ºC, in the presence of a catalytic amount of
base (NaOH, 0.5 M) – see Scheme 12. In all the synthesis a green compound separated from the
reaction mixture (C1-C6) that was then collected by filtration, washed, and dried in vacuum before further
analysis. Moderate to good yields (47 – 87%) were obtained in all synthesis.
Since the ligands are Schiff bases, they form very stable complexes with metal ions [58].
OH
NONH
N
N
CH3R
Ar
O
NNH
OCu
Cl
N
N
CH3
R
ArCuCl2.2H2O nH2O
Scheme 12 General scheme for the formation of the complexes. R is H or pyridyl and Ar stands for 1 or 2 fused aromatic rings.
The scheme above shows the most common way for the formation of complexes with this kind of ligands.
It is possible to observe the formation of two new metallocycles: one six-membered and one five-
membered. This fact is one of the reasons for the coordination reaction being so favorable [59].
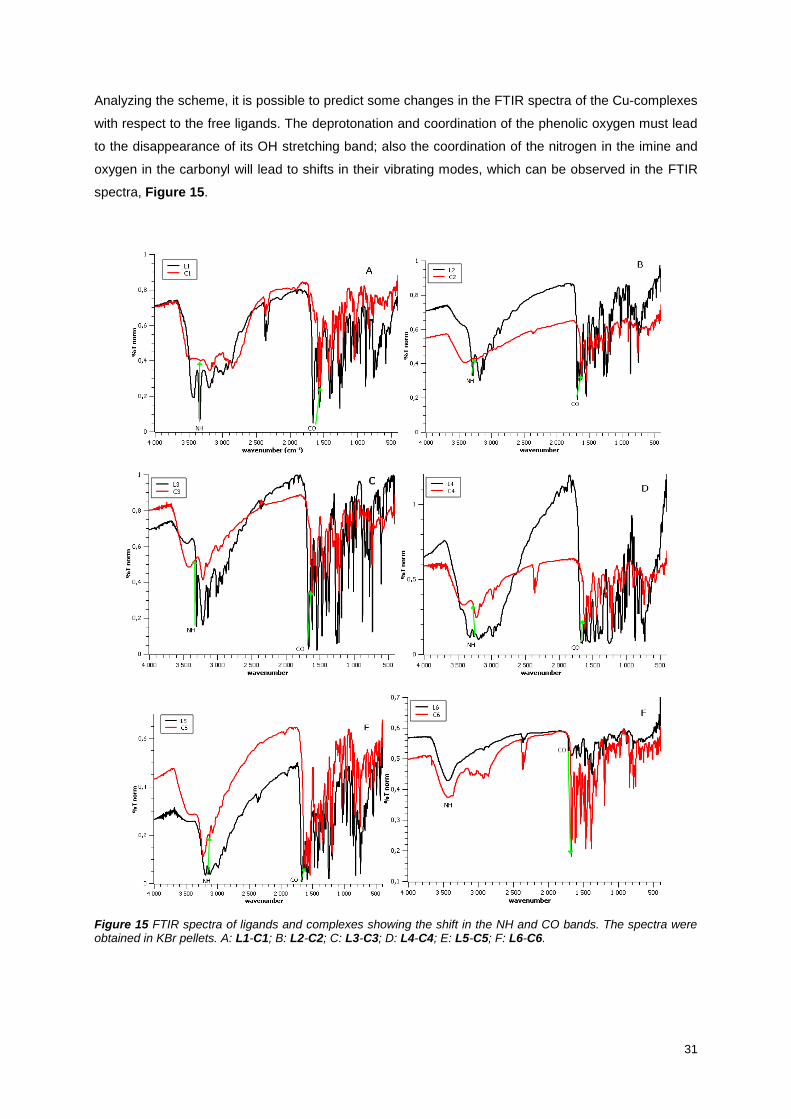
31
Analyzing the scheme, it is possible to predict some changes in the FTIR spectra of the Cu-complexes
with respect to the free ligands. The deprotonation and coordination of the phenolic oxygen must lead
to the disappearance of its OH stretching band; also the coordination of the nitrogen in the imine and
oxygen in the carbonyl will lead to shifts in their vibrating modes, which can be observed in the FTIR
spectra, Figure 15.
Figure 15 FTIR spectra of ligands and complexes showing the shift in the NH and CO bands. The spectra were obtained in KBr pellets. A: L1-C1; B: L2-C2; C: L3-C3; D: L4-C4; E: L5-C5; F: L6-C6.

32
It should be noted that the coordination of this feature of the ligand is merely due to dative bonds to
copper, even with the apparent disappearance of the NH band. The free ligands have two tautomers, in
which the proton can be found in the nitrogen or the oxygen atoms. However, all data supports
coordination in the keto form. Since upon coordination the NH bond cannot stretch with the same
intensity as in the free ligand, this band is included in a broad band centered around 3300-3400 cm-1,
which is due to the presence of water molecules in the structure. As expected, the bands corresponding
to the carbonyl (C=O) and to the azomethine (C=N) have shifted to lower wavenumbers (hence, lower
energy) upon coordination to the copper center [60].
On the other hand, there should be a change in the region of 1200 cm-1 due to the covalent bond formed
between the phenolic oxygen and the metal, but it is not assigned because this is the fingerprint region
of the molecule where many of the groups’ vibrating modes are present.
Another spectroscopic technique that can provide valuable information on the complexation, because it
is possible to analyze the differences between the spectra of ligand and complex, is UV-Visible
absorption spectroscopy.
As previously seen for the ligands, it was possible to assign the transitions π → π* and n → π* of the
carbonyl moiety and imine bonds; since both functional groups are involved in the coordination to the
metal centre, a red shift (for lower energy values) is expected for these bands. This effect can be
observed in Figure 16.
It can be seen that the bands for the π→π* of the naphthalene moiety of C5 and C6 do not suffer large
changes when compared to the respective ligands, since this part of the molecule is not directly involved
in the coordination to the metal ion.
On the other hand, the bands ranging from 280 nm to 460 nm in all the complexes’ spectra are shifts of
the bands from the corresponding ligands, ranging from 260 nm to 400 nm. As expected these bands
broaden and suffer a red shift for lower energy values. This happens because these bands are due to
transitions within the imine and carbonyl moieties, which are both involved in the coordination to the
metal ion. Since phenomena of charge transfer can occur between metal and ligand, the result is the
one that can be observed in the electronic absorption spectra of complexes C1-C6 [55,58].
Interestingly, these are Cu(II) with a configuration d9 and a band in the visible region (above 550 nm
[56]) would be expected due to d-d transitions. However, the poor solubility of the complexes and the
fact that these bands are usually very weak, due to being Laporte forbidden, make it impossible for their
observation.

33
Figure 16 UV-visible electronic absorption spectra of ligands and complexes in solution: L1-C1 (MeOH; 62.5μM:66.7μM); L2-C2 (DMF; 100μM:125μM); L3-C3 (DMSO; 50μM:100μM); L4-C4 (DMSO; 60μM:100μM); L5-C5 (DMSO; 60μM:50μM); L6-C6 (DMF; 66.7μM:50μM).
Another technique that can be used to characterize these complexes is electron paramagnetic
resonance (EPR) due to the paramagnetic nature (3d9; S = ½) of Cu2+. This technique can provide
important information on the electronic structure of the metal center, the donor groups coordinated to it
and the complex geometry. Upon absorption of microwave radiation, a spectrum is produced, and in the
particular case of EPR, the output is presented as the first derivative, due to the use of phase-sensitive
detection [61].
In most cases, copper(II) centers have square planar, or axially elongated octahedral geometry (or
square pyramidal) and their EPR spectra show axial symmetry with a more intense absorption at higher
field (g┴), and a less intense one at lower filed (g//). These two bands may be further split into 4
0
0,5
1
1,5
2
250 350 450 550
Absorb
ance
wavelength (nm)
L1
C1
0
0,5
1
1,5
2
270 370 470
Absorb
ance
wavelength (nm)
L2
C2
0
0,4
0,8
1,2
1,6
260 360 460
Absorb
ance
wavelength (nm)
L3
C3
0
0,5
1
1,5
2
260 360 460 560
Absorb
ance
wavelength (nm)
L4
C4
0
0,4
0,8
1,2
1,6
250 350 450 550
Absorb
ance
wavelength (nm)
L5
C5
0
0,4
0,8
1,2
1,6
260 360 460
Absorb
ance
wavelength (nm)
L6
C6

34
components as a result of the hyperfine coupling (A) with the copper nuclei of spin I=3/2. Among other
factors, the g// and A// values depend on the nature of the donor atoms, and therefore these can be used
to confirm the binding mode around the metal ion [62].
Spectroscopic studies by EPR were carried out for C1-C6 in DMSO (and methanol for C1) at 77 K as
glasses (frozen solution in liquid N2) – see Figure 17 for examples. The spin Hamiltonian parameters
were obtained by computer simulation of the experimental spectra using a program from Rockenbauer
and Korecz [63] and are presented in Table 7.
Figure 17 First derivative X-band EPR spectra of complexes (a) C1 (MeOH, 1.5mM), (b) C4 (DMSO, 1mM), (c) C5 (DMSO, 1mM) and (d) C6 (DMSO, 1.5mM) as glasses in liquid nitrogen (T=77K). The experimental spectra are presented in orange and the calculated in blue.
Due to i) poor solubility of the complexes, ii) high viscosity of the DMSO solutions; and iii) high dielectric
constant of DMSO; spectra with poor resolution and broad bands were obtained in most cases.
Moreover, superhyperfine splitting due to coupling of the electron spin with the 14N nucleus (I=1) was
not observed, but this is often the case in these measurement conditions.
All complexes, except C2, originate axial spectra. In the case of this complex, only one broad signal at
g ~ 2.1 (see Figure 18), characteristic for an isotopic spectrum, is observed, meaning that an extensive
exchange coupling through misalignment of the local molecular axes between different molecules in the
unit cell (dipolar broadening) and enhanced spin lattice relaxation, which means that no information can
be retrieved on the electronic ground state of the Cu(II) ion present in the complex [64].
2500 2700 2900 3100 3300 3500 3700
Magnetic Field [G]
a
2500 2700 2900 3100 3300 3500 3700
Magnetic Field [G]
b
2400 2700 3000 3300 3600 3900 4200
Magnetic Field [G]
c
2400 2700 3000 3300 3600 3900 4200
Magnetic Field [G]
d

35
Figure 18 First derivative X-band EPR spectrum of C2: 1mM in DMSO at 77K.
Table 7 Spin Hamiltonian parameters for the Cu(II) complexes obtained by computer simulation of the experimental spectra [63].
Complex g┴ g// A┴ (x10-4 cm-1) A// (x10-4 cm-1) g///A// (cm)
C1 2.069 2.305 0.7 172.2 134
C3 2.083 2.280 1.5 190.3 120
C4 2.079 2.283 1.5 192.2 119
C5 2.081 2.288 5.8 174.1 131
C6 2.062 2.291 0.8 158.1 145
For all the complexes it is observed that g// > g┴ > 2.0, indicating the presence of a dx2-y
2 ground state in
copper(II) located in square-based geometries. Moreover, since for C1-C5, g///A// = 119 – 134 cm, then
square planar geometries can be assign to these complexes, while in C6 a strong tetrahedral distortions
must be present [65].
The complexes were also characterized by ESI-MS and the assignment is presented in Table 8.
Unfortunately, it is impossible to identify any peak for C1, probably due to ionization problems, but for
the other complexes it was always possible to make an assignment. Moreover, in all assigned complex
peaks the isotopic pattern due to 63Cu and 65Cu was observed.
Table 8 Peak assignment for the copper complexes by ESI-MS.
C2 C3 C4 C5 C6
Peak assignment [M-H]- [M-H]- [M-H]- [M+ACN+Na]+ [M-Cl]+
Calc. exact mass (g/mol) 339.99 370.00 384.01 455.03 433.94
Found m/z 340.4 370.2 384.3 455.1 433.4
ACN= acetonitrile.
Combining all the analytical data on the complexes, namely elemental analysis and spectroscopic
studies, the following structures, included in Scheme 13, are proposed for C1-C6. The presence of the
chloride ions (either coordinated or as counter ions) was suggested by the CNH elemental analysis and
1,822,22,42,6
g

36
confirmed by ion exchange chromatography. Data showed that 2 Cl- ions were present in the structure
of C1, while only one was detected in each of the complexes’ structures of C3 and C5.
NH+ O
NNH
NNH
OCu
Cl
CH3
CH3
OH
Cl-
4H2O
A
O
NNH
NNH
OCu
Cl
CH3
B
O
NNH
NNH
OCu
Cl
CH3
CH3
O C
0.3H2O
O
NNH
NNH
OCu
Cl
CH3
O CH30.5H2O
D
O
NNH N
H
N
Cu O
Cl
E
1.1 H2O
O
NNH NN
Cu O
Cl OH2
NH2O
F
Scheme 13 Proposed structures for complexes C1 (A), C2 (B), C3 (C), C4 (D), C5 (E) and C6 (F).
Finally, a zinc(II) complex (C7) with ligand L5 was synthesized using the methodology applied in the
copper(II) synthesis. Also for this complex it was possible to observe changes in the FTIR spectrum in
agreement to coordination by the same set of donor atoms as for the copper complexes, as can be seen
in Figure 19.
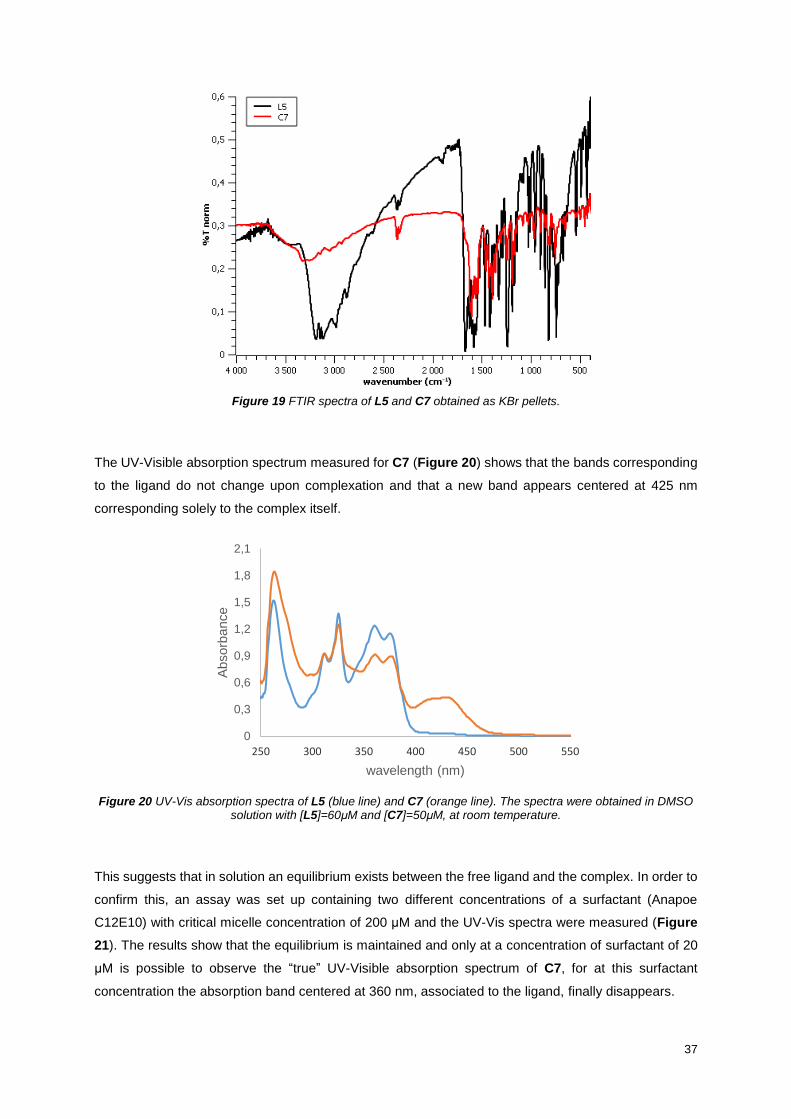
37
Figure 19 FTIR spectra of L5 and C7 obtained as KBr pellets.
The UV-Visible absorption spectrum measured for C7 (Figure 20) shows that the bands corresponding
to the ligand do not change upon complexation and that a new band appears centered at 425 nm
corresponding solely to the complex itself.
Figure 20 UV-Vis absorption spectra of L5 (blue line) and C7 (orange line). The spectra were obtained in DMSO
solution with [L5]=60μM and [C7]=50μM, at room temperature.
This suggests that in solution an equilibrium exists between the free ligand and the complex. In order to
confirm this, an assay was set up containing two different concentrations of a surfactant (Anapoe
C12E10) with critical micelle concentration of 200 μM and the UV-Vis spectra were measured (Figure
21). The results show that the equilibrium is maintained and only at a concentration of surfactant of 20
μM is possible to observe the “true” UV-Visible absorption spectrum of C7, for at this surfactant
concentration the absorption band centered at 360 nm, associated to the ligand, finally disappears.
0
0,3
0,6
0,9
1,2
1,5
1,8
2,1
250 300 350 400 450 500 550
Absorb
ance
wavelength (nm)
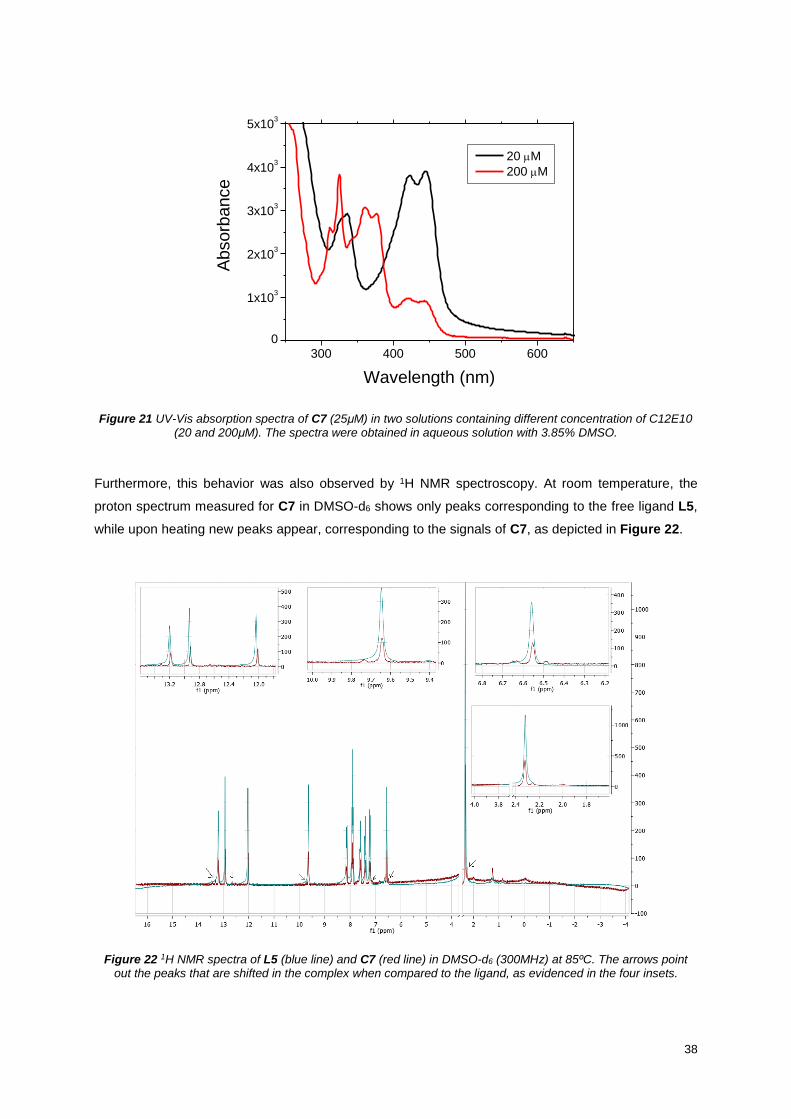
38
300 400 500 600
0
1x10³
2x10³
3x10³
4x10³
5x10³
Absorb
ance
Wavelength (nm)
20 M
200 M
Figure 21 UV-Vis absorption spectra of C7 (25μM) in two solutions containing different concentration of C12E10
(20 and 200μM). The spectra were obtained in aqueous solution with 3.85% DMSO.
Furthermore, this behavior was also observed by 1H NMR spectroscopy. At room temperature, the
proton spectrum measured for C7 in DMSO-d6 shows only peaks corresponding to the free ligand L5,
while upon heating new peaks appear, corresponding to the signals of C7, as depicted in Figure 22.
Figure 22 1H NMR spectra of L5 (blue line) and C7 (red line) in DMSO-d6 (300MHz) at 85ºC. The arrows point out the peaks that are shifted in the complex when compared to the ligand, as evidenced in the four insets.

39
As expected, no change (new peak) is noted in the phenolic proton of L5 (at 12.04 ppm) since it
disappears in the complex. Also the downfield shifts of the imine (at 9.65 ppm) and NH of the hydrazide
(at 12.93 ppm) in the complex spectrum are not surprising for the coordination to the metal centre
deshields such nuclei.
Based on the elemental analysis of C7, it is possible to establish a relationship L5:Zn of 2:1, which is
confirmed by ESI-MS, where the molecular peak is present at m/z 651.1 (calculated for [C7+H]+,
651.14). By combining all the data the proposed structure for C7 is the one included in Scheme 14.
Scheme 14 Proposed structure for C7.
Stability studies in aqueous medium
Since biological studies are typically done in aqueous media at physiological pH, in order to proceed
with studies with biological molecules, it is necessary to ensure that the complexes do not precipitate in
the aqueous environment, and that they are stable in the timescale of the studies. Thus, the stability of
the complexes was evaluated with UV-Vis spectroscopy in pH 7.4 buffered solutions containing a
minimum amount of organic solvent, which is essential to solubilize the metal complexes. Phosphate
Buffer Saline (PBS) was chosen due to its composition, since the osmolarity and ion concentrations of
the solution match those of the human body.
The changes observed with time for each complex solution were then followed through UV-Visible
spectroscopy. Only C4 and C5 showed some degradation during the time of the study, as depicted in
Figure 23. C2, C3, C6 and C7 showed solubility issues and started to precipitate after a few hours and
therefore lower absorbance values were recorded with time. However, in the first 3 hours only small
changes occurred. Complex C1 maintains its original form in solution, even after a long period of time,
as can be seen in Figure 24. We attribute the observed changes to the low solubility of the complexes

40
in the aqueous media and therefore if lower concentrations are used in the assays with biological
molecules both the stability and the solubility are not compromised.
Figure 23 UV-Vis absorption spectra of C4 (A) and C5 (B) with increasing time (time between each measurement 5 minutes, up to 2.5h; 3h and 24h). Insets: variations at band maxima (λ= 325 nm and λ= 400 nm for C4, and λ= 339 nm and λ= 417 nm for C5) in the first 160 minutes. The spectra were obtained with 25 μM solutions in PBS
(5% DMSO).

41
Figure 24 UV-Vis absorption spectra measured with time (time between spectra 5 minutes, up to 2,5h; 3h and 72h) for solutions containing complex C1 (25 μM) in PBS buffer with 5% DMSO. Inset: Variation at maxima (λ=
310 nm and λ= 418 nm) during the first 160 minutes.
Antioxidant activity studies with DPPH
The antioxidant activity of the compounds was evaluated since this is an important function within the
human body for the detoxification of free radicals that are formed in the oxygen metabolism. Schiff base
ligands and its metal complexes have been studied as antioxidant agents against free radicals [66].
Scavenging of the DPPH free radical is the basis of a common antioxidant assay [67]. 1,1-Diphenyl-2-
picryl-hydrazyl (DPPH) is a stable free radical, which has an unpaired valence electron at one of the
nitrogen bridging atoms. This hydrophobic radical forms deep purple coloured solutions in organic
solvents. Reaction with other radicals, electrons, or hydrogen atoms leads to formation of a colourless
species and loss of the EPR free radical signal [68] – see Scheme 15.
Scheme 15 DPPH radical structure having a purple coloration while DPPH(H), the neutral molecule, is colorless [68].
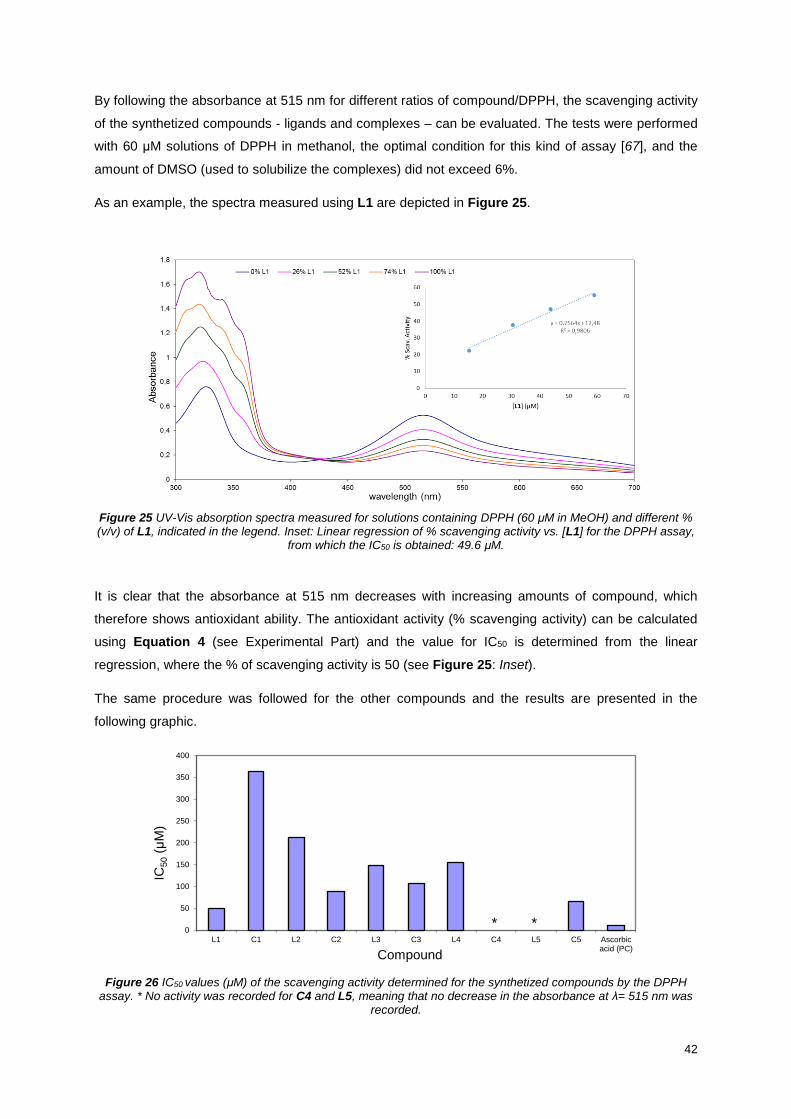
42
By following the absorbance at 515 nm for different ratios of compound/DPPH, the scavenging activity
of the synthetized compounds - ligands and complexes – can be evaluated. The tests were performed
with 60 μM solutions of DPPH in methanol, the optimal condition for this kind of assay [67], and the
amount of DMSO (used to solubilize the complexes) did not exceed 6%.
As an example, the spectra measured using L1 are depicted in Figure 25.
Figure 25 UV-Vis absorption spectra measured for solutions containing DPPH (60 μM in MeOH) and different % (v/v) of L1, indicated in the legend. Inset: Linear regression of % scavenging activity vs. [L1] for the DPPH assay,
from which the IC50 is obtained: 49.6 μM.
It is clear that the absorbance at 515 nm decreases with increasing amounts of compound, which
therefore shows antioxidant ability. The antioxidant activity (% scavenging activity) can be calculated
using Equation 4 (see Experimental Part) and the value for IC50 is determined from the linear
regression, where the % of scavenging activity is 50 (see Figure 25: Inset).
The same procedure was followed for the other compounds and the results are presented in the
following graphic.
Figure 26 IC50 values (μM) of the scavenging activity determined for the synthetized compounds by the DPPH assay. * No activity was recorded for C4 and L5, meaning that no decrease in the absorbance at λ= 515 nm was
recorded.
0
50
100
150
200
250
300
350
400
L1 C1 L2 C2 L3 C3 L4 C4 L5 C5 Ascorbicacid (PC)
IC50
(μM
)
Compound
* *

43
None of the compounds that were tested showed a significant antioxidant activity as can be seen from
the values included in Figure 26. When compared with the control, ascorbic acid, the IC50 values of the
tested compounds are substantially higher, meaning that most of them do not behave as antioxidants.
In some cases, the copper complexes showed better activity than the corresponding ligands, as in the
case of C2, C3 and C5. While L2 shows a higher IC50 value, when compared to the one obtained for
C2, L5 does not present any scavenging activity while C5 is already able to act as an antioxidant in a
ratio near 1:1 with DPPH, being the complex with the highest antioxidant potential. On the contrary, in
C1 and C4 the presence of the copper ion has a negative effect in the antioxidant power, with C1
showing a higher IC50 value when compared with L1, which is the best ligand and C4 having no activity.
From these results we can infer that, regarding the complexes, the presence of a substituent in the orto-
position to the phenol to which the metal is attached decreases the scavenging ability of the compound,
whereas in the ligands the presence of such substituents can in fact contribute to the stabilization of the
radical that remains in the organic compound and, therefore, the ability for antioxidant action is favoured
by their presence.
Overall, it can be concluded that the best compound is L1 (IC50 = 49.6 μM), which is a ligand derived
from a natural existing molecule in the human body: pyridoxal, proving that this ligand is a strong
candidate for further studies. Moreover, this was the only tested compound where the necessary amount
for IC50 didn’t exceed the quantity of DPPH that was used, as shown in Table 9.
Table 9 IC50 values and molar ratio of compound to DPPH obtained from the DPPH assays for the synthetized compounds.
L1 C1 L2 C2 L3 C3 L4 C4 L5 C5 Ascorbic acid (PC)
IC50 (μM) 49.6 364 212 89.2 149 107 156 n.a. n.a. 66.4 10.9
n(comp)/ n(DPPH) 0.84 2.55 3.59 1.56 2.52 1.88 2.65 n.a. n.a. 1.16 0.18
n.a. means that no activity was recorded.
Interaction with biological molecules
Interaction with ctDNA
In order to investigate if the complexes are able to interact with DNA, a competition fluorescence
quenching study with thiazole orange (TO), a known DNA intercalator, and calf thymus DNA (ctDNA)
was done for most of the complexes. If the complexes were fluorescent a direct fluorescence method
could have been used, but since they do not show fluorescence, an indirect competition study, with a
fluorescent probe was employed.
Interactions with DNA are of extreme importance when evaluating compounds for anti-cancer
applications. Since cancer is characterized by a highly genomic instability [2], the genetic material is one

44
of the preferential targets for anti-cancer drugs. The fact that cisplatin, the commonly used metallodrug,
targets DNA is another reason to evaluate this ability.
Electronic absorption spectroscopy is a simple method to examine the DNA binding mode of the metal
complex. When the binding involves intercalation, the π* orbital of the intercalated ligand can couple
with the π orbital of the DNA base pairs, thus, decreasing the π-π* transition energy and resulting in
bathochromism (red shift) and hypochromism [69]. Alternatively, the compounds can form covalent
adducts with DNA (alkylating agents), or interact as groove binders, which like intercalators, interact
with DNA through electrostatic forces, such as π-π stacking or van der Walls [34].
Another method that can be used is fluorescence spectroscopy. Competitive binding experiments based
on the displacement of the intercalating probe TO from ctDNA can give valuable information. If the
complex displaces TO from DNA, the fluorescence of TO decreases due to free molecules being less
fluorescent than the DNA bound molecules, since TO becomes more accessible to quenching by solvent
molecules. However, not only the DNA intercalators but also DNA groove binders can cause the
reduction in the emission intensity of DNA bound TO, but to a lower extent [69].
Prior to titration with the complexes, the DNA solution (~2 μM in PBS buffer, pH=7.4) was mixed with a
solution of TO ensuring a molar ratio TO:DNA of 0.8, for which saturation of fluorescence emission is
observed. Successive aliquots of the complex stock solution (in DMSO) were added directly to the
cuvette and the fluorescence emission spectra were recorded for each of them.
Figure 27 Emission spectra (λex= 509 nm) of the TO-ctDNA complex (1.6 μM: 2.1 μM) in the absence and in the presence of increasing concentrations of C5 (0.7 – 16 μM) in 2% DMSO/ PBS pH 7.4 after subtraction of blank
emission spectra (arrow indicates the variation observed with increasing concentration of the complex).
0,00E+00
1,00E+06
2,00E+06
3,00E+06
4,00E+06
5,00E+06
6,00E+06
7,00E+06
8,00E+06
9,00E+06
520 540 560 580 600 620 640 660 680 700
Flu
ore
scence Inte
nsity (
a.u
.)
wavelength (nm)
C5

45
Figure 27 shows the emission spectra obtained for complex C5. Similar studies were conducted with
complexes C3 – C7 and the quenching % for all of them is depicted in Figure 28.
Figure 28 Effect of complexes C3 – C7 in TO-ctDNA fluorescence emission: relative fluorescence intensity (%) at emission maxima with increasing complex concentration.
It is noted that, with exception of C3, all the tested complexes (C4 – C7) were able to reduce the
fluorescence intensity (to 69 – 22%), indicating that they are able to compete with TO for the same
binding sites, or interact with DNA at different sites, near the bound TO.
The decrease of the fluorescence emission intensity at 530 nm was analyzed according to the Stern-
Volmer equation (Equation 1 – see Biological Evaluation Methods section) to determine the constant
for fluorescence quenching, KSV, which will be dependent on the ratio of the bound concentration of TO
to the concentration of DNA. A plot of I0/I versus [Q] will give KSV as the slope.
Generally, the linearity of the Stern-Volmer plot has two meanings: the existence of one binding site for
the ligand in the proximity of the fluorophore, or more than one binding site equally accessible to the
ligand. Thus the gradual deviation from linearity of the Stern-Volmer plot on continuous addition of the
complex is indicative of the existence of more than one binding sites with different accessibilities and/
or the occurrence of combined quenching [69].
Since the apparent binding constant of TO to ctDNA, has been determined, 3.16x10⁵ M-1 [41] and the
concentration ratio where the fluorescence intensity is quenched at 50% of the initial value, can be
obtained from the experimental data, the apparent binding constant for the complex towards DNA can
be estimated by the relationship KTO-ctDNA [TO] = Kapp [Complex]. These calculations were also done for
each complex and the results are presented in Table 10.

46
Complexes C3 and C4 were studied under this method and details are shown below.
Figure 29 Stern-Volmer plots at 530 nm obtained from steady-state (I0/I) measurements for C3 (a) and C4 (b) – [DNA]~ 2 μM, TO:ctDNA= 0.8 and λex= 509 nm (I0/I data were corrected for reabsorption and inner-filter-effects).
Although these complexes are structurally very similar, the only difference being the length of the ethoxy
substituent on the phenolate ring, it can be seen that while C3 is unable to displace TO from DNA, the
intensity of fluorescence remaining unaltered with successive additions of the complex – see Figure 29
(a), C4 shows some ability to displace TO, partially taking its place or moving it away from its
intercalating sites. However, the linear fit is not the best (r2= 0.87) and so the determination of the
constants is compromised [Figure 29 (b)]. Even so, we can conclude that C4 is able to quench TO’s
fluorescence intensity and a value of KSV= (4.8 ± 0.8) x 105 M-1 is obtained, thus showing that this
complex can in fact interfere with the system TO-ctDNA with a Kapp= 3.20 x 10⁴ M-1.
Since complexes C1 and C2 have the same kind of structure, and the results obtained for C3 and C4
were not very promising, the former were not tested regarding their DNA binding ability.
On the other hand, complexes C5, C6 and C7, have larger delocalized π systems, thanks to the
presence of the naphthalene aromatic group that allows extra van der Waals interactions. These were
tested following this procedure and the same kind of data analysis was performed. The results obtained
for the copper complexes C5 and C6 are shown in Figure 30 and the Stern-Volmer constants are
included in Table 10.
Figure 30 Stern-Volmer plots at 530 nm obtained from steady-state (I0/I) measurements for C5 (a) and C6 (b) – [DNA]~ 2 μM, TO:ctDNA= 0.8 and λex= 509 nm (I0/I data were corrected for reabsorption and inner-filter-effects).
0,5
0,6
0,7
0,8
0,9
1
1,1
1,2
1,3
1,4
1,5
0,00E+00 2,00E-06 4,00E-06 6,00E-06 8,00E-06 1,00E-05
I 0/I
[C3] / M
a
0,8
0,9
1
1,1
1,2
1,3
1,4
1,5
0,00E+00 2,00E-06 4,00E-06 6,00E-06 8,00E-06
I 0/I
[C4] / M
b
0
0,5
1
1,5
2
2,5
0,00E+00 2,00E-06 4,00E-06 6,00E-06 8,00E-06 1,00E-05 1,20E-05
I 0/I
[C5] / M
a
0,6
0,7
0,8
0,9
1
1,1
1,2
1,3
1,4
1,5
1,6
0,00E+00 2,00E-06 4,00E-06 6,00E-06 8,00E-06 1,00E-05
I 0/I
[C6] / M
b
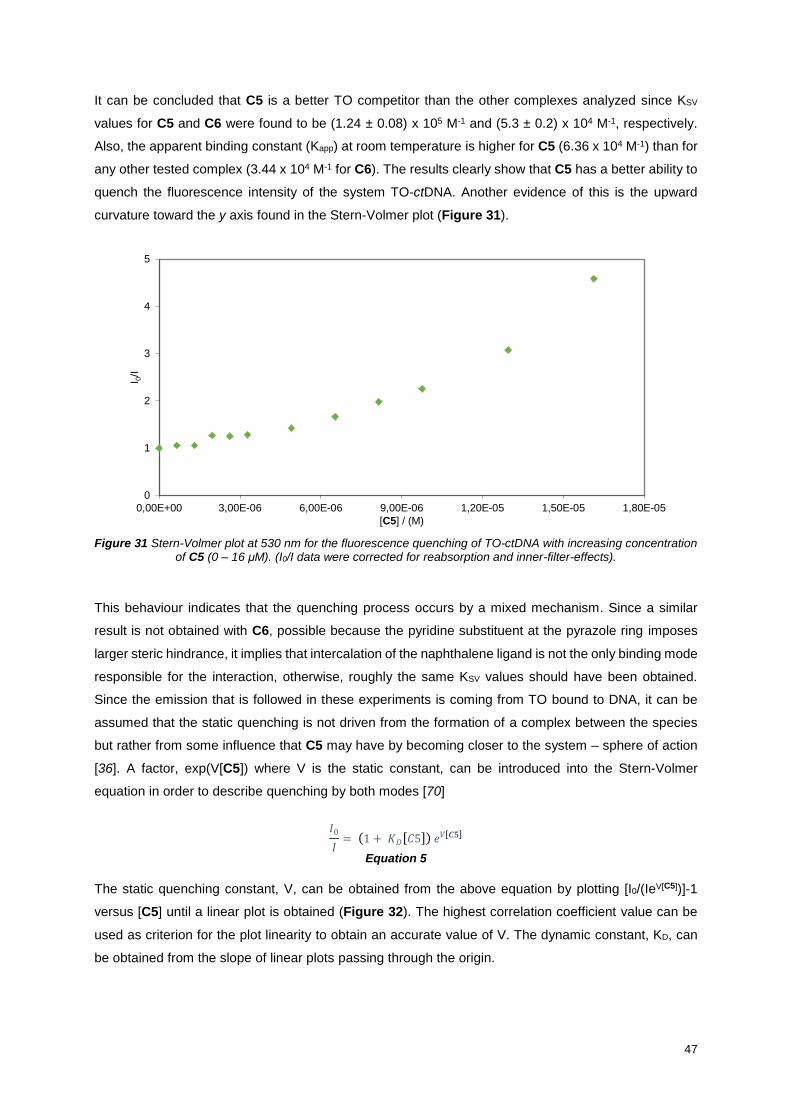
47
It can be concluded that C5 is a better TO competitor than the other complexes analyzed since KSV
values for C5 and C6 were found to be (1.24 ± 0.08) x 105 M-1 and (5.3 ± 0.2) x 104 M-1, respectively.
Also, the apparent binding constant (Kapp) at room temperature is higher for C5 (6.36 x 10⁴ M-1) than for
any other tested complex (3.44 x 10⁴ M-1 for C6). The results clearly show that C5 has a better ability to
quench the fluorescence intensity of the system TO-ctDNA. Another evidence of this is the upward
curvature toward the y axis found in the Stern-Volmer plot (Figure 31).
Figure 31 Stern-Volmer plot at 530 nm for the fluorescence quenching of TO-ctDNA with increasing concentration of C5 (0 – 16 μM). (I0/I data were corrected for reabsorption and inner-filter-effects).
This behaviour indicates that the quenching process occurs by a mixed mechanism. Since a similar
result is not obtained with C6, possible because the pyridine substituent at the pyrazole ring imposes
larger steric hindrance, it implies that intercalation of the naphthalene ligand is not the only binding mode
responsible for the interaction, otherwise, roughly the same KSV values should have been obtained.
Since the emission that is followed in these experiments is coming from TO bound to DNA, it can be
assumed that the static quenching is not driven from the formation of a complex between the species
but rather from some influence that C5 may have by becoming closer to the system – sphere of action
[36]. A factor, exp(V[C5]) where V is the static constant, can be introduced into the Stern-Volmer
equation in order to describe quenching by both modes [70]
𝐼0
𝐼= (1 + 𝐾𝐷[𝐶5]) 𝑒𝑉[𝑪𝟓]
Equation 5
The static quenching constant, V, can be obtained from the above equation by plotting [I0/(IeV[C5])]-1
versus [C5] until a linear plot is obtained (Figure 32). The highest correlation coefficient value can be
used as criterion for the plot linearity to obtain an accurate value of V. The dynamic constant, KD, can
be obtained from the slope of linear plots passing through the origin.
0
1
2
3
4
5
0,00E+00 3,00E-06 6,00E-06 9,00E-06 1,20E-05 1,50E-05 1,80E-05
I 0/I
[C5] / (M)

48
Figure 32 Modified Stern-Volmer plot at 530 nm for the fluorescence quenching of TO-ctDNA with increasing concentrations of C5, considering both dynamic and static quenching mechanisms.
The values of KD and V found for C5 are (1.09 ± 0.07) x 105 M-1 and (7.46 ± 0.04) x 103 M-1, respectivelly.
It can be seen that the magnitude of the static quenching constant is more than one order of magnitude
smaller than the dynamic quenching constant. Concluding, it is evident that complex C5 shows very
good ability for interacting with the system TO-ctDNA and thus quenching its fluorescence.
In order to compare the effect of changing the metal ion, complex C7, the only Zn(II) complex prepared,
was also evaluated and the results obtained are given in Figure 33. However, the different L:M
stoichiometry obtained for this complex, which has two ligand molecules, precludes a direct comparison
with C5, regarding solely the metal ion effect.
Figure 33 Stern-Volmer plots at 530 nm obtained from steady-state (I0/I) measurements for C7 – [DNA]~ 2.1 μM, TO:ctDNA= 0.8 and λex= 509 nm (I0/I data were corrected for reabsorption and inner-filter-effects).
0
0,2
0,4
0,6
0,8
1
1,2
1,4
0,00E+00 2,00E-06 4,00E-06 6,00E-06 8,00E-06 1,00E-05 1,20E-05
{I0/(
IeV
Dt )}-
1
[C5] / M
0,6
0,8
1
1,2
1,4
1,6
1,8
0,00E+00 2,00E-06 4,00E-06 6,00E-06 8,00E-06 1,00E-05 1,20E-05
I 0/I
[C7] / M

49
Figure 33 shows the Stern-Volmer plot. Analysis of the data resumed in Table 10 shows that although
C7 [KSV= (5.8 ± 0.3) x 104 M-1 and Kapp= 3.95 x 10⁴ M-1] is not as good as C5, the zinc complex presents
better results than all the other copper complexes; even better than C6 which has a pyridine ring at the
pyrazole. The fact that C7 has two molecules of ligand coordinated to the central metal ion, allows the
delocalization of the electrons in the π system to gain a larger volume than in any other case. This may
enhance the π-π stacking interaction between the complex and DNA.
Considering the obtained results one can infer that the ligand plays a very important role in the process,
since the best performances came from the complexes sharing the same ligand, L5, which contains a
naphthalene derivative and an unsubstituted pyrazole. This means that a larger aromatic system in the
complexes is very helpful for an efficient interaction with DNA, since the results have shown that the
naphthalene group is better than just one aromatic ring, like in C4.
All results obtained in the TO-ctDNA experiments are summarized in Table 10.
Table 10 Thiazole orange (TO) quenching assay results for the complexes.
KSV x 104 [M-1]
R2 KD x 105
[M-1] V x 103 [M-1] R2
Concentration at 50%
quenching/ μM
Kapp x 104 [M-1]
C3 n.a. n.a. n.a. n.a. n.a. n.a. n.a.
C4 4.8 ± 0.8 0.870 n.s. n.s. --- 16 3.20
C5 d.s. --- 1.09 ± 0.07 7.46 ± 0.04 0.965 8.7 6.36
C6 5.3 ± 0.2 0.988 n.s. n.s. --- 14.9 3.44
C7 5.8 ± 0.3 0.976 n.s. n.s. --- 12.8 3.95
where n.a. stands for not active as a quencher; n.s. stands for no static quenching mechanism recorded; and d.s. stands for dynamic and static quenching mechanisms.
The apparent binding constants (Kapp) at room temperature are found to be lower than the binding
constant of the classical intercalator thiazole orange (3.16 x 10⁵ M-1 [41]), indicating that the complexes
have only a partial mode of intercalation [71]. It is clear that C5 shows the best set of results and that
this is probably related to the larger aromatic system, which confers planarity to the complex.
DNA cleavage activity
To evaluate the nuclease ability of the compounds, DNA cleavage experiments on plasmid DNA (pDNA)
were monitored by agarose gel electrophoresis (AGE). With the exception of C1, all complexes and
ligands are poorly soluble in water, thus 5% DMSO was used for dissolution followed by 10 minutes
sonication. Even so, no complete dissolution was observed in the concentrations required for the
studies. Hence, all complexes and ligands were weighed to prepare a 400 μM stock solution and diluted
1:2, 1:4, 1:8, 1:16, 1:40, 1:80 and 1:160 corresponding to final concentrations of 200, 100, 50, 25, 10, 5
and 2.5 μM, respectively.
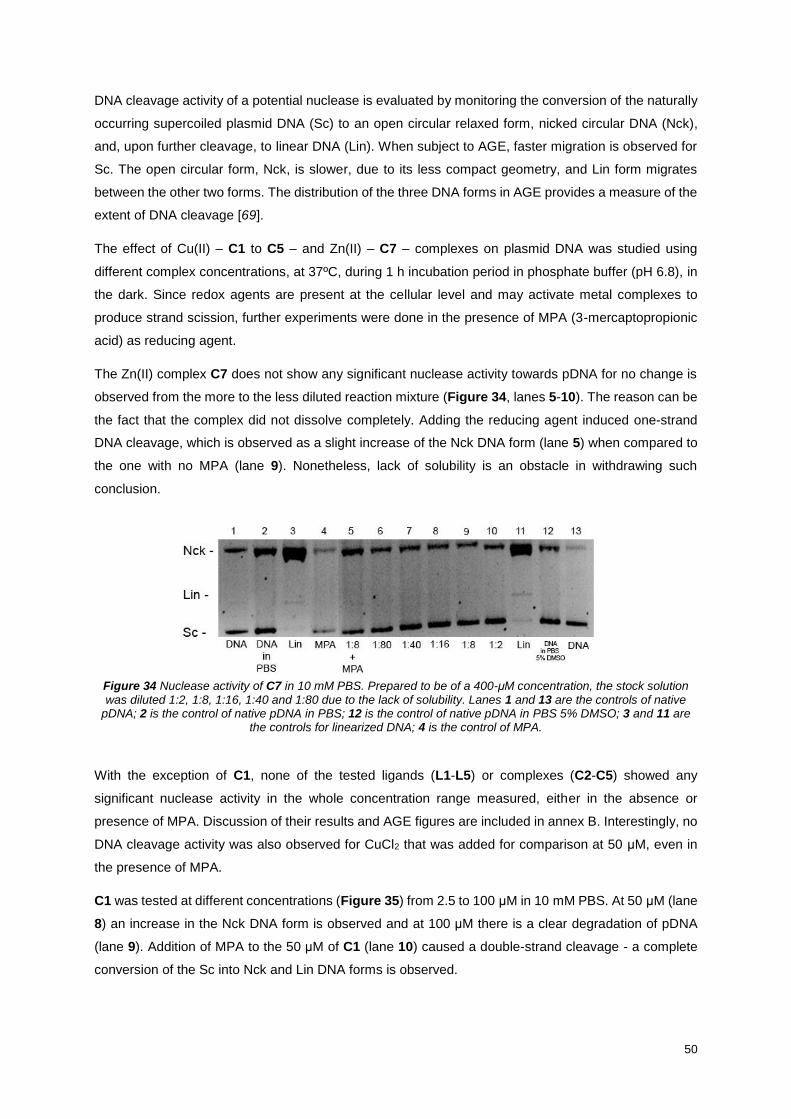
50
DNA cleavage activity of a potential nuclease is evaluated by monitoring the conversion of the naturally
occurring supercoiled plasmid DNA (Sc) to an open circular relaxed form, nicked circular DNA (Nck),
and, upon further cleavage, to linear DNA (Lin). When subject to AGE, faster migration is observed for
Sc. The open circular form, Nck, is slower, due to its less compact geometry, and Lin form migrates
between the other two forms. The distribution of the three DNA forms in AGE provides a measure of the
extent of DNA cleavage [69].
The effect of Cu(II) – C1 to C5 – and Zn(II) – C7 – complexes on plasmid DNA was studied using
different complex concentrations, at 37ºC, during 1 h incubation period in phosphate buffer (pH 6.8), in
the dark. Since redox agents are present at the cellular level and may activate metal complexes to
produce strand scission, further experiments were done in the presence of MPA (3-mercaptopropionic
acid) as reducing agent.
The Zn(II) complex C7 does not show any significant nuclease activity towards pDNA for no change is
observed from the more to the less diluted reaction mixture (Figure 34, lanes 5-10). The reason can be
the fact that the complex did not dissolve completely. Adding the reducing agent induced one-strand
DNA cleavage, which is observed as a slight increase of the Nck DNA form (lane 5) when compared to
the one with no MPA (lane 9). Nonetheless, lack of solubility is an obstacle in withdrawing such
conclusion.
Figure 34 Nuclease activity of C7 in 10 mM PBS. Prepared to be of a 400-μM concentration, the stock solution was diluted 1:2, 1:8, 1:16, 1:40 and 1:80 due to the lack of solubility. Lanes 1 and 13 are the controls of native
pDNA; 2 is the control of native pDNA in PBS; 12 is the control of native pDNA in PBS 5% DMSO; 3 and 11 are the controls for linearized DNA; 4 is the control of MPA.
With the exception of C1, none of the tested ligands (L1-L5) or complexes (C2-C5) showed any
significant nuclease activity in the whole concentration range measured, either in the absence or
presence of MPA. Discussion of their results and AGE figures are included in annex B. Interestingly, no
DNA cleavage activity was also observed for CuCl2 that was added for comparison at 50 μM, even in
the presence of MPA.
C1 was tested at different concentrations (Figure 35) from 2.5 to 100 μM in 10 mM PBS. At 50 μM (lane
8) an increase in the Nck DNA form is observed and at 100 μM there is a clear degradation of pDNA
(lane 9). Addition of MPA to the 50 μM of C1 (lane 10) caused a double-strand cleavage - a complete
conversion of the Sc into Nck and Lin DNA forms is observed.

51
Figure 35 Nuclease activity of C1 at 2.5, 5, 10, 25, 50 and 100 μM in 10 mM PBS. The complex is soluble in water and was dissolved using MilliQ® water. Lanes 1 and 14 are the controls of native pDNA; 2 and 13 are the
controls of native pDNA in PBS; 3 and 12 are the controls for linearized DNA. Lane 11 is the control of MPA.
Figure 36 compares the results of the nuclease activity of C1 and C5 and their ligands L1 and L5. It is
clear that a complete degradation of the pDNA occurs at 100 and 200 μM of C1 (lanes 4 and 5). In the
presence of MPA, the Nck DNA form is observed (lane 6). This suggests that the DNA cleavage activity
of C1 occurs to a lesser extent upon addition of the reducing agent.
It is important to point out that observing only Nck DNA form and no Sc and Lin is not a typical result. A
complete degradation of the Sc DNA form implies the appearance of both Nck and Lin in the same lane.
In other words, when one DNA strand is cut, part of the Sc form is converted into Nck. In the case of a
double-strand cleavage, the Nck form increases and the Lin form appears (Figure 36, lane 15). A
complete linearization means a total degradation of the Sc form into Nck and Lin (lane 3 and 15). As the
linearization occurs at the cost of both Sc and Nck forms, it is unusual to observe only Nck DNA form
with no Sc and Lin (lanes 6, 11 and 12). Hence, at the moment no explanation for this observation is yet
available. This could probably be explained by a different cleavage mechanism, however to date no
such phenomenon has been noticed. The experiment was replicated and these findings were confirmed
(data not showed).
Also, in this experiment the highest concentration of C5 seems to completely destroy pDNA (lane 10).
Lanes 11 and 12 represent the above-described phenomenon - the Nck form with no Sc and Lin in the
same lane.
Figure 36 Nuclease activity of C1 and C5 and corresponding ligands L1 and L5 in 10 mM PBS. C1 is soluble in water and was tested at 100 and 200 μM. Prepared to be of a 400-μM concentration, the stock solution of C5 was diluted 1:2 and 1:4. Lanes 1 and 16 are the controls of native pDNA; 2 is the controls of native pDNA in PBS and
5% DMSO; 3 and 15 are the controls for linearized DNA. Lane 7 is the control of MPA.

52
As C1 is soluble in water, it can be concluded that single-strand cleavage occurs for concentrations up
to 50 μM. Double-strand cleavage most likely takes place for concentrations between 50 and 100 μM
because at the latter concentration a complete degradation of the Sc is observed. Strong linearization
occurs at 50 μM in the presence of MPA, where the Sc form is completely degraded.
The rest of the tested compounds do not show any significant nuclease activity towards pDNA. However,
the low solubility of the compounds may be an explanation for the lack of activity.
HSA binding studies
In order to reach DNA in the nucleus, or any other cellular target, the drugs in the organism need to be
transported by proteins in the blood stream. In this regard, human serum albumin (HSA) plays a key
role in our organism, since it is the main transporter of endogenous and exogenous molecules to the
cells and therefore the determination of the binding affinity to this protein by any new drug is very
important.
Human serum albumin contains only one tryptophan residue in its structure, Trp214, located in
subdomain IIA, near Sudlow’s drug binding site I. This residue confers fluorescence emission to the
protein upon excitation at 295 nm; it is very sensitive to its local environment, and its fluorescence
emission easily responds to small changes in the vicinity of the indole ring that occur upon compounds’
binding [36,72,73].
To evaluate the interaction of the complexes with the protein, to a solution of ca. 1.5 μM of HSA in PBS
(pH 7.4), successive aliquots of a stock solution of each complex in DMSO were added and the
fluorescence emission was recorded between 305 and 700 nm with excitation at 295 nm. The DMSO %
was kept below 2%.
The maximum emission wavelength is close to the Raman peak upon excitation at 295 nm. Therefore,
for the Stern-Volmer plots, the emission at 340 nm was used and blank samples (in the absence of
HSA) with the same concentration of the complexes were recorded and subsequently subtracted from
the emission spectra. Moreover, the fluorescence emission intensity was corrected for the absorption
and inner filter effects using UV-Visible absorption data recorded for each sample, since all complexes
show absorption in the measured region [37,38,39].
The effect of complexes C1 – C7 in the HSA fluorescence emission is compared in Figure 37.

53
Figure 37 Effect of complexes C1 – C7 in HSA fluorescence emission: relative fluorescence intensity (%) at emission maxima with increasing complex concentration.
Once again, the quenching can be evaluated by the Stern-Volmer equation (Equation 1) allowing the
determination of KSV from the slope of the linear plot of I0/I vs. [Complex]; knowing that the average
lifetime for the Trp214 in HSA is τ0 = 2.04 x 10⁻⁹ s, under the experimental conditions that were used
(this value was measured during this project and will be discussed later on this Master’s thesis), the
bimolecular constant, kq, can be calculated for each complex using the relationship kq= KSV/τ0. This way
the accessibility of the quencher to the fluorophore can be evaluated [36].
Complex C1 is a pyridoxal Cu(II) system, water soluble and very stable in aqueous solution. Addition of
C1 to the HSA solution yields a linear relationship in the Stern-Volmer plot, meaning that the quenching
is due to only one mechanism of action, as can be seen in Figure 38.
Figure 38 Stern-Volmer plot at 339 nm obtained from steady-state (I0/I) measurements for C1 (0-7.78 μM) – [HSA]~ 1.5 μM, and λex= 295 nm (I0/I data were corrected for reabsorption and inner-filter-effects).
0,8
0,9
1
1,1
1,2
1,3
1,4
1,5
1,6
0,00E+00 2,00E-06 4,00E-06 6,00E-06 8,00E-06
I 0/I
[C1] M

54
The obtained kq= 3.08 x 10¹³ M-1s-1 value, corresponding to KSV= (0.63 ± 0.01) x 105 M-1, is larger than
the limiting diffusion constant of the biomolecules (Kdif = 2.0x10¹⁰ M-1s-1 [36]), indicating that the
fluorescence quenching is caused due to the specific interaction of C1 with HSA, consistent with a static
quenching mechanism [45].
Employment of the Scatchard equation (Equation 3) enables the determination of the binding constant
and the number of binding sites for this system. Results are included in Table 11.
Figure 39 Scatchard plot at 339 nm obtained from steady-state (I0/I) measurements for C1 (0-7.78 μM) – [HSA]~ 1.5 μM, and λex= 295 nm, obtaining n= (0.93±0.02) and log K= (4.4±0.1).
Similarly to the observed with the system TO-ctDNA, complex C3, containing the methoxy derivative,
was unable to quench the fluorescence of albumin (Figure 40), meaning that this complex does not bind
to the protein, at least in a manner that affects the fluorescence of the Trp214 residue.
Figure 40 Stern-Volmer plot at 339 nm obtained from steady-state (I0/I) measurements for C3 – [HSA]~ 1.5 μM, and λex= 295 nm (I0/I data were corrected for reabsorption and inner-filter-effects).
-1,6
-1,4
-1,2
-1
-0,8
-0,6
-0,4
-0,2
0
-6,4 -6,2 -6 -5,8 -5,6 -5,4 -5,2 -5 -4,8
log
[(I
0-I
)/I]
log [C1]
0
0,5
1
1,5
2
0,00E+00 2,00E-06 4,00E-06 6,00E-06 8,00E-06 1,00E-05 1,20E-05 1,40E-05
I 0/I
[C3] M

55
Despite the result obtained for C3, the other Cu(II) complexes with similar systems, C2 and C4, were
tested since this assay provides evidence if a substance can be transported in the blood stream by this
protein, thus, escaping metabolism. The results for these two complexes are shown below (Figure 41)
and included in Table 11.
Figure 41 Stern-Volmer plots at 339 nm obtained from steady-state (I0/I) measurements for C2 (a) and C4 (b) – [HSA]~ 1.5 μM, and λex= 295 nm (I0/I data were corrected for reabsorption and inner-filter-effects).
The parameters are similar to those obtained for C1. Nevertheless, the unsubstituted complex C2 has
higher HSA binding ability than the ethoxy-substituted C4.
Again the bimolecular constants (2.73 x 10¹³ M-1s-1 for C2 and 1.08 x 10¹³ M-1s-1 for C4) support a static
mechanism, also for the interaction of these complexes with HSA. Likewise, the analysis with the
Scatchard equation was also applied (Figure 42).
Figure 42 Scatchard plots at 339 nm obtained from steady-state (I0/I) measurements for C2 (a) and C4 (b) – [HSA]~ 1.5 μM, and λex= 295 nm (data were corrected for reabsorption and inner-filter-effects).
Curiously, the values of the binding to C2 (n= 0.64±0.02 and log K= 2.88±0.09) are lower than the ones
obtained with C4 (n= 0.76±0.05 and log K= 3.1±0.2), although the error in the determination of the
binding constant for C4 is higher. This means that C4 shows a higher affinity for the protein. This can
also be seen in the lower % of initial fluorescence observed for C2 when compared with C4. Since the
results show that C4 binds with a higher binding constant and in a larger number of sites than C2, but
this last one has a better ability for quenching the fluorescence emission of HSA, the conclusion is that
the binding of C4 to albumin does not change significantly the environment around Trp214 and probably
its binding site is not in its vicinity.
0,8
0,9
1
1,1
1,2
1,3
1,4
0,00E+00 2,00E-06 4,00E-06 6,00E-06
I 0/I
[C2] M
a
0,9
0,95
1
1,05
1,1
1,15
1,2
0,00E+00 3,00E-06 6,00E-06 9,00E-06
I 0/I
[C4] M
b
-1,2
-1
-0,8
-0,6
-0,4
-0,2
0
-6 -5,5 -5
log
[(I
0-I
)/I]
log [C2]
a
-1,2
-1,1
-1
-0,9
-0,8
-0,7
-0,6
-0,5
-5,7 -5,5 -5,3 -5,1 -4,9 -4,7
log
[(I
0-I
)/I]
log [C4]
b
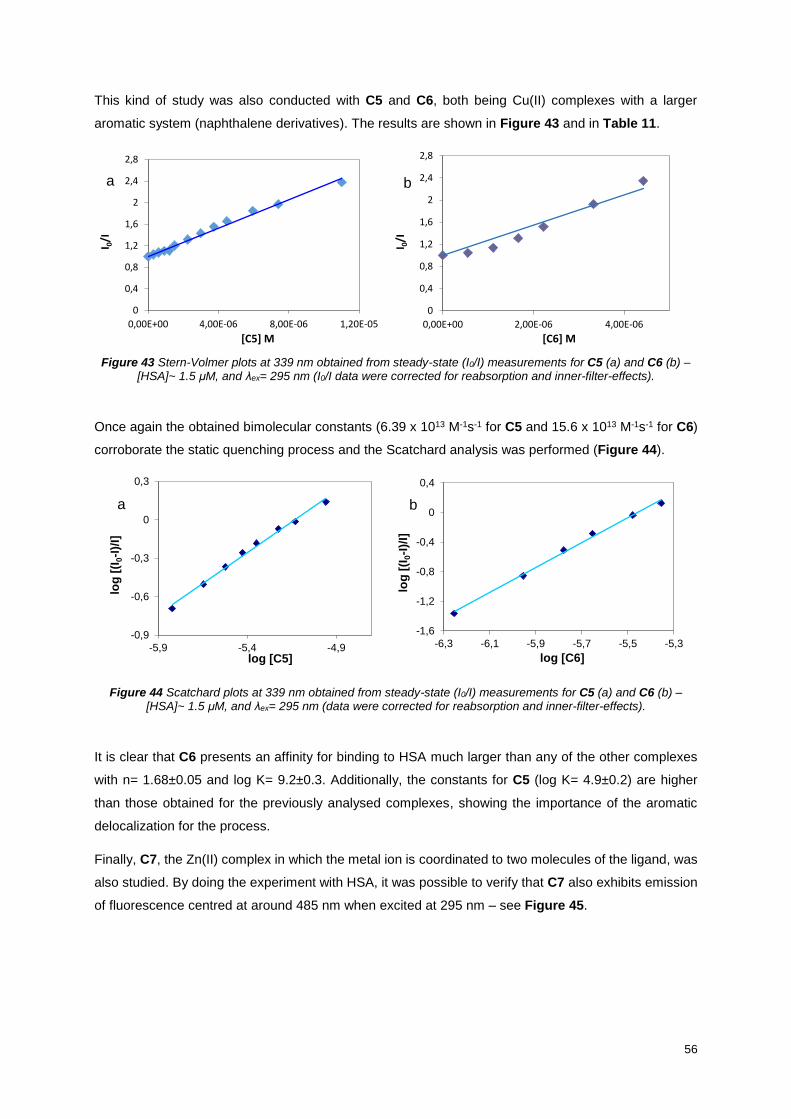
56
This kind of study was also conducted with C5 and C6, both being Cu(II) complexes with a larger
aromatic system (naphthalene derivatives). The results are shown in Figure 43 and in Table 11.
Figure 43 Stern-Volmer plots at 339 nm obtained from steady-state (I0/I) measurements for C5 (a) and C6 (b) – [HSA]~ 1.5 μM, and λex= 295 nm (I0/I data were corrected for reabsorption and inner-filter-effects).
Once again the obtained bimolecular constants (6.39 x 10¹³ M-1s-1 for C5 and 15.6 x 10¹³ M-1s-1 for C6)
corroborate the static quenching process and the Scatchard analysis was performed (Figure 44).
Figure 44 Scatchard plots at 339 nm obtained from steady-state (I0/I) measurements for C5 (a) and C6 (b) – [HSA]~ 1.5 μM, and λex= 295 nm (data were corrected for reabsorption and inner-filter-effects).
It is clear that C6 presents an affinity for binding to HSA much larger than any of the other complexes
with n= 1.68±0.05 and log K= 9.2±0.3. Additionally, the constants for C5 (log K= 4.9±0.2) are higher
than those obtained for the previously analysed complexes, showing the importance of the aromatic
delocalization for the process.
Finally, C7, the Zn(II) complex in which the metal ion is coordinated to two molecules of the ligand, was
also studied. By doing the experiment with HSA, it was possible to verify that C7 also exhibits emission
of fluorescence centred at around 485 nm when excited at 295 nm – see Figure 45.
0
0,4
0,8
1,2
1,6
2
2,4
2,8
0,00E+00 4,00E-06 8,00E-06 1,20E-05
I 0/I
[C5] M
a
0
0,4
0,8
1,2
1,6
2
2,4
2,8
0,00E+00 2,00E-06 4,00E-06
I 0/I
[C6] M
b
-0,9
-0,6
-0,3
0
0,3
-5,9 -5,4 -4,9
log
[(I
0-I
)/I]
log [C5]
a
-1,6
-1,2
-0,8
-0,4
0
0,4
-6,3 -6,1 -5,9 -5,7 -5,5 -5,3
log
[(I
0-I
)/I]
log [C6]
b

57
Figure 45 Quenching of HSA (~1.5 μM in PBS) emission of fluorescence with increasing amounts of C7 (0-3 μM in 1%DMSO/PBS). As the amount of complex increases, the emission of HSA at 340 nm decreases and the
emission of C7 at 485 nm increases.
As can be seen in Figure 45 the emission maximum for C7 is around 485 nm while the one for albumin
is near 340 nm with the isoacitinic point at 431 nm and, therefore, it is still possible to conduct the
experiment and do the analysis of the data, although a bigger error is associated to the results of the
analysis [74]. Figure 46 shows the Stern-Volmer and Scatchard analysis for this system.
Figure 46 Stern-Volmer (a) and Scatchard (b) plots at 339 nm obtained from steady-state (I0/I) measurements for C7 – [HSA]~ 1.5 μM, and λex= 295 nm (I0/I data were corrected for reabsorption and inner-filter-effects).
It can be seen that, similarly to C6, with C7 there is a strong dynamic quenching process in addition to
the static, but in this last case with lower contribution when compared with those obtained with C6.
With the exception of C6, the zinc complex shows higher affinity to HSA than any other copper complex
analysed. The results obtained in the HSA experiments are summarized in Table 11 and Figure 47.
0,00E+00
3,00E+06
6,00E+06
9,00E+06
1,20E+07
1,50E+07
1,80E+07
305 355 405 455 505 555
Flu
ore
sce
nce
inte
nsity (
a.u
.)
wavelength (nm)
C7
C7
0
0,4
0,8
1,2
1,6
2
2,4
2,8
3,2
0,00E+00 1,00E-06 2,00E-06 3,00E-06
I 0/I
[C7] M
a
-1,2
-1
-0,8
-0,6
-0,4
-0,2
0
0,2
0,4
-6,6 -6,1 -5,6 -5,1
log
[(I
0-I
)/I]
log [C7]
b

58
Table 11 Results for HSA binding studies with the synthetized complexes. C1 C2 C3 C4 C5 C6 C7
KSV x 105 (M-1) 0.63±0.01 0.56±0.04 n.a. 0.22±0.01 1.30±0.04 3.2±0.2 6.5±0.3
kq x 1013 (M-1s-1) 3.08 2.73 n.a. 1.08 6.39 15.6 31.9
R2 0.998 0.976 --- 0.978 0.991 0.974 0.987
log K 4.4±0.1 2.88±0.09 n.a. 3.1±0.2 4.9±0.2 9.2±0.3 6.9±0.1
n 0.93±0.02 0.64±0.02 n.a. 0.76±0.05 0.96±0.03 1.68±0.05 1.21±0.02
R2 0.997 0.996 --- 0.981 0.993 0.996 0.998
n.a. means that no activity was recorded.
Figure 47 Results for quenching emission fluorescence of HSA experiments with the synthetized complexes.
It is clear that complexes with ligands having a larger aromatic system, such as C5, C6 and C7, the
naphthalene derivatives, also show a higher affinity to HSA, meaning that the π-π interactions play an
important role in this process, as well as the planarity of the complex. For the Cu(II) complexes with
smaller aromatic systems, C1, with a ligand containing a pyridoxal ring stands out, showing values for
kq and log k comparable to those of C5 (see Table 11 and Figure 47).
Cell viability assays in human tumor cell lines
The cytotoxicity of complexes C1 – C7 was evaluated on human PC3 prostate cancer and MCF7 breast
cancer cells. For comparative purposes cisplatin was also included in the study. Figure 48 shows the
concentration response curves found for the Cu(II) and Zn(II) complexes, which was evaluated for an
incubation period of 48 h with both cell lines. The IC50 values were measured using the colorimetric MTT
assay and are presented in Table 12.

59
PC3 is an epithelial cell line from a human prostatic adenocarcinoma metastatic to bone, which retrieves
characteristics identical to those used initially to produce the tumor. PC3 does not respond to androgens,
glucocorticoids, or epidermal or fibroblast growth factors. Overall, the functional and morphologic
characteristics of PC3 are those of a poorly-differentiated adenocarcinoma [75]. PC3 cells do not
express PSMA (prostate-specific membrane antigen), a type II transmembrane glycoprotein, which acts
as a carboxypeptidase. Androgen-dependent prostate cancer lines, which express PSMA endogenously
are less invasive compared with androgen-independent cells, like PC3 [76].
MCF7 cells are useful for in vitro breast cancer studies because the cell line retains some characteristics
particular to the mammary epithelium, including the ability to process estrogen, thanks to receptors in
the cell cytoplasm. This makes the MCF7 cell line an estrogen receptor (ER) positive control cell line.
Growth can be inhibited using tumor necrosis factor alpha (TNF alpha), and treatment of MCF7 cancer
cells with anti-estrogens can modulate insulin-like growth factor finding protein’s, which ultimately have
the effect of reduction in cell growth [77].
a b
Figure 48 Concentration-response curves obtained upon incubation of the (a) PC3 and (b) MCF7 cells for 48 h with the complexes.
Table 12 In vitro cytotoxic activity measured as the half-inhibitory concentration (IC50) after 48 h incubation period for C1 – C7 against two human tumor cell lines: prostate cancer PC3 cells and breast cancer MCF7 cells. IC50 values are reported in μM (±SD). For comparison Cisplatin was included as a positive control. (SD = standard
deviation).
IC50 (μM) 48 h
Compounds PC3 MCF7
C1 163 ± 66.5 183 ± 74.5
C2 42.4 ± 10.8 80.2 ± 14.5
C3 179 ± 80 48.1 ± 9.85
C4 209 ± 85.5 49.5 ± 12.6
C5 7.71 ± 2.51 2.58 ± 0.63
C6 2.61 ± 1.45 2.65 ± 0.87
C7 35.2 ± 14.6 1.06 ± 0.36
Cisplatin 57.3 ± 14 28 ± 6*
* IC50 value obtained after 72 h incubation period [69].
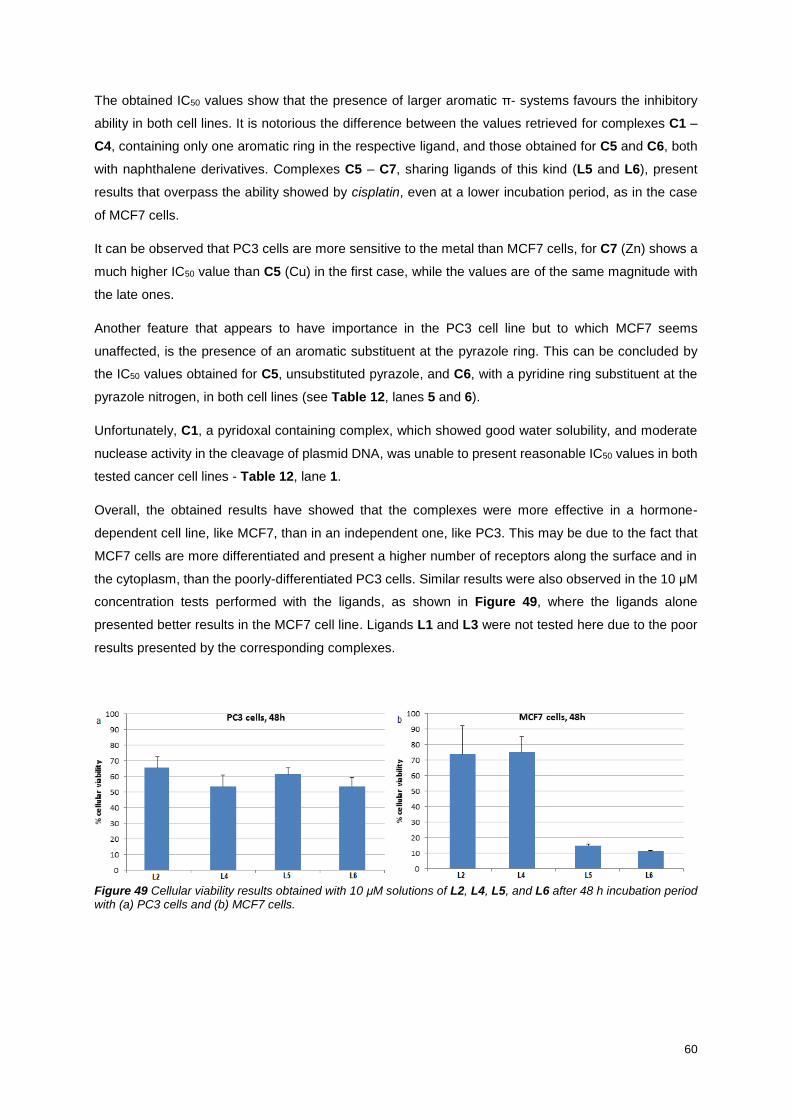
60
The obtained IC50 values show that the presence of larger aromatic π- systems favours the inhibitory
ability in both cell lines. It is notorious the difference between the values retrieved for complexes C1 –
C4, containing only one aromatic ring in the respective ligand, and those obtained for C5 and C6, both
with naphthalene derivatives. Complexes C5 – C7, sharing ligands of this kind (L5 and L6), present
results that overpass the ability showed by cisplatin, even at a lower incubation period, as in the case
of MCF7 cells.
It can be observed that PC3 cells are more sensitive to the metal than MCF7 cells, for C7 (Zn) shows a
much higher IC50 value than C5 (Cu) in the first case, while the values are of the same magnitude with
the late ones.
Another feature that appears to have importance in the PC3 cell line but to which MCF7 seems
unaffected, is the presence of an aromatic substituent at the pyrazole ring. This can be concluded by
the IC50 values obtained for C5, unsubstituted pyrazole, and C6, with a pyridine ring substituent at the
pyrazole nitrogen, in both cell lines (see Table 12, lanes 5 and 6).
Unfortunately, C1, a pyridoxal containing complex, which showed good water solubility, and moderate
nuclease activity in the cleavage of plasmid DNA, was unable to present reasonable IC50 values in both
tested cancer cell lines - Table 12, lane 1.
Overall, the obtained results have showed that the complexes were more effective in a hormone-
dependent cell line, like MCF7, than in an independent one, like PC3. This may be due to the fact that
MCF7 cells are more differentiated and present a higher number of receptors along the surface and in
the cytoplasm, than the poorly-differentiated PC3 cells. Similar results were also observed in the 10 μM
concentration tests performed with the ligands, as shown in Figure 49, where the ligands alone
presented better results in the MCF7 cell line. Ligands L1 and L3 were not tested here due to the poor
results presented by the corresponding complexes.
Figure 49 Cellular viability results obtained with 10 μM solutions of L2, L4, L5, and L6 after 48 h incubation period with (a) PC3 cells and (b) MCF7 cells.
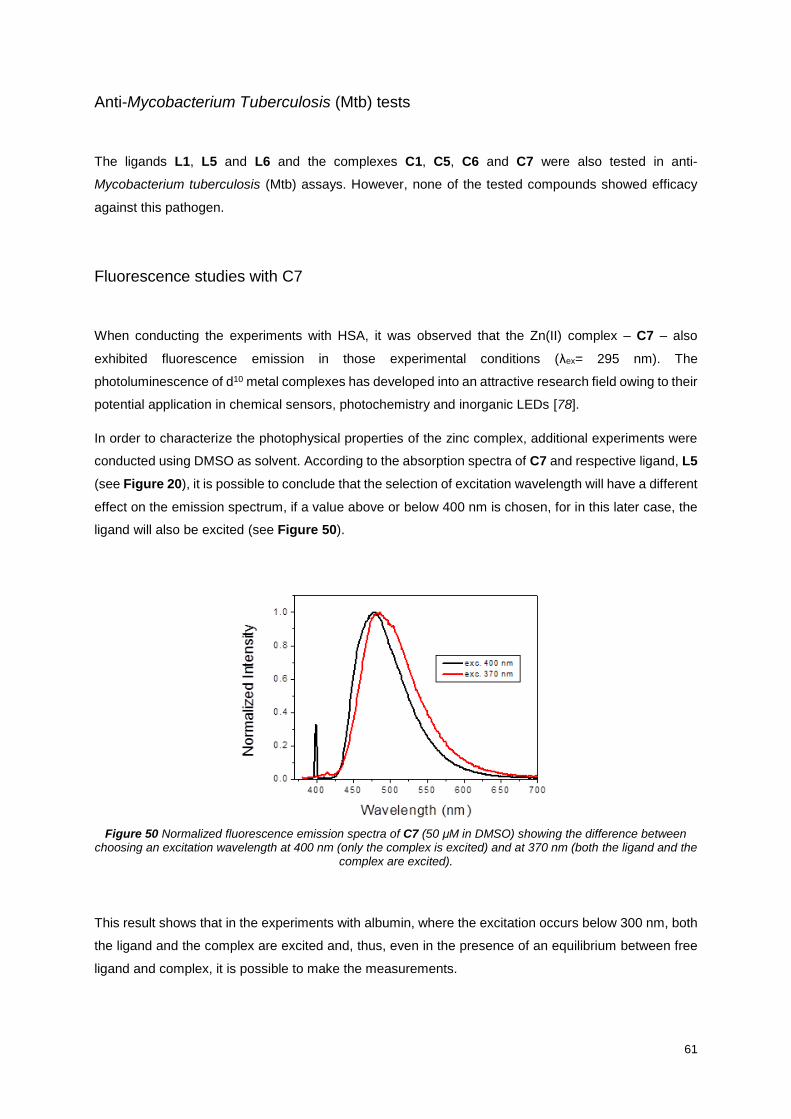
61
Anti-Mycobacterium Tuberculosis (Mtb) tests
The ligands L1, L5 and L6 and the complexes C1, C5, C6 and C7 were also tested in anti-
Mycobacterium tuberculosis (Mtb) assays. However, none of the tested compounds showed efficacy
against this pathogen.
Fluorescence studies with C7
When conducting the experiments with HSA, it was observed that the Zn(II) complex – C7 – also
exhibited fluorescence emission in those experimental conditions (λex= 295 nm). The
photoluminescence of d10 metal complexes has developed into an attractive research field owing to their
potential application in chemical sensors, photochemistry and inorganic LEDs [78].
In order to characterize the photophysical properties of the zinc complex, additional experiments were
conducted using DMSO as solvent. According to the absorption spectra of C7 and respective ligand, L5
(see Figure 20), it is possible to conclude that the selection of excitation wavelength will have a different
effect on the emission spectrum, if a value above or below 400 nm is chosen, for in this later case, the
ligand will also be excited (see Figure 50).
Figure 50 Normalized fluorescence emission spectra of C7 (50 μM in DMSO) showing the difference between choosing an excitation wavelength at 400 nm (only the complex is excited) and at 370 nm (both the ligand and the
complex are excited).
This result shows that in the experiments with albumin, where the excitation occurs below 300 nm, both
the ligand and the complex are excited and, thus, even in the presence of an equilibrium between free
ligand and complex, it is possible to make the measurements.
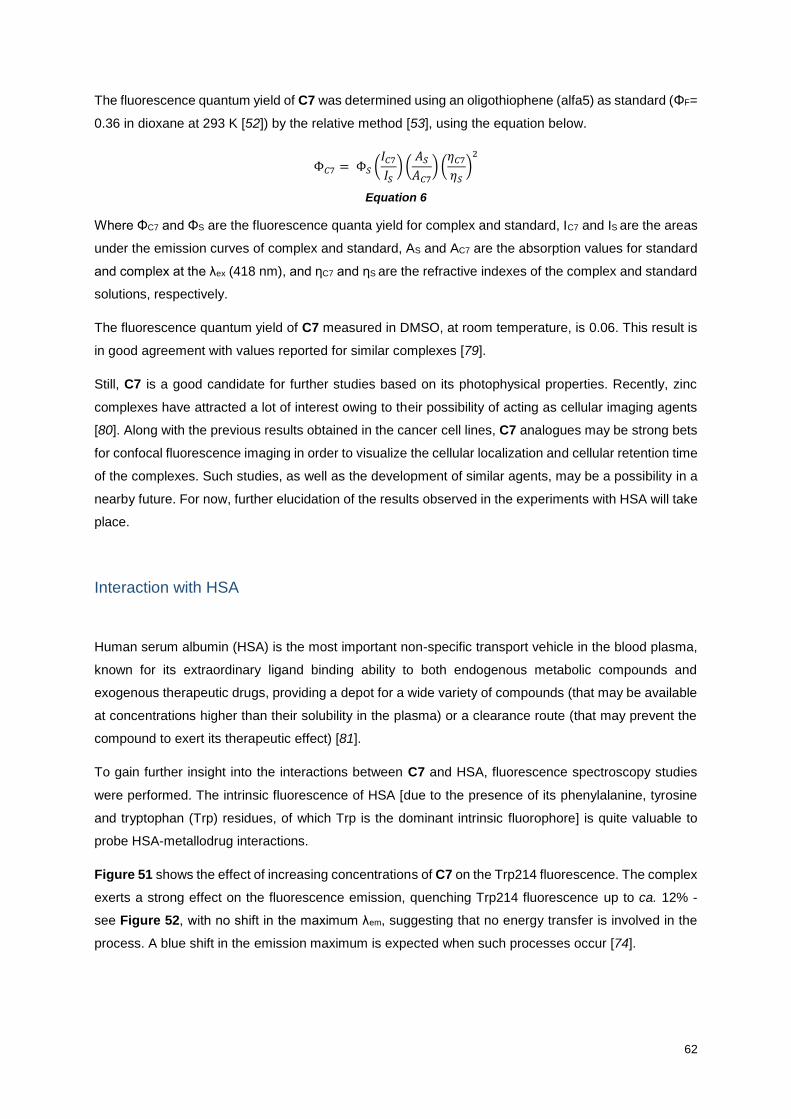
62
The fluorescence quantum yield of C7 was determined using an oligothiophene (alfa5) as standard (ΦF=
0.36 in dioxane at 293 K [52]) by the relative method [53], using the equation below.
Φ𝐶7 = Φ𝑆 (𝐼𝐶7
𝐼𝑆
) (𝐴𝑆
𝐴𝐶7
) (𝜂𝐶7
𝜂𝑆
)2
Equation 6
Where ΦC7 and ΦS are the fluorescence quanta yield for complex and standard, IC7 and IS are the areas
under the emission curves of complex and standard, AS and AC7 are the absorption values for standard
and complex at the λex (418 nm), and ηC7 and ηS are the refractive indexes of the complex and standard
solutions, respectively.
The fluorescence quantum yield of C7 measured in DMSO, at room temperature, is 0.06. This result is
in good agreement with values reported for similar complexes [79].
Still, C7 is a good candidate for further studies based on its photophysical properties. Recently, zinc
complexes have attracted a lot of interest owing to their possibility of acting as cellular imaging agents
[80]. Along with the previous results obtained in the cancer cell lines, C7 analogues may be strong bets
for confocal fluorescence imaging in order to visualize the cellular localization and cellular retention time
of the complexes. Such studies, as well as the development of similar agents, may be a possibility in a
nearby future. For now, further elucidation of the results observed in the experiments with HSA will take
place.
Interaction with HSA
Human serum albumin (HSA) is the most important non-specific transport vehicle in the blood plasma,
known for its extraordinary ligand binding ability to both endogenous metabolic compounds and
exogenous therapeutic drugs, providing a depot for a wide variety of compounds (that may be available
at concentrations higher than their solubility in the plasma) or a clearance route (that may prevent the
compound to exert its therapeutic effect) [81].
To gain further insight into the interactions between C7 and HSA, fluorescence spectroscopy studies
were performed. The intrinsic fluorescence of HSA [due to the presence of its phenylalanine, tyrosine
and tryptophan (Trp) residues, of which Trp is the dominant intrinsic fluorophore] is quite valuable to
probe HSA-metallodrug interactions.
Figure 51 shows the effect of increasing concentrations of C7 on the Trp214 fluorescence. The complex
exerts a strong effect on the fluorescence emission, quenching Trp214 fluorescence up to ca. 12% -
see Figure 52, with no shift in the maximum λem, suggesting that no energy transfer is involved in the
process. A blue shift in the emission maximum is expected when such processes occur [74].

63
Figure 51 Fluorescence emission spectra measured for solutions containing HSA (ca. 32.5 μM) and increasing amounts of C7 (0, 6.44, 12.8, 31, 74.8, 132 μM). Excitation at 280 nm.
Since for the last measurement, [C7] = 132 μM, the absorbance of the solution at the excitation
wavelength (λex = 280 nm) reached a value over 2, leading to a correction factor for the fluorescence
emission too high to be reliable [37,39], thus, this last point was not considered in the following analysis.
Figure 52 Variation of the fluorescence intensity (%I0) at the emission maximum with the [C7]/M. Excitation at 280 nm.
The fluorescence quenching data were analyzed by plotting I0/I vs. [C7] as depicted in Figure 53.
0
20
40
60
80
100
0,00E+00 2,00E-05 4,00E-05 6,00E-05 8,00E-05
% I
0
[C7] / M

64
Figure 53 Stern-Volmer plot for the fluorescence quenching of HSA (ca. 32 μM in PBS) with increasing concentration of C7 (0, 6.44, 12.8, 31, 74.8 μM). Excitation at 280 nm (I0/I data were corrected for reabsorption
and inner filter effects).
The Stern–Volmer plot presented in Figure 53 (for λemmax = 326 nm) provides information on the
mechanism causing the quenching observed. The variation of steady-state I0/I with increasing complex
concentration shows an upward curvature, which follows a quadratic trend, that is well described (R2 =
0.9965) by I0/I = (8.84 x 10⁸) ˣ [C7]2 + (2.60 x 10⁴) ˣ [C7] + 1.
These data indicate that the interaction of complex C7 and HSA occurs by a mixed mechanism, which
is consistent with simultaneous static and dynamic quenching processes. The Stern–Volmer constants
associated with each mechanism can be obtained from [36]
𝐼0
𝐼= 𝐾𝐷𝐾𝑆[𝑄]2 + (𝐾𝐷 + 𝐾𝑆)[𝑄] + 1
Equation 7
𝜏0
𝜏= 𝐾𝐷[𝑄] + 1
Equation 8
where I0, I and [Q] have the usual meaning, KD is the dynamic quenching constant, KS is the static
quenching constant, τ0 and τ are the average fluorescence lifetime of HSA in the absence and in the
presence of quencher, respectively.
Therefore, time-resolved fluorescence measurements were carried out using the same molar ratios of
HSA:C7 as before, in order to determine KD. The spectra were measured using λex= 280 nm and
collecting at λem= 340 nm for the albumin and λem= 500 nm for C7.
The Stern-Volmer plot for time-resolved fluorescence measurements, τ0/τ versus [C7], follows a linear
trend (R2 = 0.9933): τ0/τ = 1.56 x 10⁴ ˣ [C7] + 1, as shown in Figure 54.
0
1
2
3
4
5
6
7
8
9
0,00E+00 2,00E-05 4,00E-05 6,00E-05 8,00E-05
I 0/I
[C7] / M

65
Figure 54 Stern-Volmer for time-resolved fluorescence measurements ([HSA] ~32μM in PBS and [C7] = 0, 6.44, 12.8, 31, 74.8). Excitation at 280 nm and the samples were stirred while the measurements where conducted.
Yielding for this case, KD = (1.56 ± 0.06) x 104 M-1 and KS = (5.7 ± 0.1) x 104 M-1, obtained according to
the equations shown above (Equation 7 and Equation 8).
KD - the Stern–Volmer constant which corresponds to the dynamic contribution - is quite large, in fact
several orders of magnitude above the value expected for random collisions between the fluorophore
and the complex [36], suggesting a specific but ‘loose’ interaction of C7 with the protein [82]. This gives
a clear indication that C7 is located preferentially in the vicinity of the protein and, consequently, that its
effective concentration in the proximity of Trp214 is surely much higher than the analytical concentration
of the complex in solution [46]. Overall, fluorescence data undoubtedly proves that C7 binds to HSA,
probably with the formation of {protein-complex} adducts, and the Scatchard equation (see Equation 3
in Biological Evaluation Methods section) will be employed to calculate the binding constant and
number of binding sites - Figure 55.
Figure 55 Scatchard plot at 326 nm obtained from steady-state (I0/I) measurements for HSA (ca. 32 μM in PBS) with increasing concentration of C7 (0, 6.44, 12.8, 31, 74.8 μM). Excitation at 280 nm (data were corrected for
reabsorption and inner filter effects).
In this case, n = (1.2 ± 0.1) and log K = (5.7 ± 0.6).
0
0,5
1
1,5
2
2,5
0,00E+00 2,00E-05 4,00E-05 6,00E-05 8,00E-05
τ 0/τ
[C7] / M
-0,6
-0,3
0
0,3
0,6
0,9
1,2
-5,3 -5,1 -4,9 -4,7 -4,5 -4,3 -4,1 -3,9
log
[(I
0/I
)/I]
log [C7]

66
The constants obtained in this experience are somehow lower than those obtained before by steady
state. In order to clarify this point, a solution of HSA (~3.4 μM in PBS) was subject to irradiation at 295
nm, mimetizing the conditions of the first experiment, in which all the measurements were taken in the
fluorescence cell using the same protein solution. Fluorescence quenching was observed under these
conditions, showing that the values obtained with the previous procedure are overestimated, and that
fluorescence experiments with HSA should be done in batch.
Time-resolved fluorescence experiments were carried out in order to determine HSA and C7
fluorescence lifetimes and their relationship, as depicted in Figure 56.
Figure 56 Plot of fluorescence average lifetime of HSA (blue) and C7 (red). [HSA]~32μM in PBS and [C7] = 0, 12.8, 31, 74.8, 132 μM. Excitation at 280 nm.
As can be seen in Figure 56, one measurement corresponds to a solution of only HSA in PBS buffer,
thus allowing the determination of the fluorescence average lifetime of the protein in the experimental
conditions used throughout these experiments. The time-resolved fluorescence measurement yields an
average lifetime of 2.04 ns for HSA – see Figure 57. This value is in agreement to the reference value
for the tryptophan fluorescence average lifetime in solution [36].
Figure 57 Fluorescence decay of HSA 32.5 μM in PBS buffer (pH 7.4) at 23º C with λex= 280 nm, λem= 340 nm and fit to a 3 exponential function with decay times of 0.10, 0.50, and 3.42 ns and pre-exponential coefficients of
0.28, 0.16, and 0.56, respectively. χ2 = 1.12.
0
0,5
1
1,5
2
2,5
0,00E+00 4,00E-05 8,00E-05 1,20E-04 1,60E-04
ave
rag
e
life
tim
e (
ns)
[C7] / M
τHSA
τC7
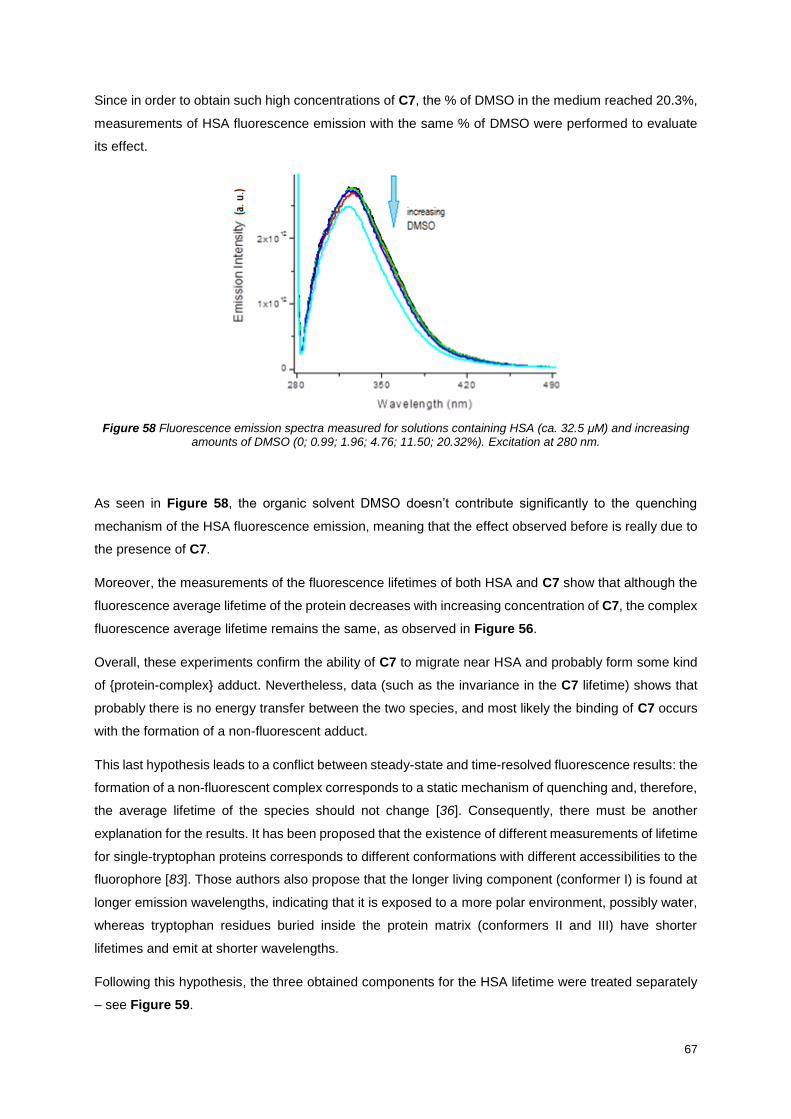
67
Since in order to obtain such high concentrations of C7, the % of DMSO in the medium reached 20.3%,
measurements of HSA fluorescence emission with the same % of DMSO were performed to evaluate
its effect.
Figure 58 Fluorescence emission spectra measured for solutions containing HSA (ca. 32.5 μM) and increasing amounts of DMSO (0; 0.99; 1.96; 4.76; 11.50; 20.32%). Excitation at 280 nm.
As seen in Figure 58, the organic solvent DMSO doesn’t contribute significantly to the quenching
mechanism of the HSA fluorescence emission, meaning that the effect observed before is really due to
the presence of C7.
Moreover, the measurements of the fluorescence lifetimes of both HSA and C7 show that although the
fluorescence average lifetime of the protein decreases with increasing concentration of C7, the complex
fluorescence average lifetime remains the same, as observed in Figure 56.
Overall, these experiments confirm the ability of C7 to migrate near HSA and probably form some kind
of {protein-complex} adduct. Nevertheless, data (such as the invariance in the C7 lifetime) shows that
probably there is no energy transfer between the two species, and most likely the binding of C7 occurs
with the formation of a non-fluorescent adduct.
This last hypothesis leads to a conflict between steady-state and time-resolved fluorescence results: the
formation of a non-fluorescent complex corresponds to a static mechanism of quenching and, therefore,
the average lifetime of the species should not change [36]. Consequently, there must be another
explanation for the results. It has been proposed that the existence of different measurements of lifetime
for single-tryptophan proteins corresponds to different conformations with different accessibilities to the
fluorophore [83]. Those authors also propose that the longer living component (conformer I) is found at
longer emission wavelengths, indicating that it is exposed to a more polar environment, possibly water,
whereas tryptophan residues buried inside the protein matrix (conformers II and III) have shorter
lifetimes and emit at shorter wavelengths.
Following this hypothesis, the three obtained components for the HSA lifetime were treated separately
– see Figure 59.
68
Figure 59 Variation of each component of the HSA fluorescence lifetime (A) and corresponding pre-exponential coefficients (B) with different molar ratios of HSA-C7. ([HSA]= 32 μM, λex= 280 nm, λem= 340 nm).
As seen in Figure 59, the tryptophan fluorescence lifetimes are only little influenced by C7 addition: the
longest lifetime is reduced from 3.42 to 2.95 ns (~14%), meaning that dynamic quenching of
fluorescence plays a minor role at the C7 concentrations dealt with in this study. Therefore, the main
cause of fluorescence quenching is the static quenching of tryptophan fluorescence in the proposed
conformer I (with the longest lifetime), while the contributions of conformers II and III are less affected
[83], as can be seen in Figure 59 (A). This also explains why the pre-exponential coefficients of these
two components show an increasing tendency, which is contrary to the decreasing one shown by the
pre-exponential coefficient associated to τ1 – see Figure 59 (B).
When the Stern-Volmer for time-resolved experiments analysis is applied solely to the longest lifetime
component, a constant of ~2 x 10³ M-1 is obtained, reinforcing the suggestion that static quenching is
the main quenching mechanism observed in this case and that the constants obtained before are in fact
binding constants associated to the formation of {protein-complex} adducts, for in this case the
corresponding static constant (~4x10⁵ M-1) will be a few orders of magnitude above the dynamic one.
Overall, this study shows the importance of performing time-resolved measurements when evaluating
the interaction of complexes with HSA by fluorescence quenching experiments and, specially, the
importance of considering the lifetime components associated with the different accessibilities to the
fluorophore of the protein.

69
Conclusion
In this work, it was possible to synthetize and characterize six Schiff-base ligands, starting from 5-
methyl-1H-pyrazole-3-carbohydrazide and different aldehydes, namely pyridoxal (L1), salicylaldehyde
and derivatives (L2-L4) and 2-hydroxynaphthene-1-carbaldehyde (L5-L6). The ligands were
synthetized by condensation reactions and all of them were fully characterized by a set of analytical
techniques, proving the obtained structures were those intended.
The Cu(II) complexes (C1-C6) were synthetized by stirring methanolic solutions of ligand and
CuCl2.2H2O. The complexes were characterized by elemental analysis, mass spectrometry and EPR
spectroscopy in order to prove their structures. It was always possible to assign a 1:1 relationship
between metal ion and ligand in the complexes, and, as expected for copper complexes, square-based
geometries with dx2-y
2 ground-state were obtained. A Zn(II) complex (C7) was also synthetized with one
of the ligands (L5). In this case, elemental analysis and mass spectrometry have shown a 1:2
relationship between metal ion and ligand, and although there were some difficulties in solubilizing and
characterizing this complex, it was possible to observe changes in the 1H NMR spectrum corroborating
complex formation. Complex C7 was also characterized for its photophysical properties, since it is a
fluorescence emitting compound.
All synthetized complexes showed enough aqueous stability in order to perform biological studies,
namely the evaluation of DNA and HSA binding ability, nuclease activity and cytotoxicity. Their anti-
oxidant potential was evaluated in an assay with DPPH, however, none of them (or the corresponding
ligands) showed relevant anti-oxidant ability.
Although some of the complexes were able to bind ctDNA, none of the synthetized compounds showed
ability to cleave pDNA. The displacement assays performed with thiazole orange showed that
complexes with larger delocalized π-systems, such as C5, C6 or C7, were able to partially intercalate
into DNA in a greater extension than complexes with smaller aromatic systems, thanks to their planarity
and ability to participate in π-π interactions.
It was also possible to prove that larger aromatic systems favour the interaction with HSA, as shown in
the fluorescence quenching experiments with this protein. However, C1 and C2 also showed good
results in this assay, contrary to C3 and C4, which is probably related to the inexistence of an
electronegative element in the orto- position to the coordinated phenolate. With these results, it can be
assumed that albumin can serve as a carrier for these complexes, providing both transport to cellular
targets and protection against clearance routes.
Once again, in the in vitro cancer cell line assays, it was demonstrated the importance of larger
delocalized π-systems. Complexes sharing naphthalene containing ligands (C5-C7) showed better
performances than those with smaller aromatic ligands. It can also be concluded that the effect of the
complexes not only depends on their structure, namely the metal ion and specific features in the auxiliary
ligand, but also on the kind of cancer cells. When these have a more differentiated structure, with a

70
larger amount of receptors on the membrane and cytoplasm, complexes show a better efficiency and
lower IC50 values are obtained.
The photophysical properties of a complex are of extreme importance when evaluating its interaction
with biological molecules, as was demonstrated in the studies conducted with C7 and HSA. The trend
observed in the Stern-Volmer analysis revealed the criticality of performing time-resolved fluorescence
studies when evaluating protein interactions. Even then, discrepancies were found which can only be
explained by assuming different protein conformations that interact differently with the tested
compounds. Complex C7 has proven to be an excellent model to perform a complete study with HSA
and the difficulty in the determination of the interaction mechanism was well documented. Finally, it was
assumed that most probably there is formation of a non-fluorescent {protein-complex} adduct in the
ground-state, which is responsible for the observed fluorescence quenching.
Overall, this work demonstrated once again the ability that Schiff base ligands have to coordinate metal
ions, namely copper and zinc, forming stable complexes suitable for biological studies. It was proven
that larger aromatic delocalized π-systems in such ligands provide more efficient complexes both in the
interaction assays with biomolecules and in the cytotoxic activity. Moreover, the presence of an aromatic
substituent at the pyrazole ring seems to enhance the cytotoxicity against metastatic cancer cells. Thus,
additional studies with ligands that fulfil those criteria are recommended. Further studies are being
carried with the Cu-complexes that showed higher cytotoxicity (C5 and C6) in order to evaluate their
mechanism of action.
71
References
1. Zhou, C.-H.; Zhang, H.-Z.; Cui, S.-F.; Lv, J.-S.; Yan, C.-Y.; Wan, K.; Zhang, Y.-Y.; Zhang, S.-L.;
Cai, G.-X.; Geng, R.-X.; Damu, G. L. V. Recent Developments in Organometallic Supramolecular
Complexes as Anticancer Drugs. In Advances in Anticancer Agents in Medicinal Chemistry;
Prudhomme, M., Ed.; Bentham e-Books, 2013; Chapter 2, Vol. 2, pp 46-129.
2. Khalil, H.; Heulot, M.; Barras, D. Peptides and biocomplexes in anticancer therapy. In New
Generation Bioinorganic Complexes; Jastrab, R., Tylkowski, B., Eds.; Walter de Gruyter GmbH:
Berlin/ Boston, 2016; Chapter 6, pp 143-159.
3. Jones, C. J.; Thornback, J. R. Medicinal Apllications of Coordination Chemistry; RSC Publishing:
London, 2007.
4. Thomas, G. Medicinal Chemistry, 2nd ed.; John Wiley & Sons, Ltd., 2007; pp 403-438.
5. Bruijnincx, P. C. A.; Sadler, P. J. New Trends for Metal Complexes with Anticancer Activity. Curr.
Opin. Chem. Biol. 2008, 12 (2), 197-206.
6. Morais, T. S.; Valente, A.; Tomaz, A. I.; Marques, F.; Garcia, M. H. Tracking antitumor metallodrugs:
promising agents with the Ru(II)- and Fe(II)-cyclopentadienyl scaffolds. Future Med. Chem. 2016,
8 (5), 527-544.
7. Barnes, K. R.; Kutikov, A.; Lippard, S. J. Synthesis, characterization, and cytotoxicity of a series of
estrogen-tethered platinum(IV) complexes. Chem. Biol. 2004, 11, 557-564.
8. Ang, W. H.; Khalaila, I.; Allarcyde, C. S.; Juillerat-Jeanneret, L.; Dyson, P. J. Rational design of
platinum(IV) compounds to overcome glutathione-S-transferase mediated drug resistance. J. Am.
Chem. Soc. 2005, 127, 1382-1383.
9. Feazell, R. P.; Nakayama-Ratchford, N.; Dai, H.; Lippard, S. J. Soluble single-walled carbon
nanotubes as longboats delivery systems for platinum(IV) anticancer drug design. J. Am. Chem.
Soc. 2007, 129, 8438-8439.
10. Côrte-Real, L.; Mendes, F.; Coimbra, J.; Morais, T. S.; Tomaz, A. I.; Valente, A.; Garcia, M. H.;
Santos, I.; Bicho, M.; Marques, F. Anticancer activity of structurally related ruthenium(II)
cyclopentadienyl complexes. J. Biol. Inorg. Chem. 2014, 19, 853-867.
11. Saha, N. C.; Biswas, C.; Ghorai, A.; Ghosh, U.; Seth, S. K.; Kar, T. Synthesis, structural
characterization and cytotoxicity of new iron(III) complexes with pyrazolyl thiosemicarbazones.
Polyhedron 2012, 34, 1-12.
72
12. Urig, S.; Fritz-Wolf, K.; Réau, R.; Herold-Mende, C.; Tóth, K.; Davioud-Charvet, E.; Becker, K.
Undressing of Phosphine Gold(I) Complexes as Irreversible Inhibitors of Human Disulfide
Reductases. Angew. Chem. Int. Ed. 2006, 45, 1881-1886.
13. Wang, Y.; He, Q. Y.; Che, C. M.; Chiu, J. F. Proteomic characterization of the cytotoxic mechanism
of gold(III) porphyrin 1a, a potential anticancer drug. Proteomics 2006, 6, 131-142.
14. Ott, I.; Schmidt, K.; Kirchner, B.; Schumacher, P.; Wiglenda, T.; Gust, R. Antitumor-active cobalt-
alkyne complexes derived from acetylsalicylic acid: Studies on the mode of drug action. J. Med.
Chem. 2005, 48, 622-629.
15. Failes, T. W.; Cullinane, C.; Diakos, C. I.; Yamamoto, N.; Lyons, J. G.; Hambley, T. W. Studies of
a cobalt(III) complex of the MMP inhibitor marimastat: A potential hypoxia-activated prodrug. Chem.
Eur. J. 2007, 13, 2974-2982.
16. Noor, F.; Wustholz, A.; Kinscherf, R.; Metzler-Nolte, N. A cobaltocenium-peptide bioconjugate
shows enhanced cellular uptake and directed nuclear delivery. Angew. Chem. Int. Ed. 2005, 44,
2429-2432.
17. Basu, U.; Pant, I.; Khan, I.; Hussain, A.; Kondaiah, P.; Chakravarty, A. R. Iron(III) Catecholates for
Cellular Imaging and Photocytotoxicity in Red Light. Chem. Asian J. 2014, 9, 2494-2504.
18. Tan, S. J.; Yan, Y. K.; Lee, P. P. F.; Lim, K. H. Copper, gold and silver compounds as potential new
anti-tumor metallodrugs. Future Med. Chem. 2010, 2 (10), 1591-1608.
19. Marzano, C.; Pellei, M.; Tisato, F.; Santini, C. Copper Complexes as Anticancer Agents. Anticancer
Agents Med. Chem. 2009, 9, 185-211.
20. Francisco, A. I.; Vargas, M. D.; Fragoso, T. P.; Carneiro, J. W.; Casellato, A.; Silva, F. d. C.;
Ferreira, V. F.; Barbosa, J. P.; Pessoa, C.; Costa-Lotufo, L. V.; Martinho Filho, J. D. B.; de Moraes,
M. O.; Mangrich, A. S. Theoretical Studies of the Tautomerism in 3-(2-R-Phenylhydrazono)-
naphthalene-1,2,4-triones: Synthesis of Copper(II) Complexes and Studies of Antibacterial and
Antitumor Activities. J. Braz. Chem. Soc. 2010, 21 (7), 1293-1302.
21. Tan, J.; Wang, B.; Zhu, L. DNA binding and oxidative DNA damage induced by a quercetin
copper(II) complex: potential mechanism of its antitumor properties. J. Biol. Inorg. Chem. 2009, 14
(5), 727-739.
22. Liu, Z.-C.; Wang, B.-D.; Li, B.; Wang, Q.; Yang, Z.-Y.; Li, T.-R.; Li, Y. Crystal structures, DNA-
binding and cytotoxic activities studies of Cu(II) complexes with 2-oxo-quinoline-3-carbaldehyde
Schiff-bases. Eur. J. Med. Chem. 2010, 45, 5353-5361.
73
23. Rayner-Canham, G. Descriptive Inorganic Chemistry; W. H. Freeman and Company: New York,
1996.
24. Jiang, Q.; Zhu, J.; Zhang, Y.; Xiao, N.; Guo, Z. DNA binding property, nuclease activity and
cytotoxicity of Zn(II) complexes of terpyridine derivatives. Biometals 2009, 22, 297-305.
25. Liu, J.-Y.; Lo, P.-C.; Jiang, X.-J.; Fong, W.-P.; Ng, D. K. P. Synthesis and in vitro photodynamic
activities of di-α-substituted zinc(II) phthalocyanine derivatives. Dalton Trans. 2009, 21, 4129-4135.
26. Silva, C. M.; Silva, D. L.; Modolo, L. V.; Alves, R. B.; Resende, M. A.; Martins, C. V. B.; de Fátima,
À. Schiff bases: A short review of their antimicrobial activities. J. Adv. Res. 2011, 2, 1-8.
27. Manikandan, R.; Vijayan, P.; Anitha, P.; Prakash, G.; Viswanathamurthi, P.; Butcher, R. J.;
Velmurugan, K.; Nandhakumar, R. Synthesis, structure and in vitro biological activity of pyridoxal
N(4)-substituted thiosemicarbazone cobalt (III) complexes. Inorg. Chim. Acta 2014, 421, 80-90.
28. Mandal, S.; Naskar, B.; Modak, R.; Sikdar, Y.; Chatterjee, S.; Biswas, S.; Mondal, T. K.; Modak,
D.; Goswami, S. Synthesis, crystal structure, spectral study and DFT calculation of three new
copper(II) complexes derived from pyridoxal hydrochloride, N,N-dimethylethylenediamine and N,N-
diethylethylenediamine. J. Mol. Struct. 2015, 1088, 38-49.
29. Clayden, J.; Greeves, N.; Warren, S.; Wothers, P. Organic Chemistry, 1st ed.; Oxford University
Press: Oxford, 2001.
30. Dias, L. R. S.; Salvador, R. R. S. Pyrazole Carbohydrazide Derivatives of Pharmaceutical Interest.
Pharmaceuticals 2012, 5, 317-324.
31. Kuçukguzel, S. G.; Senkardes, S. Recent advances in bioactive pyrazoles. Eur. J. Med. Chem.
2015, 97, 786-815.
32. Keter, F. K.; Darkwa, J. Perspective: the potential of pyrazole-based compounds in medicine.
Biometals 2012, 25, 9-21.
33. Xia, Y.; Fan, C.-D.; Zhao, B.-X.; Zhao, J.; Shin, D.-S.; Miao, J.-Y. Synthesis and structure-activity
relationships of novel 1-arylmethyl-3-aryl-1H-pyrazole-5-carbohydrazide hydrazone derivatives as
potential agents against A549 lung cancer cells. Eur. J. Med. Chem. 2008, 43, 2347-2353.
34. Sirajuddin, M.; Ali, S.; Badshah, A. Drug-DNA interactions and their study by UV-Visible,
fluorescence spectroscopies and cyclic voltametry. J. Photochem. Photobiol. B, Biol. 2013, 124, 1-
19.
35. Algar, W. R.; Massey, M.; Krull, U. J. Fluorescence Resonance Energy Transfer and Complex
Formation Between Thiazole Orange and Various Dye-DNA Conjugates: Implications in Signaling
Nuclei Acid Hybridization. J. Fluoresc. 2006, 16, 555-567.

74
36. Lakowicz, W. R. Principles of Fluorescence Spectroscopy, 3rd ed.; Springer, 2006.
37. Coutinho, A.; Prieto, M. Ribonuclease T1 and Alcohol Dehydrogenase Fluorescence Quenching
by Acrylamide. J. Chem. Educ. 1993, 70 (5), 425-428.
38. Marquês, J. T.; de Almeida, R. F. M. Application of Ratiometric Measurements and Microplate
Fluorimetry to Protein Denaturation: An Experiment for Analytical and Biochemistry Students. J.
Chem. Educ. 2013, 90, 1522-1527.
39. Valeur, B.; Berberan-Santos, M. N. Molecular Fluorescence: Principles and Applications, 2nd ed.;
Wiley, VHC, 2012; p 592.
40. Mukherjee, T.; Pessoa, J. C.; Kumar, A.; Sarkar, A. R. Synthesis, structure, magnetic properties
and biological activity of supramolecular copper(II) and nickel(II) complexes with a Schiff base
ligand derived from vitamin B6. Dalton Trans. 2013, 42, 2594-2607.
41. Nygren, J.; Svanvik, N.; Kubista, M. The Interactions Between the Fluorescent Dye Thiazole
Orange and DNA. Biopolymers 1998, 46, 39-51.
42. Colmenarejo, G. In silico Prediction of Drug-Binding Strengths to Human Serum Albumin. Med.
Res. Rev. 2003, 23, 275-301.
43. Tabassum, S.; Al-Asbahy, W. M.; Afzal, M.; Arjmand, F. Synthesis, characterization and interaction
studies of copper based drug with Human Serum Albumin (HSA): Spectroscopic and molecular
docking investigations. J. Photochem. Photobiol. B, Biol. 2012, 114, 132-139.
44. Dӧmӧtӧr, O.; Tuccinardi, T.; Karcz, D.; Walsh, M.; Creaven, B. S.; Enyedy, É. A. Interaction of
anticancer reduced Schiff base coumarin derivatives with human serum albumin investigated by
fluorescence quenching and molecular modeling. Bioorg. Chem. 2014, 52, 16-23.
45. Tabassum, S.; Ahmad, M.; Afzal, M.; Zaki, M.; Bharadwaj, P. K. Synthesis and structure elucidation
of a copper(II) Schiff-base complex: In vitro DNA binding, pBR322 plasmid cleavage and HSA
binding studies. J. Photochem. Photobiol. B, Biol. 2014, 140, 321-331.
46. Matos, C. P.; Valente, A.; Marques, F.; Adão, P.; Robalo, M. P.; Almeida, R. F. M.; Pessoa, J. C.;
Santos, I.; Garcia, M. H.; Tomaz, A. I. New polydentate Ru(III)-Salan complexes: synthesis,
characterization, anti-tumour activity and interaction with human serum proteins. Inorg. Chim. Acta
2013, 394, 616-626.
47. Mukherjee, T.; Pessoa, J. C.; Kumar, A.; Sarkar, A. R. Formation of an unusual pyridoxal derivative:
Characterization of Cu(II), Ni(II) and Zn(II) complexes and evaluation of binding to DNA and to
human serum albumin. Inorg. Chim. Acta 2015, 426, 150-159.

75
48. Fisher, M. B.; Thompson, S. J.; Ribeiro, V.; Lechner, M. C.; Rettie, A. E. P450-Catalyzed In-Chain
Desaturation of Valproic Acid: Isoform Selectivity and Mechanism of Formation of Δ3-Valproic Acid
Generated by Baculovirus-Expressed CYP3A1. Arch. Biochem. Biophys. 1998, 356 (1), 63-70.
49. Butenko, N.; Tomaz, A. I.; Nouri, O.; Escribano, E.; Moreno, V.; Gama, S.; Ribeiro, V.; Telo, J. P.;
Pessoa, J. C.; Cavaco, I. DNA cleavage activity of VIVO(acac)2 and derivatives. J. Inorg. Biochem.
2009, 103, 622-632.
50. Palomino, J.-C.; Martin, A.; Camacho, M.; Guerra, H.; Swings, J.; Portaels, F. Resazurin Microtiter
Assay Plate: Simple and Inexpensive Method for Detection of Drug Resistance in Mycobacterium
tuberculosis. Antimicrob. Agents Chemother. 2002, 46 (8), 2720-2722.
51. Striker, G.; Subramaniam, V.; Seidel, C. A. M.; Volkmer, A. J. Photochromicity and fluorescence
lifetimes of green fluorescent protein. J. Phys. Chem. B 1999, 103 (40), 8612-8617.
52. Becker, R. S.; de Melo, J. S.; Maçanita, A. L.; Elisei, F. Comprehensive investigation of the solution
photophysics and theoretical aspects of oligothiophenes of 1-7 rings. J. Pure Appl. Chem. 1995,
67 (1), 9-16.
53. Eaton, D. F. Reference Materials for Fluorescence Measurement. Pure Appl. Chem. 1988, 60 (7),
1107-1114.
54. Mandal, T. N.; Roy, S.; Barik, A. K.; Gupta, S.; Butcher, R. J.; Kar, S. K. Synthesis and structural
characterization of copper(II) and vanadium(V) complexes of pyridyl/pyrimidyl-pyrazole derived
Schiff base ligands - Metal specific adjustment of ligand binding mode. Polyhedron 2008, 27, 3267-
3274.
55. Rosu, T.; Pahontu, E.; Reka-Stefana, M.; Ilies, D.-C.; Georgescu, R.; Shova, S.; Gulea, A.
Synthesis, structural and spectral studies of Cu(II) and V(IV) complexes of a novel Schiff base
derived from pyridoxal. Antimicrobial activity. Polyhedron 2012, 31, 352-360.
56. Back, D. F.; de Oliveira, G. M.; Fontana, L. A.; Ramão, B. F.; Roman, D.; Iglesias, B. A. One-pot
synthesis, structural characterization, UV-Vis and electrochemical analyses of new Schiff base
complexes of Fe(III), Ni(II) and Cu(II). J. Mol. Struct. 2015, 1100, 264-271.
57. Ebrahimipour, S. Y.; Sheikhshoaie, I.; Castro, J.; Haase, W.; Mohamadi, M.; Foro, S.;
Sheikhshoaie, M.; Esmaeili-Mahani, S. A novel cationic copper(II) Schiff base complex: Synthesis,
characterization, crystal structure, electrochemical evaluation, anti-cancer activity, and preparation
of its metal oxide nanoparticles. Inorg. Chim. Acta 2015, 430, 245-252.
58. Das, K.; Mandal, T. N.; Roy, S.; Gupta, S.; Barik, A. K.; Mitra, P.; Rheingold, A. L.; Kar, S. K.
Synthesis, characterization, X-ray crystal structures and emission properties of copper(II), zinc(II)

76
and cadmium(II) complexes of pyridyl-pyrazole derived Schiff base ligand - Metal selective ligand
binding modes. Polyhedron 2010, 29, 2892-2899.
59. Leovac, V. M.; Jevtovic, V. S.; Jovanovic, L. S.; Bogdanovic, G. A. Metal complexes with Schiff-
base ligands - pyridoxal and semicarbazide-based derivatives. J. Serb. Chem. Soc. 2005, 70 (3),
393-422.
60. Konar, S.; Jana, A.; Das, K.; Ray, S.; Chatterjee, S.; Golen, J. A.; Rheingold, A. L.; Kar, S. K.
Synthesis, crystal structure, spectroscopic and photoluminescence studies of manganese (II),
cobalt (II), cadmium(II), zinc(II) and copper(II) complexes with a pyrazole derived Schiff base ligand.
Polyhedron 2011, 30, 2801-2808.
61. Atkins, P. W. Physical Chemistry, 5th ed.; Oxford University Press: Oxford, 1994.
62. Gama, S.; Mendes, F.; Marques, F.; Santos, I. C.; Carvalho, M. F.; Correia, I.; Pessoa, J. C.;
Santos, I.; Paulo, A. Copper(II) complexes with tridentate pyrazole-based ligands: synthesis,
characterization, DNA cleavage activity and cytotoxicity. J. Inorg. Biochem. 2011, 105, 637-644.
63. Rockenbauer, A.; Korecz, L. Appl. Magn. Reson. 1996, 10, 29-43.
64. Sreekanth, A.; Kurup, M. R. P. Structural and spectral studies on four coordinate copper(II)
complexes of 2-benzoylpyridine N(4), N(4)-(butane-1,4-diyl)thiosemicarbazone. Polyhedron 2003,
22, 3321-3332.
65. Sakagushi, U.; Addison, A. W. Spectroscopic and redox studies of some copper(II) complexes with
biomimetic donor atoms: implication for protein copper centres. J. Chem. Soc., Dalton Trans. 1979,
600-608.
66. Hasi, Q.-M.; Fan, Y.; Yao, X.-Q.; Hu, D.-C.; Liu, J.-C. Synthesis, characterization, antioxidant and
antimicrobial activities of bidentate Schiff base ligand and its metal complexes. Polyhedron 2016,
109, 75-80.
67. Sharma, O. P.; Bhat, T. K. DPPH antioxidant assay revisited. Food Chem. 2009, 113, 1202-1205.
68. Schaich, K. M.; Tian, X.; Xie, J. Reprint of "Hurdles and pitfalls in measuring antioxidant efficacy:
A critical evaluation of ABTS, DPPH, and ORAC assays". J. Funct. Foods 2015, 18, 782-796.
69. Correia, I.; Roy, S.; Matos, C. P.; Borovic, S.; Butenko, N.; Cavaco, I.; Marques, F.; Lorenzo, J.;
Rodríguez, A.; Moreno, V.; Pessoa, J. C. Vanadium(IV) and copper(II) complexes of
salicylaldimines and aromatic heterocycles: Cytotoxicity, DNA binding and DNA cleavage
properties. J. Inorg. Biochem. 2015, 147, 134-146.
70. Seedher, N.; Agarwal, P. Complexation of fluoroquinolone antibiotics with human serum albumin:
A fluorescence quenching study. J. Lumin. 2010, 130, 1841-1848.
77
71. Inamdar, P. R.; Sheela, A. Spectroscopic investigations on partial intercalative binding behaviour
of terpyridine based copper(II) complexes with DNA. J. Photochem. Photobiol. B, Biol. 2016, 159,
133-141.
72. Sudlow, G.; Birkett, D. J.; Wade, D. N. The Characterization of Two Specific Drug Binding Sites on
Human Serum Albumin. Mol. Pharmacol. 1975, 11 (6), 824-832.
73. Sudlow, G.; Birkett, D. J.; Wade, D. N. Further Characterization of Specific Drug Binding Sites on
Human Serum Albumin. Mol. Pharmacol. 1976, 12 (6), 1052-1061.
74. Xiao, J.; Wei, X.; Wang, Y.; Liu, C. Fluorescence resonance energy-transfer affects the
determination of the affinity between ligand and proteins obtained by fluorescence quenching
method. Spectrochim. Acta A Mol. Biomol. Spectrosc. 2009, 74, 977-982.
75. Kaighn, M. E.; Narayan, K. S.; Ohnuki, Y.; Lechner, J. F.; Jones, L. W. Establishment and
characterization of a human prostatic carcinoma cell line (PC-3). Invest. Urol. 1979, 17 (1), 16-23.
76. Ghosh, A.; Wang, X.; Klein, E.; Heston, W. D. W. Novel role of prostate-specific membrane antigen
in suppressing prostate cancer invasiveness. Cancer Res. 2005, 65 (3), 727-731.
77. Levenson, A. S.; Jordan, V. C. MCF-7: The First Hormone-responsive Breast Cancer Cell Line.
Cancer Res. 1997, 57, 3071-3078.
78. Sheridan, U.; Gallagher, J. F.; Philippidis, A.; McGinley, J. Zinc complexes of pyridyl-tetrazole
derivatives - Highly fluorescent materials. Inorg. Chim. Acta 2015, 432, 50-55.
79. Xia, J.; Zhou, Z.; Li, W.; Zhang, H.-Q.; Redshaw, C.; Sun, W.-H. Synthesis, structure and
fluorescent properties of 2-(1H-benzoimidazol-2-yl)quinolin-8-ol ligands and their zinc complexes.
Inorg. Chim. Acta 2013, 394, 569-575.
80. Dayal, D.; Palanimuthu, D.; Shinde, S. V.; Somasundaram, K.; Samuelson, A. G. A novel zinc
bis(thiosemicarbazone) complex for live cell imaging. J Biol Inorg Chem 2011, 16, 621-632.
81. Fasano, M.; Curry, S.; Terreno, E.; Galliano, M.; Fanali, G.; Narciso, P.; Notari, S.; Ascenzi, P. The
Extraordinary Ligand Binding Properties of Human Serum Albumin. IUBMB Life 2005, 57 (12), 787-
796.
82. Demoro, B.; Almeida, R. F. M.; Marques, F.; Matos, C. P.; Otero, L.; Pessoa, J. C.; Santos, I.;
Rodríguez, A.; Moreno, V.; Lorenzo, J.; Gambino, D.; Tomaz, A. I. Screening organometallic
binuclear thiosemicarbazone ruthenium complexes as potential anti-tumour agents: cytotoxic
activity and human serum albumin binding mechanism. Dalton Trans. 2013, 42, 7131-7146.

78
83. Tardioli, S.; Lammers, I.; Hooijschuur, J.-H.; Ariese, F.; Zwan, G. v. d.; Gooijer, C. Complementary
Fluorescence and Phosphorescence Study of the Interaction of Brompheniramine with Human
Serum Albumin. J. Phys. Chem. B 2012, 116, 7033-7039.


- 1 -
Annex A: X-Ray crystal structure of L3
Table A1: Crystal data and structure refinement for L3.
Empirical formula C13H14N4O3
Formula weight 274.28
Temperature 100(2) K
Wavelength 0.71073 Å
Crystal system Monoclinic
Space group C/c
Unit cell dimensions a = 10.9504(4) Å α= 90°.
b = 10.3636(3) Å β= 98.9312(18)°.
c = 11.4465(3) Å γ = 90°.
Volume 1283.26(7) Å3
Z 4
Density (calculated) 1.420 Mg/m3
Absorption coefficient 0.104 mm-1
F(000) 576
Crystal size 0.28 x 0.12 x 0.12 mm3
Theta range for data collection
3.10 to 26.38°.
Index ranges -13<=h<=13, -12<=k<=12, -14<=l<=14
Reflections collected 13277
Independent reflections 2613 [R(int) = 0.0259]
Completeness to theta = 26.38°
99.8 %
Max. and min. transmission 0.9881 and 0.9717
Refinement method Full-matrix least-squares on F2
Data / restraints / parameters 2613 / 2 / 216
Goodness-of-fit on F2 1.046
Final R indices [I>2sigma(I)] R1 = 0.0279, wR2 = 0.0642
R indices (all data) R1 = 0.0305, wR2 = 0.0661
Absolute structure parameter 0.0(8)
Extinction coefficient 0.0046(6)
Largest diff. peak and hole 0.168 and -0.128 e.Å-3
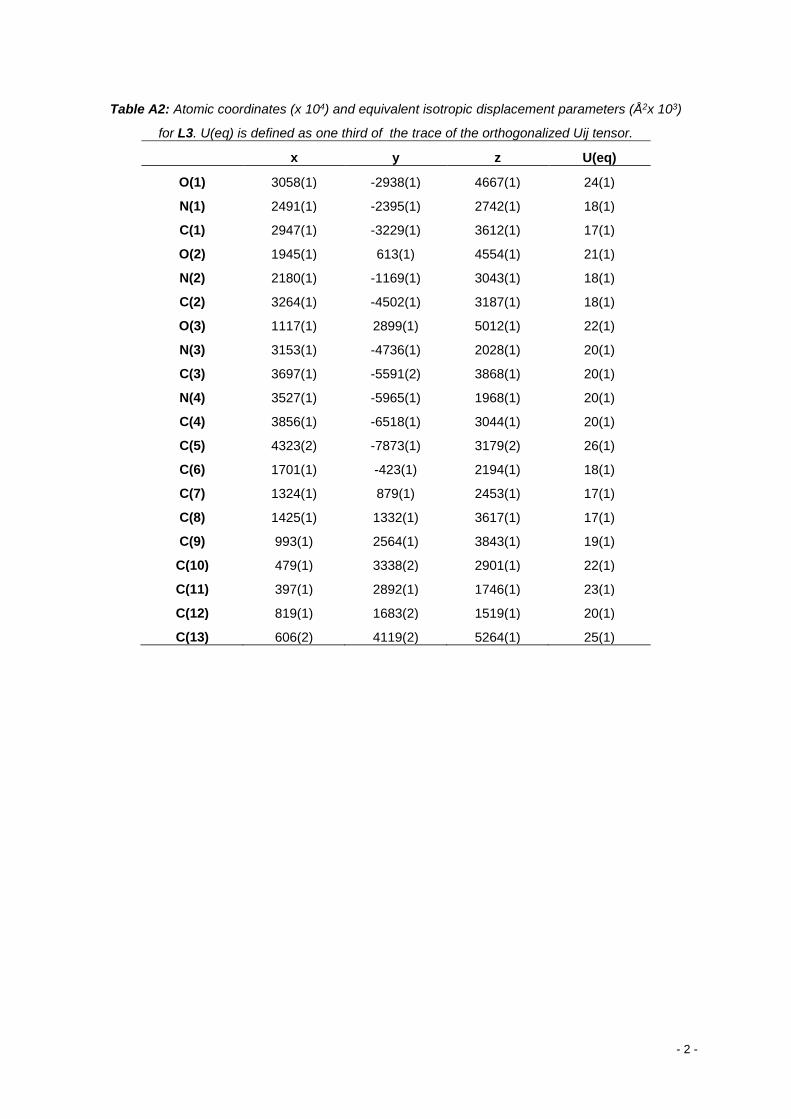
- 2 -
Table A2: Atomic coordinates (x 104) and equivalent isotropic displacement parameters (Å2x 10³)
for L3. U(eq) is defined as one third of the trace of the orthogonalized Uij tensor.
x y z U(eq)
O(1) 3058(1) -2938(1) 4667(1) 24(1)
N(1) 2491(1) -2395(1) 2742(1) 18(1)
C(1) 2947(1) -3229(1) 3612(1) 17(1)
O(2) 1945(1) 613(1) 4554(1) 21(1)
N(2) 2180(1) -1169(1) 3043(1) 18(1)
C(2) 3264(1) -4502(1) 3187(1) 18(1)
O(3) 1117(1) 2899(1) 5012(1) 22(1)
N(3) 3153(1) -4736(1) 2028(1) 20(1)
C(3) 3697(1) -5591(2) 3868(1) 20(1)
N(4) 3527(1) -5965(1) 1968(1) 20(1)
C(4) 3856(1) -6518(1) 3044(1) 20(1)
C(5) 4323(2) -7873(1) 3179(2) 26(1)
C(6) 1701(1) -423(1) 2194(1) 18(1)
C(7) 1324(1) 879(1) 2453(1) 17(1)
C(8) 1425(1) 1332(1) 3617(1) 17(1)
C(9) 993(1) 2564(1) 3843(1) 19(1)
C(10) 479(1) 3338(2) 2901(1) 22(1)
C(11) 397(1) 2892(1) 1746(1) 23(1)
C(12) 819(1) 1683(2) 1519(1) 20(1)
C(13) 606(2) 4119(2) 5264(1) 25(1)

- 3 -
Table A3: Bond lengths [Å] and angles [°] for L3.
O(1)-C(1) 1.2332(17) N(1)-C(1) 1.3535(19) N(1)-N(2) 1.3735(16) N(1)-H(1N) 0.91(2) C(1)-C(2) 1.4660(19) O(2)-C(8) 1.3572(17) O(2)-H(2O) 0.91(2) N(2)-C(6) 1.2881(18) C(2)-N(3) 1.3361(19) C(2)-C(3) 1.412(2) O(3)-C(9) 1.3693(18) O(3)-C(13) 1.4297(17) N(3)-N(4) 1.3435(18) C(3)-C(4) 1.376(2) C(3)-H(3) 0.97(2) N(4)-C(4) 1.3554(19) N(4)-H(4N) 0.89(2) C(4)-C(5) 1.494(2) C(5)-H(5A) 0.9800 C(5)-H(5B) 0.9800 C(5)-H(5C) 0.9800 C(6)-C(7) 1.455(2) C(6)-H(6) 0.980(19) C(7)-C(12) 1.399(2) C(7)-C(8) 1.4009(19) C(8)-C(9) 1.399(2) C(9)-C(10) 1.391(2) C(10)-C(11) 1.390(2) C(10)-H(10) 0.982(18) C(11)-C(12) 1.374(2) C(11)-H(11) 0.971(18) C(12)-H(12) 0.969(17) C(13)-H(13A) 0.9800 C(13)-H(13B) 0.9800 C(13)-H(13C) 0.9800 C(1)-N(1)-N(2) 118.92(12) C(1)-N(1)-H(1N) 119.3(12) N(2)-N(1)-H(1N) 121.7(12) O(1)-C(1)-N(1) 122.26(13) O(1)-C(1)-C(2) 123.54(13) N(1)-C(1)-C(2) 114.18(12) C(8)-O(2)-H(2O) 109.9(13) C(6)-N(2)-N(1) 117.01(12) N(3)-C(2)-C(3) 111.97(13) N(3)-C(2)-C(1) 120.19(13) C(3)-C(2)-C(1) 127.84(13) C(9)-O(3)-C(13) 116.03(11) C(2)-N(3)-N(4) 103.98(12) C(4)-C(3)-C(2) 104.32(13) C(4)-C(3)-H(3) 126.2(11) C(2)-C(3)-H(3) 129.4(11) N(3)-N(4)-C(4) 113.24(12) N(3)-N(4)-H(4N) 119.2(13) C(4)-N(4)-H(4N) 127.3(13) N(4)-C(4)-C(3) 106.50(13) N(4)-C(4)-C(5) 122.00(13) C(3)-C(4)-C(5) 131.48(14) C(4)-C(5)-H(5A) 109.5
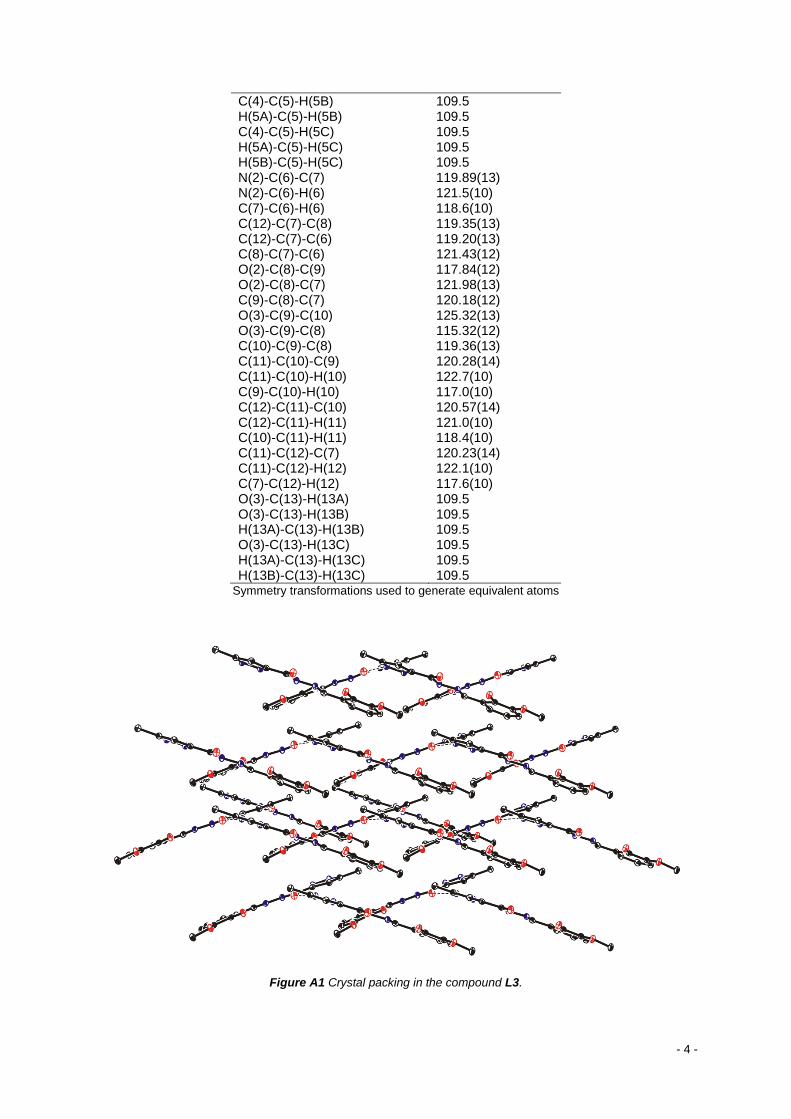
- 4 -
C(4)-C(5)-H(5B) 109.5 H(5A)-C(5)-H(5B) 109.5 C(4)-C(5)-H(5C) 109.5 H(5A)-C(5)-H(5C) 109.5 H(5B)-C(5)-H(5C) 109.5 N(2)-C(6)-C(7) 119.89(13) N(2)-C(6)-H(6) 121.5(10) C(7)-C(6)-H(6) 118.6(10) C(12)-C(7)-C(8) 119.35(13) C(12)-C(7)-C(6) 119.20(13) C(8)-C(7)-C(6) 121.43(12) O(2)-C(8)-C(9) 117.84(12) O(2)-C(8)-C(7) 121.98(13) C(9)-C(8)-C(7) 120.18(12) O(3)-C(9)-C(10) 125.32(13) O(3)-C(9)-C(8) 115.32(12) C(10)-C(9)-C(8) 119.36(13) C(11)-C(10)-C(9) 120.28(14) C(11)-C(10)-H(10) 122.7(10) C(9)-C(10)-H(10) 117.0(10) C(12)-C(11)-C(10) 120.57(14) C(12)-C(11)-H(11) 121.0(10) C(10)-C(11)-H(11) 118.4(10) C(11)-C(12)-C(7) 120.23(14) C(11)-C(12)-H(12) 122.1(10) C(7)-C(12)-H(12) 117.6(10) O(3)-C(13)-H(13A) 109.5 O(3)-C(13)-H(13B) 109.5 H(13A)-C(13)-H(13B) 109.5 O(3)-C(13)-H(13C) 109.5 H(13A)-C(13)-H(13C) 109.5 H(13B)-C(13)-H(13C) 109.5
Symmetry transformations used to generate equivalent atoms
Figure A1 Crystal packing in the compound L3.

- 5 -
Annex B: DNA cleavage activity
As discussed in the main text, the compounds have showed little or no pDNA cleavage activity.
Nevertheless, this annex presents the results that were obtained for the compounds that were not
presented in the main text.
Complex C5 does not exhibit any significant activity at lower concentrations (Figure B1, lanes 4-9),
either in the absence or the presence of MPA (lane 10).
Figure B1 Nuclease activity of C5 in 10 mM PBS. Prepared to be of a 400 μM concentration, the stock solution was diluted 1:4, 1:8, 1:16, 1:40, 1:80 and 1:160. Lanes 1 and 14 are the controls of native pDNA; 2 and 13 are the controls of native pDNA in PBS; 3 and 12 are the controls for linearized DNA; lane 4 is the control of the activating
agent MPA.
Compounds C3 and C4, tested in the same conditions, i.e., in 10 mM PBS and incubated with pDNA for
1 h at 37 ºC, do not show nuclease activity. This is depicted in Figure B2, C3 (lanes 4-6) and C4 (lanes
10-12), which show that even at the 1:2 dilution (lanes 5 and 10) the complexes do not promote pDNA
cleavage. The ligands used in the synthesis of both compounds, L3 (lanes 8 and 9) and L4 (lanes 13
and 14) also do not cleave pDNA.
Figure B2 Nuclease activity of C3 and C4 and corresponding ligands L3 and L4 in 10 mM PBS. Prepared to be of a 400 μM concentration, the stock solution was diluted 1:2 and 1:4. Lanes 1 and 16 are the controls of native
pDNA; 2 is the controls of native pDNA in PBS and 5% DMSO; 3 and 15 are the controls for linearized DNA; lane 7 is the control of MPA.

- 6 -
C2 did not show any nuclease activity (Figure B3, lanes 7-10) even in the presence of MPA (lane 11).
Interestingly, no DNA cleavage activity is observed for CuCl2 that was added for comparison at 50 μM
(lane 6) even in the presence of MPA (lane 5).
Figure B3 Nuclease activity of C2 in 10 mM PBS. Prepared to be of a 400-μM concentration, the stock solution was diluted 1:4, 1:8, 1:16 and 1:40. Lanes 1 and 14 are the controls of native pDNA; 2 and 13 are the controls of native pDNA in PBS and in 5% DMSO, respectively; 3 and 12 are the controls for linearized DNA. Lane 4 is the
control of MPA. CuCl2 (lanes 5 and 6) was added for comparison.
Figure B4 confirms the results observed for complexes C2 (Figure B4) and C7 (Figure 34 at the main
text), as well as shows those obtained for the ligands L2 and L5, which when tested alone do not exhibit
any notable nuclease activity. Addition of MPA did not affect the cleavage of pDNA.
Figure B4 Nuclease activity of C2 and C7 in 10 mM PBS and the corresponding ligands L2 and L5. Prepared to be of a 400-μM concentration, the stock solution was diluted 1:2 and 1:4. Lanes 1 and 16 are the controls of native pDNA; 2 is the controls of native pDNA in PBS and 5% DMSO; 3 and 15 are the controls for linearized
DNA. Lane 7 is the control of MPA.

- 7 -