new businesses started in 2008: tracking jobs and wages ... web viewnew businesses started in 2008:...
TRANSCRIPT
Research BriefCenter for Workforce Research and Information
August 2013
New Businesses Started in 2008: Tracking Jobs and Wages through 2012
New businesses are the focus of recent national research as a primary source of new jobs.1 Prior reports from the Center for Workforce Research and Information document that new Maine businesses created more new jobs during their initial year than existing private businesses. In this report, we revisit businesses that debuted in 2008, tracking employment and wages through 2012 to measure how these new businesses performed over time in order to gain a deeper understanding of job creation and destruction at young firms.
Defining and Identifying New BusinessesNew businesses are defined in this report as those employing covered workers for the first time in 2008. Data are from the Quarterly Census of Employment and Wages (QCEW), a database derived from unemployment insurance tax reports. New businesses are establishments: firms with a single work location or worksites of firms with multiple locations.
Business opening is defined as the start of covered employment. We define business closure as the end of covered employment, as indicated by an end date or—in the absence of an end date—assigned after four consecutive quarters with zero wages. The interval between the start and end of covered employment marks the duration of business survival. For our purposes, the transfer of employment from one business to a succeeding business constitutes continuation of covered employment; new businesses that are succeeded without interruption are counted as surviving with the succeeding employer added to the roster of new businesses, except in cases of acquisition by or merger with a larger firm.
Initial criteria used to identify potential new businesses are first employment in 2008 and private ownership—excluding construction firms, private households and membership organizations. Businesses are further researched for links to pre-existing businesses, for missing or incomplete data, and for successors. The method employed to identify and verify new businesses is detailed in the Appendix.
Scope of Analysis
This analysis uses annual data to describe the group as a whole and sub-groups by industry and location. Where comparison is made to the state, private sector employment and wages are used (excluding construction firms, membership organizations and private household employers). All data in this report are from the Maine Department of Labor’s Center for Workforce Research and Information.
New businesses are counted as business units for the purposes of calculating survival rates and analyzing industry composition. Annual business-unit counts are calculated by counting the number of businesses
1 For a summary of recent research on job creation, see Ron Coan, “The Ghost of Christmas Future,” Journal of Applied Research in Economic Development, C2ER, Volume 10, January 2013 at http://journal.c2er.org/2013/01/the-ghost-of-christmas-future/
Page 1 of 16

Phone (207) 623-7900 TTY Maine Relay 711 FAX (207) 287-2947www.maine.gov/labor/cwri
that were open at any time during the year with the following qualifications. A wage-paying business that closed mid-year is counted as surviving during that year and non-surviving the following year; however, a business with zero wages that closed mid-year is counted as closed for that year.
Annual employment is calculated by averaging monthly employment totals. Annual payroll is the sum of total quarterly wages for the year. Because businesses opened at various points throughout the year, average employment, annual payroll and annual wage data for 2008 do not reflect a full year of operation for all business units. Accordingly, except for the 2008 unit count, other metrics calculated from 2008 data are not comparable to other years. For this reason, changes in employment, wages, and business size over time are calculated using 2009 as the base year. Survival is calculated from 2008.
2008 New Businesses – All Industries
Survival
In 2008, 2,360 new businesses paid wages to covered employees for the first time. During 2009, 2,061 of those businesses (or their successors) remained open, a one-year survival rate of 87 percent. In 2010, the number fell by 365 to 1,696, or 72 percent of the original group. In 2011, 1474 new businesses survived, down 222 units over the year; and in 2012, 1,314 new businesses or their successors remained open, yielding an average survival rate from 2008 to 2012 of 56 percent.
2008 2009 2010 2011 2012
100% 87%72% 62% 56%
2,360 2,061
1,696 1,474
1,314
Surviving Business Units
The largest over-the-year loss occurred between 2009 and 2010, when the survival rate fell by 15 percentage points. The rate of attrition slowed after 2010. The survival rate declined by an additional ten percentage points in 2011 and an additional seven percentage points in 2012.
Employment
During 2008, monthly job totals for new businesses increased from 730 in January to 7,300 in December as businesses opened throughout the year. In 2009, average annual employment was 7,167. The number of jobs fell by 177 between 2009 and 2010. Job losses slowed between 2010 and 2012 and, on average, those that survived added jobs. Average business size increased from fewer than four jobs per unit in 2009 to more than five jobs per unit in 2012.
Page 2 of 16

Phone (207) 623-7900 TTY Maine Relay 711 FAX (207) 287-2947www.maine.gov/labor/cwri
2008 2009 2010 2011 2012
7,167 6,990 6,917 6,901
3.5 4.1
4.7 5.3
While the number of businesses decreased, aggregate employment remained relatively flat, indicating that
surviving businesses grew.
Avg Annual EmploymentAverage Business Size
Payroll and Average Wages
Total payroll paid by new businesses increased by 6 percent between 2009 and 2012. More than half of the increase occurred between 2011 and 2012.
Average annual wages at new businesses increased from $27,216 in 2009 to $29,839 in 2012, an increase of 10 percent. Though the average wage increased at a faster rate, it remained significantly below the private sector average wage of $38,030 in 2012.
Page 3 of 16

Phone (207) 623-7900 TTY Maine Relay 711 FAX (207) 287-2947www.maine.gov/labor/cwri
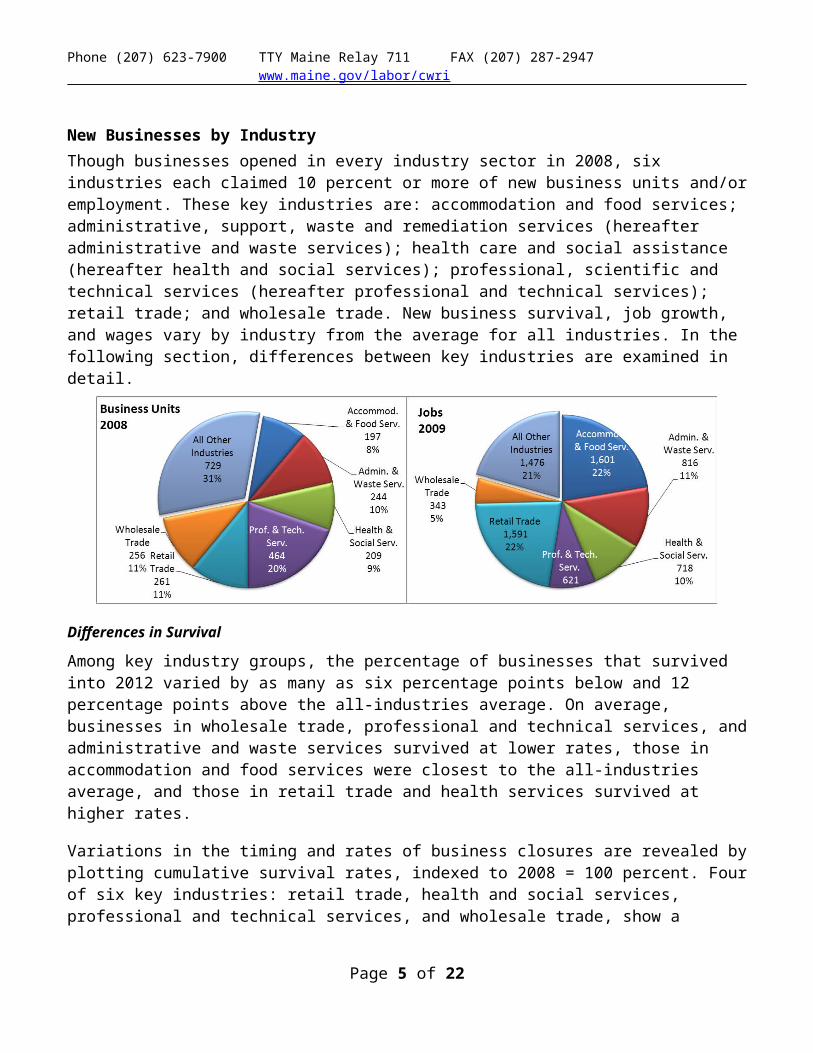
New Businesses by IndustryThough businesses opened in every industry sector in 2008, six industries each claimed 10 percent or more of new business units and/or employment. These key industries are: accommodation and food services; administrative, support, waste and remediation services (hereafter administrative and waste services); health care and social assistance (hereafter health and social services); professional, scientific and technical services (hereafter professional and technical services); retail trade; and wholesale trade. New business survival, job growth, and wages vary by industry from the average for all industries. In the following section, differences between key industries are examined in detail.
Differences in Survival
Among key industry groups, the percentage of businesses that survived into 2012 varied by as many as six percentage points below and 12 percentage points above the all-industries average. On average, businesses in wholesale trade, professional and technical services, and administrative and waste services survived at lower rates, those in accommodation and food services were closest to the all-industries average, and those in retail trade and health services survived at higher rates.
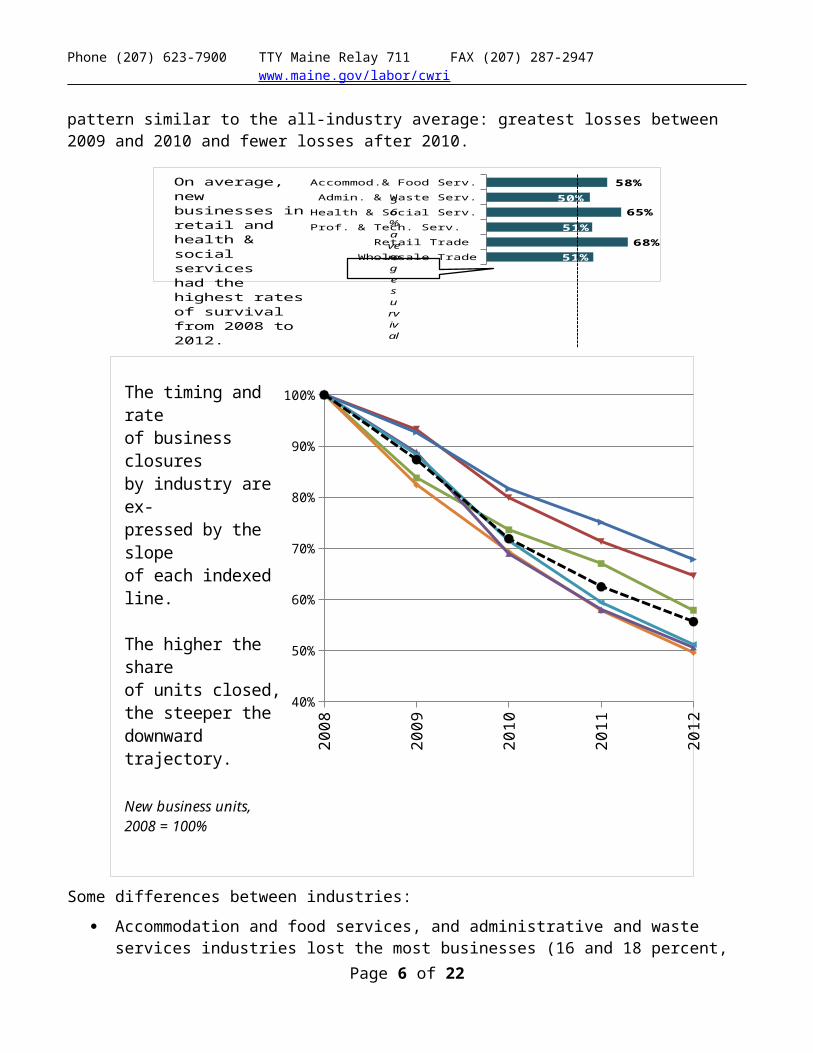
Variations in the timing and rates of business closures are revealed by plotting cumulative survival rates, indexed to 2008 = 100 percent. Four of six key industries: retail trade, health and social services, professional and technical services, and wholesale trade, show a pattern similar to the all-industry average: greatest losses between 2009 and 2010 and fewer losses after 2010.
Wholesale Trade
Retail Trade
Prof. & Tech. Serv.
Health & Social Serv.
Admin. & Waste Serv.
Accommod.& Food Serv.
51%68%
51%
65%50%
58%
56% average survival
On average, new businesses in retail and health & social services had the highest rates of survival from 2008 to 2012.
Page 4 of 16
Phone (207) 623-7900 TTY Maine Relay 711 FAX (207) 287-2947www.maine.gov/labor/cwri
2008
2009
2010
2011
2012
40%
50%
60%
70%
80%
90%
100%The timing and rateof business closures by industry are ex-pressed by the slope of each indexed line.
The higher the share of units closed, the steeper the downward trajectory.
New business units, 2008 = 100%
Some differences between industries:
Accommodation and food services, and administrative and waste services industries lost the most businesses (16 and 18 percent, respectively) during the first year of business, between 2008 and 2009.
After greater losses between 2008 and 2009, business closures in accommodation and food services slowed to below-average rates in 2010 and 2011, yielding an overall survival rate of 58 percent between 2008 and 2012, higher than the average for all industries.
Businesses in administrative and waste services survived at rates consistently below the average rate for all industries.
Businesses in retail trade and health care survived at rates that were consistently higher than the average rate for all industries.
Page 5 of 16
Phone (207) 623-7900 TTY Maine Relay 711 FAX (207) 287-2947www.maine.gov/labor/cwri
Differences in Job Growth and Wages
Accommodation and Food ServicesThe accommodation and food services sector comprises establishments providing customers with lodging and/or prepared meals, snacks, and beverages for immediate consumption. The sector includes both accommodation and food services establishments because the two activities are often combined at the same establishment.
Accommodations & Food Services
New Businesses Industry Avg.
2008 2009 2012 Change Change 2012 Avg
Units 197 114 -42%
Average Employment 1,601 1,524 -5% 3%
Avg. Annual Wage $ 14,048 $ 16,259 16% 7% $ 16,535
Avg. Business Size 9.7 13.4 38% 13.5
New businesses in accommodation and food services lost five percent of jobs between 2009 and 2012, compared to the industry as a whole that added jobs during the period. Average business size, the largest among new businesses, increased from about 10 to 13 jobs per unit, nearly equal to the 2012 industry average. The average annual wage increased by 16 percent to $16,259 in 2012, approaching the industry average wage of $16,535.
Administrative and Waste ServicesThe administrative, support and waste management and remediation services sector comprises establishments performing routine support activities for the day-to-day operations of other
Page 6 of 16

Phone (207) 623-7900 TTY Maine Relay 711 FAX (207) 287-2947www.maine.gov/labor/cwri
organizations, specializing in one or more of support activities that include: office administration, hiring and placing of personnel, document preparation and clerical, solicitation, collection, security and surveillance, cleaning, and waste disposal services.
Administrative & Waste Services
New Businesses Industry Avg.
2008 2009 2012 Change Change 2012 Avg
Units 244 121 -50%
Average Employment 816 628 -23% 8%
Avg. Annual Wage $ 27,446 $ 31,500 15% 5% $ 31,699
Avg. Business Size 4.1 5.2 28% 9.1
Half of new businesses in this industry sector survived to 2012. In total, the number of jobs at new businesses decreased by 23 percent; at the same time, employment in the industry as a whole increased by 8 percent. Businesses that survived grew from an average size of four jobs to five jobs per unit, smaller than the industry average of nine jobs per unit. The average wage increased by 15 percent to $31,500, nearly equal to the industry’s average wage.
Health and Social ServicesThe health and social services sector comprises establishments on a continuum starting with those establishments providing medical care exclusively, continuing with those providing both health and social services, and finally finishing with those providing only social assistance.
Health & Social Services
New Businesses Industry Avg.
2008 2009 2012 Change Change 2012 Avg
Units 209 135 -35%
Average Employment 718 765 7% 1%
Avg. Annual Wage $ 24,528 $ 24,921 2% 5% $ 41,289
Avg. Business Size 3.7 5.7 54% 22.5
New businesses in health and social services survived at above-average rates and added jobs at a rate of 7 percent. Business size increased from nearly four jobs to nearly six jobs per unit, remaining well below the industry average of 22.5. The average annual wage increased by 2 percent between 2009 and 2012, which was slower than the industry average, increasing the wage gap between new businesses and other health and social services businesses.
Page 7 of 16

Phone (207) 623-7900 TTY Maine Relay 711 FAX (207) 287-2947www.maine.gov/labor/cwri
Professional and Technical ServicesThe professional and technical services sector comprises establishments that specialize in activities that require a high degree of expertise and training, providing services to clients in a variety of industries and, in some cases, to households. Services include legal; accounting, bookkeeping, and payroll; architectural, engineering, and specialized design; computer; consulting; research; advertising; photographic; translation and interpretation; and veterinary, among others.
Professional & Technical Services
New Businesses Industry Avg.
2008 2009 2012 Change Change 2012 Avg
Units 464 235 -49%
Average Employment 621 612 -1% 3%
Avg. Annual Wage $ 56,554 $ 62,845 11% 7% $ 58,501
Avg. Business Size 1.5 2.6 73% 4.4
The professional and technical services industry claimed the largest bloc of new businesses, 464 units or one fifth of units that opened in 2008. These new businesses tended to be very small. Fifty-one percent survived to 2012, while employment remained nearly constant. Surviving businesses grew from an average of 1.5 jobs per unit in 2009 to 2.6 jobs per unit in 2012. The average annual wage increased by 11 percent, surpassing the 2012 industry average of $58,501.
Retail TradeThe retail trade sector comprises establishments engaged in retailing merchandise and rendering services incidental to the sale of merchandise; the sector includes non-store retailers.
Retail TradeNew Businesses Industry Avg.
2008 2009 2012 Change Change 2012 Avg
Units 261 177 -32%
Average Employment 1,591 1,629 2% -1%
Avg. Annual Wage $ 18,826 $ 20,318 8% 2% $ 24,421
Avg. Business Size 6.6 9.2 40% 12.9
New retail businesses survived at above-average rates and added jobs between 2009 and 2012, one of just two key industries to do so. New retailers tended to be larger than the average new business, with nearly seven jobs per unit in 2009. From 2009 to 2012, average business size increased to about nine jobs per unit, closer to the industry average of nearly 13 jobs per retail establishment. A 2 percent gain in employment compared favorably to the retail industry as a whole, which declined slightly over the
Page 8 of 16

Phone (207) 623-7900 TTY Maine Relay 711 FAX (207) 287-2947www.maine.gov/labor/cwri
period. The average annual wage at new retailers grew faster than the industry wage between 2009 and 2012 but remained below the industry average of $24,421.
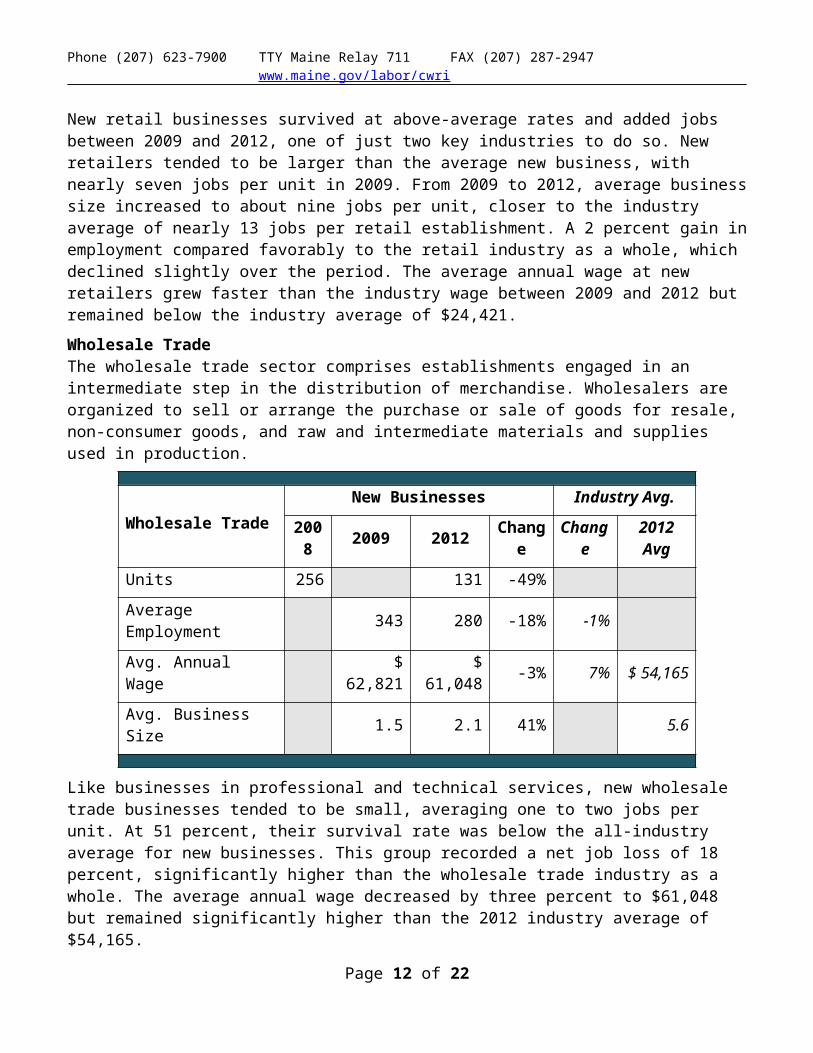
Wholesale TradeThe wholesale trade sector comprises establishments engaged in an intermediate step in the distribution of merchandise. Wholesalers are organized to sell or arrange the purchase or sale of goods for resale, non-consumer goods, and raw and intermediate materials and supplies used in production.
Wholesale TradeNew Businesses Industry Avg.
2008 2009 2012 Change Change 2012 Avg
Units 256 131 -49%
Average Employment 343 280 -18% -1%
Avg. Annual Wage $ 62,821 $ 61,048 -3% 7% $ 54,165
Avg. Business Size 1.5 2.1 41% 5.6
Like businesses in professional and technical services, new wholesale trade businesses tended to be small, averaging one to two jobs per unit. At 51 percent, their survival rate was below the all-industry average for new businesses. This group recorded a net job loss of 18 percent, significantly higher than the wholesale trade industry as a whole. The average annual wage decreased by three percent to $61,048 but remained significantly higher than the 2012 industry average of $54,165.
Page 9 of 16

Phone (207) 623-7900 TTY Maine Relay 711 FAX (207) 287-2947www.maine.gov/labor/cwri
Comparison of Average Annual Wages
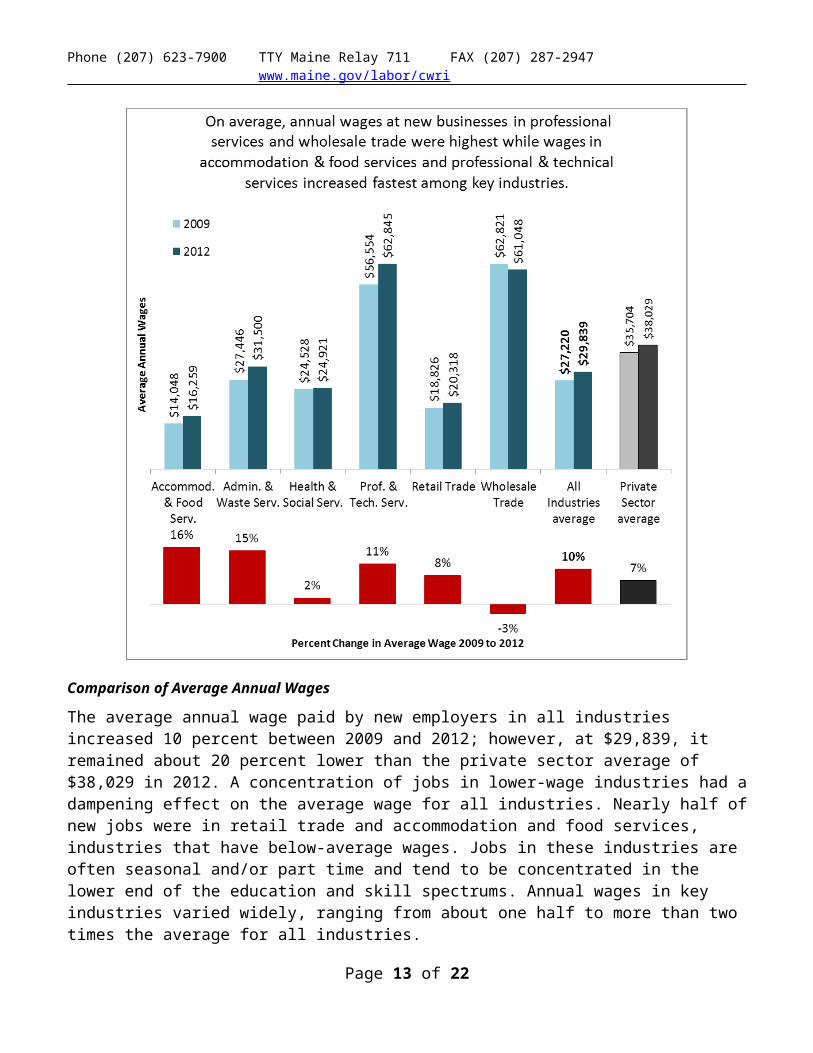
The average annual wage paid by new employers in all industries increased 10 percent between 2009 and 2012; however, at $29,839, it remained about 20 percent lower than the private sector average of $38,029 in 2012. A concentration of jobs in lower-wage industries had a dampening effect on the average wage for all industries. Nearly half of new jobs were in retail trade and accommodation and food services, industries that have below-average wages. Jobs in these industries are often seasonal and/or part time and tend to be concentrated in the lower end of the education and skill spectrums. Annual wages in key industries varied widely, ranging from about one half to more than two times the average for all industries.
Other Industries of Note
Sixty percent of new businesses in trade, transportation and warehousing (55 of 92) survived from 2008 to 2012, adding 51 jobs between 2009 and 2012, a gain of 33 percent. These businesses doubled in
Page 10 of 16

Phone (207) 623-7900 TTY Maine Relay 711 FAX (207) 287-2947www.maine.gov/labor/cwri
average size from nearly two to nearly four jobs per unit, and the average annual wage increased 4 percent to $35,108 in 2012.
In manufacturing, 40 of 70 new businesses survived, adding net 31 jobs between 2009 and 2012, a growth rate of 12 percent. Average business size increased from four to about seven jobs per unit, and the average wage increased by 66 percent to $39,293 between 2009 and 2012.
Geographical DistributionMaine’s three metropolitan statistical areas (MSAs) surround the cities of Portland/South Portland, Lewiston/Auburn and Bangor. The MSAs are population, commercial, and service centers, while the regions outside the MSAs (the balance of state) encompass most of the state’s coastline and all of its interior lakes, mountains, and forests.
In 2008, about 44 percent of private businesses and 53 percent of private sector wage and salary jobs were located in MSAs. The distribution of new businesses and jobs was similar to the private sector as a whole: 45 percent of new business units opened in MSAs, and, in 2009, jobs were evenly distributed between locations in MSAs and in the balance of state (BOS).
Between 2008 and 2012, differences in new business survival and net job growth reflect an ongoing concentration of employment in the MSAs. New businesses in MSAs survived at higher rates than those in the balance of state. In addition, new businesses in MSAs recorded a net job gain between 2009 and 2012, offsetting a net job loss in the balance of state.
Geographical Differences in Key Industries
In most key industries, survival rates were several points higher in MSAs than in the balance of state. In accommodation and food services, the variance was most pronounced: two thirds of those located in MSAs survived, compared to one half of those in the balance of state. Health and social services was the only key industry in which the survival rate was higher outside MSAs (68%) than in MSAs (62%).
Page 11 of 16
Mai
neM
SAs
BOS
2009
2009
2012
2012
BOS50%MSAs
50%
BOS47%MSAs
53%
Share of jobs
Phone (207) 623-7900 TTY Maine Relay 711 FAX (207) 287-2947www.maine.gov/labor/cwri
While variations in survival were relatively small, job gains or losses by industry varied more widely by location. In MSAs, job gains were concentrated in health and social services and in professional and technical services; these businesses saw net job growth of 26 and 27 percent, respectively. In the balance of state, net job losses occurred in all key industries except retail trade, with the largest losses concentrated in administrative and waste services and professional and technical services.
Impact on Maine’s Private SectorThe following table shows jobs and payroll of new businesses and the private sector (excluding construction, membership organizations and private households) from 2007 through 2012. These years include the the Great Recession (December 2007 to June 2009). In Maine, the effects of the recession were not widely experienced until late 2008 when job losses at existing businesses began to mount; net job losses preceded a decline in annual payroll.
Page 12 of 16
Phone (207) 623-7900 TTY Maine Relay 711 FAX (207) 287-2947www.maine.gov/labor/cwri
2007 2008 2009 2010 2011 2012 2007 2008 2009 2010 2011 2012New Businesses 4.4 7.2 7.0 6.9 6.9 120.7 195.0 197.6 199.6 205.9 Other Private 464.9 461.8 443.5 440.4 443.0 446.5 15,980.4 16,430.2 15,893.7 16,163.6 16,608.0 17,037.4
Total Private 464.9 466.1 450.6 447.4 449.9 453.4 15,980.4 16,550.9 16,088.8 16,361.2 16,807.6 17,243.3
2007-08 2008-09 2009-10 2010-11 2011-12 2007-08 2008-09 2009-10 2010-11 2011-124.4 2.8 (0.2) (0.1) (0.0) 120.7 74.4 2.5 2.0 6.3
(3.2) (18.3) (3.1) 2.6 3.5 449.8 (536.5) 269.9 444.4 429.4
1.2 (15.5) (3.2) 2.5 3.5 570.5 (462.1) 272.4 446.4 435.7
2007-08 2008-09 2009-10 2010-11 2011-12 2007-08 2008-09 2009-10 2010-11 2011-1263% -2% -1% 0% 62% 1% 1% 3%
-1% -4% -1% 1% 1% 3% -3% 2% 3% 3%
0% -3% -1% 1% 1% 4% -3% 2% 3% 3%
Percent Change Percent Change
Private Jobs (in thousands) Annual Payroll (in Million $$)
Net change Net change
New Businesses
Other Private
Total Private
New Businesses
Other Private
Total Private
In 2008, a gain of 4,400 jobs at new businesses offset a loss of 3,200 jobs at existing businesses, resulting in a net gain of 1,200 private sector jobs. Wages added by new businesses comprised one fifth of the total increase in private payroll in 2008, a disproportionately large contribution.
In 2009, new businesses added 2,800 jobs and $74 million in payroll during a year when the private sector as a whole shed 15,500 jobs and $462 in payroll. Between 2010 and 2012, new businesses lagged behind the private sector in job retention and creation, with higher losses in 2010 and slower growth in 2011 and 2012. Growth in payroll also fell behind the private sector as a whole.
Overall, the greatest impact on Maine’s private sector occurred during 2008 and 2009, when newly created jobs offset losses at other private businesses and tempered over-the-year losses by a percentage point. From 2010 through 2012, the net impact of new business employment and wages on total private sector was negligible.
Summary of FindingsData from the initial four years of employment for businesses started in 2008 indicate decreasing rates of attrition over time; the longer a business survived the greater likelihood of continued survival. Surviving businesses added jobs and increased wages at higher rates than the private sector as a whole, yet after four years new businesses in most industries had fewer jobs per unit and paid lower wages than the average private sector business.
Distribution of business units and employment by industry remained little changed between 2008 and 2012. The largest shares of jobs were created in two industries: accommodation and food services and retail trade. These businesses were comparatively large, they paid the lowest wages among key industries, and they survived from 2008 to 2012 at an above average rate.
In contrast, new businesses in professional and technical services and in wholesale trade were more numerous with fewer jobs per unit; they paid the highest wages among key industries. These businesses survived at a below-average rate.
New businesses in health and social services recorded the highest job-growth rate and a relatively high survival rate. The average wage changed little between 2009 and 2012 and remained below the all-industries average for new businesses and significantly below the industry average.
Page 13 of 16

Phone (207) 623-7900 TTY Maine Relay 711 FAX (207) 287-2947www.maine.gov/labor/cwri
New businesses in Maine’s metropolitan statistical areas survived at comparatively high rates and showed a net increase in jobs. New businesses outside the metropolitan areas were less likely to survive and recorded a net job loss. The disparity between regions is likely related to greater seasonality of local economies outside MSAs which are more dependent on resource- and tourism-based commerce.
The data support the characterization of new businesses as like a wave on the shore2, delivering an initial surge of new jobs and wages accompanied by high levels of churn – job creation and destruction. Net growth and its effect on the larger economy ebb as one year’s “wave” is succeeded by another. After this cohort of new businesses in 2008, subsequent cohorts debuted: in 2009, 2,143 new businesses, in 2010, 2,316 new businesses, each group buoying the private sector with an infusion of new jobs and wages.
2 See Dane Stangler and Robert E. Litan, “Where Will the Jobs Come From?,” Kauffman Foundation, November 2009, at http://www.kauffman.org/uploadedFiles/where_will_the_jobs_come_from.pdf
Page 14 of 16

Phone (207) 623-7900 TTY Maine Relay 711 FAX (207) 287-2947www.maine.gov/labor/cwri
Appendix Data Source Data for this project are extracted from the Quarterly Census of Employment and Wages (QCEW), a cooperative program between state workforce agencies and the U.S. Bureau of Labor Statistics (BLS). Data are derived from state unemployment insurance (UI) tax reports of quarterly employer contributions. Additional data are collected directly from employers. Each employer record specifies industry designation, ownership, location, and links to other employers by using wage records. When a new QCEW record can be linked by wage records or other means to a pre-existing account it is not considered to be a new business.
QCEW employment data are limited to those workers covered by the state unemployment insurance (UI) laws. BLS estimates that covered workers account for about 97 percent of total non-farm employment nationwide. QCEW, therefore, provides a comprehensive and detailed record of employment, against which other workforce programs are benchmarked. In Maine, QCEW contains nearly 50,000 records of worksites with covered employees.
In most cases, the start and end dates of the QCEW record serve as proxies for the open and close of business. For these businesses, the interval between start and end dates marks the duration of survival; a business is counted as surviving until an end date is assigned and its record is closed in QCEW.
The reports that are the basis for QCEW data are primarily used for unemployment insurance tax purposes. In some instances, dates applied for tax purposes are poor proxies for start and end of business. The end of tax liability may extend well beyond the end of employment activity; end dates are sometimes applied retroactively upon resolution of tax-related issues, or en masse to close a group of old non-reporting accounts. To the extent possible, weaknesses or inconsistencies in the data are identified and addressed during data preparation and individual record review.
Preparing Data for Analysis The initial extract of QCEW records employs the following criteria:
Private ownership. This study examines only private sector businesses.
Excluded industries. Private households, membership organizations, and construction firms are excluded.
Start date in 2008.
No predecessor link. Records that indicate continuity of employment from a prior or existing business are excluded. For example, a satellite location staffed by existing employees would not be counted but if a new location represents an expansion with additional staffing, the new worksite would be counted.
These criteria produce a list of potential new businesses then subject to individual record review. Each record is screened for positive business activity in the target year and for predecessors not previously identified. The latter involves a search of the database for links by name, location, and wage records. If
Page 15 of 16

Phone (207) 623-7900 TTY Maine Relay 711 FAX (207) 287-2947www.maine.gov/labor/cwri
no predecessor is found, employer validation is attempted for a sample of businesses, but not required for inclusion in the data set if other criteria are met.
The records are further reviewed for missing, incomplete or inconsistent data. Accounts showing an end of liability date during the study period are researched for links to successor businesses showing a continuation of employment and business activity. Successors to new businesses are added to the data set, except in the case of some mergers and acquisition (see below). Other anomalies in the data include:
Reopened Businesses. Closed and then reopened businesses are contacted for evaluation. Continuation of business activity , and the nature and duration of a gap in covered employment are factors considered when evaluating the status of a reopened business.
Businesses Reporting Zero Employment and Wages. A number of businesses retain an open account but report zero employment and wages. The share of these zero reporters increased from 6 percent of surviving businesses in 2009 to 14 percent of survivors in 2012. Some of these businesses were intermittent or seasonal employers, while others had ceased employing workers for an extended period. In order to retain intermittent employers in the data set but exclude those who had stopped employing workers, the following protocol was developed.
Accounts with more than four consecutive quarters with zero employment are counted as closed in the fifth quarter of non-employment. This protocol reduced the share of businesses reporting zero wages to between 2 and 3 percent per year between 2009 and 2012.
Mergers and Acquisitions. A small number of new businesses merged with or were acquired by larger pre-existing businesses. If employment and wages are reported separately (as a worksite, for example), the transfer is counted as a succession and the new entity added to the data set. If the new business is subsumed, for purposes of this analysis the business is counted as surviving, but employment and wages are not counted after the merger or acquisition.
These administrative data are subject to change and revision by the unemployment tax unit and by QCEW analysts as better information is received. A challenge in the use of these data for longitudinal study is the need to review and update past quarters in addition to adding new quarters of employment and wages as they become available.
Page 16 of 16