new (and exciting!) developments in linux tracing
TRANSCRIPT

<Insert Picture Here>
New (and Exciting!) Developments in Linux TracingElena Zannoni ([email protected])Linux Engineering, Oracle America
Linuxcon Japan 2015
2 LinuxCon Japan 2015
Overview
• BPF• eBPF• eBPF main concepts and elements• eBPF usage workflow• eBPF and tracing example• eBPF and Perf integration• Other newsworthy activities in tracing
3 LinuxCon Japan 2015
BPF and eBPF
• Infrastructure that is not just for tracing• Introduced as Berkeley Packet Filters in kernel 2.1.75, in 1997• Augmented to eBPF (extended BPF)• Initial proposal for eBPF was in 2013, by Alexei Starovoitov
https://lkml.org/lkml/2013/12/2/1066• eBPF is officially part of the kernel since 3.15• BPF is now referred to as Classic BPF or cBPF
4 LinuxCon Japan 2015
Classic BPF (Berkeley Packet Filters)
• Originally created as a way to analyze and filter network packets for network monitoring purposes
• Goal: accept packets you are interested in or discard them• How: Userspace attaches a filter to a socket. Example: tcpdump • Assembly-like instruction set used to test for conditions to accept
or discard a packet• Result is Boolean• Execution of BPF programs is done by the kernel BPF virtual
machine
• Idea comes from BSD, 1993. Original article, a good read: http://www.tcpdump.org/papers/bpf-usenix93.pdf
5 LinuxCon Japan 2015
BPF Usage Case
• BPF programs are associated to a socket through the setsockopt() systemcall
• Example:
ret_status = setsockopt (socket, SOL_SOCKET,
SO_ATTACH_FILTER, &bpf, sizeof(bpf));• bpf is a “struct sock_fprog” defined in <linux/filter.h> • Options: SO_ATTACH_FILTER, SO_DETACH_FILTER,
SO_LOCK_FILTER

6 LinuxCon Japan 2015
BPF Bytecode
• Simple instruction set and registers• 2 32-bit registers• ~30 instructions (store, load, arithmetic, branch, return, transfer)• ~10 addressing modes• 16 32-bit registers (as scratch memory)• Programs essentially evaluate to a boolean value (such as keep or
discard the packet)
7 LinuxCon Japan 2015
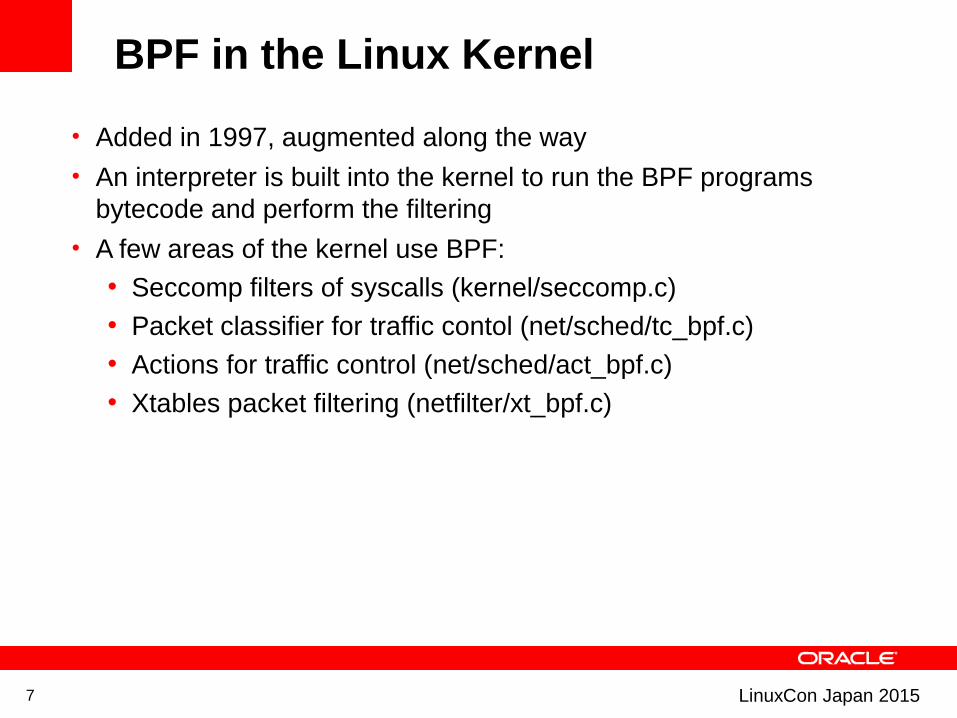
BPF in the Linux Kernel
• Added in 1997, augmented along the way• An interpreter is built into the kernel to run the BPF programs
bytecode and perform the filtering• A few areas of the kernel use BPF:
• Seccomp filters of syscalls (kernel/seccomp.c)• Packet classifier for traffic contol (net/sched/tc_bpf.c)• Actions for traffic control (net/sched/act_bpf.c)• Xtables packet filtering (netfilter/xt_bpf.c)

8 LinuxCon Japan 2015
BPF JIT Compiler
• Added to kernel to speed up the execution of BPF programs• In 2011, by Eric Dumazet• Initially only for x86_64 architecture• Enabled with:
• echo 1>/proc/sys/net/core/bpf_jit_enable• Invoked automatically• Simple, with almost direct mapping to x86_64 registers and
instructions• See article: https://lwn.net/Articles/437981/
9 LinuxCon Japan 2015
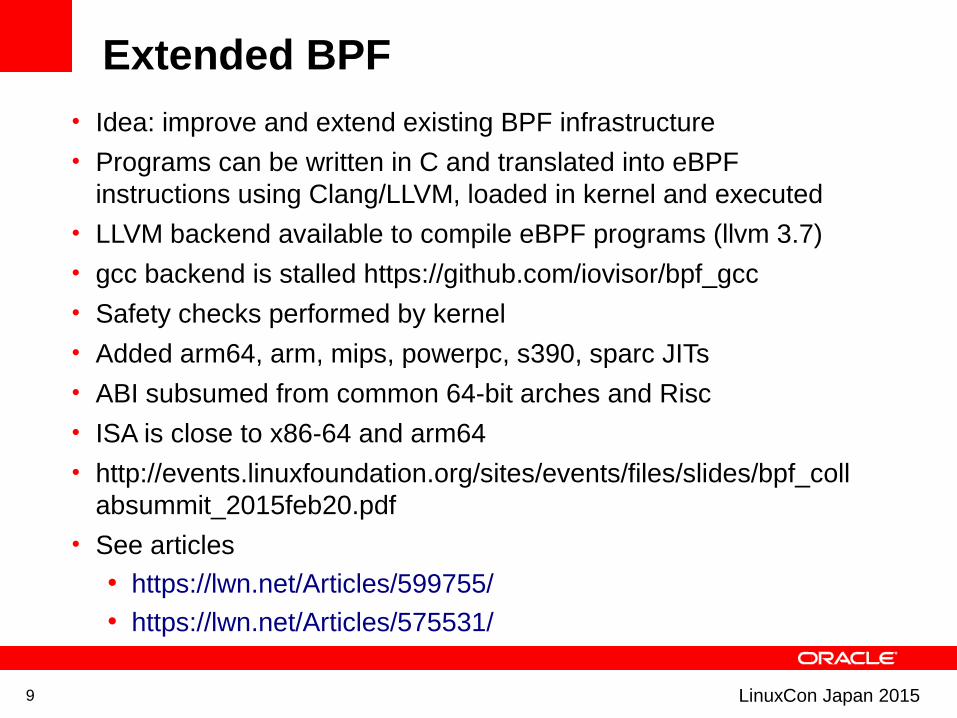
Extended BPF• Idea: improve and extend existing BPF infrastructure
• Programs can be written in C and translated into eBPF instructions using Clang/LLVM, loaded in kernel and executed
• LLVM backend available to compile eBPF programs (llvm 3.7) • gcc backend is stalled https://github.com/iovisor/bpf_gcc• Safety checks performed by kernel• Added arm64, arm, mips, powerpc, s390, sparc JITs• ABI subsumed from common 64-bit arches and Risc• ISA is close to x86-64 and arm64• http://events.linuxfoundation.org/sites/events/files/slides/bpf_coll
absummit_2015feb20.pdf• See articles
• https://lwn.net/Articles/599755/• https://lwn.net/Articles/575531/

10 LinuxCon Japan 2015
How eBPF is Different from Classic BPF• 10 64-bit registers• New call function: bpf_call for calling helper kernel functions
from eBPF programs • ABI: calling convention:
• R0: return value (also exit value of eBPF program)• R1-R5: arguments • R6-R9: callee saved registers • R10: read-only frame pointer
• ~90 instructions implemented• Instructions operate on 64-bit operands • BPF programs are transparently translated into eBPF• Execution on 32-bit architectures cannot use JIT
11 LinuxCon Japan 2015
eBPF Concepts
12 LinuxCon Japan 2015
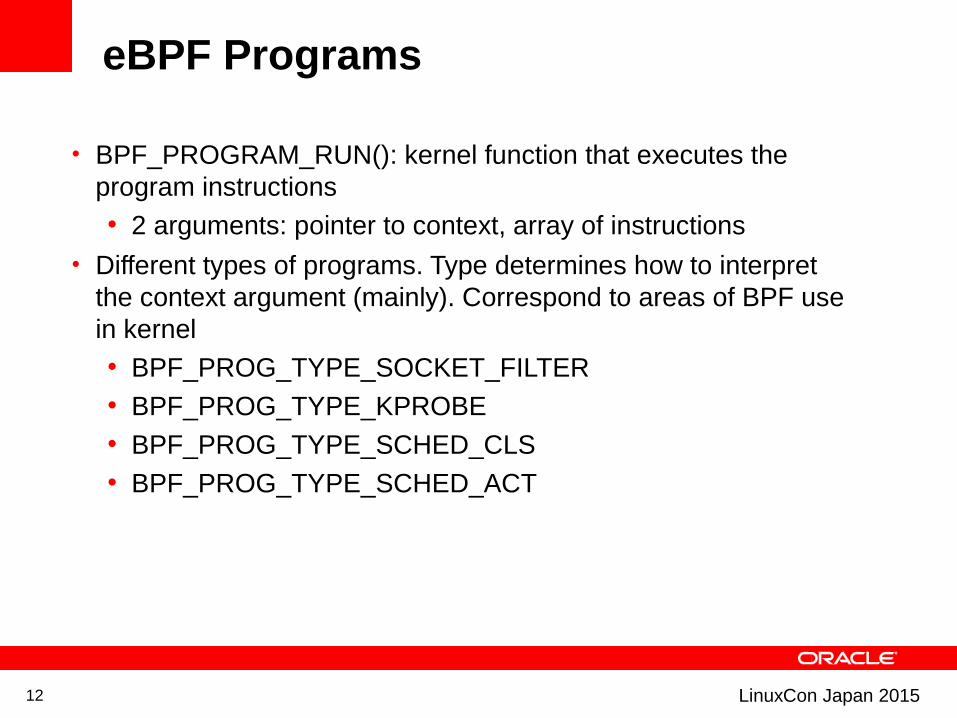
eBPF Programs
• BPF_PROGRAM_RUN(): kernel function that executes the program instructions
• 2 arguments: pointer to context, array of instructions
• Different types of programs. Type determines how to interpret the context argument (mainly). Correspond to areas of BPF use in kernel
• BPF_PROG_TYPE_SOCKET_FILTER
• BPF_PROG_TYPE_KPROBE
• BPF_PROG_TYPE_SCHED_CLS
• BPF_PROG_TYPE_SCHED_ACT

13 LinuxCon Japan 2015
Context
• Each eBPF program is run within a context (ctx argument)• Context is stored at start of program into R6 (callee saved)• Context may be used when calling helper functions, as their first
argument in R1 (convention)• Context provides data on which the BPF program operate:
• Tracing: it is the register set• Networking filters: it is the socket buffer
14 LinuxCon Japan 2015
eBPF Helper Functions
• Functions that can be called by an eBPF program by selecting on a field of the call instruction
• Function must be known: enum bpf_func_id values in include/uapi/linux/bpf.h
• Verifier uses info about each function to check safety of eBPF calls• Signature:
• u64 bpf_helper_function (u64 r1, u64 r2, u64 r3, u64 r4, u64 r5)

15 LinuxCon Japan 2015
ePBF Defined Helper Functions
• bpf_map_lookup_elem
• bpf_map_update_elem
• bpf_map_delete_elem
• bpf_get_prandom_u32
• bpf_get_smp_processor_id
• Plus additional ones defined by subsystems using eBPF
• Tracing• bpf_probe_read• bpf_trace_printk• bpf_ktime_get_ns
• Networking• bpf_skb_store_bytes• bpf_l3_csum_replace• bpf_l4_csum_replace
16 LinuxCon Japan 2015
eBPF Safety
• Max 4096 instructions per program• Stage 1 reject program if:
• Loops and cyclic flow structure• Unreachable instructions• Bad jumps
• Stage 2 Static code analyzer: • Evaluate each path/instruction while keeping track of regs
and stack states • Arguments validity in calls

17 LinuxCon Japan 2015
Examples of Safety Checks/Errors• BPF program is too complex
• Rn is invalid :invalid reg number
• Rn !read_ok :cannot read source op from register
• frame pointer is read only : cannot write into reg
• invalid access to map value, value_size=%d off=%d size=%d
• invalid bpf_context access off=%d size=%d
• invalid stack off=%d size=%d
• BPF_XADD uses reserved fields
• unsupported arg_type %d
• bpf verifier is misconfigured
• jump out of range from insn %d to %d
• back-edge from insn %d to %d
• unreachable insn %d
• BPF program is too large. Processed %d insn
• [….]
18 LinuxCon Japan 2015
eBPF Maps• Generic memory allocated• Transfer data from userspace to kernel and vice versa• Share data among many eBPF programs• A map is identified by a file descriptor returned by a bpf() system
call that creates the map • Attributes: max elements, size of key, size of value• Types of maps: BPF_MAP_TYPE_ARRAY,
BPF_MAP_TYPE_HASH• User level programs create maps via bpf() system call • Maps operations (only specific ones allowed):
• by user level programs (via bpf() syscall) or • by kernel eBPF programs via helper functions (which match
the bpf() semantic)• To close a map, call close() on the descriptor

19 LinuxCon Japan 2015
bpf() System Call
• Single system call to operate both on maps and BPF programs• Different types of arguments and behavior depending on the
type of call determined by flag argument:• BPF_PROG_LOAD: verify and load a BPF program• BPF_MAP_CREATE: creates a new map• BPF_MAP_LOOKUP_ELEM: find element by key, return
value• BPF_MAP_UPDATE_ELEM: find element by key, change
value• BPF_MAP_DELETE_ELEM: find element by key, delete it• BPF_MAP_GET_NEXT_KEY: find element by key, return key
of next element• Man page being written: https://lwn.net/Articles/646058/
20 LinuxCon Japan 2015
Connecting the Dots.......Usage Flows Examples
21 LinuxCon Japan 2015
Generic Usage Flow (to date....)
• Goal: from userspace program, load and run the bpf program, via the bpf() syscall
• NOTE: Only example code exists to base this on....might change in the future
• BPF program can be specified in two ways:
• Method 1: Write it directly using the eBPF language as an array of instructions, and pass that to the bpf() syscall (all done in userspace program)
• Method 2:• Write it using C, in a .c file. Use compiler directive in .c file to emit a
section (will contain the program) with a specific name. Compile (with LLVM) into a .o file
• The .o (Elf) file is then parsed by userspace program to find the section, the BPF instructions in it are passed to the bpf() syscall
• Cleanup/end: userspace program closes the fd corresponding to the bpf program
22 LinuxCon Japan 2015
Usage Flow with Maps (to date...)
• If maps are used, they must be created by the userspace program and they must be associated with the BPF program.
• How?
• In same .c file used to specify the BPF program, use compiler directive to emit section called “maps” in the .o program.
• “maps” section contains map specification (type of map, size of element, size of key, max number of elements)
• “maps” section can contain multiple maps (easily parsed since all maps specifications are same size)
• In userspace program, parse .o file, to find “maps” section
• For each map listed in the section, create a new map, using bpf() systemcall
• Then.....
23 LinuxCon Japan 2015
Associating Maps to a BPF Program
• ….One missing piece of the puzzle: how does the running eBPF program know where the map to operate on is?
• Remember:
• A map is a file descriptor (returned by bpf() system call)
• Maps operations in eBPF done via calls to helper functions exclusively, with “map fd” in IMM field of bpf_call instruction
• Maps operations in .c kernel eBPF program have address of map structure which is in its own “maps” section.
• Ultimately you want the fd of the map in call instruction field of the eBPF program, prior to execution
• So process relocation of program, by walking the instructions and inserting the fd of the map in the proper field of calls to helper functions
24 LinuxCon Japan 2015
Elf Section Naming
• Names used for the BPF program sections, must follow convention:• “kprobes/<event name>”• “kretprobes/<event name>”• “socket<name>”• “maps”: map structures (not actual maps!)• “license”: whether the BPF program is GPL• “version”: kernel version
• Important because type of BPF program (see earlier slide) is determined by the section names
25 LinuxCon Japan 2015
There are Some Good News...
• … this is fairly complex... however...• A lot of the workflow is already collected into a generic
userspace program, bpf_load.c and bpflib.c in the sample/bpf kernel directory.
• Takes care of parsing the Elf file, creating and handling maps, adding the probe event, loading the BPF program, associating the program to the event (for tracing), etc
• Of course this is still a bit of a work in progress • This is only an example...
26 LinuxCon Japan 2015
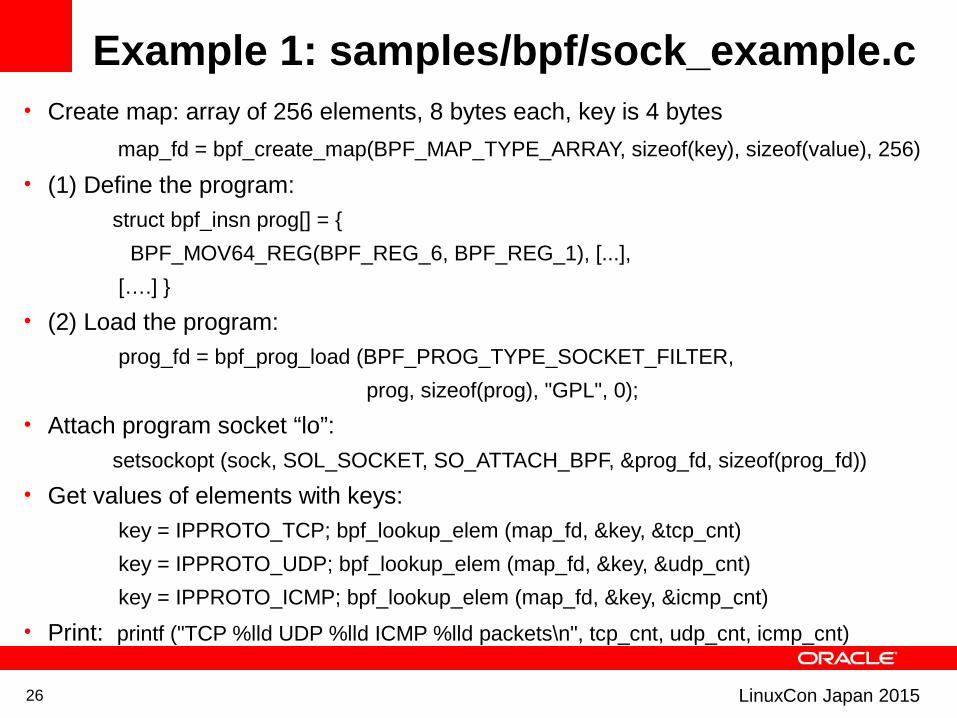
Example 1: samples/bpf/sock_example.c• Create map: array of 256 elements, 8 bytes each, key is 4 bytes
map_fd = bpf_create_map(BPF_MAP_TYPE_ARRAY, sizeof(key), sizeof(value), 256)
• (1) Define the program:
struct bpf_insn prog[] = {
BPF_MOV64_REG(BPF_REG_6, BPF_REG_1), [...],
[….] }
• (2) Load the program:
prog_fd = bpf_prog_load (BPF_PROG_TYPE_SOCKET_FILTER,
prog, sizeof(prog), "GPL", 0);
• Attach program socket “lo”:
setsockopt (sock, SOL_SOCKET, SO_ATTACH_BPF, &prog_fd, sizeof(prog_fd))
• Get values of elements with keys:
key = IPPROTO_TCP; bpf_lookup_elem (map_fd, &key, &tcp_cnt)
key = IPPROTO_UDP; bpf_lookup_elem (map_fd, &key, &udp_cnt)
key = IPPROTO_ICMP; bpf_lookup_elem (map_fd, &key, &icmp_cnt)
• Print: printf ("TCP %lld UDP %lld ICMP %lld packets\n", tcp_cnt, udp_cnt, icmp_cnt)
27 LinuxCon Japan 2015
Example 2: samples/bpf/sockex1_user.c
• Almost same as example 1, but w/o defining the program itself and without defining the map
• Does: load_bpf_file (filename) instead of (1) and (2) in previous example
• filename is the Elf .o file we talked about earlier
• Rest is the same, open socket, attach program to socket, read map and print number of packets of each type
• How is the eBPF program specified? How is the map specified? Use separate file with special sections
• Note: overall eBPF program is slightly different from previous example: counts bytes for each protocol as opposed to number of packets
28 LinuxCon Japan 2015
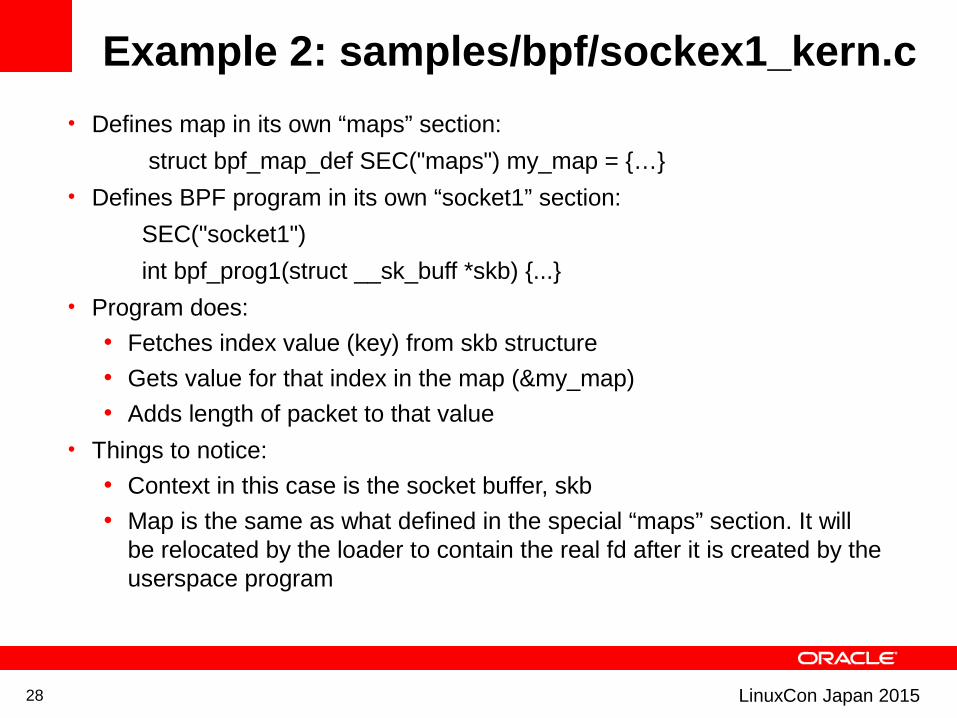
Example 2: samples/bpf/sockex1_kern.c
• Defines map in its own “maps” section:
struct bpf_map_def SEC("maps") my_map = {…}
• Defines BPF program in its own “socket1” section:
SEC("socket1")
int bpf_prog1(struct __sk_buff *skb) {...}
• Program does:
• Fetches index value (key) from skb structure
• Gets value for that index in the map (&my_map)
• Adds length of packet to that value
• Things to notice:
• Context in this case is the socket buffer, skb
• Map is the same as what defined in the special “maps” section. It will be relocated by the loader to contain the real fd after it is created by the userspace program
29 LinuxCon Japan 2015
eBPF and Tracing
30 LinuxCon Japan 2015
kprobes and eBPF
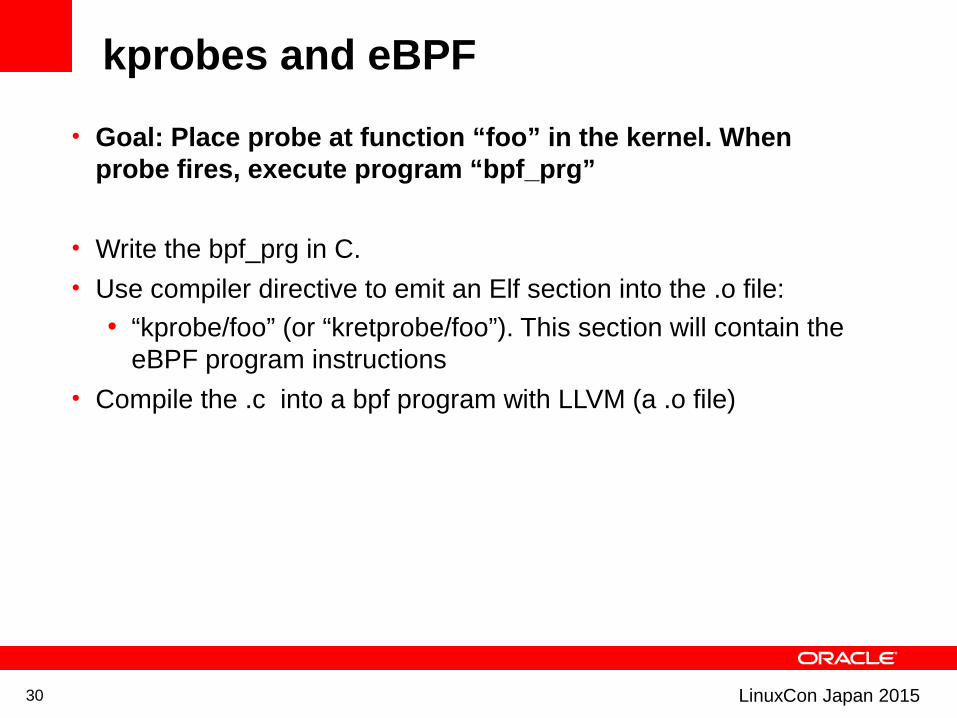
• Goal: Place probe at function “foo” in the kernel. When probe fires, execute program “bpf_prg”
• Write the bpf_prg in C. • Use compiler directive to emit an Elf section into the .o file:
• “kprobe/foo” (or “kretprobe/foo”). This section will contain the eBPF program instructions
• Compile the .c into a bpf program with LLVM (a .o file)
31 LinuxCon Japan 2015
Kprobes and eBPF - continued
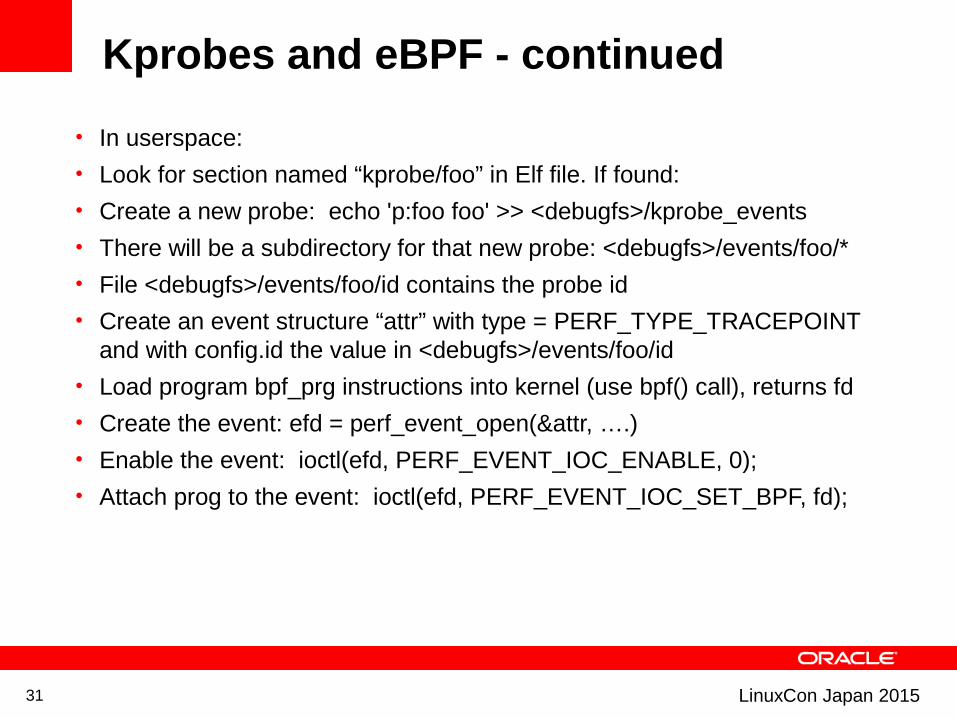
• In userspace:
• Look for section named “kprobe/foo” in Elf file. If found:
• Create a new probe: echo 'p:foo foo' >> <debugfs>/kprobe_events
• There will be a subdirectory for that new probe: <debugfs>/events/foo/*
• File <debugfs>/events/foo/id contains the probe id
• Create an event structure “attr” with type = PERF_TYPE_TRACEPOINT and with config.id the value in <debugfs>/events/foo/id
• Load program bpf_prg instructions into kernel (use bpf() call), returns fd
• Create the event: efd = perf_event_open(&attr, ….)
• Enable the event: ioctl(efd, PERF_EVENT_IOC_ENABLE, 0);
• Attach prog to the event: ioctl(efd, PERF_EVENT_IOC_SET_BPF, fd);

32 LinuxCon Japan 2015
Kernel Changes in Tracing for eBPF
• Ioctl command added to associate bpf progam to kprobe event PERF_EVENT_IOC_SET_BPF
• Added a field to tp_event field of the perf_event structure: tp_event->prog
• tp_event is a structure defining what to do when the event happens
• This is set by the ioctl value above• Here it means: call trace_call_bpf(prog, pt_regs)• Which in turns calls BPF_PROG_RUN(prog, pt_regs /*ctx*/) with
pt_regs as the context (see earlier slides)
33 LinuxCon Japan 2015
Retrieving Data
• How to retrieve data collected during tracing • Can read the <debugfs>/trace_pipe file from userspace as
normal• Can read memory bpf_probe_read• Can retrieve registers values (they are the ctx)• Can read from maps
34 LinuxCon Japan 2015
eBPF and Perf Integration
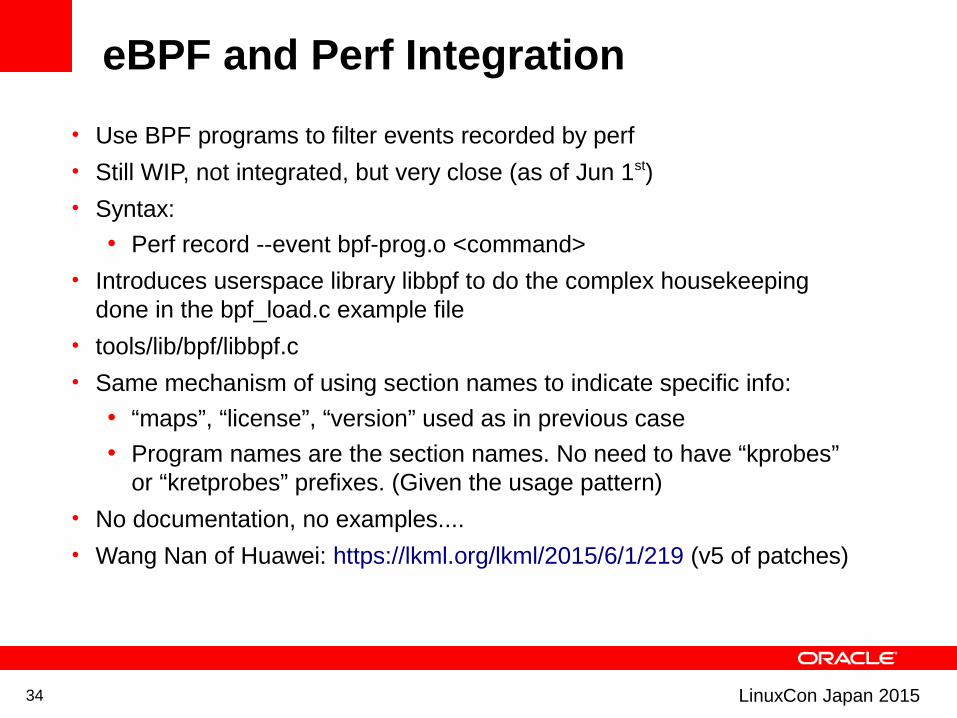
• Use BPF programs to filter events recorded by perf
• Still WIP, not integrated, but very close (as of Jun 1st)
• Syntax:
• Perf record --event bpf-prog.o <command>
• Introduces userspace library libbpf to do the complex housekeeping done in the bpf_load.c example file
• tools/lib/bpf/libbpf.c
• Same mechanism of using section names to indicate specific info:
• “maps”, “license”, “version” used as in previous case
• Program names are the section names. No need to have “kprobes” or “kretprobes” prefixes. (Given the usage pattern)
• No documentation, no examples....
• Wang Nan of Huawei: https://lkml.org/lkml/2015/6/1/219 (v5 of patches)
35 LinuxCon Japan 2015
Other Newsworthy Activities

36 LinuxCon Japan 2015
Ktap, end of story? • In kernel tracer by Jovi Zhangwei of Huawei
• Project started in 2013
• Hosted on https://github.com/ktap/ktap.git
• http://www.ktap.org/doc/tutorial.html
• Presentation: http://events.linuxfoundation.org/sites/events/files/lcjpcojp13_zhangwei.pdf
• In kernel interpreter
• Scripting language is based on Lua
• Targeted to embedded community
• Virtual machine in kernel
• Architectures supported: x86, x86-64, powerpc, arm
• Was merged in 3.13 staging tree, then pulled
• Development stopped
• Last public statement (dec 2014): http://comments.gmane.org/gmane.comp.linux.ktap/377

37 LinuxCon Japan 2015
New tracefs File System• Added in 4.1, by Steve Rostedt• Used by ftrace• Instead of debugfs (usually /sys/kernel/debug/tracing), tracing
has now its own file system, under /sys/kernel/tracing• To be compatible with old systems, it is also mounted under
debugfs• New include file /include/linux/tracefs.h• Ftrace and perf use it• No changes in functionality• See articles:
• https://lwn.net/Articles/632519/ (perf support)• https://lwn.net/Articles/630526/ (kernel patch)
38 LinuxCon Japan 2015
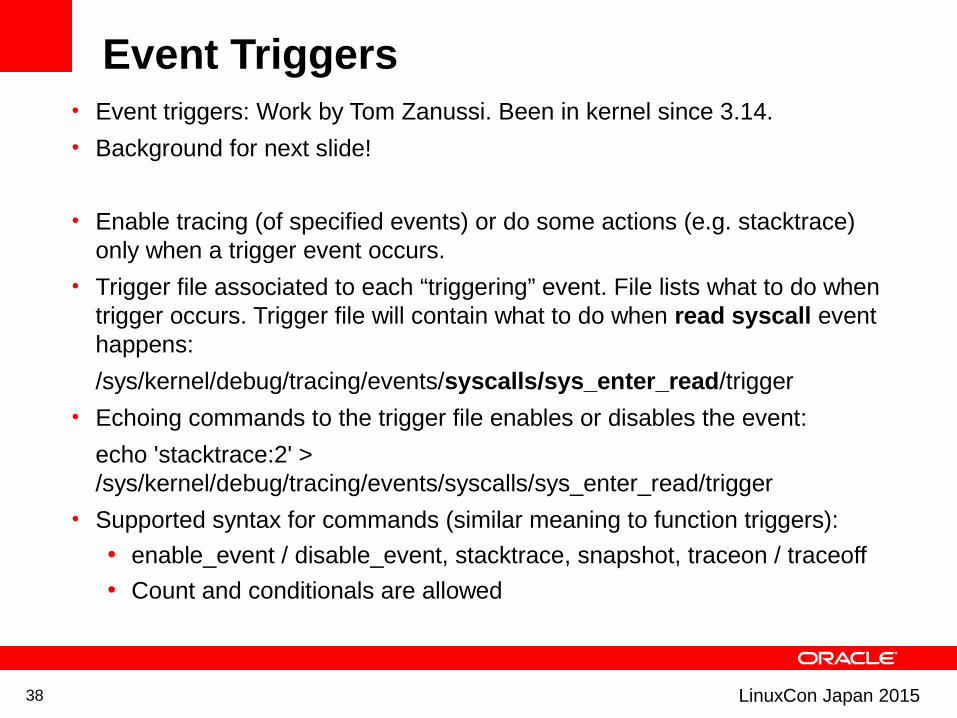
Event Triggers• Event triggers: Work by Tom Zanussi. Been in kernel since 3.14.
• Background for next slide!
• Enable tracing (of specified events) or do some actions (e.g. stacktrace) only when a trigger event occurs.
• Trigger file associated to each “triggering” event. File lists what to do when trigger occurs. Trigger file will contain what to do when read syscall event happens:
/sys/kernel/debug/tracing/events/syscalls/sys_enter_read/trigger
• Echoing commands to the trigger file enables or disables the event:
echo 'stacktrace:2' > /sys/kernel/debug/tracing/events/syscalls/sys_enter_read/trigger
• Supported syntax for commands (similar meaning to function triggers):
• enable_event / disable_event, stacktrace, snapshot, traceon / traceoff
• Count and conditionals are allowed
39 LinuxCon Japan 2015
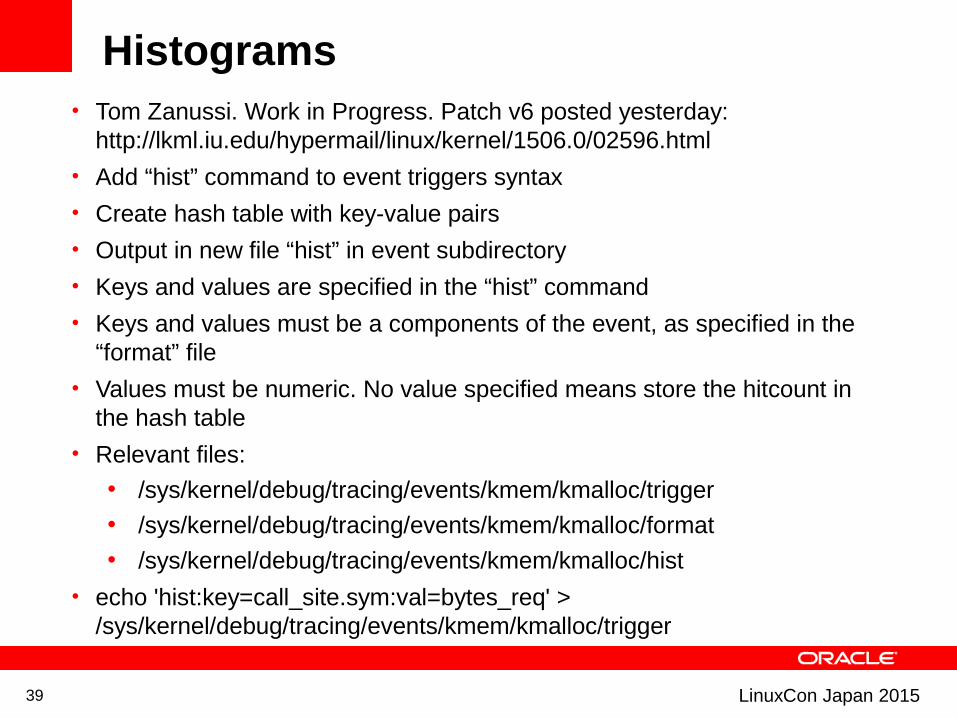
Histograms• Tom Zanussi. Work in Progress. Patch v6 posted yesterday:
http://lkml.iu.edu/hypermail/linux/kernel/1506.0/02596.html
• Add “hist” command to event triggers syntax
• Create hash table with key-value pairs
• Output in new file “hist” in event subdirectory
• Keys and values are specified in the “hist” command
• Keys and values must be a components of the event, as specified in the “format” file
• Values must be numeric. No value specified means store the hitcount in the hash table
• Relevant files:
• /sys/kernel/debug/tracing/events/kmem/kmalloc/trigger
• /sys/kernel/debug/tracing/events/kmem/kmalloc/format
• /sys/kernel/debug/tracing/events/kmem/kmalloc/hist
• echo 'hist:key=call_site.sym:val=bytes_req' > /sys/kernel/debug/tracing/events/kmem/kmalloc/trigger
•
40 LinuxCon Japan 2015
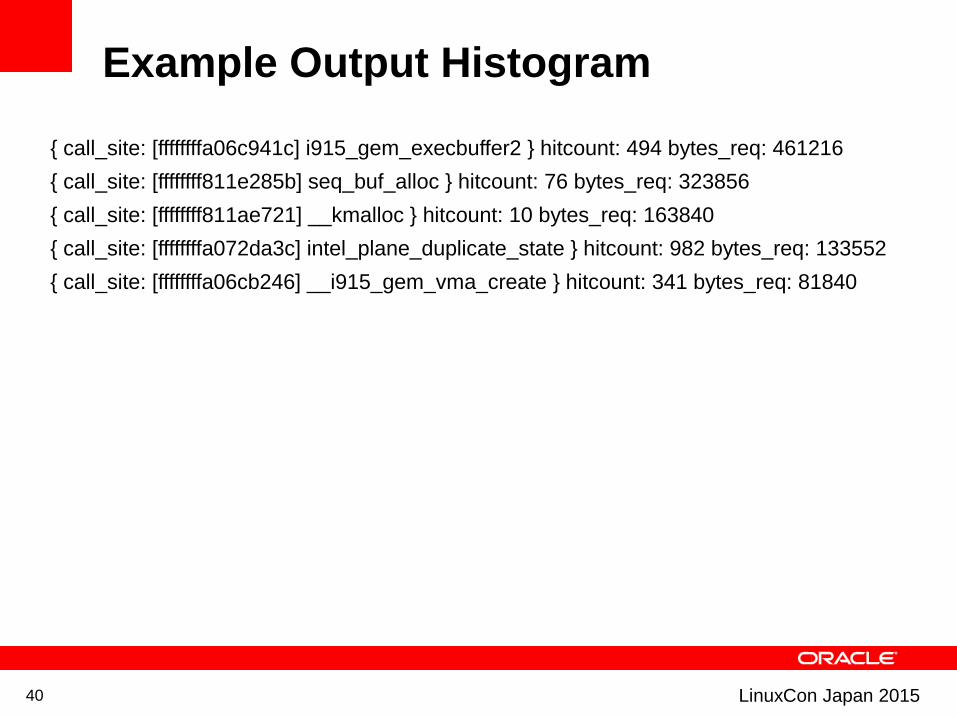
Example Output Histogram
{ call_site: [ffffffffa06c941c] i915_gem_execbuffer2 } hitcount: 494 bytes_req: 461216
{ call_site: [ffffffff811e285b] seq_buf_alloc } hitcount: 76 bytes_req: 323856
{ call_site: [ffffffff811ae721] __kmalloc } hitcount: 10 bytes_req: 163840
{ call_site: [ffffffffa072da3c] intel_plane_duplicate_state } hitcount: 982 bytes_req: 133552
{ call_site: [ffffffffa06cb246] __i915_gem_vma_create } hitcount: 341 bytes_req: 81840
41 LinuxCon Japan 2015
eBPF vs. Other Features
• Can I do XYZ with eBPF ? • Different complexity levels• Which wins?
• Can eBPF be simpified? Load, parse sections, etc?

42 LinuxCon Japan 2015
Thanks!!Questions??